More Is Less:
When Do Recommenders Underperform for Data-rich Users?
Abstract.
Users of recommender systems tend to differ in their level of interaction with these algorithms, which may affect the quality of recommendations they receive and lead to undesirable performance disparity. In this paper we investigate under what conditions the performance for data-rich and data-poor users diverges for a collection of popular evaluation metrics applied to ten benchmark datasets. We find that Precision is consistently higher for data-rich users across all the datasets; Mean Average Precision is comparable across user groups but its variance is large; Recall yields a counter-intuitive result where the algorithm performs better for data-poor than for data-rich users, which bias is further exacerbated when negative item sampling is employed during evaluation. The final observation suggests that as users interact more with recommender systems, the quality of recommendations they receive degrades (when measured by Recall). Our insights clearly show the importance of an evaluation protocol and its influence on the reported results when studying recommender systems.
1. Introduction
When dealing with Recommender Systems (RSs) it is not only important to optimise their overall performance but also ensure that all users receive equally satisfactory experience. Assessing performance disparities across users is critical (Featherstone et al., 2022) in ensuring that the experience of individuals who rarely interact with the system is not overshadowed by the patterns identified for a small group of users who contribute a disproportionately large amount of interaction data used for model training.
Model performance can be evaluated from different perspectives by different metrics. The level of performance disparity across users depends on the employed metric. Some users may receive better performance than their peers when measured with one metric but worse with another. Inconsistency in reporting performance disparity can lead to a claim that inequality has been mitigated after modifying an algorithm, when in fact it is due to evaluation protocol manipulation. However, existing work on benchmark RS comparison does not justify the choice of evaluation metrics and criteria. The connection between metrics and performance disparities across user groups has rarely been studied.
In this work, we seek to determine if different evaluation metrics are systematically lower for certain groups of users, such as data-poor individuals who have had limited interactions with a RS. We are particularly interested in rank-unaware metrics such as Precision or Recall and rank-aware metrics such as Mean Average Precision (MAP). Since calculating these metrics is computationally expensive when ranking all items, a common strategy is to rank positive items only by placing them among a sampled subset of negative items. As sampled evaluation can adversely affect the behaviour of metrics (Krichene and Rendle, 2022; Cañamares and Castells, 2020), we also investigate if sampled evaluation distorts the disparity of Recall across user groups.
We split users into ten groups based on their number of interactions and evaluate the model performance for every user group with different metrics. We uncover that data-rich users with more interaction data receive higher Precision than data-poor users; MAP is more balanced across the groups but its variance is large for users within each group (Section 3.1). We further observe a counter-intuitive disparity in Recall where data-poor users enjoy better recommendations than data-rich users (Section 3.2). This outcome is deepened when performance is evaluated under Recall with negative item sampling (Section 3.3). Our study focuses on evaluation set-ups (Section 4) and offers a complementary perspective to the findings reported by Ji et al. (2022), who attributed the counter-intuitive disparity to ignoring interaction time in train–test split.
Our core finding suggests that as data-poor users become data-rich over time, some performance metrics may gradually degrade. We therefore call for extra care when choosing evaluation metrics and protocols, and reporting performance results.
2. Methodology
Before presenting our analysis of evaluation metrics and performance disparities (Section 3), we describe the set-up of our study.
2.1. Datasets
We analyse ten benchmark datasets with their details summarised in Table 1. Let , , denote the set of users, items, and interactions in a dataset respectively. Density of a dataset is defined as . -core filtering is applied to recursively exclude users and items with less than associated interactions, as generating recommendations for cold-start users is a problem in itself (Sun et al., 2020). We do not pre-process the MovieLens datasets because they have been pre-filtered. We binarise all the rated items as positive and unrated items as negative for each user. Item recommendation is therefore learnt from implicit feedback. and respectively represent the set of positive and negative items in the test set of user .
| Dataset | Density | |||
|---|---|---|---|---|
| MovieLens (ML) 1M (Harper and Konstan, 2015) | 6,040 | 3,706 | 1,000,209 | 4.47% |
| MovieLens 10M (Harper and Konstan, 2015) | 69,878 | 10,677 | 10,000,054 | 1.34% |
| Amazon Beauty (He and McAuley, 2016) | 22,363 | 12,101 | 198,502 | 0.07% |
| Amazon Grocery (He and McAuley, 2016) | 14,681 | 8,713 | 151,254 | 0.12% |
| Amazon Health (He and McAuley, 2016) | 38,609 | 18,534 | 346,355 | 0.05% |
| Amazon Electronics (He and McAuley, 2016) | 136,027 | 49,202 | 2,264,349 | 0.03% |
| Amazon Music (He and McAuley, 2016) | 12,394 | 9,917 | 123,701 | 0.10% |
| Book Crossing (Ziegler et al., 2005) | 15,798 | 38,093 | 585,579 | 0.10% |
| Pinterest (Geng et al., 2015) | 55,187 | 9,916 | 1,463,581 | 0.27% |
| Yelp (Inc., 2018) | 213,170 | 94,304 | 3,277,931 | 0.02% |
2.2. Recommender Models
We investigate the performance of six representative recommendation algorithms: Item-based -nearest neighbours (ItemKNN) (Sarwar et al., 2001), Bayesian Personalised Ranking (BPR) (Rendle et al., 2012), Multi-Variational Autoencoder (Mult-VAE) (Liang et al., 2018), Neural Matrix Factorization (NeuMF) (He et al., 2017), Light Graph Convolution Network (LightGCN) (He et al., 2020) and ADMMSLIM (Steck et al., 2020). We use RecBole (Zhao et al., 2021), an open-source RS library, to ensure reproducibility of our study. Our objective is to assess the impact of evaluation metrics on performance disparity across user groups, hence the findings carry over to other model implementations. We use the default model configurations and check that the trained models perform comparatively.
2.3. Experiment Set-up
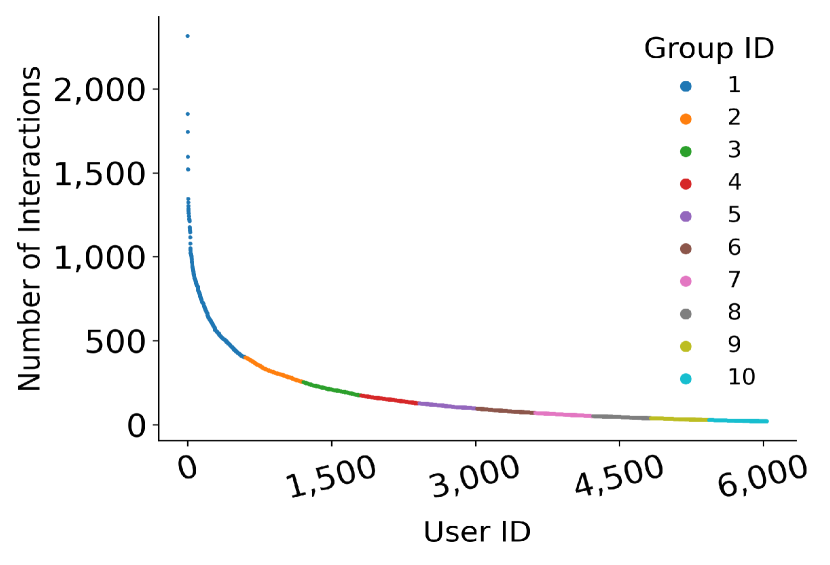
We apply six models to each dataset and aggregate the performance evaluated under different metrics for every user group. We use a stratified 80-20 train–test split on each individual so that every user has positive interactions allocated to their test sets. The number of positive interactions serves as an indicator of a user’s data richness. A higher interaction level contributes to a more accurate user preference modelling and subsequently better recommendation performance (Li et al., 2021). To effectively differentiate an individual’s data richness, we split users into groups based on this indicator. Each group has equal number of users. Group 1 contains (data-rich) users with the highest level of interaction, whereas group 10 contains (data-poor) users with the fewest interactions. User grouping for the ML 1M dataset is shown in Figure 2 as an illustration. All of the 10 datasets possess a similar long-tail distribution where a minority of data-rich users contribute the bulk of interactions.
3. Evaluation Metrics
Top- recommendation can be formulated as a ranking task and evaluated under rank-oriented metrics on a model’s ability to correctly rank top-most items (Rendle, 2022). We examine the cross-group disparity in performance evaluated by three representative metrics: Precision, Mean Average Precision and Recall. We start by formalising the evaluation protocol. Given that each user has a pool of test items to be recommended, a model predicts a ranked list of items that may favour. The list captures positions of recommended items that are positive instances in the test set. For example, means that a model returns 2 hits for by ranking them at position 3 and 13 respectively. can be truncated at a fixed depth , denoted as . () would be from the aforementioned example.
3.1. Precision and Mean Average Precision
During evaluation, a metric is used to translate into a single value , representing the quality of the recommendation for . We classify metrics as rank-aware and rank-unaware; the former is sensitive to different rankings of the same set of recommended items whereas the latter only takes into account the number of hits in . An example of a rank-unaware metric is Precision – – which simply measures the proportion of hits among the top- recommendation list. In contrast, Mean Average Precision (MAP) is a rank-aware metric that measures Precision at ranks of hits up to depth (Krichene and Rendle, 2022):
MAP is also a rank-discounting metric that imposes a linearly decreasing weight on Precision measured at each hit position.
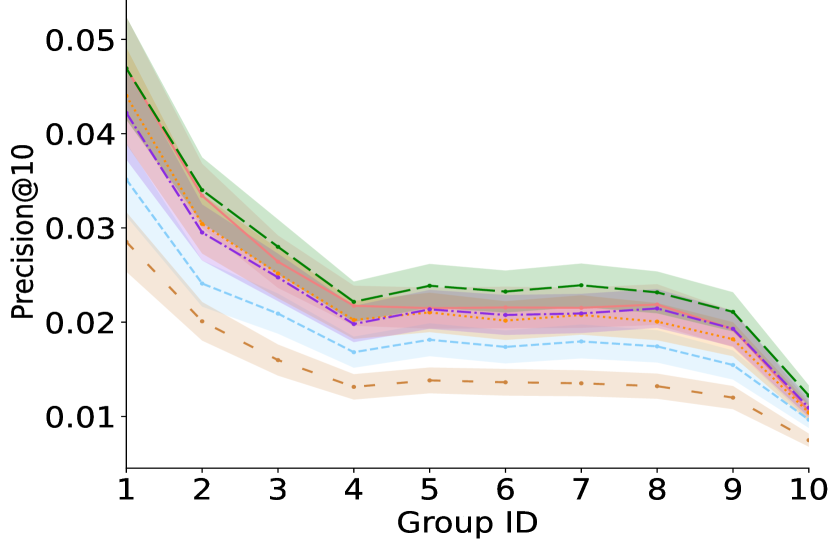
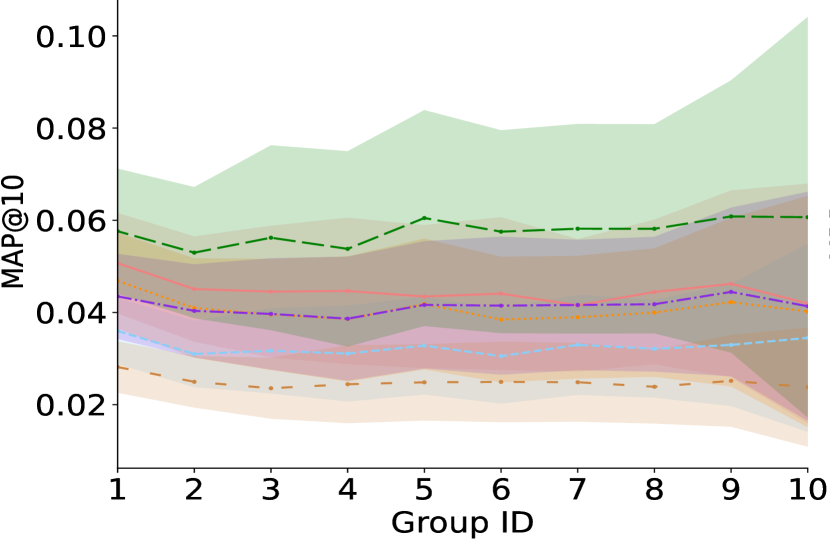
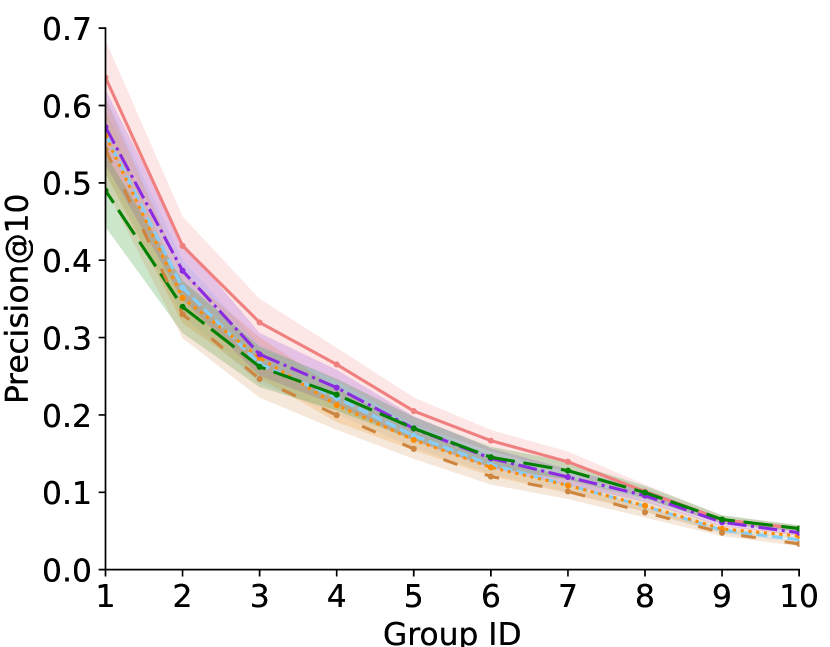
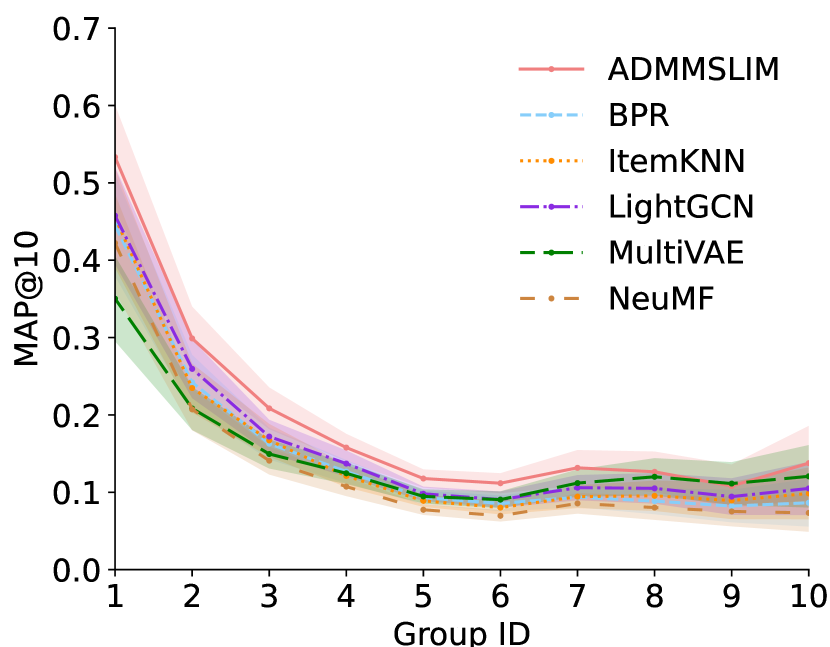
Figure 2(a) depicts cross-group performance under Precision for Pinterest; the metric differs noticeably between data-rich and data-poor users. Users from group 1 (data-rich) enjoy the highest Precision, whereas group 10 users (data-poor) receive the lowest Precision. Overall, group Precision decreases as the users’ richness of data diminishes. The cross-group performance difference on MAP – shown in Figure 2(b) – does not follow this pattern. Even though the calculation of MAP takes into account Precision, once it is discounted at hit positions, MAP becomes more balanced across user groups. We hypothesise that rank-discounting causes the metric to lose its ability to discriminate cross-group model performance. The value of metrics without such discriminative power is more likely to be comparable across users. The difference in average MAP across user groups is small, but the variance for users within the same group is large. Larger MAP variance is more often observed for groups containing data-poor users.
The behaviour of rank-unaware Precision and rank-aware MAP generalises to all the datasets in Table 1 except for ML 1M and ML 10M. We discuss the general findings on Pinterest as an illustration111The complete set of experimental results including performance on additional metrics – Hit Rate (HR) and normalised Discounted Cumulative Gain (nDCG) – is available at https://anonymous.4open.science/r/recsys_bias. Only metrics where statistically significant findings can be observed are discussed in this paper.; we explain the uniqueness of the ML datasets below. As shown in Figure 3, both Precision and MAP change noticeably across user groups with small within-group variance. In this case, MAP is still capable of differentiating unbalanced performance, where data-rich users receive a noticeably better metric value. We find that the ML datasets are denser – the average level of interactions for each user group and over the entire dataset are higher than for other datasets. The aggregate performance for the ML datasets is also higher compared with more sparse datasets (Chin et al., 2022). We hypothesise that the variance of MAP is larger for user groups where recommenders generally underperform.
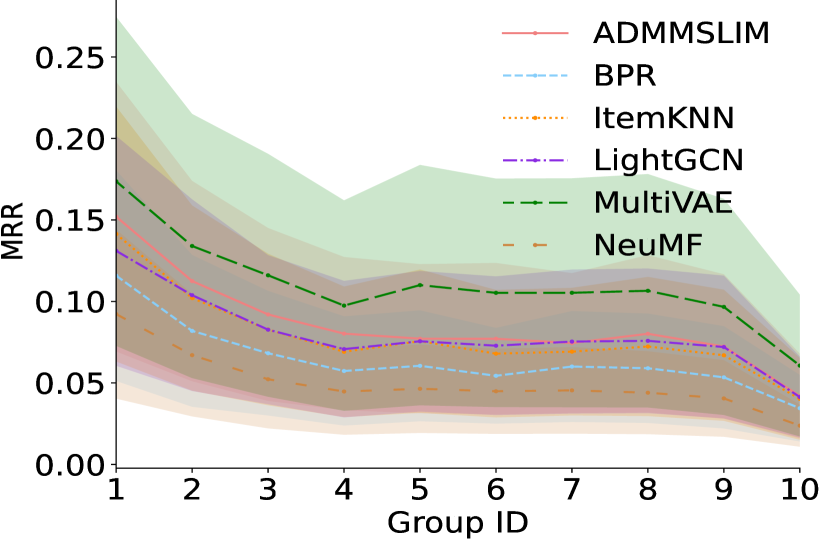
We use another metric called Mean Reciprocal Rank (MRR) to better understand the larger MAP variance for data-poor users. MRR is computed as the reciprocal rank of the first hit in the complete recommendation list . A value of 0.1 communicates that the first hit is ranked at the 10th position; 0.05 indicates the first hit at the 20th position. Figure 2(c) shows that a majority of users in Pinterest receive MRR that is lower than 0.1, hence for most users all models fail to rank the first hit within . A tiny performance improvement for one user can therefore lead to a hit being included in and consequently a large variance in the performance measured for that user group. When users have already received good performance and their contains a hit, a small improvement in ranking may have less effect on the variance.
Both Precision and MAP are higher for data-rich than data-poor users, although the degree of disparity varies across datasets. These cross-group disparities in metric values are intuitive because accurate user-preference modelling relies on sufficient user–item interactions captured by training data. The difference in Precision across user groups is clearly visible; the difference in MAP is small across groups but within-group variance is large as models struggle to perform well on sparse datasets.
3.2. Recall
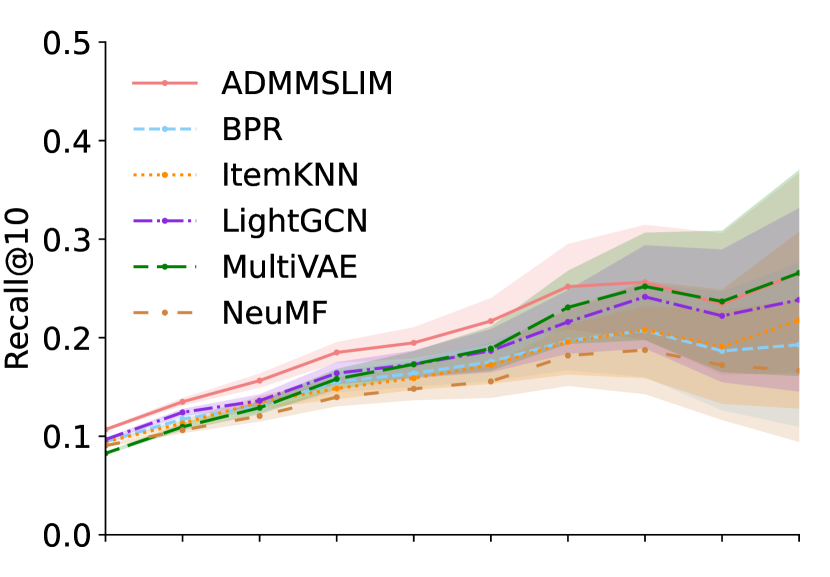
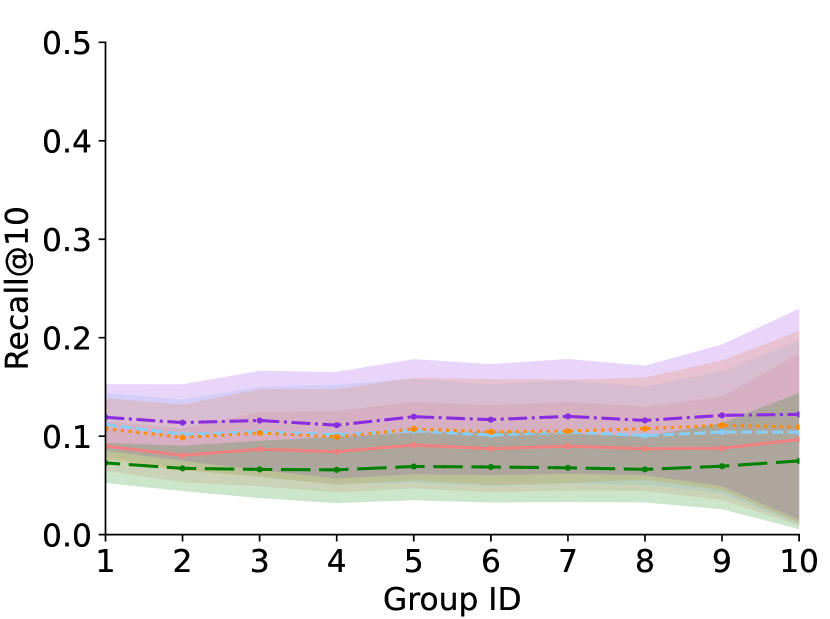
Similar to Precision, Recall is a rank-unaware metric that only accounts for the number of hits in . We report the cross-group performance under Recall on ML 1M and Pinterest as representatives for the following empirical analysis. In Figure 4(a), data-rich users in ML 1M receive lower Recall than their data-poor peers. This is counter-intuitive and contradictory to performance disparities discussed in Section 3.1. Although performance bias for Pinterest when measured with Recall – see Figure 4(c) – is less pronounced than in the case of Precision – see Figure 2(a) – the Recall trajectory implies that data-poor users enjoy more improvement in performance.
This counter-intuitive performance disparity where data-poor users are better off under Recall is due to its formulation. Recall measures the fraction of hits captured in out of all positive items present in the test set: . The numerator is bound to the number of hits in top- recommendations and is capped at ; the denominator is unbounded and in the extreme it approaches the size of the entire item set . Data-rich users are disadvantaged because their large number of interactions counts towards the denominator at the same time as models struggle to make extra hits that contribute to an increase in the numerator.
3.3. Exact vs Sampled Recall
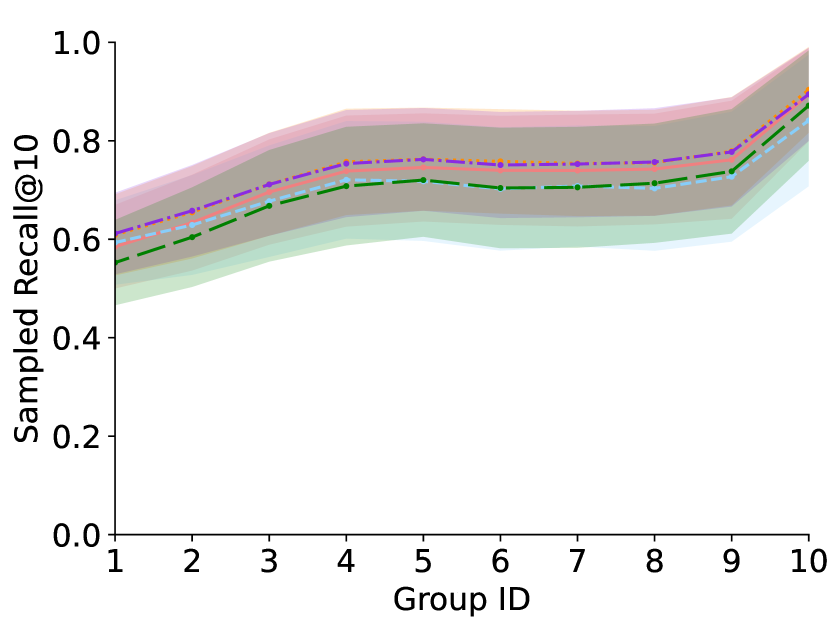
All the metrics we have discussed so far evaluate performance based upon models’ predicted ranking over all items in a test set. Ranking all items is computationally expensive when the test set is large. It is common to sample a small subset of negative items and rank positive items only among this subset (Krichene and Rendle, 2022). Given that the counter-intuitive performance bias is observed on Recall under the aforementioned full evaluation set-up, we are interested in cross-group Recall when negative item sampling is employed. For clarity, we hereafter refer to Recall without negative sampling as exact Recall, and Recall with negative sampling as sampled Recall. We investigate if cross-group performance disparities under sampled Recall differ from performance evaluated under exact Recall.
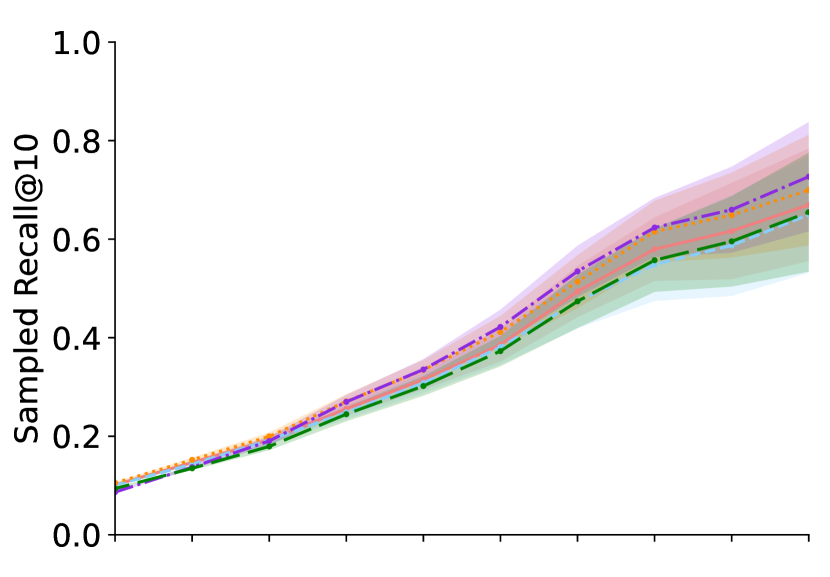
Figure 4 compares performance under exact and sampled Recall. For Pinterest, sampled Recall is noticeably higher for data-poor than data-rich users (Figure 4(d)) compared to balanced cross-group performance under exact Recall (Figure 4(c)). For ML 1M, we have already discussed the performance disparity under exact Recall (Figure 4(a), Section 3.2), which effect is exacerbated under sampled Recall where data-poor users enjoy better performance (Figure 4(b)).
Among all the viable causes for the widened performance gap across user groups under sampled Recall, we focus on the varying proportion of positive items in the test set with and without negative sampling during evaluation. Under negative item sampling, we pair each positive item with randomly sampled negative items (we set ). The ratio of positive and negative items in the test set is, in principle, the same for all users. The size of sampled negative item set and the test set size under negative sampling is . We define the fraction of positive items over the target item set as the Relevance Density . In the context of negative item sampling, the Relevance Density becomes .
The difference between and is disproportionate across users who have different degrees of interaction. is expected to be larger than for the majority of users who are data-poor, which corresponds to the motivation of negative sampling to reduce computational cost. The difference is expected to be less pronounced for data-rich users; because their is large, can exceed in which case . As a result, data-poor users are advantaged by a relatively larger increase in relevance density, which they would otherwise lack under full evaluation. Data-rich users lose the advantage of their abundance of data, i.e., the high proportion of positive items in their test set.
Changes in and affect the reported value of exact and sampled Recall. Since only negative items are sampled during evaluation, the test set preserves all of the user’s positive items. The denominator of Recall – the number of positive items – is the same for exact and sampled Recall, but its numerator () is different for these two scenarios. is likely to contain more hits when this list is derived from a test set with denser relevance. Data-poor users get a larger increase in the numerator of sampled Recall because their increase in relevance density is bigger than for data-rich users, meaning that they receive higher Recall under negative sampling.
Employing negative sampling during evaluation changes the relevance density of test sets. It exacerbates the counter-intuitive performance bias for Recall. Consequently, as data-poor users have more interactions with a RS and become data-rich, they are likely to receive degraded performance over time.
4. Discussion
A similar study by Ji et al. (2022) reports that data-rich users receive worse average performance than data-poor users. The authors suggest that counter-intuitive biases occur when training and test sets are not split based on the timeline of user–item interactions. We expand their experiments to more datasets and evaluation set-ups. We examine both average performance across user groups and performance variance for users within a group under multiple metrics.
We explain the counter-intuitive finding from a different perspective – the evaluation metric choice. We show that the presence of performance bias against data-rich users depends on the metric chosen to evaluate performance; specifically, it can only be consistently observed across all datasets for exact and sampled Recall. We suggest that variations in evaluation set-ups lead to contradictory conclusions on cross-group performance bias.
5. Related Work
Rank-oriented evaluation metrics are commonly used for assessing RS performance on datasets at an aggregate level (Herlocker et al., 2004). But different metrics lead to different performance rankings of recommendation algorithms (Zhao et al., 2022; Sun et al., 2020). Metrics also differ in discriminative powers and robustness to incompleteness (Valcarce et al., 2018). Bellogín et al. (2017) identify the sparsity and popularity biases because of the adoption of rank-oriented metrics to recommendation tasks. The impact of different evaluation metrics on performance disparity across user groups within a dataset – as studied here – is rarely considered.
Impact of negative item sampling during evaluation has been examined in the literature (Krichene and Rendle, 2022; Cañamares and Castells, 2020; Li et al., 2020). Krichene and Rendle (2022) find that most sampled metrics distort the comparison of RS performance across datasets. Insufficient negative sampling ratio results in loss of informativeness and discriminative power of metrics (Cañamares and Castells, 2020). While we investigate if cross-user performance is identical under exact and sampled metrics, such studies are generally lacking.
6. Conclusion and Future Work
The choice of evaluation metric influences the performance disparity across user groups. Precision is consistently higher for data-rich users across all datasets; Mean Average Precision is comparable across user groups, indicating a loss of the metric’s discriminative power to identify potential cross-group performance biases; the cross-group disparity in Recall is counter-intuitive since data-rich users receive worse performance than data-poor users, which effect is further exacerbated under negative item sampling during evaluation. In view of these findings, we suggest that researchers and practitioners ought to pay particular attention to the impact of exact and sampled Recall on experiments that study performance biases. In future work, we plan to experiment with different truncation depths of metrics and negative sample ratios in evaluation.
Acknowledgements
This research was conducted by the ARC Centre of Excellence for Automated Decision-Making and Society, and funded by the Australian Government through the Australian Research Council (project number CE200100005). The authors would like to thank Aaron Snoswell for his valuable feedback.
References
- (1)
- Bellogín et al. (2017) Alejandro Bellogín, Pablo Castells, and Iván Cantador. 2017. Statistical biases in information retrieval metrics for recommender systems. Information Retrieval Journal 20, 6 (2017), 606–634.
- Cañamares and Castells (2020) Rocío Cañamares and Pablo Castells. 2020. On target item sampling in offline recommender system evaluation. In Fourteenth ACM Conference on Recommender Systems. 259–268.
- Chin et al. (2022) Jin Yao Chin, Yile Chen, and Gao Cong. 2022. The Datasets Dilemma: How Much Do We Really Know About Recommendation Datasets?. In Proceedings of the Fifteenth ACM International Conference on Web Search and Data Mining. 141–149.
- Featherstone et al. (2022) Daniel Featherstone, Julian Thomas, Indigo Holcombe-James, Lyndon Ormond-Parker, and Jenny Kennedy. 2022. Mapping the digital gap-background paper: Project objectives, context and methods. Technical Report. ARC Centre of Excellence for Automated Decision-Making and Society.
- Geng et al. (2015) Xue Geng, Hanwang Zhang, Jingwen Bian, and Tat-Seng Chua. 2015. Learning image and user features for recommendation in social networks. In Proceedings of the IEEE International Conference on Computer Vision. 4274–4282.
- Harper and Konstan (2015) F Maxwell Harper and Joseph A Konstan. 2015. The movielens datasets: History and context. ACM Transactions on Interactive Intelligent Systems (TIIS) 5, 4 (2015), 1–19.
- He and McAuley (2016) Ruining He and Julian McAuley. 2016. Ups and downs: Modeling the visual evolution of fashion trends with one-class collaborative filtering. In Proceedings of the 25th International Conference on World Wide Web. 507–517.
- He et al. (2020) Xiangnan He, Kuan Deng, Xiang Wang, Yan Li, Yongdong Zhang, and Meng Wang. 2020. Lightgcn: Simplifying and powering graph convolution network for recommendation. In Proceedings of the 43rd International ACM SIGIR conference on research and development in Information Retrieval. 639–648.
- He et al. (2017) Xiangnan He, Lizi Liao, Hanwang Zhang, Liqiang Nie, Xia Hu, and Tat-Seng Chua. 2017. Neural collaborative filtering. In Proceedings of the 26th International Conference on World Wide Web. 173–182.
- Herlocker et al. (2004) Jonathan L Herlocker, Joseph A Konstan, Loren G Terveen, and John T Riedl. 2004. Evaluating collaborative filtering recommender systems. ACM Transactions on Information Systems (TOIS) 22, 1 (2004), 5–53.
- Inc. (2018) Yelp Inc. 2018. Yelp open dataset. https://www.yelp.com/dataset
- Ji et al. (2022) Yitong Ji, Aixin Sun, Jie Zhang, and Chenliang Li. 2022. Do Loyal Users Enjoy Better Recommendations? Understanding Recommender Accuracy from a Time Perspective. In Proceedings of the 2022 ACM SIGIR International Conference on Theory of Information Retrieval. 92–97.
- Krichene and Rendle (2022) Walid Krichene and Steffen Rendle. 2022. On sampled metrics for item recommendation. Commun. ACM 65, 7 (2022), 75–83.
- Li et al. (2020) Dong Li, Ruoming Jin, Jing Gao, and Zhi Liu. 2020. On sampling top-k recommendation evaluation. In Proceedings of the 26th ACM SIGKDD International Conference on Knowledge Discovery & Data Mining. 2114–2124.
- Li et al. (2021) Yunqi Li, Hanxiong Chen, Zuohui Fu, Yingqiang Ge, and Yongfeng Zhang. 2021. User-oriented fairness in recommendation. In Proceedings of the Web Conference 2021. 624–632.
- Liang et al. (2018) Dawen Liang, Rahul G Krishnan, Matthew D Hoffman, and Tony Jebara. 2018. Variational autoencoders for collaborative filtering. In Proceedings of the 2018 World Wide Web Conference. 689–698.
- Rendle (2022) Steffen Rendle. 2022. Item recommendation from implicit feedback. In Recommender Systems Handbook. Springer, 143–171.
- Rendle et al. (2012) Steffen Rendle, Christoph Freudenthaler, Zeno Gantner, and Lars Schmidt-Thieme. 2012. BPR: Bayesian personalized ranking from implicit feedback. (2012). arXiv:1205.2618
- Sarwar et al. (2001) Badrul Sarwar, George Karypis, Joseph Konstan, and John Riedl. 2001. Item-based collaborative filtering recommendation algorithms. In Proceedings of the 10th International Conference on World Wide Web. 285–295.
- Steck et al. (2020) Harald Steck, Maria Dimakopoulou, Nickolai Riabov, and Tony Jebara. 2020. ADMM SLIM: Sparse recommendations for many users. In Proceedings of the 13th International Conference on Web Search and Data Mining. 555–563.
- Sun et al. (2020) Zhu Sun, Di Yu, Hui Fang, Jie Yang, Xinghua Qu, Jie Zhang, and Cong Geng. 2020. Are we evaluating rigorously? Benchmarking recommendation for reproducible evaluation and fair comparison. In Fourteenth ACM Conference on Recommender Systems. 23–32.
- Valcarce et al. (2018) Daniel Valcarce, Alejandro Bellogín, Javier Parapar, and Pablo Castells. 2018. On the robustness and discriminative power of information retrieval metrics for top-N recommendation. In Proceedings of the 12th ACM conference on recommender systems. 260–268.
- Zhao et al. (2022) Wayne Xin Zhao, Zihan Lin, Zhichao Feng, Pengfei Wang, and Ji-Rong Wen. 2022. A revisiting study of appropriate offline evaluation for top-N recommendation algorithms. ACM Transactions on Information Systems (TOIS) (2022).
- Zhao et al. (2021) Wayne Xin Zhao, Shanlei Mu, Yupeng Hou, Zihan Lin, Yushuo Chen, Xingyu Pan, Kaiyuan Li, Yujie Lu, Hui Wang, Changxin Tian, et al. 2021. Recbole: Towards a unified, comprehensive and efficient framework for recommendation algorithms. In Proceedings of the 30th ACM International Conference on Information & Knowledge Management. 4653–4664.
- Ziegler et al. (2005) Cai-Nicolas Ziegler, Sean M McNee, Joseph A Konstan, and Georg Lausen. 2005. Improving recommendation lists through topic diversification. In Proceedings of the 14th International Conference on World Wide Web. 22–32.