A Near-Infrared Faint, Far-Infrared-Luminous Dusty Galaxy at in COSMOS-Web
Abstract
A growing number of far-infrared bright sources completely invisible in deep extragalactic optical surveys hint at an elusive population of dusty, star-forming galaxies. Cycle 1 JWST surveys are now detecting their rest-frame optical light, which provides key insight into their stellar properties and statistical constraints on the population as a whole. This work presents the JWST/NIRCam counterpart from the COSMOS-Web survey to a far-infrared SCUBA-2 and ALMA source, AzTECC71, which was previously undetected at wavelengths shorter than 850 µm. AzTECC71, amongst the reddest galaxies in COSMOS-Web with , is undetected in NIRCam/F150W and F115W and fainter in F444W than other sub-millimeter galaxies identified in COSMOS-Web by magnitudes. This is consistent with the system having both a lower stellar mass and higher redshift than the median dusty, star-forming galaxy. With deep ground- and space-based upper limits combined with detections in F277W, F444W and the far-IR including ALMA Band 6, we find a high probability (99%) that AzTECC71 is at with . This galaxy is massive () and IR-luminous (), comparable to other optically-undetected but far-IR bright dusty, star-forming galaxies at . This population of luminous, infrared galaxies at is largely unconstrained but comprises an important bridge between the most extreme dust-obscured galaxies and more typical high-redshift star-forming galaxies. If further far-IR-selected galaxies that drop out of the F150W filter in COSMOS-Web have redshifts like AzTECC71, then the volume density of such sources may be greater than previously estimated.
1 Introduction
Infrared-bright galaxies have eluded optical detection since the first blind surveys at sub-millimeter (mm) wavelengths. Indeed, uncovering the optical counterpart to the first source ever discovered in an un-biased extragalactic survey at 850µm, HDF850.1 (Hughes et al., 1998), spanned a 16-year long debate (e.g., Dunlop et al., 2004; Cowie et al., 2009; Walter et al., 2012; Serjeant & Marchetti, 2014). While deep optical/near-infrared imaging surveys have since significantly improved the detection rate of far-IR-bright galaxies, there is evidence that of all sources in blind sub-mm surveys of extragalactic legacy fields have no counterpart at shorter wavelengths than Spitzer/IRAC 3.6µm (Wardlow et al., 2011; Simpson et al., 2014; Casey et al., 2014; Franco et al., 2018). The number densities of these sources and their contributions to the cosmic star-formation rate density at have been largely unconstrained, which may substantially alter our view of early star formation based on UV-bright Lyman-break galaxies (e.g., Madau & Dickinson, 2014; Novak et al., 2017; Liu et al., 2018; Gruppioni et al., 2020; Zavala et al., 2021; Algera et al., 2023).
The redshift distributions of optically-faint and far-infrared bright galaxies, particularly at , represent a key uncertainty towards assessing the prevalance of dust-obscured star-formation at early times as well as the evolutionary role occupied by dusty galaxies. For instance, Long et al. (2022) show how recent number densities of dusty star-forming and quiescent galaxies broadly agree with the former as progenitors of the latter (e.g., Toft et al., 2014; Valentino et al., 2020). However, as reviewed in Long et al. (2022), dusty star-forming galaxy number counts above exhibit over 2 orders of magnitude in dispersion due to differences in area and wavelength coverage that produce drastically different levels of completeness in stellar mass, redshift, and volume; a more firm measurement on the prevalence of these sources at will constrain quenching timescales/mechanisms in the first 2 Gyr of the Universe (Hayward et al., 2021). Casey et al. (2021) leverage the selection function of deep 2mm observations (RMS) to filter out most dusty star-forming galaxies, and find that directly detected 2mm-sources contribute 25% of the star-formation rate density at and 10% by . Similarly, the ALPINE (Le Fèvre et al., 2020; Béthermin et al., 2020; Faisst et al., 2020b) and REBELS (Bouwens et al., 2022) surveys find a large number of “optically-dark” sources at and , respectively, suggesting their significant contribution to the star-formation rate density (Gruppioni et al., 2020; Talia et al., 2021; Fudamoto et al., 2021). At this epoch Barrufet et al. (2022) and Rodighiero et al. (2023) argue that a population of moderately obscured (), red and very faint JWST sources may contribute more to the star-formation rate density than previously thought (see also Pérez-González et al. 2022), but these samples lack the far-infrared data to directly constrain obscured star-formation. Naturally, a multi-wavelength approach to finding and measuring properties of dusty galaxies at is needed (e.g., Zavala et al., 2023).
While faint or undetected optical/near-IR photometry makes measuring stellar properties difficult in far-infrared bright galaxies, the limiting sub-mm spatial resolution poses an equal challenge in terms of counterpart identification. SCUBA-2 has been a powerful instrument for surveying wide fields in the sub-mm (e.g., Casey, Narayanan, & Cooray, 2014), but its resolution ( kpc at ) at 850µm allows for many possible optical counterparts within a given sub-mm source (e.g., Liu et al., 2018; Jin et al., 2018). ALMA and/or deep VLA imaging at high spatial resolution are critical for assigning far-IR emission to optical/near-IR counterparts (e.g., Simpson et al., 2015; Zavala et al., 2018). Working towards a better understanding of multi-wavelength counterpart selection in the era of large JWST extragalactic fields coincident with sub-mm surveys, we present our analysis on the selection of optically-faint far-infrared bright galaxies and comment on the nature of one exceptional source at with no prior non-JWST counterpart below µm. Large area and deep JWST surveys such as COSMOS-Web (Casey et al., 2023) will have the potential to uncover many of these “optically-faint” sources and allow us to study their redshift distribution and physical properties.
In this paper we present the JWST/NIRCam detection of AzTECC71, a known far-infrared/sub-millimeter-only source (Brisbin et al., 2017; Simpson et al., 2019). We discuss the multi-wavelength associations and photometry in Section 2, and spectral energy distribution fits to the data in Section 3. In Section 4 we discuss the nature of this source and implications for star-forming galaxy volume densities. Section 5 summarizes the main conclusions. Throughout this work we adopt a CDM cosmology with , and . We use a Chabrier initial mass function (IMF).
2 Data and Selection
2.1 Searching for near-infrared counterparts to sub-mm sources in COSMOS-Web
Large area JWST surveys are well-suited to uncovering the rest-frame optical emission originating from the intrinsically rare population of high-redshift dusty, star-forming galaxies that are far-IR/sub-mm bright (Casey, Narayanan, & Cooray, 2014; Hodge & da Cunha, 2020). In this work, we search for ALMA counterparts to SCUBA-2 850µm sources with signal-to-noise ratios (SNR) greater than 4 from S2COSMOS (Simpson et al., 2019) within the COSMOS-Web January 2023 mosaic (Franco et al., in prep., Casey et al. 2023). Upon completion, COSMOS-Web will map a contiguous 0.54 deg2 area within the COSMOS Survey (Scoville et al., 2007) in four JWST/NIRCam bands (F115W, F150W, F277W, F444W) and a non-contiguous 0.19 deg2 area in MIRI/F770W. The January 2023 data includes six visits covering just 4% ( arcmin2) of the total COSMOS-Web area.
The data reduction of COSMOS-Web will be described in full in M. Franco et al., in prep. In summary, we reduce the JWST/NIRCam data with the JWST Calibration Pipeline version 1.8.3 with modifications for background and noise subtraction following other JWST extragalactic programs (e.g., Bagley et al., 2022; Finkelstein et al., 2022). We use version 0989 of the Calibration Reference Data System111jwst-crds.stsci.edu. The final mosaics have a resolution of /pixel, and have been aligned to COSMOS2020 which in turn has been aligned to Gaia-EDR3 (Weaver et al., 2022). See Casey et al. (2023) for depths in each of the four COSMOS-Web NIRCam filters.
Far-IR interferometric observations of the dust continuum emission are critical for a robust optical/near-IR counterpart identification to the low-resolution sub-mm SCUBA-2 data. The JWST counterparts and general properties of a larger ALMA/sub-mm selected sample from COSMOS-Web will be discussed in a future work (Manning et al., in prep). In this study we present the analysis of the faintest NIRCam/F444W sub-mm source in our catalog, AzTECC71.
AzTECC71 was originally detected at 1.1 and 1.2 mm in the AzTEC/ASTE and MAMBO/IRAM 30m maps of the COSMOS field but its redshift was unknown due to lack of detections in the optical (Aretxaga et al., 2011; Bertoldi et al., 2007). It is detected at 850µm by SCUBA-2 (Simpson et al., 2019), but not at 450µm (e.g., Casey et al., 2013; Geach et al., 2017; Lim et al., 2020). Brisbin et al. (2017) conducted an ALMA Band 6 (1250µm) follow-up survey of bright SCUBA-2 sources in COSMOS, and report a detection for AzTECC71 at RA, DEC = 9h59m52.95s, 2d18m49.13s from program 2013.1.00118.S (PI: M. Aravena), coincident with a NIRCam/F444W source in COSMOS-Web. Prior to the identification of its NIRCam/F444W counterpart AzTECC71 had no reported detection below 850µm including data from HST and Spitzer. As there are no other optical/near-IR counterparts within 1′′ of the ALMA detection, AzTECC71 is not in the COSMOS2020 catalog (Weaver et al., 2022). AzTECC71 will not be covered by COSMOS-Web’s MIRI mosaic.
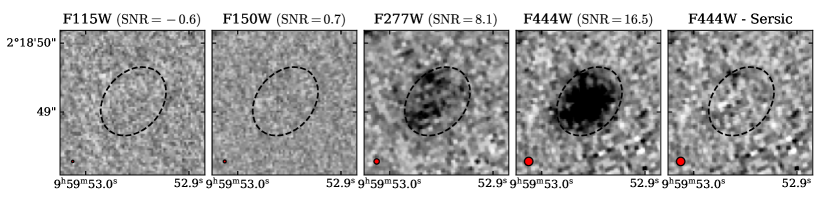
Figure 1 shows AzTECC71’s JWST/NIRCam counterpart from COSMOS-Web (Franco et al., in prep., Casey et al. 2023). The galaxy is detected in F277W and F444W but shows no detection in NIRCam’s F115W and F150W bands with respective depths of 27.45 and 27.66 AB magnitudes. From a PSF-convolved 2D Sersic surface brightness profile fit to the F444W map (Fig. 1 right), AzTECC71 has a half-light radius () of at 4.44µm, and a Sersic index () of . Errors on and are bootstrapped from 1000 perturbations of the F444W map with noise drawn from the background pixel flux distribution within 4′′ of AzTECC71. We use the strong F444W detection to refine upper limits from the ground- and space-based imaging data, as described in the next section.
2.2 Optical/Near-IR Photometry
AzTECC71 shows an extended F444W morphology (Fig. 1); Therefore, we measure photometry and upper limits using an elliptical aperture constructed to match the source morphology in F444W with a semi-major axis of , an axis ratio of , and a position angle of N of W. The semi-major/minor axes are greater than from the 2D Sersic fits and encase the extent of pixels in the F444W map (Fig. 1). We sum all pixels within the ellipse when calculating flux densities, and emphasize that this is not model-based photometry. AzTECC71 is detected at a SNR of in F444W () and in F277W (). The galaxy is not detected in either of the other COSMOS-Web JWST/NIRCam bands (F115W, F150W) nor any other optical/near-IR imaging in COSMOS. We calculate upper limits from these non-detections by summing the corresponding pixels within the elliptical aperture. Then we apply aperture corrections to account for PSF variations by computing the fraction of each lower resolution PSF that falls outside of our elliptical aperture shown on Figure 1. This is most relevant for the ground-based data in which the source would be unresolved. For the ground-based data, we adopt the PSFs used in the COSMOS2020 catalog (Weaver et al., 2022). The aperture corrections to lower-resolution ground-based imaging range from , and is for HST/ACS (Koekemoer et al., 2007). Additionally, using our refined aperture we recover a detection in IRAC(4.5µm) where no detection was previously reported for lack of an optical/near-IR counterpart. JWST/NIRCam and updated flux densities and limits are listed in Table 1.
| Band | Unit | Flux | |
|---|---|---|---|
| CFHT- | 375 nm | nJy | |
| HSC- | 476 nm | nJy | |
| HSC- | 617 nm | nJy | |
| HSC- | 768 nm | nJy | |
| ACS/F814W | 814 nm | nJy | |
| HSC- | 891 nm | nJy | |
| HSC- | 976 nm | nJy | |
| UVISTA Y | 1.02 µm | Jy | |
| UVISTA J | 1.25 µm | Jy | |
| UVISTA H | 1.63 µm | Jy | |
| UVISTA Ks | 2.14 µm | Jy | |
| NIRCam/F115W | µm | nJy | |
| NIRCam/F150W | µm | nJy | |
| NIRCam/F277W | µm | nJy | |
| NIRCam/F444W | µm | nJy | |
| IRAC/Ch1 | µm | nJy | |
| IRAC/Ch2 | µm | nJy | |
| IRAC/Ch3 | µm | Jy | |
| IRAC/Ch4 | µm | Jy | ) |
| MIPSaafootnotemark: | 24 µm | Jy | () |
| PACSbbfootnotemark: | 100 µm | mJy | |
| PACSbbfootnotemark: | 160 µm | mJy | |
| SPIRE | 250 µm | mJy | () |
| SPIRE | 350 µm | mJy | ( |
| SCUBA-2 | 450 µm | mJy | |
| SPIRE | 500 µm | mJy | ( |
| SCUBA-2 | 850 µm | mJy | |
| AzTECccfootnotemark: | 1100 µm | mJy | |
| MAMBOddfootnotemark: | 1200 µm | mJy | |
| ALMA/B6 | 1250 µm | mJy | |
| ALMA/B4 | 2 mm | mJy | |
| VLA/3 GHz | 10 cm | Jy | () |
2.3 IR through radio data
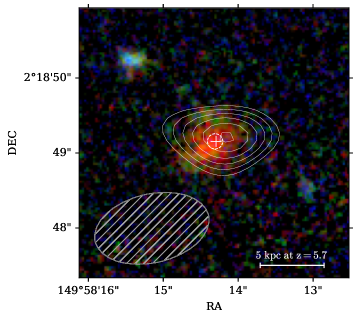
AzTECC71 is detected at: 850µm (SCUBA-2, Simpson et al. 2019), 1100µm (AzTEC/Aretxaga et al. 2011), 1200µm (MAMBO/Bertoldi et al. 2007), and 1250µm (ALMA B6/Brisbin et al. 2017) where the peak pixel flux within the elliptical aperture fit to the F444W map is the map noise. In the case of the ALMA Band 6 detection, we restore AzTECC71’s calibrated visibilities from Project 2013.1.00118.S (PI: Aravena) hosted in the ALMA archive. We image the data with tclean and naturally-weighted visibilities. The source is not spatially resolved by the synthesized beam, so the naturally-weighted image maximizes the SNR. We then calculate the peak flux density from the primary-beam-corrected image, listed in Table 1. We estimate the maximum size of the source in the Band 6 data from Equation 1 in Martí-Vidal et al. (2014), which limits the size to (consistent with the F444W radius, see Section 2.1). The ALMA Band 6 continuum detection is shown over an RGB image constructed from the NIRCam bands in Figure 2.
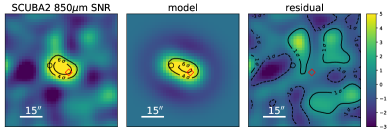
Two sub-mm sources are detected in the ALMA/B6 imaging of AzTECC71 at SNR, one coincident with the JWST/NIRCam imaging and another 15′′ away with a spectroscopic redshift of (AzTECC71b, Brisbin et al. 2017). Both sources contribute to blended sub-mm flux measured by the single-dish facilities, as is common for of all sub-millimeter galaixes (SMGs, mJy) (Chen et al., 2013; Koprowski et al., 2014; Michałowski et al., 2017; Hayward et al., 2013, 2018). The ALMA map provides secure positional priors for the origin of the sub-mm emission from each galaxy, so we deblend the SCUBA-2 flux densities by fitting point-source models fixed to the positions of each ALMA source. We use the SCUBA-2 PSF from Simpson et al. (2017). The results are shown in Figure 3 with the updated flux density for AzTECC71 listed in Table 1 at an SNR of . The relative contribution of AzTECC71 to the total blended SCUBA-2 flux density is . The FIR data at µm is beyond the SED peak for both AzTECC71 and the sub-mm source at so we scale AzTECC71’s AzTEC ( resolution) and MAMBO ( resolution) fluxes by this same factor. We do not apply this to the blended Herschel data which covers the SED peak of both sources, where differences in dust temperatures between the two will change the relative scaling band-to-band.
In the case of non-detections in the mid- and far-IR, we set the flux density to that of the pixel containing our target and adopt the RMS derived for the total mosaic as the uncertainty. In the case of Herschel/SPIRE, this uncertainty corresponds to the confusion limit. We thereby constrain the flux/uncertainty at µm (Spitzer/MIPS, Le Floc’h et al. 2009), µm (Herschel/PACS+SPIRE, Lutz et al. 2011; Oliver et al. 2012), µm (SCUBA-2, Casey et al. 2013), 2mm (ALMA/B4, Long in prep., see also Casey et al. 2021), and 3 GHz (VLA, Smolčić et al. 2017) using the corresponding imaging data in the COSMOS field. For the Herschel/SPIRE bands this gives the appearance of a detection (Tab. 1); however, the SPIRE data at the position of AzTECC71 is likely blended with neighboring sources as is common in confusion-limited SPIRE maps and as expected based on the sub-mm blending. Thus, the overlapping pixel contains some mix of emission from AzTECC71 and its neighbors. We test deblending the Herschel maps following the method outlined previously for the SCUBA-2 data, but this is highly uncertain because of the larger Herschel PSFs and higher confusion noise limits (). Our attempts at Herschel deblending yields fluxes below the confusion limit for AzTECC71, and thus does not adequately constrain the source emission. Rather, by using the pixel flux at the position of the source we take a conservative approach and allow the SED fits to marginalize over uncertainty in flux association with AzTECC71 and its neighbors for the blended SPIRE photometry.
3 SED Fits and Derived Properties
We fit the optical through radio photometry/limits listed in Table 1 with CIGALE – a multi-wavelength fitting code that handles UV/optical and IR energy balance (Boquien et al., 2019). We also fit the far-IR data only with: MCIRSED – a Bayesian tool that fits dust emission properties (Drew & Casey, 2022), and MMpz – a photometric redshift code tied solely to far-IR/millimeter photometry (Casey, 2020). The FIR/mm probability distributions are based on the measured distribution of galaxy SEDs in the empirical relation between rest-frame peak wavelength and total IR luminosity, i.e. the - plane described in detail in Drew & Casey (2022) and which does not evolve with redshift. This technique accounts for intrinsic SED breadth as it probes a wide range of dust temperatures at fixed IR luminosity. Based on the FIR through sub-mm constrains alone, we estimate from MMpz.
The full optical/near-IR to far-IR/sub-mm fit with CIGALE is critical for constraining the target’s redshift and stellar mass. We fit AzTECC71 with an exponentially declining star-formation history that allows for a late-stage burst with Gyr and Myr. We assume a Chabrier IMF (Chabrier, 2003), a metallicity of either or and a power-law dust attenuation curve up to . We model the FIR SED as a modified blackbody with sub-mm slope added to a mid-infrared power-law with a slope that accounts for a distribution in warmer dust temperatures (Casey, 2012), although this regime of the SED is largely unconstrained so is a nuisance parameter we marginalize over. We apply a flat prior on redshift between , and the dust temperature is allowed to vary between 20 and 70 K. The wavelength corresponding to an optical depth of unity () is fixed to 200µm; we account for different opacity models in subsequent fits and find this assumption to have little impact on the best-fit results besides inflating uncertainties when allowed to vary. We include a power-law synchrotron component constrained by our VLA/3 GHz upper limit with a slope of 0.8 and we assume an FIR/radio correlation coefficient , corresponding to the range found for massive and high-redshift star-forming galaxies (e.g., Delvecchio et al., 2021).
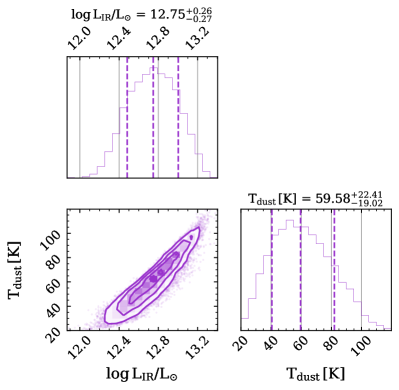
With MCIRSED (Drew & Casey, 2022), we fit the FIR/millimeter SED to a modified blackbody added piecewise with a mid-IR power law using Bayesian analysis; best-fit SEDs are derived based on a Markov chain Monte Carlo convergence. The mid-IR power law is joined to the modified blackbody at the point where the blackbody slope is equal to the power-law index (consistent with e.g., Casey, 2012; U et al., 2012). We allow to vary between µm as the opacity model for high-redshift galaxies likely varies as a function of the dust geometry (e.g., Simpson et al., 2017; Jin et al., 2019, 2022a). We fix the redshift to the CIGALE best-fit photometric redshift () and input the FIR/millimeter photometric detections and upper limits with their associated uncertainties. Given our prediction that the galaxy sits at , we include a cosmic microwave background (CMB) correction term in our fitting procedure to account for ISM dust heating from the CMB at high redshift (da Cunha et al., 2013). From the MCIRSED algorithm we find the best-fit dust SED with measurements for each of the following free parameters: emissivity spectral index (), total IR luminosity (LIR, taken from 8 to 1000 µm), dust temperature (), and rest-frame peak wavelength (). We marginalize over which increases the uncertainties on by 20% compared to fits fixing the opacity model to µm.
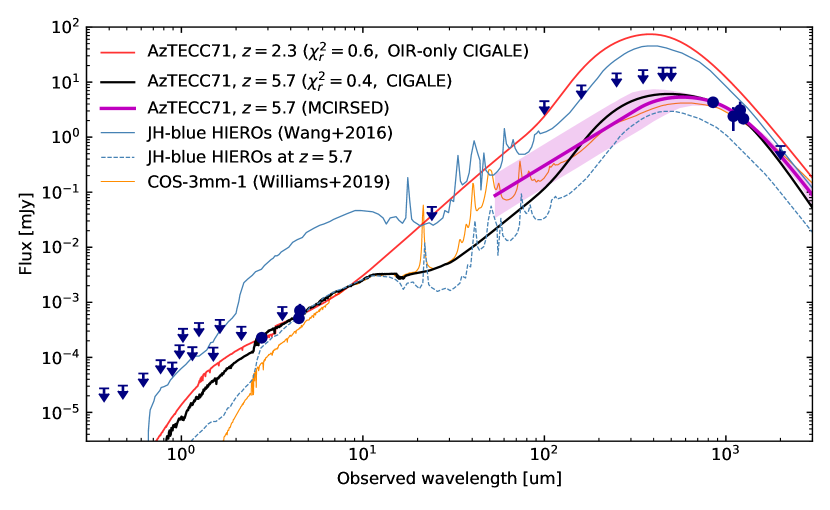
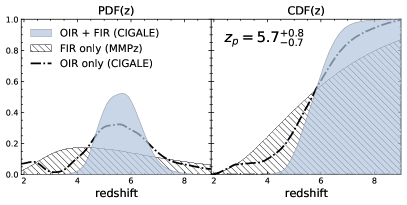
From the SED fits we infer a photometric redshift of . Figure 4 shows the best-fit CIGALE SED at . The posterior and cumulative redshift distribution functions are shown in Figure 5 from both CIGALE and MMPz. Marginalizing over the full parameter space, the probability that the galaxy lies above () is 99.6% (79.0%). If we fit only the optical/near-IR (OIR) SED under the same assumptions as outlined previously, we find a much broader redshift posterior consistent with the OIR+FIR/sub-mm photo albeit with greater uncertainty: . Most notably, the OIR-only SED fit allows a solution at that is significantly disfavored by the far-IR/sub-mm/radio data as demonstrated on Figure 4.
In Table 2 we list the best parameter estimates and their uncertainties for the solution from the optical/near-IR far-IR/sub-mm/radio SED fits with parameter uncertainties marginalizing over the distribution. Based on the CIGALE and MCIRSED fits, AzTECC71 is most likely a massive () dust-obscured star-forming galaxy with at . This is consistent with the OIR-only SED fit which favors a massive (), optically attenuated () galaxy at . AzTECC71 must be heavily attenuated in the optical () to match the red F277W/F444W color and non-detections in the NIRCam short-wavelength bands. This can be interpreted with a recent dust-obscured starburst as is known for ultraluminous IR galaxies (ULIRGs) with LIR . Indeed, the dust-obscured star-formation rate is high at as implied by the total IR luminosity following Kennicutt (1998)222.
The MCIRSED dust SED fit favors µm, corresponding to a dust temperature of K (see Figure 6). While MCIRSED also fits the emissivity spectral index , this measurement is poorly constrained, and is further exacerbated by the combined use of interferometric data with single-dish data that suffers from confusion boosting. Though we have accounted for deboosting and deblending as best as possible, precise measurements of for an individual source necessitates matched-beam ALMA data at both frequencies. Taken at face value, we find , which is high compared to other estimates at (e.g., Faisst et al., 2020a) but consistent with recent works that find evidence for in dusty, star-forming galaxies (Cooper et al., 2022; Casey et al., 2021; Kato et al., 2018).
Diagnosing the presence of an active galactic nucleus (AGN) in AzTECC71 is difficult given the lack of SED constraint in the mid-IR, a regime particularly sensitive to hot, toroidal dust emission around central super-massive black holes. At and for the best-fit , our radio upper limits at 3 GHz disfavor typical of radio AGN (Delvecchio et al. 2021, e.g.,) which would otherwise require a 3 GHz flux greater than our upper limit. However, a mid-IR spectral search for high-ionization emission lines and/or fine sampling of the mid-IR SED with JWST/MIRI would be needed to robustly rule out the presence of a heavily obscured AGN.
3.1 Dust Mass
We estimate the total dust mass in AzTECC71 following the procedure outlined in Kirkpatrick et al. (2017) using:
| (1) |
where is the luminosity distance at , is the flux density, is the Planck equation, and is the dust opacity from Weingartner & Draine (2001) assuming MW-like dust and . As explained in Kirkpatrick et al. (2017), variation in along the Rayleigh-Jeans (RJ) tail of the cold dust emission is between MW, SMC, and LMC opacity models. This is lower than the measurement and model uncertainty limiting our dust mass calculation. We fix the cold dust temperature in our calculations to K because this is more representative of the mass-weighted dust temperature rather than the light-weighted dust temperature we get from the SED fits (Scoville et al., 2016).
We use the MCIRSED best-fit SED flux and uncertainty at mm to calculate a dust mass using Equation 1. At , the 2mm flux is constrained by the ExMORA (Long et al., in prep.) upper-limit, and critically probes the RJ tail of cold dust emission (µm). This regime is well-suited to measuring the total dust mass because (1) the temperature dependence along the RJ tail is linear, and (2) the emission is optically thin at long wavelengths in the sub-mm (Scoville et al., 2014). While there might be variation in the dust opacity law at (e.g., Cooper et al., 2022), Faisst et al. (2020a) find optically thin dust at µm in galaxies based on three ALMA bands sampling beyond the peak of the IR SED in UV-selected main-sequence galaxies.
We then calculate by randomly sampling the range in from the MCIRSED fit (see purple shaded region, Fig. 4), as well as the posteriors for . We repeat this process times, and take the most frequent as our estimate. We report upper and lower uncertainties from the 16th and 84th percentiles of the distribution. From these calculations we estimate the dust mass in AzTECC71 to be . If we instead use the ALMA/B6 flux at µm following the same procedure, we get a value consistent within of ; however, 1250µm may or may not be tracing the RJ tail given our photometric redshift uncertainties so we adopt the estimate anchored to the 2mm upper limit/SED as our fiducial dust mass. This value is close to the total dust mass amongst LIRGs, and dex below the typical dust mass for LIRGs of similar stellar mass to AzTECC71 (Kirkpatrick et al., 2017). Applying this same method to the sample of Faisst et al. (2020a) to eliminate uncertainty introduced from using different methods to calculate the dust mass, we find a range in dust mass between . Relative to these main-sequence galaxies from the UV-selected ALPINE survey (Faisst et al., 2020a), AzTECC71 has a greater dust mass by a factor of and higher star-formation rate by a factor of on-average.
| Band | Parameter | Measurement | Units |
| All | |||
| FIR | |||
| All | 0.79 | ||
| All | 0.99 | ||
| All | |||
| FIR | 0.74 | ||
| Assuming | |||
| All | |||
| All | |||
| All | |||
| FIR | |||
| FIR | µm | ||
| FIR | K | ||
| FIR | |||
| FIR | yr-1 | ||
| FIR | Myr | ||
| F444W | |||
| F444W | arcsec | ||
| B6 | arcsec | ||
| B6 | |||
4 Results and Discussion
4.1 Comparison to high-redshift samples of dusty, star-forming galaxies
AzTECC71 stands out from high-redshift dusty, star-forming galaxies for its relatively faint optical and near-IR photometry. This galaxy is therefore closer in terms of observed flux densities to known “optical/near-IR dark” (hereafter OIR-dark) samples selected in the far-IR/sub-mm (da Cunha et al., 2015; Williams et al., 2019; Manning et al., 2022). Approximately of sub-mm-selected galaxies have always been unconstrainable in the optical/near-IR (Wardlow et al., 2011; Simpson et al., 2014; Casey et al., 2014; Zavala et al., 2018). Manning et al. (2022) report two 2mm-selected OIR-dark dusty galaxies, both of which are similar to AzTECC71 in terms of stellar mass and LIR. Williams et al. (2019) find a similar OIR-dark 3mm source likely at , comparable to HDF850.1 after accounting for magnification (Serjeant & Marchetti, 2014) and also similar to MAMBO-9 (Casey et al., 2019; Jin et al., 2019). Zavala et al. (2023) identify CEERS-DSFG1, an OIR-dark galaxy with a mJy SCUBA-2 m flux at (Arrabal Haro et al., 2023) detected only in F277W and longer filters like AzTECC71. CEERS-DSFG1 is less extreme with and (Zavala et al., 2023), highlighting the population diversity within OIR-dark, far-IR bright sources. The properties of these sub-mm/mm-selected galaxies are consistent with radio-selected OIR-dark galaxies from Talia et al. (2021) and near-IR-faint SMGs from Smail et al. (2021). That AzTECC71 falls within this OIR-dark, far-IR luminous dusty galaxy population is supported by similar SCUBA-2 flux densities and IRAC detections.
AzTECC71 exhibits intrinsic stellar and dust properties common amongst larger SMG samples (e.g., Simpson et al., 2019; Smail et al., 2021). AzTECC71 has a dust-obscured star-formation rate of and stellar mass , corresponding to a specific star-formation rate (sSFR) of . This is greater than the sSFR of main-sequence galaxies at this epoch (Speagle et al., 2014). AzTECC71 also has a higher sSFR than IR-detected high-redshift galaxies: the average SFR and stellar mass of SMGs from the ALESS survey are and respectively for a sSFR of 4 Gyr-1 (da Cunha et al., 2015). AzTECC71 is more massive than UV-selected star-forming galaxies with far-IR detections from ALMA-REBELS (Inami et al., 2022) and ALPINE (Béthermin et al., 2020; Faisst et al., 2020b), and has a larger dust mass by a factor of . This is consistent with AzTECC71 being a starburst possibly fueled by a large gas reservoir. Assuming a gas-to-dust ratio of 100 AzTECC71’s depletion timescale () is Myr, significantly higher than that of LIRGs under identical dust mass assumptions (Kirkpatrick et al., 2017). Assuming no further gas accretion, AzTECC71 would deplete 99% of its gas reservoir in Myr and could therefore plausibly evolve into the emergent population of quiescent galaxies at (e.g., Merlin et al., 2019; Santini et al., 2019; Shahidi et al., 2020; Long et al., 2022)
Prior to JWST AzTECC71 would not have been identified by rest-frame optical/near-IR methods for selecting high- dusty galaxies for lack of a detection shortward of the sub-mm. In Figure 4 we compare AzTECC71 against the average SED of HST and Spitzer selected objects from Wang et al. (2016) – “HIEROs”. While thought to include a significant fraction of dusty star-forming galaxies, such HIEROs are 2 dex brighter in the near-IR than AzTECC71. HIEROs are much fainter in the far-IR/sub-mm than AzTECC71 if we normalize them to AzTECC71’s redshift and IRAC(4.5µm) flux, which suggests that AzTECC71 is not drawn from this OIR-faint galaxy population that falls between (Wang et al., 2016). In fact, AzTECC71 is even missed by H-dropout selection of OIR-dark IRAC sources despite having comparable µm flux densities (Wang et al., 2019). This highlights the importance of both near- and far-IR/sub-mm selected samples of high dusty, star-forming galaxies for completeness.
4.2 Morphology
Spatially resolved optical and infrared emission in high-redshift, dusty galaxies commonly show offsets from one-another on the order of (e.g., Franco et al., 2018; Elbaz et al., 2018). This can arise from differential dust-attenuation across the galaxy, in particular due to clumpy dust distributions (e.g., Seibert et al., 2005; Cortese et al., 2006; Boquien et al., 2009; Muñoz-Mateos et al., 2009; Faisst et al., 2017). Interestingly, the near-infrared and 1250µm continuum in AzTECC71 are remarkably coincident. Both the ALMA Band 6 peak and centroid agree with the F444W centroid within arcsec (Fig. 2). While AzTECC71 is not spatially resolved by ALMA, the effective radius at 1250µm must be below 0.44′′ ( kpc at ), which could cover a large fraction of the stellar light given AzTECC71’s half-light radius of at 4.44µm. AzTECC71 has a consistent with the range of near-IR sizes in blue HIEROs from Wang et al. (2016), and smaller than the average band sizes of SMGs from Swinbank et al. (2010) by . A high dust covering fraction could help explain the high needed to fit the rest-frame optical photometry, but there is also evidence from the RGB image (Fig. 2) that the galaxy is bluer towards the outskirts. Indeed the F277W emission is clumpy and brighter away from the F444W and ALMA centroids, which suggests strong central attenuation. Spatially resolved far-IR observations are needed to fully test the resolved impact of dust on reddening across this galaxy only 1.2 Gyr after the Big Bang. Nevertheless, AzTECC71 likely hosts a very dusty nuclear starburst.
Given the size constraint from the ALMA Band 6 continuum detection, AzTECC71 must have a high IR surface density () above . This is consistent with the high IR surface densities observed for dusty, star-forming galaxies locally and at high-redshift (Díaz-Santos et al., 2017; Fujimoto et al., 2017; Simpson et al., 2017; Jin et al., 2022b), and could help explain the warm dust temperature preferred by our FIR modelling as a compact starburst heats dust to high temperatures, more-so if the gas-phase metallicity is low (Rémy-Ruyer et al., 2014; Sommovigo et al., 2022). Using radiative transfer modeling Hirashita & Chiang (2022) argue that dust temperatures of K and above could possibly be explained with lower dust-to-gas ratios. Temperatures below 40 K are not preferred by our far-IR SED modelling (Fig. 6), but coverage over the far-IR SED peak is needed to robustly measure given degenerative solutions with both LIR and . Taking these measurements at face value suggests a slightly higher dust temperature for this dust-obscured galaxy, which could be related to lower dust-to-gas ratios, metallicity, and/or a heavily obscured AGN which we cannot rule out for lack of data in the rest-frame mid-IR (e.g., Kirkpatrick et al., 2015; McKinney et al., 2021).
4.3 Implications for high-z star-forming galaxy populations
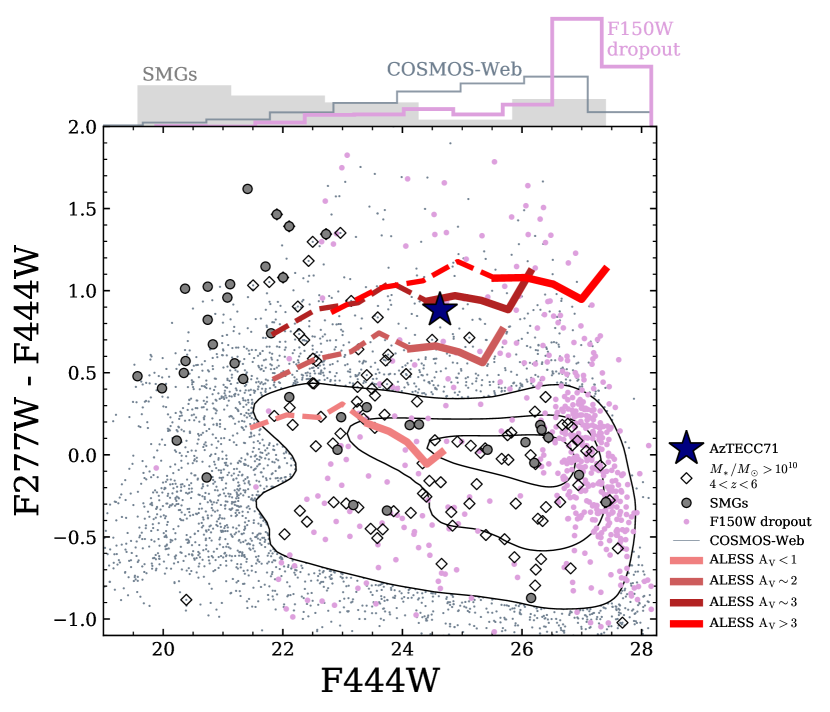
The incidence of objects like AzTECC71 in upcoming JWST surveys will provide a key test on obscured star-formation and the production of dust in the early Universe. We show in Figure 7 the F444W/F277W color-magnitude space occupied by galaxies in the COSMOS-Web January 2023 coverage (Casey et al., 2023). Starting with SCUBA-2 detections and validating counterparts with VLA 3 GHz imaging and then Spitzer MIPS and IRAC counterparts, the bulk of the SMGs within the COSMOS-Web footprint are bright in Spitzer and have F444W magnitudes. AzTECC71 is redder than SMGs fainter in F444W as well as known massive galaxies from COSMOS2020 (Weaver et al., 2022). Average SEDs binned by from ALESS and then redshifted to are consistent with AzTECC71’s color and derived properties (da Cunha et al., 2015), and suggest that some fraction of sources with F277W-F444W and F444W could be dusty, star-forming galaxies.
There are 627 objects in the COSMOS-Web area analyzed in this work with F277WF444W. Of these, 80 (13%) drop out of the F150W filter and have F444W magnitude, 15 (2%) are SMGs with a radio counterpart, and we infer 21 (3%) are and with photo-’s from COSMOS2020. 300 (48%) of these galaxies have no counterpart from COSMOS2020 within . Their division between a broader OIR-faint galaxy population and an OIR-faint FIR-bright (e.g., ) one could change the inferred dust-obscured star-formation density at . Barrufet et al. (2022) argue that HST-dark JWST-detected galaxies heavily obscured in the optical and with might dominate over the more massive SMGs at , which could push the dust-obscured star-formation rate density to larger values than previously measured from bright 2mm sources (Zavala et al., 2021; Casey et al., 2021). We find four more objects like AzTECC71 with ALMA-counterparts to SCUBA-2 detections that also drop out of the F150W filter and have by virtue of bright far-IR emission combined with very red F277WF444W (Manning et al., in prep.). Based on these sources (including AzTECC71) and the current area of COSMOS-Web’s footprint (77 arcmin2) we estimate a number density of dusty, star-forming galaxies with of . This is high relative to the median reported in the literature (, as compiled by Long et al. 2022), which may require revised estimates on the depletion/quenching timescale for dusty star-formation in the first Gyr of galaxy formation. However, the disparity in reported volume densities is largely due to different survey areas and wavelengths. Large area JWST surveys like COSMOS-Web combined with deep and contiguous far-IR/sub-mm data will be critical for reducing these systematic sources of uncertainty.
5 Summary and Conclusion
We report the JWST/NIRCam detection from the COSMOS-Web survey of AzTECC71, a known sub-mm source with no previous detection below µm. We identify counterparts in NIRCam/F277W and F444W using ALMA Band 6 imaging to localize the sub-mm emission. AzTECC71 is not detected in the COSMOS-Web F115W and F150W images, and is not detected in other ground- or space-based imaging below 2.7µm. Based on multi-wavelength SED modeling, AzTECC71 is a massive (), and IR-luminous () galaxy with a high () probability to be at .
AzTECC71 is broadly similar with respect to stellar properties and far-IR flux densities to known optically-dark/faint dusty, star-forming galaxies (Williams et al., 2019; Talia et al., 2021; Manning et al., 2022). This object is the faintest confirmed F444W counterpart to sub-millimeter galaxies in COSMOS-Web with SNR and F277W-F444W, and a member to a larger sample of high-redshift dusty, star-forming galaxies with no prior optical/near-infrared counterpart (Manning et al., in prep.). If ALMA-confirmed sub-millimeter sources that drop out of F150W in COSMOS-Web collectively fall at as is the case for AzTECC71, then the number counts of luminous, infrared galaxies at would be 0.5 dex higher than the median reported in the literature (Long et al., 2022). This could require revised estimates on the IR star-formation rate density, as well as for the quenching timescale of dusty, star-forming galaxies at this epoch.
The hunt for and characterization of optically-faint far-infrared bright galaxies stands on a precipice. The combination of JWST, ALMA and the VLA has significantly improved our capacity to find counterparts to bright far-IR sources and characterize the stellar populations in high-redshift () dusty, star-forming galaxies. In parallel, the upcoming generation of deep imaging surveys with JWST are finding very faint optical/near-IR sources that plausibly occupy the LIRG regime at but lack IR coverage necessary to robustly confirm or deny a high dust-obscured star-formation rate. At this epoch the incidence of dusty star-forming galaxies remains unconstrained owing to limiting sensitivities of ground-based far-IR facilities that struggle to survey below the ULIRG limit at , though there is some evidence for more obscured star-formation than previously thought at this epoch (Wang et al., 2016; Gruppioni et al., 2020; Talia et al., 2021; Pérez-González et al., 2022; Barrufet et al., 2022; Rodighiero et al., 2023). Moreover, the “optically-faint” classification is becoming a confusing identifier as the population diversity of objects discovered for the first time in the optical by JWST grows. Upcoming instruments such as ToLTEC on the LMT will push to deeper LIR limits with resolution at 1.1 mm, enabling better counterpart matching between large optical/near-IR and far-IR surveys. With these state-of-the-art data sets, OIR-faint/dark galaxies should distinguish between far-IR bright or faint populations in classification schemes where possible. Even then, a cold far-infrared space telescope with either a large aperture of sufficient spectroscopic sensitivity to disentangle confused sources along the frequency axis is needed fully uncover the very distant IR Universe.
References
- Algera et al. (2023) Algera, H. S. B., Inami, H., Oesch, P. A., et al. 2023, MNRAS, 518, 6142, doi: 10.1093/mnras/stac3195
- Aretxaga et al. (2011) Aretxaga, I., Wilson, G. W., Aguilar, E., et al. 2011, MNRAS, 415, 3831, doi: 10.1111/j.1365-2966.2011.18989.x
- Arrabal Haro et al. (2023) Arrabal Haro, P., Dickinson, M., Finkelstein, S. L., et al. 2023, arXiv e-prints, arXiv:2303.15431, doi: 10.48550/arXiv.2303.15431
- Bagley et al. (2022) Bagley, M. B., Finkelstein, S. L., Koekemoer, A. M., et al. 2022, arXiv e-prints, arXiv:2211.02495. https://arxiv.org/abs/2211.02495
- Barrufet et al. (2022) Barrufet, L., Oesch, P. A., Weibel, A., et al. 2022, arXiv e-prints, arXiv:2207.14733, doi: 10.48550/arXiv.2207.14733
- Bertoldi et al. (2007) Bertoldi, F., Carilli, C., Aravena, M., et al. 2007, ApJS, 172, 132, doi: 10.1086/520511
- Béthermin et al. (2020) Béthermin, M., Fudamoto, Y., Ginolfi, M., et al. 2020, A&A, 643, A2, doi: 10.1051/0004-6361/202037649
- Boquien et al. (2019) Boquien, M., Burgarella, D., Roehlly, Y., et al. 2019, A&A, 622, A103, doi: 10.1051/0004-6361/201834156
- Boquien et al. (2009) Boquien, M., Calzetti, D., Kennicutt, R., et al. 2009, ApJ, 706, 553, doi: 10.1088/0004-637X/706/1/553
- Bouwens et al. (2022) Bouwens, R. J., Smit, R., Schouws, S., et al. 2022, ApJ, 931, 160, doi: 10.3847/1538-4357/ac5a4a
- Brisbin et al. (2017) Brisbin, D., Miettinen, O., Aravena, M., et al. 2017, A&A, 608, A15, doi: 10.1051/0004-6361/201730558
- Casey (2012) Casey, C. M. 2012, MNRAS, 425, 3094, doi: 10.1111/j.1365-2966.2012.21455.x
- Casey (2020) —. 2020, ApJ, 900, 68, doi: 10.3847/1538-4357/aba528
- Casey et al. (2014) Casey, C. M., Narayanan, D., & Cooray, A. 2014, Phys. Rep., 541, 45, doi: 10.1016/j.physrep.2014.02.009
- Casey et al. (2013) Casey, C. M., Chen, C.-C., Cowie, L. L., et al. 2013, MNRAS, 436, 1919, doi: 10.1093/mnras/stt1673
- Casey et al. (2019) Casey, C. M., Zavala, J. A., Aravena, M., et al. 2019, ApJ, 887, 55, doi: 10.3847/1538-4357/ab52ff
- Casey et al. (2021) Casey, C. M., Zavala, J. A., Manning, S. M., et al. 2021, ApJ, 923, 215, doi: 10.3847/1538-4357/ac2eb4
- Casey et al. (2023) Casey, C. M., Kartaltepe, J. S., Drakos, N. E., et al. 2023, arXiv e-prints, arXiv:2211.07865. https://arxiv.org/abs/2211.07865
- Chabrier (2003) Chabrier, G. 2003, PASP, 115, 763, doi: 10.1086/376392
- Chen et al. (2013) Chen, C.-C., Cowie, L. L., Barger, A. J., et al. 2013, ApJ, 776, 131, doi: 10.1088/0004-637X/776/2/131
- Cooper et al. (2022) Cooper, O. R., Casey, C. M., Zavala, J. A., et al. 2022, ApJ, 930, 32, doi: 10.3847/1538-4357/ac616d
- Cortese et al. (2006) Cortese, L., Boselli, A., Buat, V., et al. 2006, ApJ, 637, 242, doi: 10.1086/498296
- Cowie et al. (2009) Cowie, L. L., Barger, A. J., Wang, W. H., & Williams, J. P. 2009, ApJ, 697, L122, doi: 10.1088/0004-637X/697/2/L122
- da Cunha et al. (2013) da Cunha, E., Groves, B., Walter, F., et al. 2013, ApJ, 766, 13, doi: 10.1088/0004-637X/766/1/13
- da Cunha et al. (2015) da Cunha, E., Walter, F., Smail, I. R., et al. 2015, ApJ, 806, 110, doi: 10.1088/0004-637X/806/1/110
- Delvecchio et al. (2021) Delvecchio, I., Daddi, E., Sargent, M. T., et al. 2021, A&A, 647, A123, doi: 10.1051/0004-6361/202039647
- Díaz-Santos et al. (2017) Díaz-Santos, T., Armus, L., Charmandaris, V., et al. 2017, ApJ, 846, 32, doi: 10.3847/1538-4357/aa81d7
- Drew & Casey (2022) Drew, P. M., & Casey, C. M. 2022, ApJ, 930, 142, doi: 10.3847/1538-4357/ac6270
- Dunlop et al. (2004) Dunlop, J. S., McLure, R. J., Yamada, T., et al. 2004, MNRAS, 350, 769, doi: 10.1111/j.1365-2966.2004.07700.x
- Elbaz et al. (2018) Elbaz, D., Leiton, R., Nagar, N., et al. 2018, A&A, 616, A110, doi: 10.1051/0004-6361/201732370
- Faisst et al. (2020a) Faisst, A. L., Fudamoto, Y., Oesch, P. A., et al. 2020a, MNRAS, 498, 4192, doi: 10.1093/mnras/staa2545
- Faisst et al. (2017) Faisst, A. L., Capak, P. L., Yan, L., et al. 2017, ApJ, 847, 21, doi: 10.3847/1538-4357/aa886c
- Faisst et al. (2020b) Faisst, A. L., Schaerer, D., Lemaux, B. C., et al. 2020b, ApJS, 247, 61, doi: 10.3847/1538-4365/ab7ccd
- Finkelstein et al. (2022) Finkelstein, S. L., Bagley, M. B., Ferguson, H. C., et al. 2022, arXiv e-prints, arXiv:2211.05792. https://arxiv.org/abs/2211.05792
- Franco et al. (2018) Franco, M., Elbaz, D., Béthermin, M., et al. 2018, A&A, 620, A152, doi: 10.1051/0004-6361/201832928
- Fudamoto et al. (2021) Fudamoto, Y., Oesch, P. A., Schouws, S., et al. 2021, Nature, 597, 489, doi: 10.1038/s41586-021-03846-z
- Fujimoto et al. (2017) Fujimoto, S., Ouchi, M., Shibuya, T., & Nagai, H. 2017, ApJ, 850, 83, doi: 10.3847/1538-4357/aa93e6
- Geach et al. (2017) Geach, J. E., Dunlop, J. S., Halpern, M., et al. 2017, MNRAS, 465, 1789, doi: 10.1093/mnras/stw2721
- Gruppioni et al. (2020) Gruppioni, C., Béthermin, M., Loiacono, F., et al. 2020, A&A, 643, A8, doi: 10.1051/0004-6361/202038487
- Hayward et al. (2013) Hayward, C. C., Behroozi, P. S., Somerville, R. S., et al. 2013, MNRAS, 434, 2572, doi: 10.1093/mnras/stt1202
- Hayward et al. (2018) Hayward, C. C., Chapman, S. C., Steidel, C. C., et al. 2018, MNRAS, 476, 2278, doi: 10.1093/mnras/sty304
- Hayward et al. (2021) Hayward, C. C., Sparre, M., Chapman, S. C., et al. 2021, MNRAS, 502, 2922, doi: 10.1093/mnras/stab246
- Hirashita & Chiang (2022) Hirashita, H., & Chiang, I.-D. 2022, MNRAS, 516, 1612, doi: 10.1093/mnras/stac2242
- Hodge & da Cunha (2020) Hodge, J. A., & da Cunha, E. 2020, Royal Society Open Science, 7, 200556, doi: 10.1098/rsos.200556
- Hughes et al. (1998) Hughes, D. H., Serjeant, S., Dunlop, J., et al. 1998, Nature, 394, 241, doi: 10.1038/28328
- Inami et al. (2022) Inami, H., Algera, H. S. B., Schouws, S., et al. 2022, MNRAS, 515, 3126, doi: 10.1093/mnras/stac1779
- Jin et al. (2018) Jin, S., Daddi, E., Liu, D., et al. 2018, ApJ, 864, 56, doi: 10.3847/1538-4357/aad4af
- Jin et al. (2019) Jin, S., Daddi, E., Magdis, G. E., et al. 2019, ApJ, 887, 144, doi: 10.3847/1538-4357/ab55d6
- Jin et al. (2022a) —. 2022a, A&A, 665, A3, doi: 10.1051/0004-6361/202243341
- Jin et al. (2022b) —. 2022b, arXiv e-prints, arXiv:2206.10401. https://arxiv.org/abs/2206.10401
- Kato et al. (2018) Kato, Y., Matsuda, Y., Iono, D., et al. 2018, PASJ, 70, L6, doi: 10.1093/pasj/psy087
- Kennicutt (1998) Kennicutt, Robert C., J. 1998, ARA&A, 36, 189, doi: 10.1146/annurev.astro.36.1.189
- Kirkpatrick et al. (2015) Kirkpatrick, A., Pope, A., Sajina, A., et al. 2015, ApJ, 814, 9, doi: 10.1088/0004-637X/814/1/9
- Kirkpatrick et al. (2017) —. 2017, ApJ, 843, 71, doi: 10.3847/1538-4357/aa76dc
- Koekemoer et al. (2007) Koekemoer, A. M., Aussel, H., Calzetti, D., et al. 2007, ApJS, 172, 196, doi: 10.1086/520086
- Koprowski et al. (2014) Koprowski, M. P., Dunlop, J. S., Michałowski, M. J., Cirasuolo, M., & Bowler, R. A. A. 2014, MNRAS, 444, 117, doi: 10.1093/mnras/stu1402
- Le Fèvre et al. (2020) Le Fèvre, O., Béthermin, M., Faisst, A., et al. 2020, A&A, 643, A1, doi: 10.1051/0004-6361/201936965
- Le Floc’h et al. (2009) Le Floc’h, E., Aussel, H., Ilbert, O., et al. 2009, ApJ, 703, 222, doi: 10.1088/0004-637X/703/1/222
- Lim et al. (2020) Lim, C.-F., Wang, W.-H., Smail, I., et al. 2020, ApJ, 889, 80, doi: 10.3847/1538-4357/ab607f
- Liu et al. (2018) Liu, D., Daddi, E., Dickinson, M., et al. 2018, ApJ, 853, 172, doi: 10.3847/1538-4357/aaa600
- Long et al. (2022) Long, A. S., Casey, C. M., Lagos, C. d. P., et al. 2022, arXiv e-prints, arXiv:2211.02072. https://arxiv.org/abs/2211.02072
- Lutz et al. (2011) Lutz, D., Poglitsch, A., Altieri, B., et al. 2011, A&A, 532, A90, doi: 10.1051/0004-6361/201117107
- Madau & Dickinson (2014) Madau, P., & Dickinson, M. 2014, ARA&A, 52, 415, doi: 10.1146/annurev-astro-081811-125615
- Manning et al. (2022) Manning, S. M., Casey, C. M., Zavala, J. A., et al. 2022, ApJ, 925, 23, doi: 10.3847/1538-4357/ac366a
- Martí-Vidal et al. (2014) Martí-Vidal, I., Vlemmings, W. H. T., Muller, S., & Casey, S. 2014, A&A, 563, A136, doi: 10.1051/0004-6361/201322633
- McKinney et al. (2021) McKinney, J., Hayward, C. C., Rosenthal, L. J., et al. 2021, ApJ, 921, 55, doi: 10.3847/1538-4357/ac185f
- Merlin et al. (2019) Merlin, E., Fortuni, F., Torelli, M., et al. 2019, MNRAS, 490, 3309, doi: 10.1093/mnras/stz2615
- Michałowski et al. (2017) Michałowski, M. J., Dunlop, J. S., Koprowski, M. P., et al. 2017, MNRAS, 469, 492, doi: 10.1093/mnras/stx861
- Muñoz-Mateos et al. (2009) Muñoz-Mateos, J. C., Gil de Paz, A., Boissier, S., et al. 2009, ApJ, 701, 1965, doi: 10.1088/0004-637X/701/2/1965
- Novak et al. (2017) Novak, M., Smolčić, V., Delhaize, J., et al. 2017, A&A, 602, A5, doi: 10.1051/0004-6361/201629436
- Oliver et al. (2012) Oliver, S. J., Bock, J., Altieri, B., et al. 2012, MNRAS, 424, 1614, doi: 10.1111/j.1365-2966.2012.20912.x
- Pérez-González et al. (2022) Pérez-González, P. G., Barro, G., Annunziatella, M., et al. 2022, arXiv e-prints, arXiv:2211.00045, doi: 10.48550/arXiv.2211.00045
- Rémy-Ruyer et al. (2014) Rémy-Ruyer, A., Madden, S. C., Galliano, F., et al. 2014, A&A, 563, A31, doi: 10.1051/0004-6361/201322803
- Rodighiero et al. (2023) Rodighiero, G., Bisigello, L., Iani, E., et al. 2023, MNRAS, 518, L19, doi: 10.1093/mnrasl/slac115
- Santini et al. (2019) Santini, P., Merlin, E., Fontana, A., et al. 2019, MNRAS, 486, 560, doi: 10.1093/mnras/stz801
- Scoville et al. (2007) Scoville, N., Aussel, H., Brusa, M., et al. 2007, ApJS, 172, 1, doi: 10.1086/516585
- Scoville et al. (2014) Scoville, N., Aussel, H., Sheth, K., et al. 2014, ApJ, 783, 84, doi: 10.1088/0004-637X/783/2/84
- Scoville et al. (2016) Scoville, N., Sheth, K., Aussel, H., et al. 2016, ApJ, 820, 83, doi: 10.3847/0004-637X/820/2/83
- Seibert et al. (2005) Seibert, M., Martin, D. C., Heckman, T. M., et al. 2005, ApJ, 619, L55, doi: 10.1086/427843
- Serjeant & Marchetti (2014) Serjeant, S., & Marchetti, L. 2014, MNRAS, 443, 3118, doi: 10.1093/mnras/stu1266
- Shahidi et al. (2020) Shahidi, A., Mobasher, B., Nayyeri, H., et al. 2020, ApJ, 897, 44, doi: 10.3847/1538-4357/ab96c5
- Simpson et al. (2014) Simpson, J. M., Swinbank, A. M., Smail, I., et al. 2014, ApJ, 788, 125, doi: 10.1088/0004-637X/788/2/125
- Simpson et al. (2015) Simpson, J. M., Smail, I., Swinbank, A. M., et al. 2015, ApJ, 807, 128, doi: 10.1088/0004-637X/807/2/128
- Simpson et al. (2017) —. 2017, ApJ, 839, 58, doi: 10.3847/1538-4357/aa65d0
- Simpson et al. (2019) —. 2019, ApJ, 880, 43, doi: 10.3847/1538-4357/ab23ff
- Smail et al. (2021) Smail, I., Dudzevičiūtė, U., Stach, S. M., et al. 2021, MNRAS, 502, 3426, doi: 10.1093/mnras/stab283
- Smolčić et al. (2017) Smolčić, V., Novak, M., Bondi, M., et al. 2017, A&A, 602, A1, doi: 10.1051/0004-6361/201628704
- Sommovigo et al. (2022) Sommovigo, L., Ferrara, A., Pallottini, A., et al. 2022, MNRAS, 513, 3122, doi: 10.1093/mnras/stac302
- Speagle et al. (2014) Speagle, J. S., Steinhardt, C. L., Capak, P. L., & Silverman, J. D. 2014, ApJS, 214, 15, doi: 10.1088/0067-0049/214/2/15
- Swinbank et al. (2010) Swinbank, A. M., Smail, I., Chapman, S. C., et al. 2010, MNRAS, 405, 234, doi: 10.1111/j.1365-2966.2010.16485.x
- Talia et al. (2021) Talia, M., Cimatti, A., Giulietti, M., et al. 2021, ApJ, 909, 23, doi: 10.3847/1538-4357/abd6e3
- Toft et al. (2014) Toft, S., Smolčić, V., Magnelli, B., et al. 2014, ApJ, 782, 68, doi: 10.1088/0004-637X/782/2/68
- U et al. (2012) U, V., Sanders, D. B., Mazzarella, J. M., et al. 2012, ApJS, 203, 9, doi: 10.1088/0067-0049/203/1/9
- Valentino et al. (2020) Valentino, F., Tanaka, M., Davidzon, I., et al. 2020, ApJ, 889, 93, doi: 10.3847/1538-4357/ab64dc
- Walter et al. (2012) Walter, F., Decarli, R., Carilli, C., et al. 2012, Nature, 486, 233, doi: 10.1038/nature11073
- Wang et al. (2016) Wang, T., Elbaz, D., Schreiber, C., et al. 2016, ApJ, 816, 84, doi: 10.3847/0004-637X/816/2/84
- Wang et al. (2019) Wang, T., Schreiber, C., Elbaz, D., et al. 2019, Nature, 572, 211, doi: 10.1038/s41586-019-1452-4
- Wardlow et al. (2011) Wardlow, J. L., Smail, I., Coppin, K. E. K., et al. 2011, MNRAS, 415, 1479, doi: 10.1111/j.1365-2966.2011.18795.x
- Weaver et al. (2022) Weaver, J. R., Kauffmann, O. B., Ilbert, O., et al. 2022, ApJS, 258, 11, doi: 10.3847/1538-4365/ac3078
- Weingartner & Draine (2001) Weingartner, J. C., & Draine, B. T. 2001, ApJ, 548, 296, doi: 10.1086/318651
- Williams et al. (2019) Williams, C. C., Labbe, I., Spilker, J., et al. 2019, ApJ, 884, 154, doi: 10.3847/1538-4357/ab44aa
- Zavala et al. (2018) Zavala, J. A., Aretxaga, I., Dunlop, J. S., et al. 2018, MNRAS, 475, 5585, doi: 10.1093/mnras/sty217
- Zavala et al. (2021) Zavala, J. A., Casey, C. M., Manning, S. M., et al. 2021, ApJ, 909, 165, doi: 10.3847/1538-4357/abdb27
- Zavala et al. (2023) Zavala, J. A., Buat, V., Casey, C. M., et al. 2023, ApJ, 943, L9, doi: 10.3847/2041-8213/acacfe