Late-formed halos prefer to host quiescent central galaxies. I. Observational results
Abstract
The star formation and quenching of central galaxies are regulated by the assembly histories of their host halos. In this work, we use the central stellar mass to halo mass ratio as a proxy of halo formation time, and we devise three different models, from the physical hydrodynamical simulation to the empirical statistical model, to demonstrate its robustness. With this proxy, we inferred the dependence of the central galaxy properties on the formation time of their host halos using the SDSS main galaxy sample, where central galaxies are identified with the halo-based group finder. We found that central galaxies living in late-formed halos have higher quiescent fractions and lower spiral fractions than their early-formed counterparts by . Finally, we demonstrate that the group finding algorithm has a negligible impact on our results.
keywords:
methods: statistical - galaxies: groups: general - dark matter - large-scale structure of Universe1 Introduction
In the concordance CDM model, the basic blocks of the cosmic structure are dark matter halos, the virialized parts of the cosmic density field assembled through gravitational instability. The abundance, spatial distribution and formation histories of the dark matter halo population are now well-understood using semi-analytical methods and numerical simulations (e.g. Mo & White, 1996; Navarro et al., 1997; Jing, 2000; Wechsler et al., 2002; Gao et al., 2005; Mo et al., 2010; Chen et al., 2020). This provides a solid foundation to understand the galaxy population, as galaxies are believed to form and evolve in dark matter halos and the properties of galaxies are expected to be closely related to their host halos (White & Rees, 1978).
Many methods have been used to establish the connection between galaxies and dark matter halos in the framework provided by current cosmology. These include direct numerical simulations that are based on the first principles of physical processes combined with some subgrid recipes for modeling unresolved processes (e.g. Vogelsberger et al., 2013; Schaye et al., 2015; Davé et al., 2016; Weinberger et al., 2017; Nelson et al., 2019; Davé et al., 2019), semi-analytical models that are based on a set of empirical functions to approximate physical processes of galaxy formation and evolution (e.g. White & Frenk, 1991; Kauffmann et al., 1993; Somerville & Primack, 1999; Cole et al., 2000; Kang et al., 2005; Guo et al., 2011; Henriques et al., 2015), and empirical models that aim to establish the connection between galaxies and halos statistically and empirically (e.g. Jing et al., 1998; Berlind et al., 2003; Yang et al., 2003; Vale & Ostriker, 2004; Kravtsov et al., 2004; Zheng et al., 2005; Moster et al., 2013; Lu et al., 2014; Behroozi et al., 2019). A primary consensus on the galaxy-halo connection has been reached that the stellar mass-halo mass relation is nonlinear, but is roughly described by a double-power-law function (Yang et al., 2003; Behroozi et al., 2013; Wechsler & Tinker, 2018). Such a relation has been used to indicate that the efficiency of converting baryons into stars is suppressed in both the low-mass and high-mass ends, respectively by supernova feedback (e.g. Dekel & Silk, 1986; Ceverino & Klypin, 2009) and active galactic nuclei (AGN) feedback (e.g. Croton et al., 2006; Fabian, 2012), although the details remain uncertain.
Motivated by the success in establishing the primary connection between galaxies and dark matter halos, attempts have been made to extend the galaxy-halo connection using other (secondary) properties of galaxies and halos. An important example is the attempt to relate the assembly histories of halos to the star formation histories of galaxies using heuristic assumptions that are tuned to match the observed abundance and spatial distribution of galaxies as a function of their secondary properties, such as color and star formation rate (e.g. Hearin & Watson, 2013; Hearin et al., 2014; Watson et al., 2015; Moster et al., 2018; Behroozi et al., 2019; Wang et al., 2023b; Meng et al., 2020). Hydrodynamical simulations were also used to investigate the secondary effects in the galaxy-halo connection. For example, Davies et al. (2020) found that central galaxies living in early-formed halos tend to possess fewer amounts of gas in the circum-galactic medium (CGM), harbor more massive black holes, have longer cooling time for the CGM gas, and, consequently, are more quenched in star formation. Such correlations indicate that early-formed halos tend to host central galaxies that are more quiescent (see also Matthee & Schaye, 2019). The causality between halo formation and star formation status is further confirmed by Davies et al. (2021) using a controlled simulation which follows the details of halo formation and star formation. They found that early-formed halos grow their central black holes earlier so that their feedback can quench the star formation activity earlier than that in late-formed counterparts. In contrast, Cui et al. (2021) found that early-formed halos actually prefer to host star-forming central galaxies in their SIMBA simulation (Davé et al., 2016, 2019). They argued that central galaxies in early-formed halos are able to accumulate a large amount of cold gas through cold-mode accretion at high- (Birnboim & Dekel, 2003; Kereš et al., 2005; van de Voort et al., 2011; Wright et al., 2021) and that the associated quasar-mode AGN feedback is inefficient to quench galaxies but can extend the star formation time scale. On the other hand, late-formed halos, which acquire their gas mainly through hot-mode accretion, host central galaxies with smaller amounts of cold gas, and the radio-mode AGN feedback associated with such accretion can quench these galaxies. This scenario seems to be supported by observational results where red central galaxies prefer to live in more massive halos (which tend to form later) than their blue counterparts of the same stellar mass (e.g. Mandelbaum et al., 2006, 2016; More et al., 2011; Wechsler & Tinker, 2018; Posti et al., 2019; Posti & Fall, 2021; Zhang et al., 2022).
In order to study the impact of halo formation histories on central galaxies, it is crucial to fix the halo mass and find an observational quantity that can be used as a proxy of halo formation time. Wang et al. (2011) found that the mass ratio between the central subhalo and the host halo is strongly correlated with the formation time of the host halo. Motivated by this and the expectation that the stellar mass of a galaxy is correlated with the mass of its subhalo, Lim et al. (2016) suggested that the central stellar mass to halo mass ratio (hereafter central SMHMR) may be used as an observational proxy of halo formation time (see also Tojeiro et al., 2017; Bradshaw et al., 2020; Zhang et al., 2021). In this paper, we adopt the same proxy and apply it to the observational data. We will show that central galaxies with lower SMHMRs are more quenched. To make connections to halo formation time, we calibrate the relation between central SMHMRs and halo formation time using three different models, and they all agree with each other. We then use this relation to quantify how the quenched fraction and the spiral fraction of galaxies depend on the formation time of their host halos.
The paper is organized as follows. In § 2 we describe the halo formation time proxy and derive its relationship with halo formation time using three different models, from the physical hydrodynamical simulation of IllustrisTNG to the empirical subhalo halo abundance matching method. In § 3, we apply the proxy on the observational data to study the dependence of central galaxy properties on the halo formation time. Finally, our results are summarized in § 4. We converted all of the presented results to a concordance CDM cosmology with , , , and .
2 Testing the proxy of halo formation time
2.1 The proxy
| Notation | Description |
| Peak value of the maximum circular velocity of subhalos along the main branch. | |
| Lookback time when the FoF halo has first assembled half of its final mass along the main branch | |
| Residual of with respect to the median in bins of halo mass | |
| central SMHMR | the stellar mass to halo mass ratio for central galaxies |
| Stellar mass of galaxies/subhalos in the hydrodynamical simulation | |
| Stellar mass assigned to each subhalo using the abundance matching method according to the rank of based on the observational stellar mass function | |
| Halo mass assigned to each FoF halo using the abundance matching method according to the rank of the sum of for all subhalos in this FoF halo | |
| Halo mass assigned to each FoF halo using the abundance matching method according to the rank of the sum of for all subhalos in this FoF halo |
Previous studies suggest that the central SMHMR is a proxy of the halo formation time, where halos that are formed earlier prefer to host more massive central galaxies and vice versa (Wang et al., 2011; Lim et al., 2016; Tojeiro et al., 2017; Bradshaw et al., 2020; Correa & Schaye, 2020). Their relationship can be explained by that early-formed halos have more time for their satellites to merge with central galaxies.
A robust scaling relation between the central SMHMR and the halo formation time needs to be built before we can use this proxy. To this end, we devised three different models to quantify this scaling relation, as well as their scatters. We start from a cosmological hydrodynamical simulation with main halos identified where the halo mass is denoted as . Each dark matter halo contains no less than one subhalo and each subhalo contains one galaxy with stellar mass assigned, which is denoted as . Besides, each subhalo also has a , which is the peak value of the maximum circular velocity along the evolution history of this subhalo. Then, we devised three models with different assignments of stellar mass and halo mass to subhalos and halos, i.e.
-
1.
Model-A: We use stellar mass and halo mass from the simulation, i.e. and . The central galaxy is defined as the one with the largest .
-
2.
Model-B: We use stellar mass for each subhalo in the simulation, i.e. , and recalibrate the halo mass for each main halo with the abundance matching method according to the rank of the total stellar mass of member galaxies with , and this halo mass is denoted as . The central galaxy is defined as the one with the largest .
-
3.
Model-C: This model is fully empirical and independent of the specific implementation of baryonic physics. First, we assign stellar mass to each subhalo using the abundance matching method according to the rank of , and this stellar mass is denoted as (Reddick et al., 2013). During the abundance matching procedure, the observational stellar mass function in Moustakas et al. (2013) is adopted111We note that the stellar mass function measurement in Moustakas et al. (2013) suffers from systematic effects in photometry. To maintain consistency in observational data, we adopt the re-calibrated results in Behroozi et al. (2019) where an attempt was made to deal with these issues.. Then, we recalibrate the halo mass for each main halo with the abundance matching method according to the rank of the sum of for all member galaxies with , and this halo mass is denoted as . The central galaxy is defined as the one with the largest .
These notations are summarized in Table 1. We note that Model-A totally relies on the hydrodynamical simulation, so the stellar mass and halo mass are both physical, but depend on the specific implementation of the simulation used. On the contrary, Model-C only relies on the heuristic assumption of abundance matching. And Model-B is in between. Using these three models, from the physical hydrodynamical simulation to the empirical statistical model, we will demonstrate that they all agree on the scaling relation between the central SMHMR and the formation time of their host halos, showing the robustness of this relation.
2.2 Numerical simulations used for the test
Here we use the state-of-the-art simulation of IllustrisTNG to test the scaling relation between central SMHMRs and halo formation time. The IllustrisTNG (The Next Generation) (hereafter TNG, Weinberger et al., 2017; Pillepich et al., 2018a; Springel et al., 2018; Naiman et al., 2018; Marinacci et al., 2018; Pillepich et al., 2018b; Nelson et al., 2018, 2019) is a suite of gravo-magnetohydrodynamical cosmological simulations run with the moving-mesh code AREPO. TNG simulates the formation and evolution of galaxies from to based on a cosmology consistent with results in Planck Collaboration et al. (2016), where , , , and . Here we use TNG300-1 for better statistics, which has resolution elements in a box with the side length of . The target baryon mass resolution is , and the dark matter particle mass is .
In the TNG simulation, dark matter halos were identified with the friends-of-friends (FoF) algorithm using dark matter particles222These halos are also called main halos or FoF halos, and we will use them interchangeably.. Substructures were identified with the SUBFIND algorithm (Springel et al., 2001) using all types of particles, where the baryonic components identified are defined as galaxies, with the dark matter components as subhalos. The subhalo located at the minimum of the gravitational potential is defined as the central one, while others are satellites. Subhalo merger trees are built using the SUBLINK algorithm (Rodriguez-Gomez et al., 2015). Once all the trees are built up, we can define the main progenitor of any subhalo in the preceding snapshot as the one with the most massive progenitor history (see De Lucia & Blaizot, 2007). Finally, we can obtain a branch consisting of the main progenitors of the halo in question by recursively identifying the main progenitor, and this branch is called the main branch.
The halo mass is defined as the total mass within a sphere around the halo center where the mean overdensity is 200 times the critical density of the universe. The peak halo mass of a subhalo is defined as the maximum halo mass that the subhalo has ever achieved along the main branch when it is identified as a central subhalo. For each subhalo, we can also calculate its maximum circular velocity, and denote it as . Then, we trace the main branch of this subhalo to find the peak value for all on this branch and denote it as .
The assembly history of each dark matter halo corresponds to a subhalo merger tree, where small halos are formed early, then they merge with each other and end up with one descendant halo at . Despite the complexity of this merger tree, we can still capture the main feature with the characteristic formation time of halos (Chen et al., 2020). There are many different definitions of halo formation time (e.g. Gao et al., 2005; Wechsler et al., 2006; Li et al., 2008; Nadler et al., 2023), and here we choose to use the simplest one, which is defined as the highest redshift when the main progenitor halo has assembled half of its descendant halo mass at . The corresponding lookback time is denoted as .
2.3 Test results
2.3.1 Comparison of three models
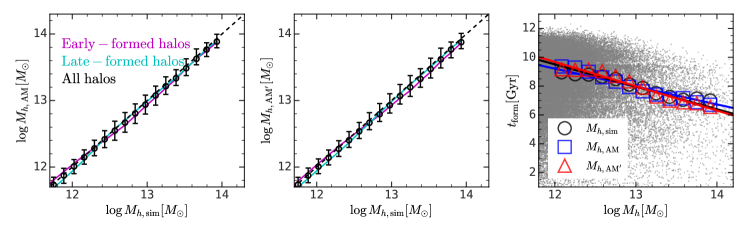
We first examine the difference in halo masses for these three models. The left panel in Fig. 1 shows the comparisons between and . Here the circles with error bars show the median and quantiles, and the dashed line is the one-to-one reference line. Similarly, the middle panel shows the comparison between and . All these results show that the halo masses assigned according to the empirical abundance matching method are very close to the values in the TNG300 simulation.
Then, we examine the relationship between three halo masses and halo formation time, , which is shown on the right panel in Fig. 1. The symbols are the median in each halo mass bin. The solid lines are the corresponding linear fitting line, while the black/blue/red colors are for three models accordingly. Here one can see that all three models produce a nearly identical negative correlation between halo mass and halo formation time, where massive halos are formed late, which is expected in the hierarchical structure formation scenario. We note that this correlation can introduce bias into our study when a finite halo mass bin is used. Hence, we use the residual with respect to the median as a function of halo mass, i.e.
| (1) |
Finally, to see if the abundance matching method introduces any dependence on the halo formation time, we compare the halo mass in three models for early-formed and late-formed halos separately, where halos with in each bin are defined as early-formed and others are late-formed. The results are shown in the first three panels of Fig. 1 with magenta and cyan solid lines, respectively. Here one can see that our abundance matching method does not introduce any obvious bias.
2.3.2 The central SMHMR-halo formation time relation
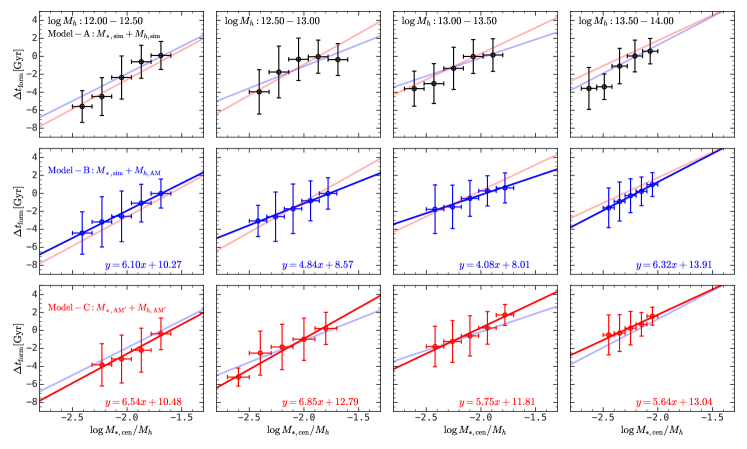
Fig. 2 shows the mean as a function of central SMHMRs, as well as the standard deviation. The top/middle/bottom panels show the results in Model-A/Model-B/Model-C. Here one can see that all three models predict very similar scaling relations that halos with higher central SMHMR are formed earlier. These results indicate that the central SMHMR-halo formation time relation does not depend on the specific implementation of baryonic physics in hydrodynamical simulations. Instead, this correlation can be explained by the hierarchical structure formation scenario, where early-formed halos have more time for their central galaxies to merge with their satellites. We also fit the scaling relations between central SMHMRs and with linear functions for Model-B and Model-C, and present them with blue and red lines, respectively.
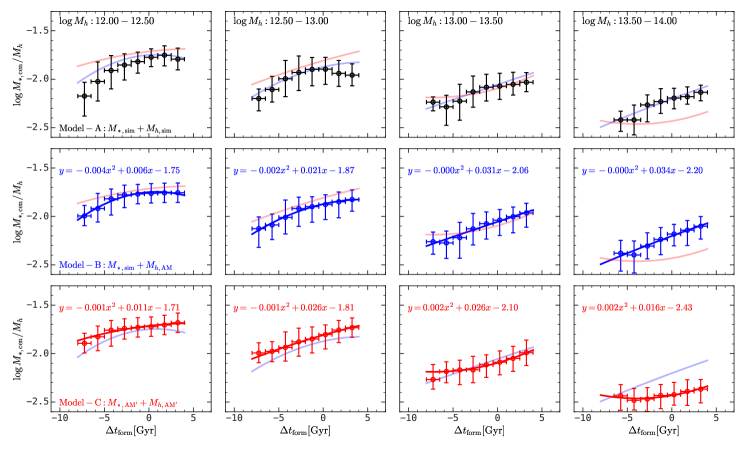
Fig. 3 shows the median central SMHMR as a function of in four halo mass bins for three models. The scaling relations in Model-B and Model-C are fitted with quadratic polynomials, which are shown in blue and red solid curves. Here one can see that all three models predict that early-formed halos have higher central SMHMRs and the scaling relations are similar, except for massive halos in Model-C. The discrepancies between Model-C and Model-B/Model-A are attributed to the difference in their stellar mass functions, where TNG300 underestimated the amplitude of stellar mass functions due to its relatively low resolution (Pillepich et al., 2018b). We also checked the relation using the EAGLE simulation and presented the result in appendix A, which agrees well with our results here.
It is noteworthy that our results on the positive correlation between halo formation time and SMHMRs is consistent with previous studies on galaxy assembly bias (e.g. Zentner et al., 2014; Hearin et al., 2016; Mao et al., 2018; Wang et al., 2019; Zu et al., 2021), which is the dependence of the halo occupation of galaxies on secondary properties of dark matter halos manifested in their spatial distributions. Zentner et al. (2019) found that high-concentration halos prefer to host more luminous central galaxies compared with their low-concentration counterparts of the same halo mass through a comprehensive Bayesian analysis; a similar conclusion is obtained in Wang et al. (2022) by combining several spatial summary statistics. In this paper, we use the group-based statistic, i.e. SMHMR, and obtain consistent results based on three different models, supporting previous findings.
3 Applications to real data
In the previous section, we established the relationship between central SMHMRs and halo formation time using three different models, from the physical hydrodynamical simulation to the empirical statistical model. All these models produce similar results that halos with higher central SMHMRs are formed earlier, and vice versa. These results illustrate that the relation between halo formation time and the central SMHMRs does not rely on the specific implementation of galaxy formation models nor specific subgrid recipes (see Appendix A). With these scaling relations, we can use the central SMHMR as a proxy of halo formation time and study its relation with central galaxy properties in our real Universe.
3.1 Observational data
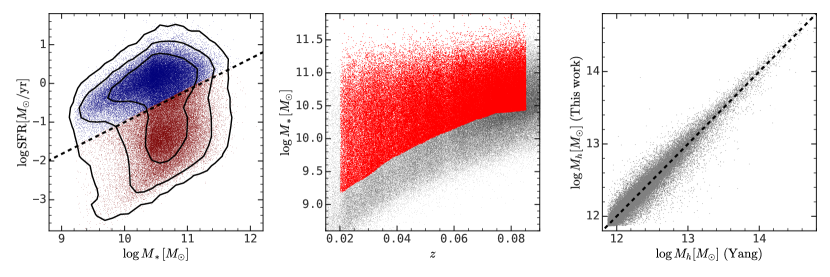
Here we use the GALEX-SDSS-WISE Legacy Catalog (GSWLC) (Salim et al., 2016, 2018), which is constructed from the Sloan Digital Sky Survey (SDSS) main galaxy sample (MGS) (York et al., 2000; Blanton et al., 2005; Abazajian et al., 2009). The SDSS MGS is a magnitude-limited spectroscopic survey with and covers . The stellar mass and the star formation rate (SFR) are estimated from the UV-optical-IR bands photometry using the CIGALE code (Noll et al., 2009; Boquien et al., 2019) with the stellar library of Bruzual & Charlot (2003) and the initial mass function of Chabrier (2003). The left panel of Fig. 4 shows the distribution of galaxies on the plane. We further separate galaxies into the star-forming and quiescent populations according to that whether the SFR is more than 1 dex below the star-forming main sequence (see Wang et al., 2023a; Woo et al., 2013). The separation line is
| (2) |
and shown as the black dashed line on the left panel of Fig. 4.
Based on the GSWLC catalog, we constructed a -limited sample using the method in Wang et al. (2023a) (see also Pozzetti et al., 2010). They are shown in red points on the right panel of Fig. 4 where the black dashed line shows the minimal stellar mass we can probe at each redshift. We also weigh each galaxy with where is the volume between and , which is inferred from the mass-limited envelope calculated above according to the stellar mass of each galaxy.
We use the morphology classification from the Galaxy Zoo project333https://data.galaxyzoo.org/ (Lintott et al., 2011). Through Galaxy Zoo, galaxies are classified into different categories of morphology according to their visual image by citizen scientists, and each galaxy has more than 20 votes. Then a flag, i.e. spiral, elliptical, or uncertain, is assigned to each galaxy according to the note frequency corrected with a debiasing process (Bamford et al., 2009). Here we define spiral galaxies as those with the flag of SPIRAL set to unity.
We use the group catalog of Yang et al. (2007) to select central galaxies as the most massive one in each galaxy group. The halo mass is calibrated by abundance-matching the total stellar mass with theoretical halo mass function, where the stellar mass estimation is based on Bell et al. (2003). For the consistency of the stellar mass estimation, we recalibrate the halo mass for each group using the abundance matching method according to the rank of the sum of stellar mass estimated in Salim et al. (2016), which is
| (3) |
where the left hand is the cumulative halo mass function and the right hand is the cumulative total stellar mass function. The right panel of Fig. 4 shows the comparison between the halo mass in Yang et al. (2007) and our recalibrated ones. In appendix C, we demonstrated the importance of the halo mass recalibration to avoid bias, especially for low-mass groups.
3.2 The dependence of central galaxy properties on halo formation time
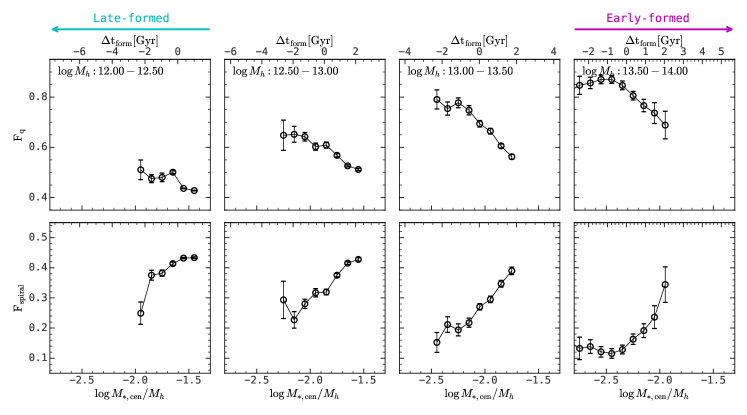
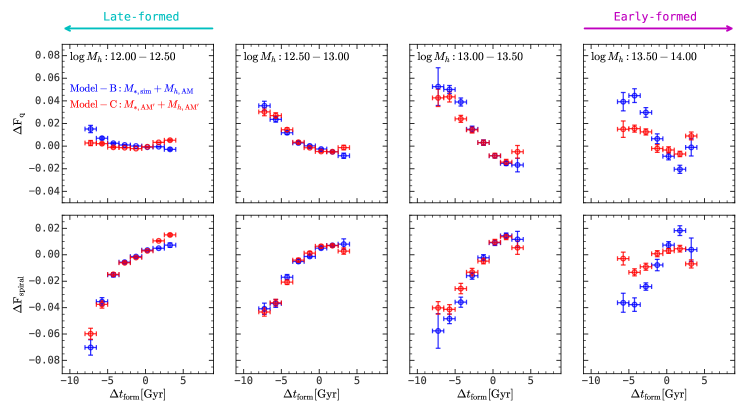
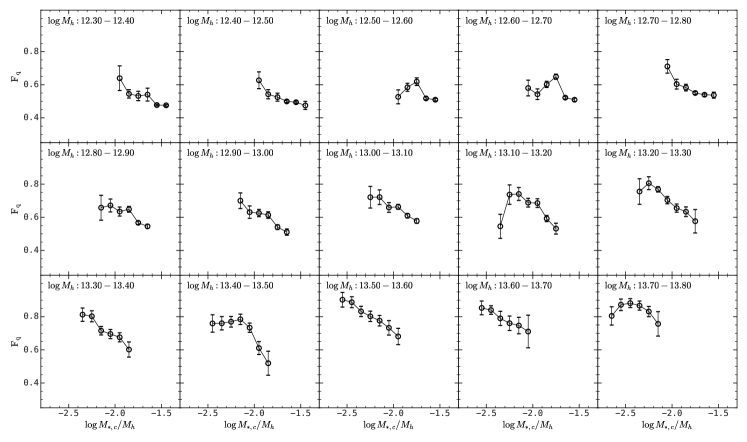
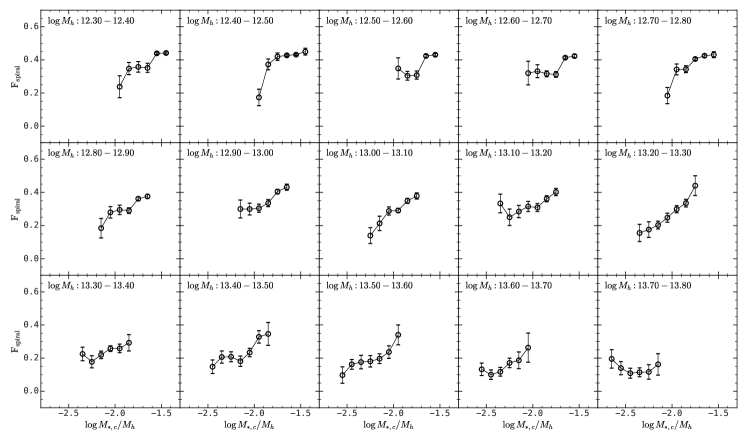
Fig. 5 shows the quiescent fraction and the spiral fraction of central galaxies as a function of central SMHMRs in four halo mass bins. As one can see, for the whole halo mass range, central galaxies with low SMHMRs are more quenched and have lower spiral fractions than those with high SMHMRs. The difference in the quiescent fraction ranges from to , while the difference in the spiral fraction is about across the whole halo mass range in question. It is noteworthy that we are using a broad halo mass bin width for better statistics. We also checked the results using finer halo mass bins in appendix B, and the trend is consistent with the results shown here.
On the top x-axis of Fig. 5, we also show , which is converted from the central SMHMR using the scaling relation calibrated in Model-C (see bottom panels in Fig. 2). One can see that halos with low central SMHMRs, which are formed late, are not only more quiescent, but also have a lower fraction of spiral morphology. The range of the halo formation time we can probe is Gyr in each halo mass bin. We note that the results in Fig. 5 cannot be simply interpreted as the dependence of the quiescent fraction and the spiral fraction on the halo formation time, because the scaling relation between and the central SMHMR has a non-negligible scatter.
To derive the dependence of central galaxy properties on the formation time of their host halos more strictly, we must consider the scatter in the scaling relation of central SMHMRs and halo formation time. To this end, we can express the distribution of central galaxy properties, , as a function of halo formation time, , as
| (4) |
where represents the quiescent fraction or the spiral fraction, is the central SMHMR, and is the halo formation time defined in equation (1). We note that all of the probability distributions above are conditioned on halo mass, and we omit it for clarity. The final step of the above derivation is based on the assumption that , which assumes that the impact of the halo formation time on the star formation activities and morphologies of central galaxies is only through the central SMHMR.
Based on the above derivation, we can calculate the quiescent fraction and the spiral fraction of central galaxies as a function of the formation time of their host halos. We start with all of the FoF halos in the TNG300 simulation, where each halo has a halo mass and a central stellar mass assigned in Model-B (or Model-C), as well as a halo formation time, , calculated with equation (1). For each halo, we can calculate its central SMHMR, , which is used to read a value of mean quiescent/spiral fraction and the associated scatter from Fig. 5 in the corresponding halo mass bin. Then we generate a quiescent/spiral fraction for the halo in question from a normal distribution with a mean of and a scatter of . Finally, we can calculate the mean quiescent/spiral fraction for halos with given halo masses and . The result is shown in Fig. 6, which shows the residual with respect to the mean quiescent/spiral fraction in each halo mass bin. The blue (red) symbols are results with Model-B (Model-C), where both models produce very similar results. Here one can see that central galaxies in late-formed halos are more quiescent and have a lower fraction of spiral morphology than their early-formed counterparts. The difference in the quiescent fraction is about for halos with , and the difference in the spiral fraction is about across the whole halo range in question.
The relation between halo formation time and central galaxy properties can also manifest itself as the difference in the formation time for halos with star-forming/spiral and quiescent/non-spiral central galaxies. We present the result in appendix C, which shows that halos with star-forming/spiral central galaxies are formed earlier than their quiescent/non-spiral counterparts by Gyr.
3.3 Impact of the group finding algorithm
Since dark matter halos are difficult to be detected observationally, we rely on the group finding algorithm to construct the group catalog (e.g. Eke et al., 2004; Yang et al., 2005; Berlind et al., 2006; Knobel et al., 2012; Wang et al., 2020). The performance of the halo-based group finder is tested in many previous studies (e.g. Yang et al., 2005; Yang et al., 2007; Lu et al., 2016; Lim et al., 2017; Yang et al., 2021), which shows that it can recover the input galaxy groups with high completeness and purity, and calibrate the halo mass of galaxy groups to high accuracy, based on the mock test. Nevertheless, this group finder is poorly tested on the performance in recovering color/SFR-related statistics (Campbell et al., 2015), like the quiescent fraction, which might jeopardize our conclusions in this paper. Here we want to examine if this contamination can bias our results. To this end, we applied the group finding algorithm to a mock galaxy catalog and see whether the relation between central SMHMRs and quiescent fractions of central galaxies is biased.
The mock survey is constructed based on the N-body simulation of ELUCID (Wang et al., 2014, 2016), which is a constrained simulation with a box volume of and dark matter particles. Dark matter halos are identified with the FoF method and subhalos are identified with the SUBFIND algorithm (Springel et al., 2001). The stellar mass and star formation rate are assigned to each subhalo according to the empirical model of MAHGIC, which is trained on the IllustrisTNG simulation (see Chen et al., 2021a; Chen et al., 2021b, for more details). Here we only use galaxies with . The most massive galaxy in each FoF halo is defined as the central one, while others are satellites. The redshift-space position for each galaxy is generated using the method in Chen et al. (2019).
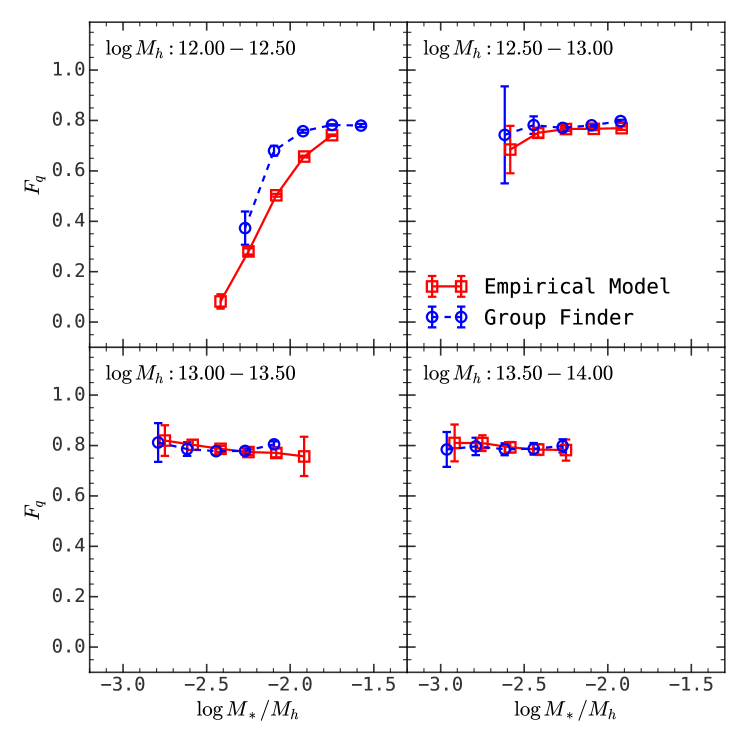
For each FoF halo in the mock volume, we re-assign its halo mass using the abundance matching method according to the rank of the total stellar mass in this halo (see equation (3)). Then we calculate the fraction of quiescent galaxies, which is defined as those with , as a function of central SMHMR in four halo mass bins. The results are shown in red squares in Fig. 7.
Then, we applied the halo-based group-finding algorithm in Yang et al. (2021) to these mock galaxies and constructed a galaxy group catalog (see also Lu et al., 2016; Lim et al., 2017; Yang et al., 2021; Li et al., 2022). For each identified galaxy group, the halo mass is assigned with the abundance matching method according to the rank of the total stellar mass in each group, and the central galaxy is defined as the one with the largest stellar mass. Finally, we can plot the quiescent fraction as a function of central SMHMRs in four halo mass bins based on the identified galaxy group catalog, and the result is shown with blue circles in Fig. 7. As one can see, these two results are very similar to each other, indicating that the group-finding algorithm cannot bias this relation.
4 Summary
It is generally believed that the star formation activities of galaxies are regulated by the formation histories of their host halos. However, this correlation is difficult to be verified observationally for two reasons. First, the correlation between galaxy properties and the assembly histories of dark matter halos is a secondary effect, while the primary correlation is the stellar mass-halo mass relation. Second, the halo formation histories are not observable, and finding a model-independent proxy is not trivial. In this paper, we devised three different models, from the physical hydrodynamical simulation to the empirical statistical model, to demonstrate the robustness of using the central stellar mass to halo mass ratio, i.e. central SMHMR, as a proxy of halo formation time. Then, we made use of the large galaxy sample from SDSS MGS, together with the physical quantities from the GSWLC catalog and the group catalog constructed by the halo-based group finder, to infer the relation between the central galaxy properties and the formation time of their host halos. Our main results are summarized as follows:
-
1.
We established the relation between central SMHMRs and halo formation time, where early-formed halos have higher central SMHMRs than their late-formed counterparts. This relation is tested on three models, from the physical hydrodynamical simulation to the empirical statistical model. All three models produce similar scaling relations, supporting the robustness of the central SMHMR as a halo formation time proxy. (see Fig. 2 and 3).
-
2.
Using the galaxy group catalog constructed on the SDSS MGS sample, we inferred the dependence of the central galaxy properties on the central SMHMRs. And we found that halos with high SMHMRs have a higher fraction of star-forming/spiral central galaxies than their counterparts with low SMHMRs (see Fig. 5).
-
3.
We derived the dependence of the quiescent fraction and the spiral fraction on the formation time of their host halos. We found that central galaxies in late-formed halos have higher fractions of quiescence and lower fractions of spiral morphology by than their early-formed counterparts (see Fig. 6).
-
4.
By applying the halo-based group-finding algorithm to a mock catalog, we found that it does not introduce any obvious bias into the relation between the quiescent fraction of central galaxies and the central SMHMRs (see Fig. 7).
Our results provide the first quantification of the relationship between central galaxy properties and the formation time of their halos. This relationship can be further tested using alternative halo formation time proxies, like the stellar mass gap and the spatial distribution of satellite galaxies (Dariush et al., 2010; Farahi et al., 2020; Golden-Marx et al., 2022; Wechsler et al., 2002). Meanwhile, these results can be compared with state-of-the-art hydrodynamical cosmological simulations, like IllustrisTNG (Pillepich et al., 2018a; Nelson et al., 2019), EAGLE (Schaye et al., 2015), and SIMBA (Davé et al., 2019), and test their different implementations of subgrid physics, which will be presented in the subsequent paper.
Acknowledgements
KW sincerely thanks Prof. Houjun Mo and Prof. Cheng Li for their helpful discussions. This work is supported by the National Science Foundation of China (NSFC) Grant No. 12125301, 12192220, 12192222, and the science research grants from the China Manned Space Project with NO. CMS-CSST-2021- A07.
The authors acknowledge the Tsinghua Astrophysics High-Performance Computing platform at Tsinghua University for providing computational and data storage resources that have contributed to the research results reported within this paper.
Funding for the SDSS and SDSS-II has been provided by the Alfred P. Sloan Foundation, the Participating Institutions, the National Science Foundation, the U.S. Department of Energy, the National Aeronautics and Space Administration, the Japanese Monbukagakusho, the Max Planck Society, and the Higher Education Funding Council for England. The SDSS Web Site is http://www.sdss.org/.
The SDSS is managed by the Astrophysical Research Consortium for the Participating Institutions. The Participating Institutions are the American Museum of Natural History, Astrophysical Institute Potsdam, University of Basel, University of Cambridge, Case Western Reserve University, University of Chicago, Drexel University, Fermilab, the Institute for Advanced Study, the Japan Participation Group, Johns Hopkins University, the Joint Institute for Nuclear Astrophysics, the Kavli Institute for Particle Astrophysics and Cosmology, the Korean Scientist Group, the Chinese Academy of Sciences (LAMOST), Los Alamos National Laboratory, the Max-Planck-Institute for Astronomy (MPIA), the Max-Planck-Institute for Astrophysics (MPA), New Mexico State University, Ohio State University, University of Pittsburgh, University of Portsmouth, Princeton University, the United States Naval Observatory, and the University of Washington.
Data availability
The data underlying this article will be shared on reasonable request to the corresponding author. The computation in this work is supported by the HPC toolkit hipp at https://github.com/ChenYangyao/hipp.
References
- Abazajian et al. (2009) Abazajian K. N., et al., 2009, The Astrophysical Journal Supplement Series, 182, 543
- Bamford et al. (2009) Bamford S. P., et al., 2009, Monthly Notices of the Royal Astronomical Society, 393, 1324
- Behroozi et al. (2013) Behroozi P. S., Wechsler R. H., Conroy C., 2013, The Astrophysical Journal, 770, 57
- Behroozi et al. (2019) Behroozi P., Wechsler R. H., Hearin A. P., Conroy C., 2019, Monthly Notices of the Royal Astronomical Society, 488, 3143
- Bell et al. (2003) Bell E. F., McIntosh D. H., Katz N., Weinberg M. D., 2003, The Astrophysical Journal Supplement Series, 149, 289
- Berlind et al. (2003) Berlind A. A., et al., 2003, The Astrophysical Journal, 593, 1
- Berlind et al. (2006) Berlind A. A., et al., 2006, The Astrophysical Journal Supplement Series, 167, 1
- Birnboim & Dekel (2003) Birnboim Y., Dekel A., 2003, Monthly Notices of the Royal Astronomical Society, 345, 349
- Blanton et al. (2005) Blanton M. R., et al., 2005, The Astronomical Journal, 129, 2562
- Boquien et al. (2019) Boquien M., Burgarella D., Roehlly Y., Buat V., Ciesla L., Corre D., Inoue A. K., Salas H., 2019, Astronomy and Astrophysics, 622, A103
- Bradshaw et al. (2020) Bradshaw C., Leauthaud A., Hearin A., Huang S., Behroozi P., 2020, Monthly Notices of the Royal Astronomical Society, 493, 337
- Bruzual & Charlot (2003) Bruzual G., Charlot S., 2003, Monthly Notices of the Royal Astronomical Society, 344, 1000
- Campbell et al. (2015) Campbell D., van den Bosch F. C., Hearin A., Padmanabhan N., Berlind A., Mo H. J., Tinker J., Yang X., 2015, Monthly Notices of the Royal Astronomical Society, 452, 444
- Ceverino & Klypin (2009) Ceverino D., Klypin A., 2009, The Astrophysical Journal, 695, 292
- Chabrier (2003) Chabrier G., 2003, Publications of the Astronomical Society of the Pacific, 115, 763
- Chen et al. (2019) Chen Y., Mo H. J., Li C., Wang H., Yang X., Zhou S., Zhang Y., 2019, The Astrophysical Journal, 872, 180
- Chen et al. (2020) Chen Y., Mo H. J., Li C., Wang H., Yang X., Zhang Y., Wang K., 2020, The Astrophysical Journal, 899, 81
- Chen et al. (2021a) Chen Y., Mo H. J., Li C., Wang K., 2021a, Monthly Notices of the Royal Astronomical Society, 504, 4865
- Chen et al. (2021b) Chen Y., Mo H. J., Li C., Wang K., Wang H., Yang X., Zhang Y., Katz N., 2021b, Monthly Notices of the Royal Astronomical Society, 507, 2510
- Cole et al. (2000) Cole S., Lacey C. G., Baugh C. M., Frenk C. S., 2000, Monthly Notices of the Royal Astronomical Society, 319, 168
- Collaboration et al. (2014) Collaboration P., et al., 2014, Astronomy and Astrophysics, 571, A1
- Correa & Schaye (2020) Correa C. A., Schaye J., 2020, Monthly Notices of the Royal Astronomical Society, 499, 3578
- Croton et al. (2006) Croton D. J., et al., 2006, Monthly Notices of the Royal Astronomical Society, 365, 11
- Cui et al. (2021) Cui W., Davé R., Peacock J. A., Anglés-Alcázar D., Yang X., 2021, Nature Astronomy, 5, 1069
- Dariush et al. (2010) Dariush A. A., Raychaudhury S., Ponman T. J., Khosroshahi H. G., Benson A. J., Bower R. G., Pearce F., 2010, Monthly Notices of the Royal Astronomical Society, 405, 1873
- Davé et al. (2016) Davé R., Thompson R., Hopkins P. F., 2016, Monthly Notices of the Royal Astronomical Society, 462, 3265
- Davé et al. (2019) Davé R., Anglés-Alcázar D., Narayanan D., Li Q., Rafieferantsoa M. H., Appleby S., 2019, Monthly Notices of the Royal Astronomical Society, 486, 2827
- Davies et al. (2020) Davies J. J., Crain R. A., Oppenheimer B. D., Schaye J., 2020, Monthly Notices of the Royal Astronomical Society, 491, 4462
- Davies et al. (2021) Davies J. J., Crain R. A., Pontzen A., 2021, Monthly Notices of the Royal Astronomical Society, 501, 236
- De Lucia & Blaizot (2007) De Lucia G., Blaizot J., 2007, Monthly Notices of the Royal Astronomical Society, 375, 2
- Dekel & Silk (1986) Dekel A., Silk J., 1986, The Astrophysical Journal, 303, 39
- Eke et al. (2004) Eke V. R., et al., 2004, Monthly Notices of the Royal Astronomical Society, 348, 866
- Fabian (2012) Fabian A. C., 2012, Annual Review of Astronomy and Astrophysics, 50, 455
- Farahi et al. (2020) Farahi A., Ho M., Trac H., 2020, Monthly Notices of the Royal Astronomical Society, 493, 1361
- Gao et al. (2005) Gao L., Springel V., White S. D. M., 2005, Monthly Notices of the Royal Astronomical Society: Letters, 363, L66
- Golden-Marx et al. (2022) Golden-Marx J. B., et al., 2022, The Astrophysical Journal, 928, 28
- Guo et al. (2011) Guo Q., et al., 2011, Monthly Notices of the Royal Astronomical Society, 413, 101
- Hearin & Watson (2013) Hearin A. P., Watson D. F., 2013, Monthly Notices of the Royal Astronomical Society, 435, 1313
- Hearin et al. (2014) Hearin A. P., Watson D. F., Becker M. R., Reyes R., Berlind A. A., Zentner A. R., 2014, Monthly Notices of the Royal Astronomical Society, 444, 729
- Hearin et al. (2016) Hearin A. P., Zentner A. R., van den Bosch F. C., Campbell D., Tollerud E., 2016, Monthly Notices of the Royal Astronomical Society, 460, 2552
- Henriques et al. (2015) Henriques B. M. B., White S. D. M., Thomas P. A., Angulo R., Guo Q., Lemson G., Springel V., Overzier R., 2015, Monthly Notices of the Royal Astronomical Society, 451, 2663
- Jing (2000) Jing Y. P., 2000, The Astrophysical Journal, 535, 30
- Jing et al. (1998) Jing Y. P., Mo H. J., Börner G., 1998, The Astrophysical Journal, 494, 1
- Kang et al. (2005) Kang X., Jing Y. P., Mo H. J., Borner G., 2005, The Astrophysical Journal, 631, 21
- Kauffmann et al. (1993) Kauffmann G., White S. D. M., Guiderdoni B., 1993, Monthly Notices of the Royal Astronomical Society, 264, 201
- Kereš et al. (2005) Kereš D., Katz N., Weinberg D. H., Davé R., 2005, Monthly Notices of the Royal Astronomical Society, 363, 2
- Knobel et al. (2012) Knobel C., et al., 2012, The Astrophysical Journal, 753, 121
- Kravtsov et al. (2004) Kravtsov A. V., Berlind A. A., Wechsler R. H., Klypin A. A., Gottlöber S., Allgood B., Primack J. R., 2004, The Astrophysical Journal, 609, 35
- Li et al. (2008) Li Y., Mo H. J., Gao L., 2008, Monthly Notices of the Royal Astronomical Society, 389, 1419
- Li et al. (2022) Li Q., et al., 2022, The Astrophysical Journal, 933, 9
- Lim et al. (2016) Lim S. H., Mo H. J., Wang H., Yang X., 2016, Monthly Notices of the Royal Astronomical Society, 455, 499
- Lim et al. (2017) Lim S. H., Mo H. J., Lu Y., Wang H., Yang X., 2017, Monthly Notices of the Royal Astronomical Society, 470, 2982
- Lintott et al. (2011) Lintott C., et al., 2011, Monthly Notices of the Royal Astronomical Society, 410, 166
- Lu et al. (2014) Lu Z., Mo H. J., Lu Y., Katz N., Weinberg M. D., van den Bosch F. C., Yang X., 2014, Monthly Notices of the Royal Astronomical Society, 439, 1294
- Lu et al. (2016) Lu Y., et al., 2016, The Astrophysical Journal, 832, 1
- Mandelbaum et al. (2006) Mandelbaum R., Seljak U., Cool R. J., Blanton M., Hirata C. M., Brinkmann J., 2006, Monthly Notices of the Royal Astronomical Society, 372, 758
- Mandelbaum et al. (2016) Mandelbaum R., Wang W., Zu Y., White S., Henriques B., More S., 2016, Monthly Notices of the Royal Astronomical Society, 457, 3200
- Mao et al. (2018) Mao Y.-Y., Zentner A. R., Wechsler R. H., 2018, Monthly Notices of the Royal Astronomical Society, 474, 5143
- Marinacci et al. (2018) Marinacci F., et al., 2018, Monthly Notices of the Royal Astronomical Society, 480, 5113
- Matthee & Schaye (2019) Matthee J., Schaye J., 2019, Monthly Notices of the Royal Astronomical Society, 484, 915
- Meng et al. (2020) Meng J., Li C., Mo H., Chen Y., Wang K., 2020, arXiv:2008.13733 [astro-ph]
- Mo & White (1996) Mo H. J., White S. D. M., 1996, Monthly Notices of the Royal Astronomical Society, 282, 347
- Mo et al. (2010) Mo H., Van den Bosch F., White S., 2010, Galaxy Formation and Evolution. Cambridge University Press, Cambridge ; New York
- More et al. (2011) More S., van den Bosch F. C., Cacciato M., Skibba R., Mo H. J., Yang X., 2011, Monthly Notices of the Royal Astronomical Society, 410, 210
- Moster et al. (2013) Moster B. P., Naab T., White S. D. M., 2013, Monthly Notices of the Royal Astronomical Society, 428, 3121
- Moster et al. (2018) Moster B. P., Naab T., White S. D. M., 2018, Monthly Notices of the Royal Astronomical Society, 477, 1822
- Moustakas et al. (2013) Moustakas J., et al., 2013, The Astrophysical Journal, 767, 50
- Nadler et al. (2023) Nadler E. O., et al., 2023, The Astrophysical Journal, 945, 159
- Naiman et al. (2018) Naiman J. P., et al., 2018, Monthly Notices of the Royal Astronomical Society, 477, 1206
- Navarro et al. (1997) Navarro J. F., Frenk C. S., White S. D. M., 1997, The Astrophysical Journal, 490, 493
- Nelson et al. (2018) Nelson D., et al., 2018, Monthly Notices of the Royal Astronomical Society, 475, 624
- Nelson et al. (2019) Nelson D., et al., 2019, Computational Astrophysics and Cosmology, 6, 2
- Noll et al. (2009) Noll S., Burgarella D., Giovannoli E., Buat V., Marcillac D., Muñoz-Mateos J. C., 2009, Astronomy and Astrophysics, 507, 1793
- Pillepich et al. (2018a) Pillepich A., et al., 2018a, Monthly Notices of the Royal Astronomical Society, 473, 4077
- Pillepich et al. (2018b) Pillepich A., et al., 2018b, Monthly Notices of the Royal Astronomical Society, 475, 648
- Planck Collaboration et al. (2016) Planck Collaboration et al., 2016, Astronomy & Astrophysics, 594, A13
- Posti & Fall (2021) Posti L., Fall S. M., 2021, Astronomy and Astrophysics, 649, A119
- Posti et al. (2019) Posti L., Fraternali F., Marasco A., 2019, Astronomy and Astrophysics, 626, A56
- Pozzetti et al. (2010) Pozzetti L., et al., 2010, Astronomy & Astrophysics, 523, A13
- Reddick et al. (2013) Reddick R. M., Wechsler R. H., Tinker J. L., Behroozi P. S., 2013, The Astrophysical Journal, 771, 30
- Rodriguez-Gomez et al. (2015) Rodriguez-Gomez V., et al., 2015, Monthly Notices of the Royal Astronomical Society, 449, 49
- Salim et al. (2016) Salim S., et al., 2016, The Astrophysical Journal Supplement Series, 227, 2
- Salim et al. (2018) Salim S., Boquien M., Lee J. C., 2018, The Astrophysical Journal, 859, 11
- Schaye et al. (2015) Schaye J., et al., 2015, Monthly Notices of the Royal Astronomical Society, 446, 521
- Somerville & Primack (1999) Somerville R. S., Primack J. R., 1999, Monthly Notices of the Royal Astronomical Society, 310, 1087
- Springel et al. (2001) Springel V., White S. D. M., Tormen G., Kauffmann G., 2001, Monthly Notices of the Royal Astronomical Society, 328, 726
- Springel et al. (2018) Springel V., et al., 2018, Monthly Notices of the Royal Astronomical Society, 475, 676
- Tojeiro et al. (2017) Tojeiro R., et al., 2017, Monthly Notices of the Royal Astronomical Society, 470, 3720
- Vale & Ostriker (2004) Vale A., Ostriker J. P., 2004, Monthly Notices of the Royal Astronomical Society, 353, 189
- Vogelsberger et al. (2013) Vogelsberger M., Genel S., Sijacki D., Torrey P., Springel V., Hernquist L., 2013, Monthly Notices of the Royal Astronomical Society, 436, 3031
- Wang et al. (2011) Wang H., Mo H. J., Jing Y. P., Yang X., Wang Y., 2011, Monthly Notices of the Royal Astronomical Society, 413, 1973
- Wang et al. (2014) Wang H., Mo H. J., Yang X., Jing Y. P., Lin W. P., 2014, The Astrophysical Journal, 794, 94
- Wang et al. (2016) Wang H., et al., 2016, The Astrophysical Journal, 831, 164
- Wang et al. (2019) Wang K., et al., 2019, Monthly Notices of the Royal Astronomical Society, 488, 3541
- Wang et al. (2020) Wang K., Mo H. J., Li C., Meng J., Chen Y., 2020, Monthly Notices of the Royal Astronomical Society, 499, 89
- Wang et al. (2022) Wang K., Mao Y.-Y., Zentner A. R., Guo H., Lange J. U., van den Bosch F. C., Mezini L., 2022, Monthly Notices of the Royal Astronomical Society, 516, 4003
- Wang et al. (2023a) Wang K., Peng Y., Chen Y., 2023a, arXiv e-prints, p. arXiv:2304.06886
- Wang et al. (2023b) Wang K., Mo H., Li C., Chen Y., 2023b, Monthly Notices of the Royal Astronomical Society, 520, 1774
- Watson et al. (2015) Watson D. F., et al., 2015, Monthly Notices of the Royal Astronomical Society, 446, 651
- Wechsler & Tinker (2018) Wechsler R. H., Tinker J. L., 2018, Annual Review of Astronomy and Astrophysics, 56, 435
- Wechsler et al. (2002) Wechsler R. H., Bullock J. S., Primack J. R., Kravtsov A. V., Dekel A., 2002, The Astrophysical Journal, 568, 52
- Wechsler et al. (2006) Wechsler R. H., Zentner A. R., Bullock J. S., Kravtsov A. V., Allgood B., 2006, The Astrophysical Journal, 652, 71
- Weinberger et al. (2017) Weinberger R., et al., 2017, Monthly Notices of the Royal Astronomical Society, 465, 3291
- White & Frenk (1991) White S. D. M., Frenk C. S., 1991, The Astrophysical Journal, 379, 52
- White & Rees (1978) White S. D. M., Rees M. J., 1978, Monthly Notices of the Royal Astronomical Society, 183, 341
- Woo et al. (2013) Woo J., et al., 2013, Monthly Notices of the Royal Astronomical Society, 428, 3306
- Wright et al. (2021) Wright R. J., Lagos C. d. P., Power C., Correa C. A., 2021, Monthly Notices of the Royal Astronomical Society, 504, 5702
- Yang et al. (2003) Yang X., Mo H. J., van den Bosch F. C., 2003, Monthly Notices of the Royal Astronomical Society, 339, 1057
- Yang et al. (2005) Yang X., Mo H. J., van den Bosch F. C., Jing Y. P., 2005, Monthly Notices of the Royal Astronomical Society, 356, 1293
- Yang et al. (2007) Yang X., Mo H. J., van den Bosch F. C., Pasquali A., Li C., Barden M., 2007, The Astrophysical Journal, 671, 153
- Yang et al. (2021) Yang X., et al., 2021, The Astrophysical Journal, 909, 143
- York et al. (2000) York D. G., et al., 2000, The Astronomical Journal, 120, 1579
- Zentner et al. (2014) Zentner A. R., Hearin A. P., van den Bosch F. C., 2014, Monthly Notices of the Royal Astronomical Society, 443, 3044
- Zentner et al. (2019) Zentner A. R., Hearin A., van den Bosch F. C., Lange J. U., Villarreal A. S., 2019, Monthly Notices of the Royal Astronomical Society, 485, 1196
- Zhang et al. (2021) Zhang Y., Yang X., Guo H., 2021, Monthly Notices of the Royal Astronomical Society, 507, 5320
- Zhang et al. (2022) Zhang Z., Wang H., Luo W., Zhang J., Mo H. J., Jing Y., Yang X., Li H., 2022, Astronomy and Astrophysics, 663, A85
- Zheng et al. (2005) Zheng Z., et al., 2005, The Astrophysical Journal, 633, 791
- Zu et al. (2021) Zu Y., et al., 2021, Monthly Notices of the Royal Astronomical Society, 505, 5117
- van de Voort et al. (2011) van de Voort F., Schaye J., Booth C. M., Haas M. R., Dalla Vecchia C., 2011, Monthly Notices of the Royal Astronomical Society, 414, 2458
Appendix A The central SMHMR-halo formation time relation in the EAGLE simulation
Here we show the central SMHMR-halo formation time relation in the EAGLE simulation (Schaye et al., 2015). In this paper, we use the simulation identified as Ref-L0100N1504, which contains particles in a box. The gas particle mass and the stellar particle mass are and , respectively. The simulation adopted a flat CDM cosmology from the Planck mission (Collaboration et al., 2014), and the cosmological parameters are , , , , and . The halo formation time is defined in the same way as in the TNG simulation. The stellar mass we use is the sum of all stellar particles within 30 physical kpc.
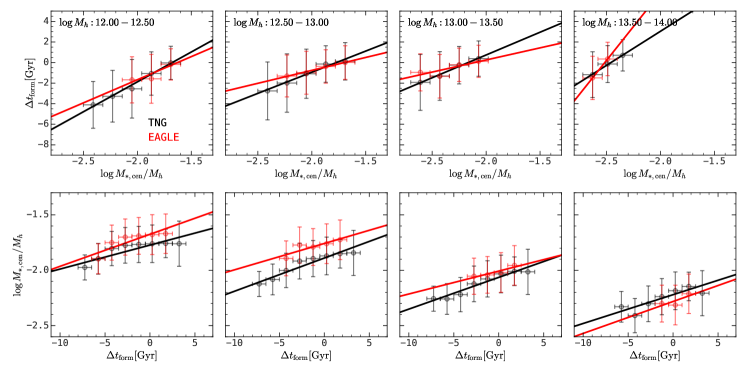
Fig. 8 shows the relation between central SMHMRs and halo formation time for TNG and EAGLE. One can see that both models predict that early-formed halos have higher central SMHMRs than their late-formed counterparts and vice versa. The discrepancy between these two models is due to the difference in their stellar mass definition and the implementations of subgrid physics. It is noteworthy to point out that our results have also been tested on Model-C, which is totally empirical.
Appendix B Dependence of central galaxy properties on central SMHMR in fine halo mass bins
The quiescent fraction and the spiral fraction of central galaxies in Fig. 5 are in broad halo mass bins with 0.5 dex width for better statistics. Here Fig. 9 and 10 show the results in finer halo mass bins with 0.1 dex width, and one can see that the dependence of the quiescent fraction and the spiral fraction on central SMHMRs is consistent with Fig. 5.
Appendix C Dependence of halo formation time on central galaxy properties
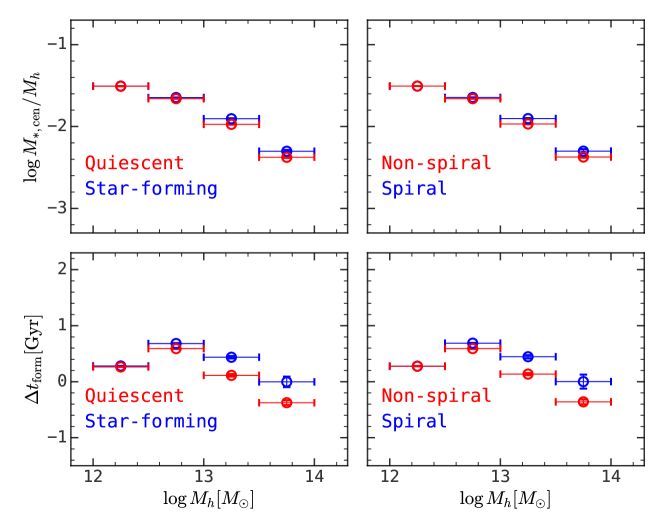
In § 3.2, we showed that late-formed halos prefer to host quiescent and non-spiral central galaxies. The correlation between the halo formation time and the central galaxy properties can also be demonstrated by examining if the quiescent and non-spiral central galaxies prefer to live in late-formed halos. Top panels in Fig. 11 show the median SMHMR for quiescent/star-forming and non-spiral/spiral central galaxies with errors estimated using the bootstrap method. Here one can see that more massive halos have lower central SMHMR, and the central SMHMR only has a minor dependence on the properties of central galaxies. Nevertheless, one can still see that star-forming/spiral central galaxies tend to have higher central SMHMRs than those quiescent/non-spiral ones. This result is consistent with previous studies where they found that massive star-forming galaxies have higher central SMHMR (Zhang et al., 2022), and massive spiral galaxies also have higher central SMHMR (Posti et al., 2019).
Here we can convert the central SMHMR to the halo formation time using the linear fitting functions shown in Fig. 2, and infer the difference in the halo formation time for halos with different central galaxy properties. The results are shown on the bottom panels of Fig. 11, where one can see that massive halos with star-forming or spiral-like central galaxies are formed early by Gyr. We note that the halo formation time difference between star-forming/spiral and quiescent/non-spiral central galaxies is underestimated here for two reasons. First, from Fig. 3, one can see that the correlation between the central SMHMR and the halo formation time is stronger for Model-A, which means that our heuristic abundance matching method missed some correlation between these two quantities. Second, due to the observational limits, some low-mass halos in observation only have one member galaxy, which produces no difference in their calibrated halo mass.
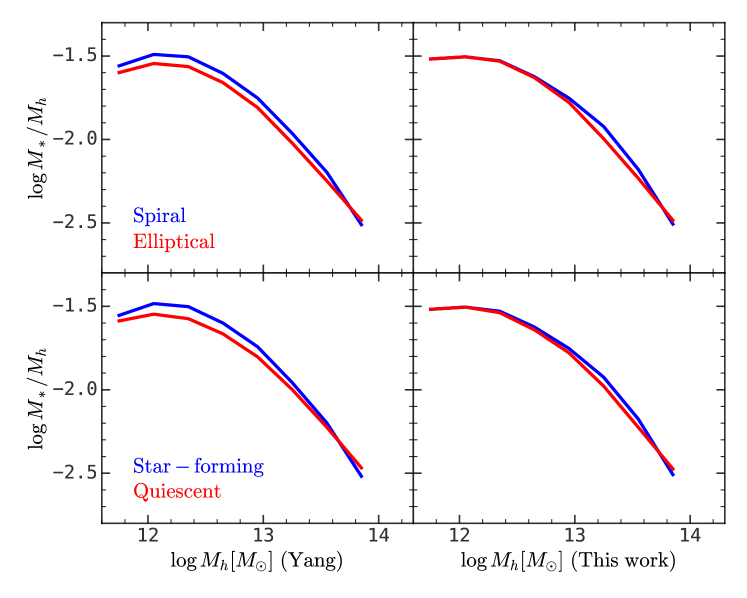
We note that Correa & Schaye (2020) also inspect the dependence of central galaxy properties on the central SMHMR, where they find that blue/disk central galaxies are more massive than their red/elliptical counterparts for galaxy groups with halo mass less than . However, they find that this signal disappears once a different stellar mass estimation method is adopted. Here we want to emphasize that this is due to the inconsistent stellar mass estimators used to calculate central stellar mass and halo mass. In the group catalog of Yang et al. (2007), the halo mass for each galaxy group is estimated by rank-matching the total stellar mass of galaxy groups and the theoretical halo mass distribution, where the stellar mass for each galaxy is estimated using the method in Bell et al. (2003). Consequently, central SMHMRs are equivalent to the central stellar mass to total stellar mass ratios, and if we use different stellar mass estimators to calculate the central stellar mass and the total stellar mass, we may introduce artificial biases.
This effect is demonstrated in Fig. 12. On the left panels, we are showing the central SMHMR as a function of halo mass from the native galaxy group catalog of Yang et al. (2007), where the central stellar mass comes from the GSWLC catalog and the halo mass is from the total stellar mass estimated in Bell et al. (2003). Here one can see that star-forming/spiral galaxies are more massive than their quiescent/non-spiral counterparts, which is similar to the result in Correa & Schaye (2020). The right panels show the result where the halo mass is recalibrated according to equation (3), and both the numerator and the denominator for the central SMHMR are using consistent stellar mass definition. And one can see that the difference disappears for halos which mass below and there is still some difference for halos with mass above , as shown in Fig. 11.