Deep Learning based ECG Segmentation for Delineation of Diverse Arrhythmias
Abstract.
Accurate delineation of key waveforms in an ECG is a critical initial step in extracting relevant features to support the diagnosis and treatment of heart conditions. Although deep learning based methods using a segmentation model to locate the P, QRS, and T waves have shown promising results, their ability to handle signals exhibiting arrhythmia remains unclear. This study builds on existing research by introducing a U-Net-like segmentation model for ECG delineation, with a particular focus on diverse arrhythmias. For this purpose, we curate an internal dataset containing waveform boundary annotations for various arrhythmia types to train and validate our model. Our key contributions include identifying segmentation model failures in different arrhythmia types, developing a robust model using a diverse training set, achieving comparable performance on benchmark datasets, and introducing a classification guided strategy to reduce false P wave predictions for specific arrhythmias. This study advances deep learning based ECG delineation in the context of arrhythmias and highlights its challenges.
1. Introduction
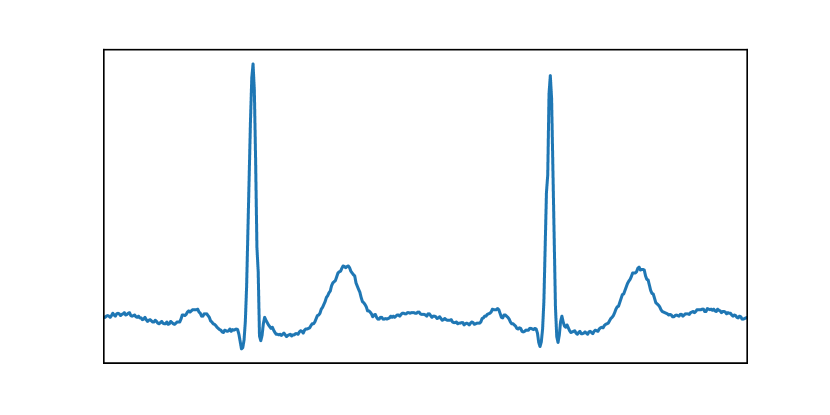
An electrocardiogram (ECG) is a basic medical diagnostic tool that monitors the electrical activity of the heart. It is non-invasive, relatively quick to perform, inexpensive, and provides a wealth of valuable information about the overall health of the heart. Traditionally, the analysis of the structural elements in an ECG, including the durations and morphology of the QRS complex, the P and T waves (see Figure 1), plays a key role in identifying abnormalities or irregularities in the heart’s electrical activity that may point towards underlying heart conditions [1]. Therefore, precise delineation, which involves identifying the onset and offset of these waves, is critical.
Computerized interpretation of ECGs has been available since the 1950s and has enabled the automatic delineation of ECG features. Over time, significant improvements have been made in the quality of automatic delineation using various techniques. Among these techniques, wavelet transform-based delineation [2, 3, 4] is widely recognized as one of the most effective, delivering state-of-the-art performance on the benchmark QT database (QTDB) [5]. However, as pointed out by [6, 7], these methods often require the adjustment of a threshold value to attain high scores, which may limit their generalizability to other datasets.
In recent years, deep learning has shown remarkable success in ECG processing such as arrhythmia classification [8, 9, 10, 11], which led to its increasing popularity in various downstream tasks [12]. This has been the case for ECG delineation as well, where a segmentation model with a CNN architecture is typically trained to locate the P, QRS, and T waves, which is then used to carry out the delineation task. For instance, Jimenez-Perez et al. [6] used a U-Net architecture [13] for their segmentation model, achieving delineation performance comparable to wavelet-based methods on QTDB. Similarly, Moskalenko et al. [14] employed a U-Net architecture and reported higher delineation performance compared to wavelet-based algorithms on the Lobachevsky University Database (LUDB) [15]. A recent study by Chen et al. [7] also applied a U-Net based classifier to delineate waveform boundaries of a single isolated heartbeat, achieving high sensitivity on both QTDB and LUDB.
Despite the progress made, accurate delineation of an ECG signal during arrhythmia still remains a challenge. Many arrhythmias cause significant changes in the structural elements and morphological features of an ECG. This is most notably the case for the P wave, which usually has the lowest signal to noise ratio. For example, in atrial fibrillation (AFIB) and atrial flutter (AFL) the P wave is absent, and a fibrillatory signal or flutter wave is found instead. As noted in [16] and [17], false P wave predictions during such events present a significant challenge for delineation algorithms in clinical practice. Other arrhythmias, such as atrioventricular (AV) block, affect not only the position of P waves in relation to the QRS complex, but also their occurrence. This can result in P waves and QRS complexes following independent rhythms. In all of these cases, the performance of a P wave delineation algorithm is affected adversely. For instance, Aziz et al. [18] report a considerable drop in sensitivity for P wave detection in the case of ECGs exhibiting arrhythmia.
A related challenge in deep learning based ECG segmentation is the scarcity of high-quality annotated data required for supervised training of models. To the best of our knowledge, the QT Database (QTDB) [5] and Lobachevsky University Database (LUDB) [15] are currently the only publicly available databases that provide onset and offset annotations for all P, QRS, and T waves in multiple leads. As a result, the training and validation of previous segmentation models have primarily been restricted to these datasets. For example, Jimenez-Perez et al. [6] carried out a 5-fold cross validation using the 105 recordings in QTDB, while Moskalenko et al. [14] trained their model on the extended LUDB dataset, which includes 455 recordings. Although these models achieved high accuracy on their respective test sets, also sourced from QTDB and LUDB, it remains uncertain how they would perform on individual arrhythmia types that are not represented in the limited training data.
In this study, we build on prior studies to devise a segmentation model with a U-Net like architecture to delineate ECG signals with diverse arrhythmias. In addition to the standard datasets QTDB and LUDB, we collect a new dataset comprising a large number of recordings with various arrhythmia types. Our model is trained and validated using this diverse dataset. Our main contributions are as follows: (i) identifying common failure cases of segmentation models through separate validation on different arrhythmia types; (ii) training a robust model that accurately delineates a chosen set of common arrhythmia types, achieved by using a diverse training set and employing a suitable post-processing strategy; (iii) evaluating our model’s performance on benchmark datasets QTDB and LUDB, demonstrating comparable results with previous research; (iv) introducing a classification guided strategy to reduce false P wave predictions for AFIB and AFL in short signals.
2. Related Work
2.1. Traditional Approaches for ECG Delineation
Early works on ECG delineation were primarily focused on developing rule-based methods to identify and locate the QRS complex. Pan and Tompkins [19] presented a seminal example of detecting the QRS complex by utilizing slope, amplitude, and width information. Subsequently, more advanced techniques have been employed to identify also the P and T waves. These include digital signal processing such as the wavelet transform [2, 3, 4, 20], the Hilbert transform [21, 22], and the phasor transform [23]. Additionally, classical machine learning approaches like hidden Markov models [24, 25] and Gaussian mixture models [26] have also been employed. Among these, wavelet-based methods have been widely cited as being the state-of-the-art, based on their delineation performance on the public dataset QTDB. Recently, the wavelet based algorithm proposed by Kalyakulina et al. [4] has been validated on the LUDB dataset as well.
2.2. Deep Learning based ECG Delineation
In recent years, the application of deep learning techniques has provided an alternative for the automatic delineation of ECG signals. Typically, a segmentation model based on an encoder-decoder structure is developed, which can effectively detect the regions associated with P, QRS, and T waves by proper training. Jimenez-Perez et al. [27] presented an adaptation of the U-Net architecture [13] to 1-dimensional data, while Sereda et al. [28] deployed an 8-layer convolutional network and studied the effects of using an ensemble of networks as opposed to using a single network for the segmentation. Moskalenko et al. [14] developed a U-Net-like architecture that achieved state-of-the-art performance on LUDB in terms of F1-score, when compared to previous deep learning approaches [28] and wavelet-based methods [4]. In a similar study, Jimenez-Perez et al. [6] again adapted a U-Net for segmentation but with added emphasis on regularization techniques for training with limited data. Their model, when cross-validated on QTDB, demonstrated comparable performance to those using digital signal processing techniques such as wavelet transforms [3]. Recently, Chen et al. [7] developed a 1D-U-Net model for classifying the sample points of a single heart-beat into P, QRS, T, and none categories. Together with their proposed post-processing strategy, the delineation algorithm outperformed other algorithms in terms of sensitivity for both QTDB and LUDB.
2.3. Classification Guided Segmentation
In developing a neural network for semantic segmentation, it is sometimes beneficial to add an extra classification task. This approach has been particularly effective in the field of medical image segmentation, where detection of false positives is common for images in which the object of interest is not present. Huang et al. [29] addressed this problem of over-segmentation by introducing a classification guided module (CGM) where the model is trained with the additional classification objective of deciding whether or not a given image contains an organ. By filtering out the segmentation output using the classification output, the number of false positives is reduced. A similar approach was taken by Shuvo et al. [30], where a separate localizer branch was added together with an additional classifier branch.
In the ECG literature, classification and segmentation tasks have remained separate for the most part, while deep learning architectures have shown great success for both tasks [12]. In our current work, we experiment with combining the two tasks by training an ECG segmentation model together with an additional arrhythmia classification learning objective. Previous studies have demonstrated the effectiveness of convolutional neural networks for arrhythmia classification. For example, Hannun et al. [8] trained a 34-layer convolutional neural network for arrhythmia classification of single-lead ECG signals, showing performance comparable to that of cardiologists. Ribeiro et al. [31] later used a residual network architecture, an architecture first developed by He et al. [32] in the context of image classification, for the reliable diagnosis of 12-lead ECG signals.
3. Data
| Data Source | # Recordings | Duration | Frequency | Leads | Boundary Annotations |
|---|---|---|---|---|---|
| Internal Database | 1557 | 10 seconds | 500Hz, 250Hz | 2 (I, II) | P, QRS, T on/offsets |
| QTDB [5] | 105 | 15 minutes | 250Hz | 2 | P, QRS on/offsets, T offsets |
| LUDB [15] | 200 | 10 seconds | 500Hz | 12 | P, QRS, T on/offsets |
For this study, we have used both internal and external datasets to develop and test our algorithm. The internal database was used for training the segmentation model and assessing delineation accuracy across diverse arrhythmias. The standard public datasets QTDB and LUDB were used for external validation of our algorithm. The characteristics of these datasets are summarized in Table 1 and elaborated upon in subsequent sections.
3.1. Internal Dataset
We have assembled an internal database of ECG signals from 1,557 patients by searching the electrocardiography database (GE MUSE, GE Healthcare, Waukesha, WI) in a single center (Seoul National University Hospital, Seoul, South Korea). In the process of ECG extraction, all personal information was anonymized, so the consent form was waived. This study was then approved by the institutional review board of the participating center (H-1906-163-1044).
Our intent was to collect a dataset in order to conduct experiments to elucidate the segmentation performance for signals during arrhythmia. To do so, we identified 155 subjects with atrial fibrillation (AFIB) and 59 with atrial flutter(AFL). Among the rest, arrhythmia types were identified for 490 subjects as normal sinus rhythm (NSR), 84 as sinus tachycardia (ST), 115 as bundle branch block (BBB), 197 as first degree atrioventricular block (AVB1) and 29 as ventricular tachycardia (VT).
For each subject, the extracted data consisted of a recording with a duration of 10 seconds for leads I and II with a sampling frequency of either 250Hz or 500Hz. The onsets and offsets for P, QRS, and T waves were annotated for each lead independently. The dataset was partitioned into a training set and a test set. The training set comprised 1032 recordings and was organized to include approximately 70% of recordings for each identified arrhythmia class. The test set was composed of the remaining 525 recordings.
3.2. The QT Database (QTDB)
The QT database (QTDB) [5] is a publicly available database that has been widely used for developing and evaluating ECG delineation algorithms, due to its inclusion of manual annotations. The database collects recordings from multiple databases including the MIT-BIH arrhythmia database [33], the European ST-T Database [34], and other databases to represent various QRS and ST-T morphologies. In total, there are 105 two-lead signals sampled at 250Hz with each signal lasting for 15 minutes. Manual annotations by cardiologists are included for at least 30 beats per record, which amounts to more than 3600 beats. The annotations include the peaks and boundaries of waveforms, and in particular include the onset and offset of the P wave, the onset and offset of the QRS complex, and the offset of the T wave. These annotations will be used to measure the delineation quality of our algorithm and to compare with previous wavelet based methods [4, 35, 7].
3.3. Lobachevsky University Database (LUDB)
The Lobachevsky University Database (LUDB) is a more recently published database, also developed as an open-access tool for validating ECG delineation algorithms. Unlike QTDB, LUDB consists of short signals of 10 seconds from 200 unique subjects, with 12-lead recordings sampled at 500Hz included for each subject. Furthermore, LUDB contains a complete set of annotations for all onsets and offsets of P, QRS, and T waves, which is included for each single lead signal. In particular, the total number of annotated beats is considerably higher than that of QTDB, and this large number of annotated single-lead signals has led studies to take advantage by using LUDB as training data for their ECG segmentation models [28, 14]. In this paper, we use LUDB for two purposes. First, we use LUDB alongside QTDB to validate our delineation algorithm and compare with existing methods [4, 28, 14]. Second, we study the delineation performance on various arrhythmias when the segmentation model is trained on LUDB as opposed to the diverse training set sourced from our internal dataset.
4. Methods
4.1. Overview of Delineation Algorithm
The proposed algorithm consists of two stages. The first is a segmentation stage where a single lead input signal is passed through a deep learning based segmentation model. As a result, the signal is segmented into intervals that belong to one of four types: P wave, QRS complex, T wave, or none of these. The second stage consists of post-processing in which the final decision on the onset and offset for each of the waveforms is made. The details of each stage are given in the following sections.
4.2. Segmentation Model
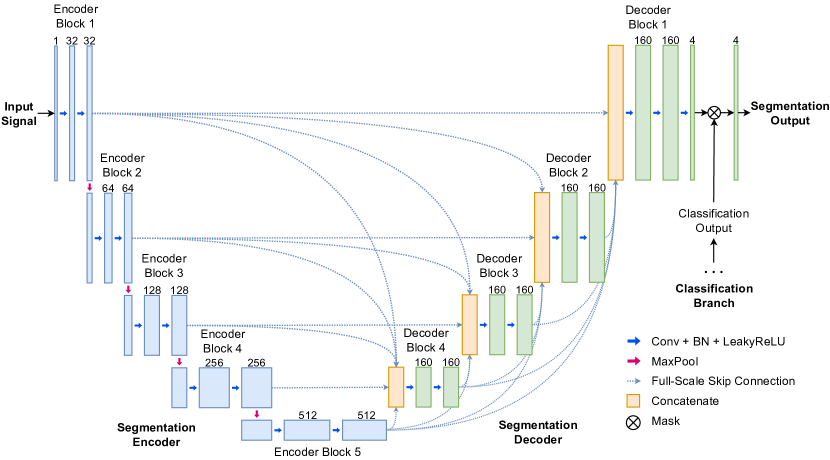
We have adapted the encoder-decoder structure of U-Net [13] to our model in a similar fashion as in the previous papers [28, 14, 6] to work in the context of ECG signals. Namely, the original convolutions are replaced with 1D convolutions to work with time series data. We have further modified the structure by incorporating full-scale skip connections, and adding a separate classification branch whose role will be discussed in Section 4.4. The resulting high-level architecture of our model is shown in Figure 2.
The encoder takes a single-lead ECG signal sampled at 500Hz as input and encodes it into five feature maps at multiple scales through a series of 1D convolutional blocks and MaxPooling layers which downsample by a factor 2. The decoder uses convolutional blocks and linear interpolation layers to transform these features into an output consisting of four channels of the same resolution as the input. As in the U-Net variants [36, 29], we allow the decoder networks to learn from and aggregate features coming from multiple levels by adapting the full-scale skip connections of [29]. The final segmentation output is obtained by passing the output of the decoder through a convolutional layer with 4 filters and kernel size 1 and applying a softmax classifier for four classes: P wave, QRS complex, T wave, and none of these. This gives four class probabilities for each time stamp.
Note that for all other convolutional layers, we use a kernel size of and a padding of . As for the activation function, we use a leaky rectified linear unit with negative slope for all layers. More specific details can be found in our implementation, which is available at https://github.com/ckjoung/ecg-segmentation.
4.3. Post-processing
The waveform boundaries are determined from the segmentation output through a post-processing stage, which consists of the following three steps. First, we extract segments of each type (P wave, QRS, T wave, none) by taking connected intervals where the probability of that type outputted by the model is highest. As a second noise reduction step, we discard short connected regions (of a duration less than 40 ms) and adjust the label based on the segmentation results of the adjacent intervals. In particular, we adjust the label according to the following rule:
-
(1)
if the two intervals adjacent to a short region have the same label, we regard the short segment as having the same label, thereby gluing the two regions to a single segment;
-
(2)
if the labels of the adjacent intervals are different, we discard the short region and label it as being none of the waveforms.
In the final step, we proceed by choosing the longest intervals labeled as P wave and T wave between consecutive QRS intervals and obtain their onsets and offsets. It can of course happen that there is no P wave, for example in the case of atrial fibrillation, or no T wave, which is very rare. This procedure automatically removes noise and returns unambiguous results.
4.4. Arrhythmia Classification Guidance
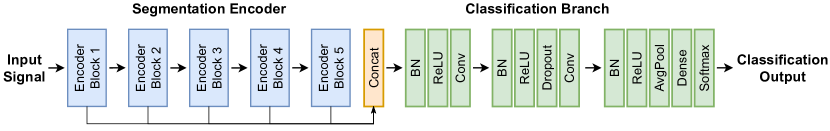
Here, we introduce an arrhythmia classification guided strategy for segmentation. The idea is to train the segmentation model jointly with a classification loss based on the arrhythmia type of each input signal. This is done by adding a classification branch following the deepest layer of the encoder, which predicts the arrhythmia type of the input signal. The weights of the model are affected by the joint training, and in addition, we can directly suppress the P wave segmentation output when the signal is predicted to belong to AFIB or AFL (see Figure 2). A similar idea was used by Saclova et al. [16] who have directly incorporated atrial fibrillation classification in an advanced rule based approach to P wave detection. In Section 5.4, we show that this approach can effectively reduce the number of false positive P wave predictions when delineating 10-second ECG signals. However, for other experiments, we only use the segmentation model without the classifier branch. Note that the proposed approach is similar to the classification guided modules of [29, 30], which have been used in the context of biomedical image segmentation. Here, we have re-designed the structure for the task of arrhythmia classification of ECG signals.
The structure of the arrhythmia classification branch is shown in Figure 3. The classification branch itself consists of two convolutional layers using 512 filters and a kernel size of 17. We apply batch normalization and dropout for regularization following the classification models of [8, 31]. The arrhythmia classification is performed by the final fully connected layer with softmax activation, whose output represents the probabilities of the signal belonging to either an AFIB or an AFL episode or not. A final prediction is made using an argmax function. Note that we have allowed the classification branch to take as input not just the features of the last encoder block, but of encoder blocks of all levels. This is done by an aggregation scheme which works as follows. We first downsample the features of the first four encoder blocks to a size equal to that of the last encoder block. The downsampling is done using an average pooling layer. After the features have been resampled to the same shape, we concatenate the features to get a single aggregated feature.
4.5. Training
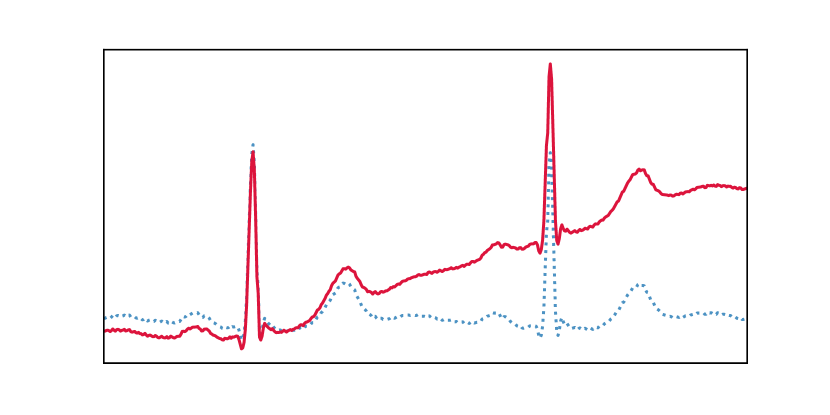
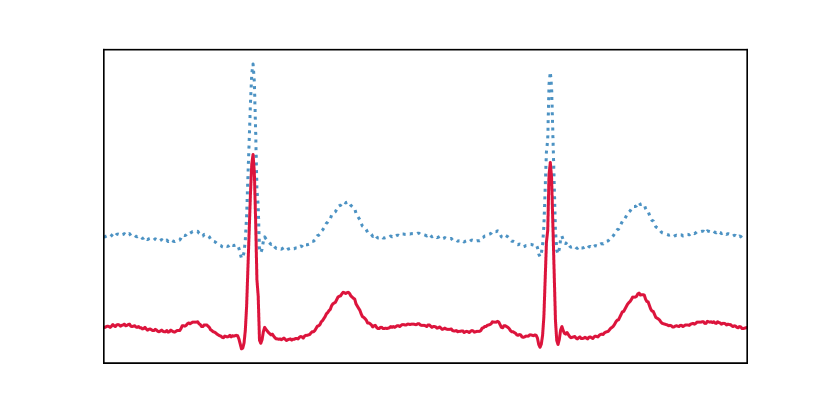
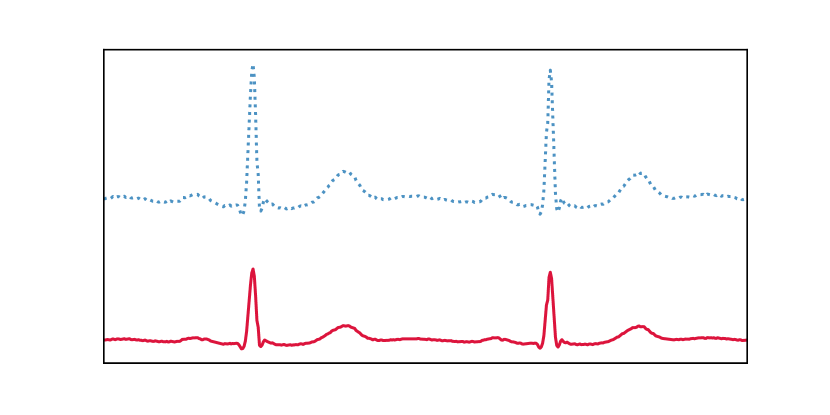
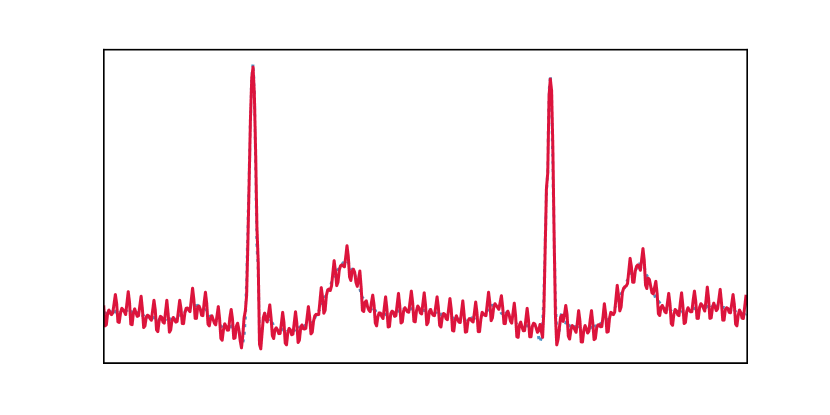
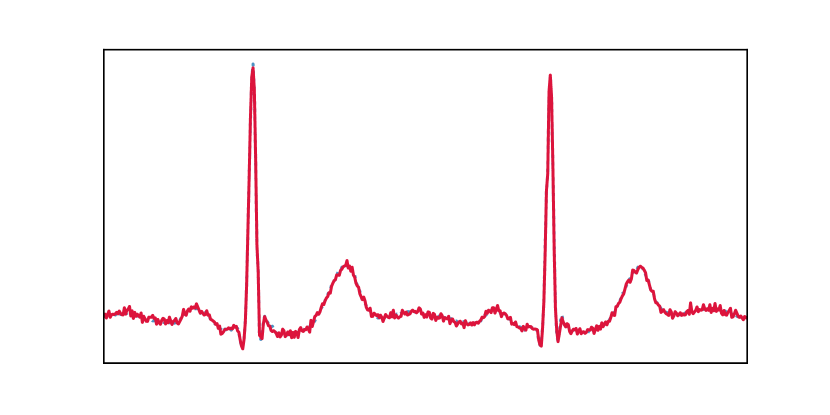
We have trained the network from scratch with convolutional weights initialized as in He et al. [37] using the Adam optimizer [38] with default parameters. The learning rate was initialized to be and set to follow a cosine annealing schedule. To increase the diversity of training data, we applied data augmentation using transformations designed to mimic probable physiological noise, such as baseline wander, powerline noise, and baseline shift, as used in [39]. We have also randomly resized the input signal and added random Gaussian noise. Figure 4 shows examples of the used transformations.
We adopt focal loss as introduced in [40] as our segmentation loss function. Focal loss modifies the standard cross-entropy loss by providing smaller weights to well-classified time stamps, letting the model focus on regions that are difficult to classify. The focal loss generalized to our multi-class segmentation setting can be written in the following form:
Here, denotes the predicted probability of time stamp belonging to class , while is the one-hot vector of the true class label for time stamp . In our experiments, we use the default value of . During arrhythmia classification guidance of Section 4.4, we use the standard binary cross-entropy loss for the classification branch. This gives the overall loss function:
The additional trade-off parameter can be adjusted to balance the effect of classification and segmentation losses during training. For all our experiments, we used .
We train and validate our model using single lead ECG signals. To prevent potential issues arising from incomplete annotations for waveforms near the beginning and the end of a signal, we proceed as in [14] to exclude the initial and final 2 seconds of our signals during the training process. Hence, our model performs segmentation and classification using a signal of duration 6 seconds during training, and of 10 seconds during validation. While this scheme was designed mainly due to its practicality, we note that ECG recordings of 5 or 10 seconds have been shown to be successful for a CNN based arrhythmia classification [41]. We only use signals from leads I and II for training and validation of our model. Each input signal is resampled to 500Hz.
5. Results and Discussion
5.1. Evaluation Metrics
To evaluate the performance of the proposed delineation algorithm, we compare the ground truth annotations for the onsets and offsets of P, QRS, and T waves with the predicted annotations. To ensure soundness, we follow the usual standard chosen by The Association for the Advancement of Medical Instrumentation(AAMI) [42], which considers an onset or an offset to be correctly detected if an algorithm locates the same type of annotation in a neighborhood of 150ms. Using this threshold value, we examine for each predicted point whether the prediction correctly detects a point in the ground truth annotation.
If a ground truth annotation is correctly detected, we count a true positive(TP). In this case, the error is measured as the time deviation of the predicted point from the manual annotation. If there is no point of the ground truth annotation in the 150ms neighborhood of the prediction, then we count a false positive(FP). Once every prediction has been compared with the manual labels, we count for each point of the ground truth annotation which has not been related to any prediction a false negative(FN).
Based on this, we calculate the following evaluation metrics:
-
–
mean error
-
–
standard deviation of error
-
–
sensitivity
-
–
positive predictive value
-
–
F1-score
These metrics have been commonly used in the literature for the evaluation of ECG delineation algorithms [3, 4, 35, 14]. In the following sections, we use these metrics to evaluate the performance of our model and draw comparisons with existing models.
5.2. Delineation Performance on Arrhythmia
| Training | Rhythm | F1-scores (%) | |||||
|---|---|---|---|---|---|---|---|
| P onset | P offset | QRS onset | QRS offset | T onset | T offset | ||
| Trained on internal dataset | NSR | 99.69 | 99.69 | 99.78 | 99.81 | 99.95 | 99.95 |
| ST | 97.19 | 97.19 | 99.91 | 99.91 | 99.90 | 99.94 | |
| BBB | 99.00 | 99.00 | 99.94 | 99.94 | 99.88 | 99.89 | |
| AVB1 | 95.93 | 95.93 | 99.84 | 99.84 | 100.00 | 100.00 | |
| AFIB | - | - | 99.54 | 99.54 | 99.56 | 99.54 | |
| AFL | - | - | 98.97 | 98.97 | 98.56 | 97.57 | |
| VT | - | - | 97.83 | 96.84 | 94.49 | 94.61 | |
| All | 96.47 | 96.46 | 99.71 | 99.69 | 99.67 | 99.63 | |
| Trained on LUDB | NSR | 99.84 | 99.84 | 99.83 | 99.84 | 99.97 | 99.97 |
| ST | 81.54 | 81.54 | 99.93 | 99.93 | 97.59 | 98.83 | |
| BBB | 98.89 | 98.89 | 99.94 | 99.94 | 99.89 | 99.94 | |
| AVB1 | 90.53 | 90.97 | 99.82 | 99.82 | 100.00 | 100.00 | |
| AFIB | - | - | 99.29 | 99.29 | 97.92 | 97.60 | |
| AFL | - | - | 99.21 | 99.21 | 92.67 | 93.00 | |
| VT | - | - | 91.04 | 91.11 | 78.78 | 78.63 | |
| All | 90.37 | 90.46 | 99.45 | 99.46 | 97.42 | 97.54 | |
We first present the delineation results on the test set of the internal dataset. To assess the model’s ability to handle signals with diverse arrhythmias, we measure the F1-scores separately for each of the following arrhythmia types: normal sinus rhythm (NSR), sinus tachycardia (ST), bundle branch block (BBB), first degree atrioventricular block (AVB1), atrial fibrillation (AFIB), atrial flutter (AFL) and ventricular tachycardia (VT). We also examine how the arrhythmia distribution of the training set can affect the delineation performance. For this, we train a separate segmentation model using LUDB as the only training set and compare the resulting delineation performance. LUDB has often been used in previous studies [28, 7] for training a segmentation model for the purposes of delineation. Here, we follow the same approach but test it on the internal dataset in order to measure performance for different arrhythmias. For a reliable comparison, each evaluation is repeated 20 times and the average score is reported.
Table 2 shows the F1-scores for the onset and offset delineation. From the results, we see that the model trained on the internal dataset can accurately delineate signals of each of the identified arrhythmia types. While there is some variation in accuracy for different arrhythmias, the F1-scores are mostly above 0.99, and all above 0.97 except for VT and P waves for AVB1. In contrast, the results when using the model trained on LUDB show a much higher variation across different arrhythmia types. For normal sinus rhythm, exceptional F1-scores (over 0.99) are achieved. However, the effect of arrhythmia in delineation accuracy is noticeable in the F1-scores for P waves during ST and AVB1, and T waves during ST, AFIB, AFL, and VT. For BBB, the effect is not visible in the F1 scores, but we have observed in the mean and standard deviation of error for QRS offset and T onset a decrease in delineation quality.
This phenomenon can be attributed to the limited number of recordings in LUDB for the corresponding arrhythmia types. For example, in LUDB, 15 recordings represent signals with atrial fibrillation, while only three recordings with atrial flutter and four recordings with sinus tachycardia are available [15]. Our observation shows that the model trained on LUDB has a clear difficulty in identifying P waves during ST and AVB1 while predicting a high number of false positive P waves for AFIB and AFL. However, without testing the model on a dataset that has a balanced distribution of arrhythmias, it is difficult to identify such failure cases. Overall, the results highlight the importance of using a well-curated dataset that encompasses a broad range of arrhythmias commonly seen in clinical practice for developing and validating an ECG delineation algorithm.
5.3. External Validation on QTDB and LUDB
| Database | Method | Metrics | P onset | P offset | QRS onset | QRS offset | T onset | T offset |
|---|---|---|---|---|---|---|---|---|
| QTDB | Di Marco et al. [35] | (%) | 98.15 | 98.15 | 100.0 | 100.0 | - | 99.77 |
| (%) | 91.00 | 91.00 | N/A | N/A | 97.76 | |||
| (ms) | -4.5 13.4 | -2.5 13.0 | -5.1 7.2 | 0.9 8.7 | 1.3 18.6 | |||
| Kalyakulina et al. [4] | (%) | 97.46 | 97.53 | 98.42 | 98.42 | - | 96.16 | |
| (%) | 97.86 | 97.93 | 98.24 | 98.24 | 94.87 | |||
| (ms) | 3.5 13.8 | 3.4 12.7 | -5.1 6.6 | 4.7 9.5 | 13.4 18.5 | |||
| Chen et al. [7] | (%) | 99.58 | 99.78 | 100.0 | 100.0 | - | 98.63 | |
| (%) | N/R | N/R | N/A | N/A | N/R | |||
| (ms) | -0.6 20.9 | 4.9 19.5 | 1.3 11.4 | 3.8 18.8 | 7.4 32.5 | |||
| Our Method | (%) | 96.51 | 96.55 | 100.0 | 100.0 | - | 97.50 | |
| (%) | 97.94 | 97.97 | N/A | N/A | 95.31 | |||
| (ms) | 13.0 16.1 | -3.3 18.5 | 4.1 11.2 | 2.8 17.3 | -0.4 35.1 | |||
| LUDB | Kalyakulina et al. [4] | (%) | 98.46 | 98.46 | 99.61 | 99.61 | - | 98.03 |
| (%) | 96.41 | 96.41 | 99.87 | 99.87 | 98.84 | |||
| (ms) | -2.7 10.2 | 0.4 11.4 | -8.1 7.7 | 3.8 8.8 | 5.7 15.5 | |||
| Sereda et al. [28] | (%) | 95.20 | 95.39 | 99.51 | 99.50 | 97.95 | 97.56 | |
| (%) | 82.66 | 82.59 | 98.17 | 97.96 | 94.81 | 94.96 | ||
| (ms) | 2.7 21.9 | -7.4 28.6 | 2.6 12.4 | -1.7 14.1 | 8.4 28.2 | -3.1 28.2 | ||
| Moskalenko et al. [14] | (%) | 98.61 | 98.59 | 99.99 | 99.99 | 99.32 | 99.40 | |
| (%) | 95.61 | 95.59 | 99.99 | 99.99 | 99.02 | 99.10 | ||
| (ms) | -4.1 20.4 | 3.7 19.6 | 1.8 13.0 | -0.2 11.4 | -3.6 28.0 | -4.1 35.3 | ||
| Our Method | (%) | 98.16 | 98.20 | 99.67 | 99.97 | 99.82 | 99.63 | |
| (%) | 96.39 | 96.36 | 99.29 | 99.59 | 99.66 | 99.42 | ||
| (ms) | 7.4 14.1 | -1.8 9.9 | 6.1 10.5 | 2.0 10.7 | 3.0 25.2 | 4.5 24.4 |
Our algorithm’s ability to handle previously unseen signals is verified using the public datasets QTDB and LUDB. For LUDB, we compared our results with delineation algorithms using wavelets [4] and previous deep segmentation based methods [28, 14]. The evaluation was conducted on LUDB signals from leads I and II. Regarding QTDB, we benchmark against wavelet-based techniques [35, 4] and a recent deep learning approach [7]. Notably, the annotation format of QTDB, as discussed in [3, 35], does not allow us to measure the exact value. In fact, when there is no annotation, we cannot decide whether the waveform is not present or the annotation is simply not included. To address this, we adopt the approach from [3, 35] and treat an absent manual annotation on a predicted beat as a non-included annotation. To ensure consistency with [35, 4], we select the lead with the lowest error for each boundary point.
Detailed results and comparisons with existing methods are shown in Table 3. Our method demonstrates performance that is comparable to existing methods in terms of accuracy and error metrics. Particularly on QTDB, our method shows high performance in delineating P wave onsets and offsets, achieving a of over 97.9%, outperforming the methods we compared against. In the case of LUDB, our method’s strength lies in accurate T wave delineation, with both and exceeding 99.4%, an improvement over other methods. Taken together, these results underscore the consistent accuracy of our proposed delineation algorithm across various waveforms. Our method’s weakest point is observed in the standard deviation of error (), particularly noticeable for the T offset of QTDB signals. In fact, we can observe from Table 3 that deep learning-based methods tend to exhibit higher compared to wavelet-based methods. This also aligns with the observations of Jimenez-Perez et al. [6], where their deep learning-based delineation also reported a larger than 30ms for T offset delineation in QTDB.
It is worth noting that the comparable performance on the public datasets has been achieved by training exclusively on the internal dataset. This is important as it implies the high generalization ability of the proposed algorithm and deep learning based methods in general. As noted in [14, 6], the ability to handle unseen signals without the need for additional tuning of parameters is a key advantage of deploying a deep learning model compared to wavelet-based methods. By using a private dataset as opposed to a portion of either QTDB or LUDB for training, we have made a clear demonstration of the effectiveness at which deep segmentation models can be applied to diverse scenarios. This approach is not without its limitations. For instance, in Table 3 we observe that the onset errors for P and QRS are shifted positively while the standard deviation remains relatively similar to other methods, which may partially be an artifact of the the independent annotations for training and test data.
5.4. Reduced False P wave Predictions
| AFIB (1437 beats) | AFL (540 beats) | All (14418 beats) | ||||||||
|---|---|---|---|---|---|---|---|---|---|---|
| False Positives | False Positives | (Precision) | (Recall) | |||||||
| P onset | P offset | P onset | P offset | P onset | P offset | P onset | P offset | |||
|
62.35 | 62.35 | 34.25 | 34.25 | 97.53 | 97.52 | 95.43 | 95.43 | ||
|
13.85 | 13.85 | 1.85 | 1.9 | 98.70 | 98.69 | 95.31 | 95.31 | ||
The arrhythmia classification guidance was presented in Section 4.4 as a method with the potential benefit of reducing the number of false P wave detections which occur frequently during atrial fibrillation and flutter events. To evaluate its effectiveness, we compared the number of false positive P wave predictions generated by models trained with and without classification guidance. Table 4 shows the results, including the and scores for the entire test set as a reference.
The results indicate a significant reduction in false positives for both atrial fibrillation and atrial flutter. When compared to the total number of beats corresponding to the same rhythm type (indicated in the header row of Table 4), the number of false positives for the classification guided model is less than 1%. The reduction in false predictions is reflected in the improved scores for P waves belonging to the entire test set, while recall scores only decreased slightly. As a result, the total F1-score increased from 96.47% to 96.97%, as reported in Table 2. From the results, we conclude that the classification guided strategy is effective in reducing false P wave predictions during AFIB and AFL episodes while maintaining the overall delineation quality.
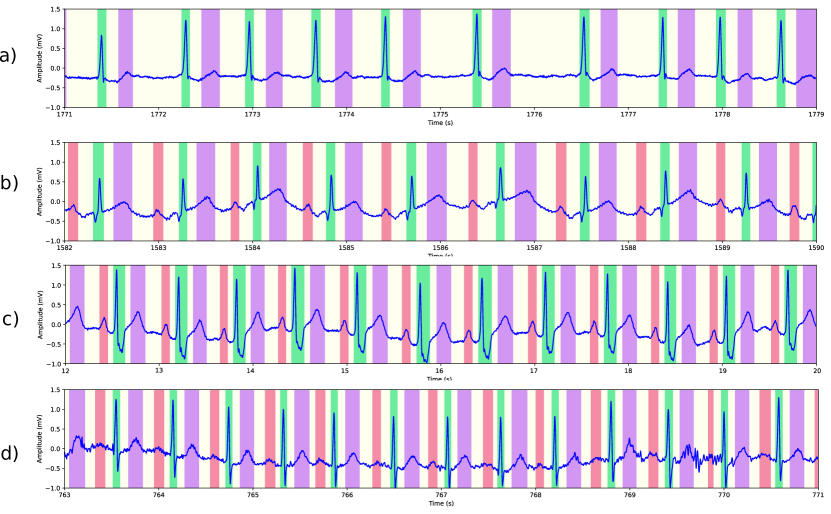
5.5. Examples of Delineation Results
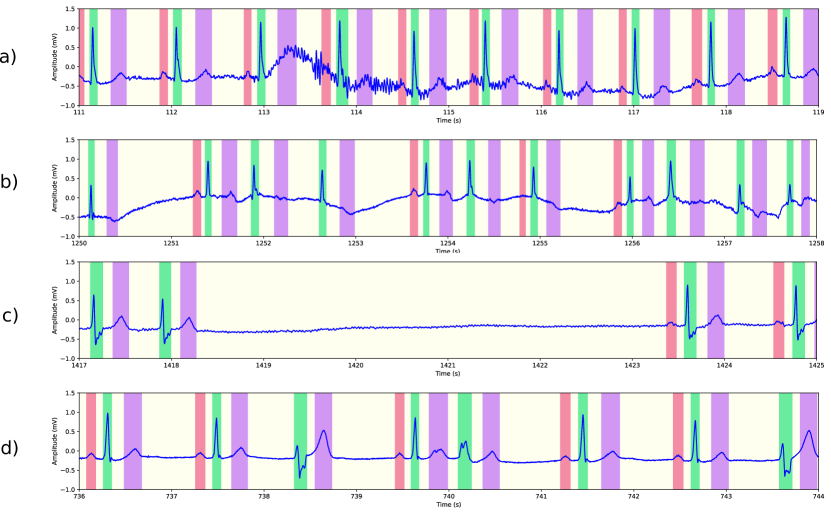
This section presents examples of our algorithm’s delineation outcomes on the MIT-BIH arrhythmia database [33]. We have chosen multiple instances of arrhythmia to showcase how our algorithm handles them, as depicted in Figure 5. Other challenges are shown in Figure 6, including noise, baseline wander, and loss of signal.
Our method provides accurate delineation in all the presented examples, highlighting its versatility in several aspects. First, with the exception of signal resampling to a frequency of 500 Hz, no additional signal processing techniques were used to achieve the results. Second, due to the convolutional nature of the segmentation model, the algorithm can accommodate signals of varying lengths. This greatly enhances its utility, particularly in the context of Holter recordings containing potential arrhythmias, allowing for the algorithm’s application to windows of sizes chosen for convenience. Our PyTorch implementation segments and delineates an ECG record of 30 minutes in under 3s on an Ubuntu machine with 64 GB DRAM and an NVIDIA 3080Ti with 12 GB memory. The model itself uses a little under parameters, and needs about 80 MB of memory. In particular, this is both suitable for real time analysis and the intended application of the analysis of Holter recordings. Finally, it is worth noting that no parameter tuning was necessary for the delineation when applied to the MIT-BIH arrhythmia database.
6. Conclusion
One of the main challenges in ECG delineation is to accurately identify and delineate waveforms within irregular cardiac rhythms. This study aimed to develop a deep learning-based segmentation model capable of detecting the onsets and offsets of P, QRS, and T waves in signals with potential arrhythmias. By evaluating on the internal dataset, we have highlighted the impact of arrhythmias on delineation quality, underscoring the importance of accounting for arrhythmias when developing and evaluating segmentation models for ECG analysis. To address this, we experimented with training on a diverse dataset and employing a post-processing strategy that can handle noise during the final delineation step. Furthermore, we assessed generalization capability through experiments on the QTDB and LUDB datasets. Overall, our study shows a deep learning based segmentation model to be a versatile tool for delineation which can be highly adaptive to various situations.
Our study has some limitations. Specifically, both our internal dataset and the public datasets used in the study have a somewhat limited diversity of arrhythmias. To the best of our knowledge, there are no other publicly available datasets with complete annotations of onset and offset data that cover a wider range of arrhythmias. To address this limitation, future research and development could focus on expanding the development and testing of automatic delineation in a broader class of arrhythmias. A particular area for improvement could be P wave detection, especially in cases of complete atrioventricular block where the P wave can occur anywhere. More manual annotation to serve as training data is not a feasible approach, particularly in cases of complete AV block. Instead, more advanced data augmentation techniques hold promise for enhancing model performance in these scenarios.
Acknowledgements
This work was supported by the Korea Medical Device Development Fund grant funded by the Korea government (the Ministry of Science and ICT, the Ministry of Trade, Industry and Energy, the Ministry of Health & Welfare, the Ministry of Food and Drug Safety) (Project Number: 1711174270 , RS-2021-KD000008). In addition, Chankyu Joung, Taejin Paik, Woong Kook and Otto van Koert were supported by National Research Foundation of Korea (NRF) Grant 2022R1A5A6000840 funded by the Korean Government. Chankyu Joung and Taejin Paik were also supported by National Science Foundation of Korea Grant funded by the Korean Government (MSIP) [RS-2022-00165404, NRF2023005562].
References
- [1] “ECG Signal Processing, Classification and Interpretation: A Comprehensive Framework of Computational Intelligence” London: Springer London, 2012 DOI: 10.1007/978-0-85729-868-3
- [2] Cuiwei Li, Chongxun Zheng and Changfeng Tai “Detection of ECG characteristic points using wavelet transforms” In IEEE Transactions on Biomedical Engineering 42.1, 1995, pp. 21–28 DOI: 10.1109/10.362922
- [3] J.P. Martinez, R. Almeida, S. Olmos, A.P. Rocha and P. Laguna “A Wavelet-Based ECG Delineator: Evaluation on Standard Databases” In IEEE Transactions on Biomedical Engineering 51.4, 2004, pp. 570–581 DOI: 10.1109/TBME.2003.821031
- [4] A.. Kalyakulina, I.. Yusipov, V.. Moskalenko, A.. Nikolskiy, A.. Kozlov, N.. Zolotykh and M.. Ivanchenko “Finding Morphology Points of Electrocardiographic-Signal Waves Using Wavelet Analysis” In Radiophysics and Quantum Electronics 61.8, 2019, pp. 689–703 DOI: 10.1007/s11141-019-09929-2
- [5] P. Laguna, R.G. Mark, A. Goldberg and G.B. Moody “A database for evaluation of algorithms for measurement of QT and other waveform intervals in the ECG” In Computers in Cardiology 1997 Lund, Sweden: IEEE, 1997, pp. 673–676 DOI: 10.1109/CIC.1997.648140
- [6] Guillermo Jimenez-Perez, Alejandro Alcaine and Oscar Camara “Delineation of the electrocardiogram with a mixed-quality-annotations dataset using convolutional neural networks” In Scientific Reports 11.1, 2021, pp. 863 DOI: 10.1038/s41598-020-79512-7
- [7] Zhenqin Chen, Mengying Wang, Meiyu Zhang, Wei Huang, Hanjie Gu and Jinshan Xu “Post-processing refined ECG delineation based on 1D-UNet” In Biomedical Signal Processing and Control 79, 2023, pp. 104106 DOI: 10.1016/j.bspc.2022.104106
- [8] Awni Y. Hannun, Pranav Rajpurkar, Masoumeh Haghpanahi, Geoffrey H. Tison, Codie Bourn, Mintu P. Turakhia and Andrew Y. Ng “Cardiologist-level arrhythmia detection and classification in ambulatory electrocardiograms using a deep neural network” In Nature Medicine 25.1, 2019, pp. 65–69 DOI: 10.1038/s41591-018-0268-3
- [9] Henrique De Melo Ribeiro, Ahran Arnold, James P Howard, Matthew J Shun-Shin, Ying Zhang, Darrel P Francis, Phang B Lim, Zachary Whinnett and Massoud Zolgharni “ECG-based real-time arrhythmia monitoring using quantized deep neural networks: A feasibility study” In Comput. Biol. Med. 143.105249 Elsevier BV, 2022, pp. 105249
- [10] Gawsalyan Sivapalan, Koushik Kumar Nundy, Soumyabrata Dev, Barry Cardiff and Deepu John “ANNet: A lightweight neural network for ECG anomaly detection in IoT edge sensors” In IEEE Trans. Biomed. Circuits Syst. 16.1 Institute of ElectricalElectronics Engineers (IEEE), 2022, pp. 24–35
- [11] Yuan Zhang, Sen Liu, Zhihui He, Yuwei Zhang and Changming Wang “A CNN model for cardiac arrhythmias classification based on individual ECG signals” In Cardiovasc. Eng. Technol. 13.4 Springer ScienceBusiness Media LLC, 2022, pp. 548–557
- [12] Wen Hao and Kang Jingsu “Investigating Deep Learning Benchmarks for Electrocardiography Signal Processing” arXiv:2204.04420 [cs] arXiv, 2022 URL: http://arxiv.org/abs/2204.04420
- [13] Olaf Ronneberger, Philipp Fischer and Thomas Brox “U-Net: Convolutional Networks for Biomedical Image Segmentation” In Medical Image Computing and Computer-Assisted Intervention – MICCAI 2015 9351 Cham: Springer International Publishing, 2015, pp. 234–241 DOI: 10.1007/978-3-319-24574-4˙28
- [14] Viktor Moskalenko, Nikolai Zolotykh and Grigory Osipov “Deep Learning for ECG Segmentation” In Advances in Neural Computation, Machine Learning, and Cognitive Research III 856 Cham: Springer International Publishing, 2020, pp. 246–254 DOI: 10.1007/978-3-030-30425-6˙29
- [15] Alena I. Kalyakulina, Igor I. Yusipov, Viktor A. Moskalenko, Alexander V. Nikolskiy, Konstantin A. Kosonogov, Grigory V. Osipov, Nikolai Yu. Zolotykh and Mikhail V. Ivanchenko “LUDB: A New Open-Access Validation Tool for Electrocardiogram Delineation Algorithms” In IEEE Access 8, 2020, pp. 186181–186190 DOI: 10.1109/ACCESS.2020.3029211
- [16] Lucie Saclova, Andrea Nemcova, Radovan Smisek, Lukas Smital, Martin Vitek and Marina Ronzhina “Reliable P wave detection in pathological ECG signals” In Scientific Reports 12.1, 2022, pp. 6589 DOI: 10.1038/s41598-022-10656-4
- [17] Jianyuan Hong, Hua-Jung Li, Chung-chi Yang, Chih-Lu Han and Jui-chien Hsieh “A clinical study on Atrial Fibrillation, Premature Ventricular Contraction, and Premature Atrial Contraction screening based on an ECG deep learning model” In Applied Soft Computing 126, 2022, pp. 109213 DOI: 10.1016/j.asoc.2022.109213
- [18] Saira Aziz, Sajid Ahmed and Mohamed-Slim Alouini “ECG-based machine-learning algorithms for heartbeat classification” In Sci. Rep. 11.1 Springer ScienceBusiness Media LLC, 2021, pp. 18738
- [19] Jiapu Pan and Willis J. Tompkins “A Real-Time QRS Detection Algorithm” In IEEE Transactions on Biomedical Engineering BME-32.3, 1985, pp. 230–236 DOI: 10.1109/TBME.1985.325532
- [20] Pooja Sabherwal, Monika Agrawal and Latika Singh “Independent detection of T-waves in single lead ECG signal using Continuous Wavelet Transform” In Cardiovasc. Eng. Technol. 14.2, 2023, pp. 167–181
- [21] D.S. Benitez, P.A. Gaydecki, A. Zaidi and A.P. Fitzpatrick “A new QRS detection algorithm based on the Hilbert transform” In Computers in Cardiology 2000. Vol.27 (Cat. 00CH37163), 2000, pp. 379–382 DOI: 10.1109/CIC.2000.898536
- [22] S.. Mukhopadhyay, M. Mitra and S. Mitra “Time plane ECG feature extraction using Hilbert transform, variable threshold and slope reversal approach” In 2011 International Conference on Communication and Industrial Application, 2011, pp. 1–4 DOI: 10.1109/ICCIndA.2011.6146675
- [23] A Martínez, R Alcaraz and J J Rieta “Automatic electrocardiogram delineator based on the Phasor Transform of single lead recordings” In 2010 Computing in Cardiology, 2010, pp. 987–990
- [24] S. Graja and J.-M. Boucher “Hidden Markov tree model applied to ECG delineation” In IEEE Transactions on Instrumentation and Measurement 54.6, 2005, pp. 2163–2168 DOI: 10.1109/TIM.2005.858568
- [25] Mahsa Akhbari, Mohammad B. Shamsollahi, Omid Sayadi, Antonis A. Armoundas and Christian Jutten “ECG segmentation and fiducial point extraction using multi hidden Markov model” In Computers in Biology and Medicine 79, 2016, pp. 21–29 DOI: 10.1016/j.compbiomed.2016.09.004
- [26] Rémi Dubois, Pierre Maison-Blanche, Brigitte Quenet and Gérard Dreyfus “Automatic ECG wave extraction in long-term recordings using Gaussian mesa function models and nonlinear probability estimators” In Computer Methods and Programs in Biomedicine 88.3, 2007, pp. 217–233 DOI: 10.1016/j.cmpb.2007.09.005
- [27] Guillermo Jimenez-Perez, Alejandro Alcaine and Oscar Camara “U-Net Architecture for the Automatic Detection and Delineation of the Electrocardiogram” In 2019 Computing in Cardiology (CinC), 2019, pp. Page 1–Page 4 DOI: 10.22489/CinC.2019.284
- [28] Iana Sereda, Sergey Alekseev, Aleksandra Koneva, Roman Kataev and Grigory Osipov “ECG Segmentation by Neural Networks: Errors and Correction” In 2019 International Joint Conference on Neural Networks (IJCNN), 2019, pp. 1–7 DOI: 10.1109/IJCNN.2019.8852106
- [29] Huimin Huang, Lanfen Lin, Ruofeng Tong, Hongjie Hu, Qiaowei Zhang, Yutaro Iwamoto, Xianhua Han, Yen-Wei Chen and Jian Wu “UNet 3+: A Full-Scale Connected UNet for Medical Image Segmentation” In ICASSP 2020 - 2020 IEEE International Conference on Acoustics, Speech and Signal Processing (ICASSP) Barcelona, Spain: IEEE, 2020, pp. 1055–1059 DOI: 10.1109/ICASSP40776.2020.9053405
- [30] Md. Shuvo, Rifat Ahommed, Sakib Reza and M.M.A. Hashem “CNL-UNet: A novel lightweight deep learning architecture for multimodal biomedical image segmentation with false output suppression” In Biomedical Signal Processing and Control 70, 2021, pp. 102959 DOI: 10.1016/j.bspc.2021.102959
- [31] Antônio H. Ribeiro, Manoel Horta Ribeiro, Gabriela M.. Paixão, Derick M. Oliveira, Paulo R. Gomes, Jéssica A. Canazart, Milton P.. Ferreira, Carl R. Andersson, Peter W. Macfarlane, Wagner Meira, Thomas B. Schön and Antonio Luiz P. Ribeiro “Automatic diagnosis of the 12-lead ECG using a deep neural network” In Nature Communications 11.1, 2020, pp. 1760 DOI: 10.1038/s41467-020-15432-4
- [32] Kaiming He, Xiangyu Zhang, Shaoqing Ren and Jian Sun “Deep Residual Learning for Image Recognition” In 2016 IEEE Conference on Computer Vision and Pattern Recognition (CVPR) Las Vegas, NV, USA: IEEE, 2016, pp. 770–778 DOI: 10.1109/CVPR.2016.90
- [33] G.. Moody and R.. Mark “The impact of the MIT-BIH arrhythmia database” In IEEE engineering in medicine and biology magazine: the quarterly magazine of the Engineering in Medicine & Biology Society 20.3, 2001, pp. 45–50 DOI: 10.1109/51.932724
- [34] Taddei A, Distante G, Emdin M, Pisani P, Moody Gb, Zeelenberg C and Marchesi C “The European ST-T database: standard for evaluating systems for the analysis of ST-T changes in ambulatory electrocardiography” In European heart journal 13.9, 1992 DOI: 10.1093/oxfordjournals.eurheartj.a060332
- [35] Luigi Y Di Marco and Lorenzo Chiari “A wavelet-based ECG delineation algorithm for 32-bit integer online processing” In BioMedical Engineering OnLine 10.1, 2011, pp. 23 DOI: 10.1186/1475-925X-10-23
- [36] Zongwei Zhou, Md Mahfuzur Rahman Siddiquee, Nima Tajbakhsh and Jianming Liang “UNet++: Redesigning Skip Connections to Exploit Multiscale Features in Image Segmentation” In IEEE Transactions on Medical Imaging 39.6, 2020, pp. 1856–1867 DOI: 10.1109/TMI.2019.2959609
- [37] Kaiming He, Xiangyu Zhang, Shaoqing Ren and Jian Sun “Delving Deep into Rectifiers: Surpassing Human-Level Performance on ImageNet Classification” In 2015 IEEE International Conference on Computer Vision (ICCV) Santiago, Chile: IEEE, 2015, pp. 1026–1034 DOI: 10.1109/ICCV.2015.123
- [38] Diederik P. Kingma and Jimmy Ba “Adam: A Method for Stochastic Optimization” arXiv:1412.6980 [cs] arXiv, 2017 DOI: 10.48550/arXiv.1412.6980
- [39] Temesgen Mehari and Nils Strodthoff “Self-supervised representation learning from 12-lead ECG data” In Computers in Biology and Medicine 141, 2022, pp. 105114 DOI: 10.1016/j.compbiomed.2021.105114
- [40] Tsung-Yi Lin, Priya Goyal, Ross Girshick, Kaiming He and Piotr Dollar “Focal Loss for Dense Object Detection” In Proceedings of the IEEE International Conference on Computer Vision (ICCV), 2017
- [41] Xiaomao Fan, Qihang Yao, Yunpeng Cai, Fen Miao, Fangmin Sun and Ye Li “Multiscaled Fusion of Deep Convolutional Neural Networks for Screening Atrial Fibrillation From Single Lead Short ECG Recordings” In IEEE Journal of Biomedical and Health Informatics 22.6, 2018, pp. 1744–1753 DOI: 10.1109/JBHI.2018.2858789
- [42] NM Association for the Advancement of Medical Instrumentation “Testing and reporting performance results of cardiac rhythm and ST segment measurement algorithms” In ANSI/AAMI EC38 1998, 1998, pp. 46