GNNUERS: Fairness Explanation in GNNs for Recommendation via Counterfactual Reasoning
Abstract.
Nowadays, research into personalization has been focusing on explainability and fairness. Several approaches proposed in recent works are able to explain individual recommendations in a post-hoc manner or by explanation paths. However, explainability techniques applied to unfairness in recommendation have been limited to finding user/item features mostly related to biased recommendations. In this paper, we devised a novel algorithm that leverages counterfactuality methods to discover user unfairness explanations in the form of user-item interactions. In our counterfactual framework, interactions are represented as edges in a bipartite graph, with users and items as nodes. Our Bipartite Graph Explainer perturbs the topological structure to find an altered version (counterfactual explanation) that minimizes the disparity in utility between the protected and unprotected demographic groups. Experiments on four real-world graphs coming from various domains showed that our method can systematically explain user unfairness on three state-of-the-art GNN-based recommendation models. Moreover, an empirical evaluation of the perturbed network uncovered relevant patterns that justify the nature of the unfairness discovered by the generated explanations. The source code and the preprocessed data sets are available at https://github.com/jackmedda/RS-BGExplainer.
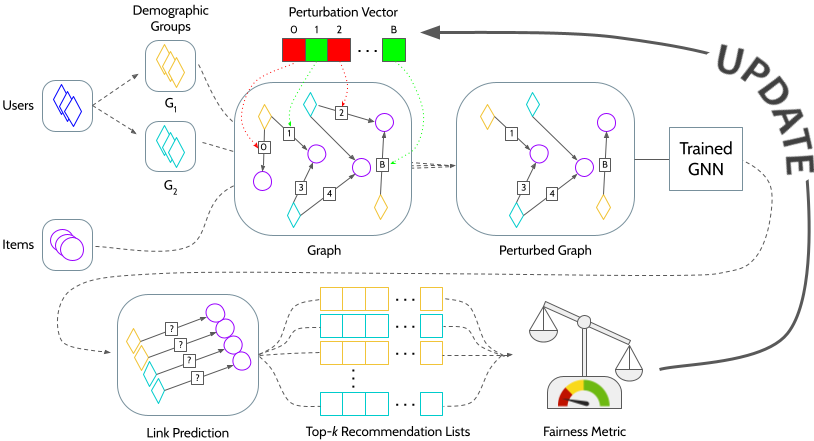
figure description
1. Introduction
As recommender systems become more and more effective and sophisticated, the complexity of their functioning increases dramatically. The recommendations of novel systems improve the satisfaction of the users, but their lack of interpretability lays the groundwork for worrying questions (Ghazimatin et al., 2020).
The issue of interpretability comes in addition with the prominent importance of preserving properties that go beyond recommendation effectiveness, such as trustworthiness (Wang et al., 2022d), fairness (Wang et al., 2022b), and explainability (Zhang and Chen, 2020). However, all these issues (from model interpretability to results that go beyond accuracy) are usually treated by the modern literature as independent perspectives, mostly tackled one at a time. Taking as an example algorithmic fairness (which is also the main case study in our work), while it is of uttermost importance to provide the end users and the content providers with equitable recommendations, it is also important for service providers (e.g., an online platform) to understand why the model behind their platform is unfair. Hence, tackling algorithmic fairness in an explainable way is a central yet under-explored area. Indeed, the few existing approaches that explain unfairness in recommender systems exploit user and item features to characterize the disparities generated by a model (Ge et al., 2022; Deldjoo et al., 2021). Though their methods successfully uncover the features related to the model disparities, the generated explanations are limited to the set of selected features, which might be also challenging to obtain, given that most recommendation models work with user-item interaction data.
Shifting the focus to other areas within explainable artificial intelligence, various techniques have been employed to determine the relevant data entities that can serve as explanations for diverse tasks. Counterfactual methods have recently emerged as an effective way to explain the predictions produced by models based on Graph neural networks (GNNs) (Hamilton et al., 2017; Kipf and Welling, 2017; Veličković et al., 2017; Zhang et al., 2022), which have proven to be effective in modeling graph data in several domains, such as information retrieval (Cui et al., 2022), recommender systems (He et al., 2020; Ying et al., 2018), natural language processing (Yao et al., 2019) and user profiling (Chen et al., 2021, 2019; Yan et al., 2021). Approaches driven by counterfactual reasoning have also been used to guarantee algorithmic fairness in GNN-based models, for various downstream tasks, by manipulating the topological structure (Agarwal et al., 2021; Ma et al., 2022; Wang et al., 2022a). However, to the best of our knowledge, no approach was ever proposed to explain unfairness in GNN-based recommender systems. Filling this research gap goes beyond a simple application of counterfactual explanations methods for GNNs, so as to uncover unfairness in recommender systems. Indeed, the original methods to explain the predictions in GNN-based models are applied to classic graphs (Lucic et al., 2022; Kang et al., 2021; Chen et al., 2022a; Yuan et al., 2020), while recommender systems are characterized by a bipartite nature, since they bridge the interactions between two types of entities (nodes), i.e., users and items. This leads to efficiency issues, uncovered in detail in Section 4.
In this work, we propose a shift of paradigm, by presenting a framework, named GNNUERS (GNN-based Unfairness Explainer in Recommender Systems), which perturbs the original bipartite graph in order to identify a set of user-item interactions leading to user unfairness in GNN-based recommender systems. Thanks to our approach, user unfairness can be uncovered by the selected edges, i.e. the user-item interactions, because their removal from the original graph can result in fairer recommendations for the end users, thus globally explaining under which conditions a model generates disparities. Concretely, our approach is guided by the demographic parity principle, which ensures that all demographic groups receive the same recommendation utility. Under this paradigm, we propose a perturbation mechanism driven by counterfactual reasoning with the goal of altering the users’ recommendation by assuming a set of edges is missing from the graph. In other words, the original bipartite graph is modified under the assumption that certain users have not interacted with the items associated with the selected edges (in the counterfactual world), while, in reality, the graph includes such edges (in the actual world). The selection process of the user-item interactions perturbed by the proposed mechanism is driven by a loss function that combines two terms: i) minimizing the disparity in recommendation utility across demographic groups, and ii) minimizing the number of perturbed edges. Specifically, the user-item interactions are cherry picked such that a model using a perturbed graph missing such interactions is able to generate fairer recommendations during the inference phase.
It should be noted that the loss function guiding the perturbation mechanism has access to the ground truth labels of the subset of data used for evaluation. It follows that our approach is able to monitor the recommendation utility measured on the evaluation set for all the demographic groups, which is crucial to select the specific user-item interactions that lead to the utility disparity across demographic groups in the recommendations generated by GNN-based systems. By leveraging the ground truth labels of the evaluation subset of data, GNNUERS distinguishes itself from other recently proposed procedures in the recommendation literature. While these procedures aim at modifying the recommendations to mitigate the unfairness issue, our method focuses on explaining it instead. Therefore, GNNUERS can generate explanations of user unfairness at the model-level, also denoted as global explanations, that can support system designers and service providers with insights on how to improve the model fairness. This claim is supported by the experiments in Section 5, which prove our framework is able to systematically explain user unfairness, and also to uncover existing patterns that justify why unfairness was characterized.
Our contributions can be summarized as follows:
- •
- •
2. Related Work
Our study has the primary goal of explaining unfairness in recommender systems based on graph neural networks, which is a naturally multidisciplinary topic. Therefore, we first contextualize our study with respect to prior work that aimed at describing and explaining global issues related to the whole system, e.g. unfairness, instability, in recommendation or graphs, and not the single model predictions. We then outline the efforts directed by researchers towards explainability and unfairness mitigation in recommendation. Finally, we provide an overview on the recommendation literature focused on explainability and on existing methods adopting counterfactual explanations in graph neural networks.
2.1. Beyond Predictions Explanation in Recommendation and Graphs
First attempts to explain aspects beyond predictions in recommendation, e.g. unfairness, were made in (Deldjoo et al., 2021; Ge et al., 2022). (Deldjoo et al., 2021) aimed at estimating the dependency between data characteristics and unfairness, (Ge et al., 2022) sought to finding the minimal perturbation to user and item features that can reduce exposure unfairness. It should be noted that these explanations are therefore based on pre-computed features and their importance with respect to the unfairness. Conversely, GNNUERS touches on user-item interactions, i.e., the main source of personalization for collaborative filtering models, including the GNN-based ones. While we fully acknowledge the fact that these two aspects are complementary, user-item interactions are generally present in any dataset adopted in a recommendation scenario, whereas user and item features, e.g., those in (Ge et al., 2022), might not always be extracted from the available data. Furthermore, the explanatory framework used by (Deldjoo et al., 2021) requires a significant amount of simulations, impractical for complex models, and the discovered patterns are informative with respect to the limited collection of selected data characteristics.
Unfairness was also explained in GNNs trained for node classification tasks in (Dong et al., 2023). The authors devised an efficient method to quantify to what extent fairness is impacted by the removal of a single node from the training set without re-training the GNN. In a recommendation scenario, such technique could label some users or items as harmful, describing unfairness as their mere presence in the graph. Conversely, GNNUERS addresses unfairness in the more complex recommendation task by detecting the specific user-item links causing biased recommendations.
Other researchers have investigated to what extent recommender systems are sensitive to minimal input data perturbations. For instance, the method proposed in (Oh et al., 2022) aims to find the minimal perturbation that causes the highest instability in the recommendations, by analyzing the effect of a perturbation over the interaction graph in a black-box setting. However, such method focuses on decreasing recommendation stability and might be used to merely explain such phenomenon. Conversely, GNNUERS can be adopted to optimize different objectives, including unfairness explanation and recommendation instability. For the sake of scope, our study in this paper explores the former and leaves the latter as a future work.
2.2. Explainability and User Fairness in Recommendation
Recent work in the recommendation field put much emphasis on improving interpretability and explainability in recommendation (Chen et al., 2022b) by leveraging post-hoc techniques (Brunot et al., 2022; Zhong and Negre, 2022), explanation paths (Balloccu et al., 2022; Zhang et al., 2023), counterfactual reasoning (Ghazimatin et al., 2021; Chen et al., 2022a; Tan et al., 2021). Nonetheless, these methods are specifically designed to generate instance-level explanations (Yuan et al., 2023), that is each of them describes why an item was recommended to a user. On the other hand, GNNUERS generates explanations at the model-level (Yuan et al., 2023) because unfairness is an issue that affects a whole recommender system, not an individual user-item interaction. Our method is also different from the mitigation methods of the unfairness caused by instance-level explanations, e.g. (Wang et al., 2022c), where the goal is to guarantee the explanations are not biased, e.g. with respect to the generated text.
Also the attention to issues of unfairness, from both the user and provider perspectives, has been increasing in recommendation. Most works focusing on the end users have modeled fairness at a group level, with a primary focus on gender- and age-based demographic groups, and often accompanied unfairness assessments with technical contributions for mitigating it (Boratto et al., 2022; Ekstrand et al., 2022, 2018; Burke et al., 2018; Frisch et al., 2021; Li et al., 2021a, b; Wu et al., 2021, 2022). These methods however do not consider algorithmic ways to explain the causes behind the detected disparities, letting mitigation methods attempt to reduce such disparities by optimizing a certain loss function. Although these mitigation methods usually led to a decrease in unfairness, the underlying causes of unfairness remain unclear, consequently preventing researchers and service providers from devising more conceptually informed mitigation methods. We particularly observed that it is generally hard to link the mitigation method logic to the underlying aspects causing unfairness in a given domain. Compared to these prior works, GNNUERS not only aims to identify prior user interactions that potentially led the model to provide unfair recommendations, but also investigates the structural characteristics of the perturbed interactions. It follows that GNNUERS makes it possible to derive conceptual insights that support a better understanding of the unfairness phenomenon, working to the advantage of system designers and service providers.
2.3. Counterfactual Explanations in GNNs
GNNs can be directly applied to graphs to provide an easy way to do node-level, edge-level, and graph-level prediction tasks. A notable advantage of GNNs is that they can capture the dependence of graphs via message passing between the graph nodes. Unlike standard neural networks, GNNs retain a state representing information from their neighbourhood with arbitrary depth.
Yet, the methods addressing explainability about unfairness in GNNs are limited (Dong et al., 2023) (described in Section 2.1). On the other hand, several prior works have proposed to mitigate unfairness in GNNs (Agarwal et al., 2021; Ma et al., 2022; Wang et al., 2022a), specifically by manipulating the graph topological structure. However, such methods have never been investigated on bipartite graphs adopted for recommendation, and their operationalization of unfairness and its mitigation could not be extended to explain the issue, as required in our case.
Other efforts were devoted to explaining GNN predictions by leveraging counterfactual techniques (Lucic et al., 2022; Kang et al., 2021; Chen et al., 2022a; Yuan et al., 2020). These techniques aim to find the minimal perturbation to the input (graph) data such that the prediction of the GNN changes, whose goal is related to adversarial attacks, but the latter aim at degrading the model performance instead of generating informative explanations (Lucic et al., 2022). Nevertheless, none of them focused on explaining fairness, but merely addressed explanations of individual predictions. Differently from them, GNNUERS leverages counterfactual techniques to find the minimal perturbation to the input (graph) data such that the unfairness of recommendations produced by the GNN-based model is reduced. Our method therefore differs from other existing solutions from several perspectives. First, we target GNNs applied to bipartite graphs, instead of focusing on more general graphs typically considered in the machine learning field. Second, we adopted a different notion of counterfactuality, which does not only require that the prediction changes, but also that predictions lead to a certain property. Third, we go beyond the mere creation of the counterfactual explanations at the instance-level, and investigate structural properties of the perturbed data at the model-level.
3. Problem Formulation
Our paper aims to explain user unfairness in recommendations generated by graph neural network models. Therefore, we first describe the recommendation scenario from a graph perspective. We then formulate the target task, namely user unfairness explanation. Finally, we introduce the definition of fairness adopted in our study.
3.1. Recommendation Task
In recommendation, the goal of the preference model is typically predicting whether or to what extent an (unseen) item would potentially be of interest for a user. In a common scenario, the model uses past interactions between two main entities, namely users and items , to learn preference patterns. Each user is assumed to have interacted with a certain item in case they rated, liked, or clicked on such item, depending on the applicative scenario. The set of items a user interacted with is referred to as the ’s history.
Graphs are structures that represent a set of entities (nodes) and their relations (edges). GNNs operate on graphs to produce representations that can be used in downstream tasks. In our case, user-item interactions can be represented by means of an undirected bipartite graph , where is the set of edges representing the interactions and , with , is the set of nodes. No edge exists between nodes of the same type, i.e., . The recommendation problem can be then solved by leveraging GNNs. They can be applied to a linking prediction downstream task, to predict potentially interesting links between users and items in the bipartite graph .
Let be any GNN, where is an adjacency matrix representing , is the learned weight matrix of , and is a user-item relevance matrix, with being the linking probability between user and item . In other words, is the input of , and is parameterized by . predicts the user-item relevance matrix by combining the normalized adjacency matrix , where are entries in the degree matrix , with the learned weight according to the GNN implementation. Given the relevance matrix and a user , items in are sorted based on their decreasing relevance in , and the top- items are recommended to user . We refer to the list of items recommended to user as and to the set of all recommended lists as .
3.2. Unfairness Explanation Task
An unfair algorithm is one whose decisions are skewed toward a particular group of people (Mehrabi et al., 2021). In light of this, it follows that an unfairness explanation process cannot be conducted for a single individual. Hence, we aim to explain why a recommender system is unfair at the model-level (Yuan et al., 2023) to support designers and service providers with insights on how to improve the model fairness. To do so, we decided to adopt counterfactual reasoning techniques (Lucic et al., 2022; Kang et al., 2021). In our context, we assume to model counterfactual explanations according to the users’ history. More precisely, a set of user-item interactions, perturbed with respect to the original ones, represents a counterfactual explanation in case a trained model produces at least one different recommendation to the users, when these perturbed interactions are used in the inference phase. In our graph-based approach, it means that we aim to generate a perturbed version of the adjacency matrix , i.e., , that leads to the recommended lists , with , when a GNN uses (instead of ) for prediction.
We identify one of the possible sources of the unfairness as a subset of edges included in the adjacency matrix . The presence of these edges in leads a GNN to generate biased recommendations that advantage a specific group of users. Hence, perturbing such edges could make the system fairer. Following (Ge et al., 2022), if the predictions, i.e. recommendations, generated by a model are fairer when a set of modifications, i.e. the perturbed interactions in , is applied to the original data, i.e. , such modifications represent the counterfactual explanations of the original predictions unfairness. Under our user unfairness explanation task, we specifically aim to produce a perturbed adjacency matrix (counterfactual explanation) that leads to the highest fairness across users by means of the lowest number of perturbations on the original adjacency matrix .
Algorithmic unfairness has been operationalized through numerous notions, often dependent on the context and the application (Singh and Joachims, 2018). It follows that there is no consensus in the recommender systems community on a gold standard definition to apply. Motivated by its increasingly recognized importance in prior work in top-n recommendation (Boratto et al., 2022; Wu et al., 2022), we decided to model fairness according to the notion of demographic parity. Our formulation and method is, however, flexible to accommodate other notions of fairness. In the context of recommendations, a model meets demographic parity when the recommendation utility estimates across demographic groups, characterized by a certain sensitive attribute, is not systematically different. Under this demographic parity notion of fairness, our goal is to generate a perturbed adjacency matrix that modifies the predictions of a trained GNN, resulting in recommended lists with closer utility estimates across demographic groups than the original recommendations , constrained to the number of perturbed edges with respect to the original adjacency matrix . Formally, we seek to minimize the following objective function:
| (1) |
where is the term monitoring fairness, operationalized according to the notion of demographic parity, is the term controlling the distance between the perturbed adjacency matrix and the original one .In the next section, we describe the way is generated and how the objective function is translated into a loss function to be minimized with our approach.
4. GNNUERS
In this section we present GNNUERS, a method able to explain unfairness in graph-based recommenders, solving the problem introduced in Section 3.2. We introduce the method by its main components: first, the perturbation mechanism of the bipartite graph, which allows to alter the interactions between users and items, in a differentiable way and, the two loss functions that guide the selection of the edges to be perturbed.
4.1. Bipartite Graph Perturbation
Our graph perturbation approach is inspired by previous work for GNNs explanation for binary classification on plain graphs (Lucic et al., 2022). However, since GNNUERS aims to perturb a bipartite graph generated for recommender systems, it presents several differences. In (Lucic et al., 2022) a perturbation matrix is populated to then generate the perturbed matrix 111 denotes the Hadamard product.. Optimizing for can eventually include indices for zero entries in . While for plain graphs this method results to be efficient, for bipartite graphs it can be memory inefficient, mainly because it requires to store a perturbation value also for the user-user and item-item links, not present in bipartite graph per definitionem. To overcome these limitations, the perturbation in GNNUERS is optimized through a vector , where is the number of existing edges in the original graph. Our method is memory efficient, especially under sparse graphs, since it needs to store perturbation values only for non-zero entries of .
Given our unfairness explanation task, we aim to find a set of interactions in that led a GNN to generate unfair recommendations. To do so, we derive a perturbed matrix , resulting in fairer recommendations when a trained GNN uses instead of during the inference phase. The non-zero entries are perturbed by through a function that maps the 2D indices of to a 1D index for . Thus, given , an entry denotes the edge is deleted in the perturbed adjacency matrix, i.e. . In other words, the perturbed matrix is populated as follows:
| (2) |
The perturbation mechanism is therefore driven by the way and are defined.
Following (Lucic et al., 2022; Srinivas et al., 2017), we generate through an optimization process that leverages a real valued vector . Once optimized, we apply a sigmoid transformation, and then a binarization of the entries such that values become 1, while values become 0, obtaining eventually . The initialization of should guarantee , i.e., a real-valued is selected to initialize , such that . In all the experiments in Section 5 we set , leaving the analysis of other initialization values as a future work.
4.2. Perturbed Graph Generation
Based on the protocol described above, GNNUERS modifies the adjacency matrix edges by means of the perturbation vector . The decision process of which edges will be deleted is performed by the counterfactual model . extends the GNN-based recommender system using as parameter and the frozen weights learnt by as additional input. In detail, , similarly to , predicts the altered relevance matrix by combining the normalized version of the perturbed adjacency matrix , where , with according to the implementation of the original model . Therefore, learns only , while the weights , already optimized by to maximize the recommendation utility, remain constant.
As explained in Section 4.1, is generated from , whose values get updated during the learning process. At different steps of the latter, the values of could oscillate close to the threshold that determines if will be 0 or 1 at the respective indices. Considering aspects such as floating-point errors or dropout layers, the oscillation could negatively affect the update of , due to previously perturbed edges being restored, or vice versa. To counter this phenomenon, the perturbation algorithm is constrained by the usage of a policy that prevents a deleted edge from being restored, such that the number of perturbed edges follows a monotonic trend.
4.3. Loss Function Optimization
The previous section introduced , the counterfactual model responsible of the generation of the perturbed adjacency matrix . The optimization of the perturbation vector is guided by the loss function defined in (1), where is based on Demographic Parity (DP), the fairness notion described in Section 3.2. Recent works (Boratto et al., 2022; Wu et al., 2022) operationalized DP as the mean of the absolute pair-wise utility difference across all demographic groups. Formally:
| (3) |
where is a function that measures the recommendations utility level, is the set of considered demographic groups, () and () denote, respectively, the altered relevance sub-matrix and the adjacency sub-matrix with respect to the users in ().
Following works that proposed methods to mitigate or explain unfairness in recommendation (Li et al., 2021a; Ashokan and Haas, 2021; Kamishima et al., 2018; Ge et al., 2022), we focus on a binary setting, with sensitive attributes comprised of two demographic groups. For instance, given , aims at minimizing the utility disparity between males and females, with the optimal result being:
We denote the group with higher (lower) utility on the evaluation set as unprotected (protected). This enables the reader to better contextualize the approach with respect to fairness.
Normalized Discounted Cumulative Gain (NDCG) was selected as the utility metric . However, due to the non-differentiability of the sorting operation performed to compute NDCG, we adopt an approximated version (Wu et al., 2022; Qin et al., 2010), which we refer as NDCGApproxLoss:
| (4) | ||||
where DCG is the Discounted Cumulative Gain, is the item relevance score produced by the recommender system, is a sigmoid function, and is a scaling constant. We fix for the experiments in Section 5, being the default value in the TensorFlow Ranking implementation. NDCGApproxLoss is adopted only when constructing the fairness objective in Equation (3), while the original NDCG is used in the evaluation phase. Given our unfairness explanation task, the ground truth labels used to measure NDCGApproxLoss during the GNNUERS learning process are taken from the evaluation set. Such approach is justified by the explanation task of the recommendation unfairness measured on the evaluation set itself, while for other tasks, e.g. mitigation ones, having access to the ground truth labels is a less realistic assumption (Rahmani et al., 2022).
Any differentiable distance function can be adopted as the distance loss (Lucic et al., 2022). In GNNUERS, it is based on the absolute element-wise difference between and , defined as follows:
| (5) |
A sigmoid function is used to bound the distance loss to the same range of , i.e., [0,1]. In particular, we used which needs a higher number of perturbed edges to reach 1 compared with the popular logistic function, hence covering a wider range of values. is a parameter that balances the two losses, due to the trend of to report values , while gets rapidly close to 1.0 as more edges are perturbed. We tested several values of in the range and the best value for each model was selected for the experiments in Section 5.
4.4. Gradient Deactivation
The optimization of (3) takes into account the approximate NDCG measured on the predicted recommendations for the protected and unprotected group. The update of the real-valued perturbation vector is then affected from the viewpoint of both demographic groups. In particular, GNNUERS selects edges that could simultaneously optimize two objectives: increasing utility for the protected group and decreasing it for the unprotected one. However, the edges that are going to be perturbed for one of the objectives could negatively affect the other one, and vice versa. To this end, we perform a gradient deactivation on the recommendations generated for the protected group, i.e. the back-propagation updates the perturbation vector only from the unprotected group viewpoint. This procedure is applied only on the protected group, such that the GNNUERS objective is to delete the edges generating the gap in recommendation utility between unprotected and protected users.
Deactivating the gradient does not limit the group of edges that can be perturbed because the optimization does not involve only the user nodes, but also the item ones. Hence, GNNUERS could delete all the edges connected to an item node, both coming from user nodes of the unprotected and protected group. For conciseness, we will use the terms deactivated and activated to characterize a group associated with inactive and active gradient respectively.
4.5. Resources Usage
In this section, the two steps of the GNNUERS pipeline are examined in terms of memory footprint and execution time complexity. The first step regards the generation of the perturbed matrix at each step of the learning process by means of (2), which requires to store only the real-valued perturbation vector . Leveraging a sparse representation of and , the perturbation time complexity is dependent only on the number of perturbed edges , i.e., . The second step, that is the optimization process in Sections 4.2-4.3 directed towards learning , has no memory footprint and is executed for iterations. Hence, given the execution time for the inference step of the extended GNN-based recommender system and the execution time of (1), is the time complexity of the perturbed graph generation.
5. Evaluation
In this section, we examine the GNNUERS explanations with experiments aimed at answering the three research questions:
-
•
RQ1: Can the perturbation of the graph topological structure explain recommendation utility unfairness under the operationalised fairness notion?
-
•
RQ2: Can the perturbation minimally affect the recommendation utility of the protected group while reducing the unprotected group one?
-
•
RQ3: Can the categorization of user nodes through topological graph properties reveal the nature of unfairness?
The data manipulation, training and assessment of the GNN-based recommender systems were built upon the framework Recbole (Zhao et al., 2021). The experiments were ran on a A100 GPU machine with 80GB VRAM and 90GB RAM.
5.1. Graph Topological Properties
GNNUERS identifies explanations in the form of user-item interactions that made a GNN-based recommender system generate unfair outcomes. Each edge deleted from the graph unlinks a user and an item node, modifying the network topological structure and affecting the properties characterizing all the nodes, e.g. degree. GNNUERS edges selection process can then be described by the properties of the nodes of the removed edges.
To this end, we selected three properties that reflect different networks topological aspects and their relation to features examined in recommender systems tasks, e.g. popularity bias. Let be a generic node of , i.e., if is a user or if is an item, the nodes properties are defined as follows:
-
•
Degree (DEG): the number of edges connected to each node. For a user node it represents the history length, i.e. , for item nodes it represents their popularity.
-
•
Density (DY): it represents the tendency of a node to be connected to high-degree nodes. For user nodes it represents the tendency to interact with popular items, for item nodes it describes the interest of their peers, where users’ interest is higher as their histories length is longer. Formally, given the neighbors set of a node :
(6) -
•
Intra-Group Distance (IGD): it represents how a node is close to the other nodes . Given the bipartite nature of recommender systems networks, we consider two users (items) being distant if the shortest path that connects them include items (users). IGD is the average of the number of nodes of the same type normalized by their distance to the considered node. Formally, given the graph diameter:
(7) where measures the shortest path length between two nodes of the same type.
The selected properties can describe the context on which GNNUERS operates, i.e. the GNN-based recommender systems, and insights on the unfairness can be uncovered by the variance of such properties across demographic groups, due to the intrinsic relationship between the given context and the unfairness. In particular, the degree (DEG) of a user node represents the interest towards the available items and the amount of information that the GNN can leverage in the aggregation step, the density (DY) of a user node captures the inclination to engage with popular items, the intra-group distance (IGD) of a user node indicates the propensity to interact with items valued by fellow users within the same demographic group. Moreover, the properties DEG and DY reflect the GNN ability to propagate information across the user nodes using the message passing mechanism, given that DEG and DY regard the nodes amount at the 1- and 2-hop distance respectively.
5.2. Data Preparation
| ML-1M (Harper and Konstan, 2016) | FENG222https://www.kaggle.com/datasets/chiranjivdas09/ta-feng-grocery-dataset | LFM-1K (Celma, 2010) | INS333https://www.kaggle.com/datasets/mrmorj/insurance-recommendation | ||
| # Users | 6,040 | 25,741 | 268 | 346 | |
| # Items | 3,706 | 23,643 | 51,609 | 20 | |
| # Interactions | 1,000,209 | 708,919 | 200,586 | 1,879 | |
| Min. User DEG | 20 | 5 | 21 | 5 | |
| Domain | Movie | Grocery | Music | Insurance | |
| Repr. | A | O : 43.4%; Y : 56.6% | O : 45.5% ; Y : 54.5% | O : 42.2%; Y : 57.8% | O : 49.4%; Y : 50.6% |
| G | F : 28.3%; M : 71.7% | NA | F : 42.2%; M : 57.8% | F : 23.4%; M : 76.6% | |
| A | O : 106.1; Y : 124.9 | O : 20.7; Y : 19.6 | O : 657.5; Y : 428.0 | O : 4.3; Y : 4.5 | |
| G | F : 101.8; M : 122.7 | NA | F : 496.7; M : 545.3 | F : 4.2; M : 4.5 | |
| Gini User DEG | A | O : 0.53; Y : 0.52 | O : 0.45; Y : 0.44 | O : 0.43; Y : 0.43 | O : 0.06; Y : 0.08 |
| G | F : 0.53; M : 0.52 | NA | F : 0.42; M : 0.45 | F : 0.05; M : 0.08 | |
| A | O : 0.07; Y : 0.07 | O : 0.00; Y : 0.00 | O : 0.03; Y : 0.03 | O : 0.40; Y : 0.38 | |
| G | F : 0.07; M : 0.07 | NA | F : 0.04; M : 0.04 | F : 0.40; M : 0.39 | |
| Gini User DY | A | O : 0.12; Y : 0.11 | O : 0.45; Y : 0.42 | O : 0.22; Y : 0.18 | O : 0.12; Y : 0.14 |
| G | F : 0.12; M : 0.12 | NA | F : 0.15; M : 0.23 | F : 0.14; M : 0.13 | |
| A | O : 0.95; Y : 0.96 | O : 0.57; Y : 0.56 | O : 0.99; Y : 0.99 | O : 0.97; Y : 0.97 | |
| G | F : 0.95; M : 0.96 | NA | F : 0.99; M : 0.99 | F : 0.97; M : 0.97 | |
| Gini User IGD | A | O : 0.03; Y : 0.02 | O : 0.05; Y : 0.05 | O : 0.01; Y : 0.01 | O : 0.01; Y : 0.01 |
| G | F : 0.03; M : 0.02 | NA | F : 0.00; M : 0.01 | F : 0.01; M : 0.01 | |
Extensive research in user fairness in recommender systems is challenging due to the limited datasets including users’ sensitive information. We relied on the artifacts of a recent work accounting unfairness issues in recommendation (Boratto et al., 2022), which performed a fairness assessment on two corpora: MovieLens 1M (ML-1M), on the movie domain, and Last.FM 1K (LFM-1K), on the music domain. The time information of the users’ interaction in LFM-1K was missing, so, given that the interactions of each user are grouped by artist and considered as a single interaction, we set the timestamp of the last interaction with an artist to be the timestamp of the relative user-artist pair in LFM-1K. We extended the set of datasets by including Insurance (INS), on the insurance domain, and Ta Feng (FENG), on the grocery domain444Yelp (Mansoury et al., 2019) was also considered to include the business domain, but the users’ gender information was predicted by their name, making questionable analyses on this dataset.. All datasets include age and gender (except FENG) information for all users and their statistics are listed in Table 1, where the graph properties values regard only the training set. The Gini coefficient for each property was measured as in (Fabbri et al., 2022).
User nodes in INS and FENG were filtered by their number of interactions, i.e., their degree, so as to take into account users with histories made up of at least 5 items. Duplicated interactions, e.g., users buying the same product twice in FENG, were removed. On the basis of the binary setting mentioned in Section 4.3 and as done in (Boratto et al., 2022), INS and FENG age labels were binarized as Younger (Y) and Older (O), such that the Younger group is more represented than the Older one for consistency with ML-1M and LFM-1K, while gender labels were already binary, as Males (M) and Females (F).
We also adopted the splitting strategy used in (Boratto et al., 2022) for each dataset: per each user, 20% (the most recent if a timestamp is available, randomly sampled otherwise) of the interactions forms the test set; the remaining interactions are split again, such that 10% (selected in the same way) of this interactions subset forms the validation set and the remaining 70% forms the train set. The validation set was used to select the training epoch where the model reported the best recommendation utility on the adjacency matrix . Given the goal of finding the edges causing unfairness in the test set, the truth ground labels of the latter were extracted to optimize the fairness loss in .
5.3. Models
Recently, novel GNNs have been devised to solve the top-n recommendation task. We relied on Recbole, which includes different families of GNNs-based recommender systems. GNNUERS was adopted on the following models:
-
•
GCMC (van den Berg et al., 2017): this method is comprised of two components: a graph auto-encoder, which produces a node embedding matrix, and a decoder model, which predicts the relevance of the missing entries in the adjacency matrix from the node embedding matrix.
-
•
NGCF (Wang et al., 2019): this state-of-the-art GNN-based recommender system propagates embeddings in the user-item graph structure. In particular, it leverages high-order connectivities in the user-item integration graph, injecting the collaborative signal into the embedding process in an explicit manner.
-
•
LigthGCN (He et al., 2020): it is a simplification of a GCN, including only the most essential components for collaborative filtering, i.e., the neighborhood aggregation. It uses a single embedding as the weighted sum of the user and item embeddings propagated at all layers in the user-item interaction graph.
These three GNNs are trained with the default hyper-parameters defined by Recbole, specific for each model.
5.4. Explanation Baseline Methods
As mentioned in Section 4.2, GNNUERS in its base form applies a policy that prevents the algorithm from restoring previously deleted edges. Additionally, we examined an extension of GNNUERS by applying another policy, Connected Nodes (CN): it limits the perturbation to the edges connected to the unprotected user nodes to investigate whether recommendations unfairness is only due to the interactions performed by the unprotected group. Therefore, CN guides the learning process to select the users’ actions of the unprotected group that made favor them.
The literature does not include baselines that explain unfairness in the form of user-item edges as GNNUERS. The works proposing unfairness explainability methods in recommendation (Deldjoo et al., 2021; Ge et al., 2022) select relevant user/item features as explanations, which cannot be compared with the ones generated by our framework. Approaches proposed to explain unfairness in GNNs (Dong et al., 2023) were devised for classification tasks: although it is not clear if this method could be extended to recommendation tasks, such an engineering adaptation goes beyond the goal of our work. Other alternative counterfactual explainability algorithms in GNNs (Lucic et al., 2022; Kang et al., 2021) generate explanations at the instance level, which cannot be adapted to envision the unfairness task at the model level.
To this end, we adopted CASPER (Oh et al., 2022) for comparison, a model-agnostic method that causes the highest instability in the recommendations by perturbing a single interaction, i.e. an edge of the graph. The instability induced by CASPER could alter the recommendations, and, as a result, re-distributing the utility levels over the demographic groups and positively affecting unfairness. At inference step, our models generate the recommendation lists by using the training network perturbed by CASPER, then fairness and utility metrics are measured. CASPER uses the timestamp of each interaction to generate a directed acyclic graph of the interactions of each user. INS does not include the time information, so CASPER was not applied on this dataset.
We also introduce RND-P as sanity check, a baseline algorithm that at each iteration randomly perturbs edges with a probability , such that it mimics the GNNUERS edges selection process, but based on a random choice. Given the size diversity of our evaluation datasets, we set , where is the set of training edges, as the value that works best across the selected epochs, such that RND-P perturbs edges depending on the network size to prevent this method from deleting all the edges in a few iterations.
The explanations methods were executed on all the models and datasets over 800 epochs adopting an early stopping method when does not improve with a delta higher than 0.001 for at least 15 consecutive epochs. The best hyperparameters (learning rate, , batch size) can be found in the source code repository.
5.5. RQ1: Unfairness Explainability Benchmark
 |
 |
| ML-1M | FENG |
 |
 |
| LFM-1K | INS |
 |
 |
| ML-1M | LFM-1K |
 |
|
| INS | |
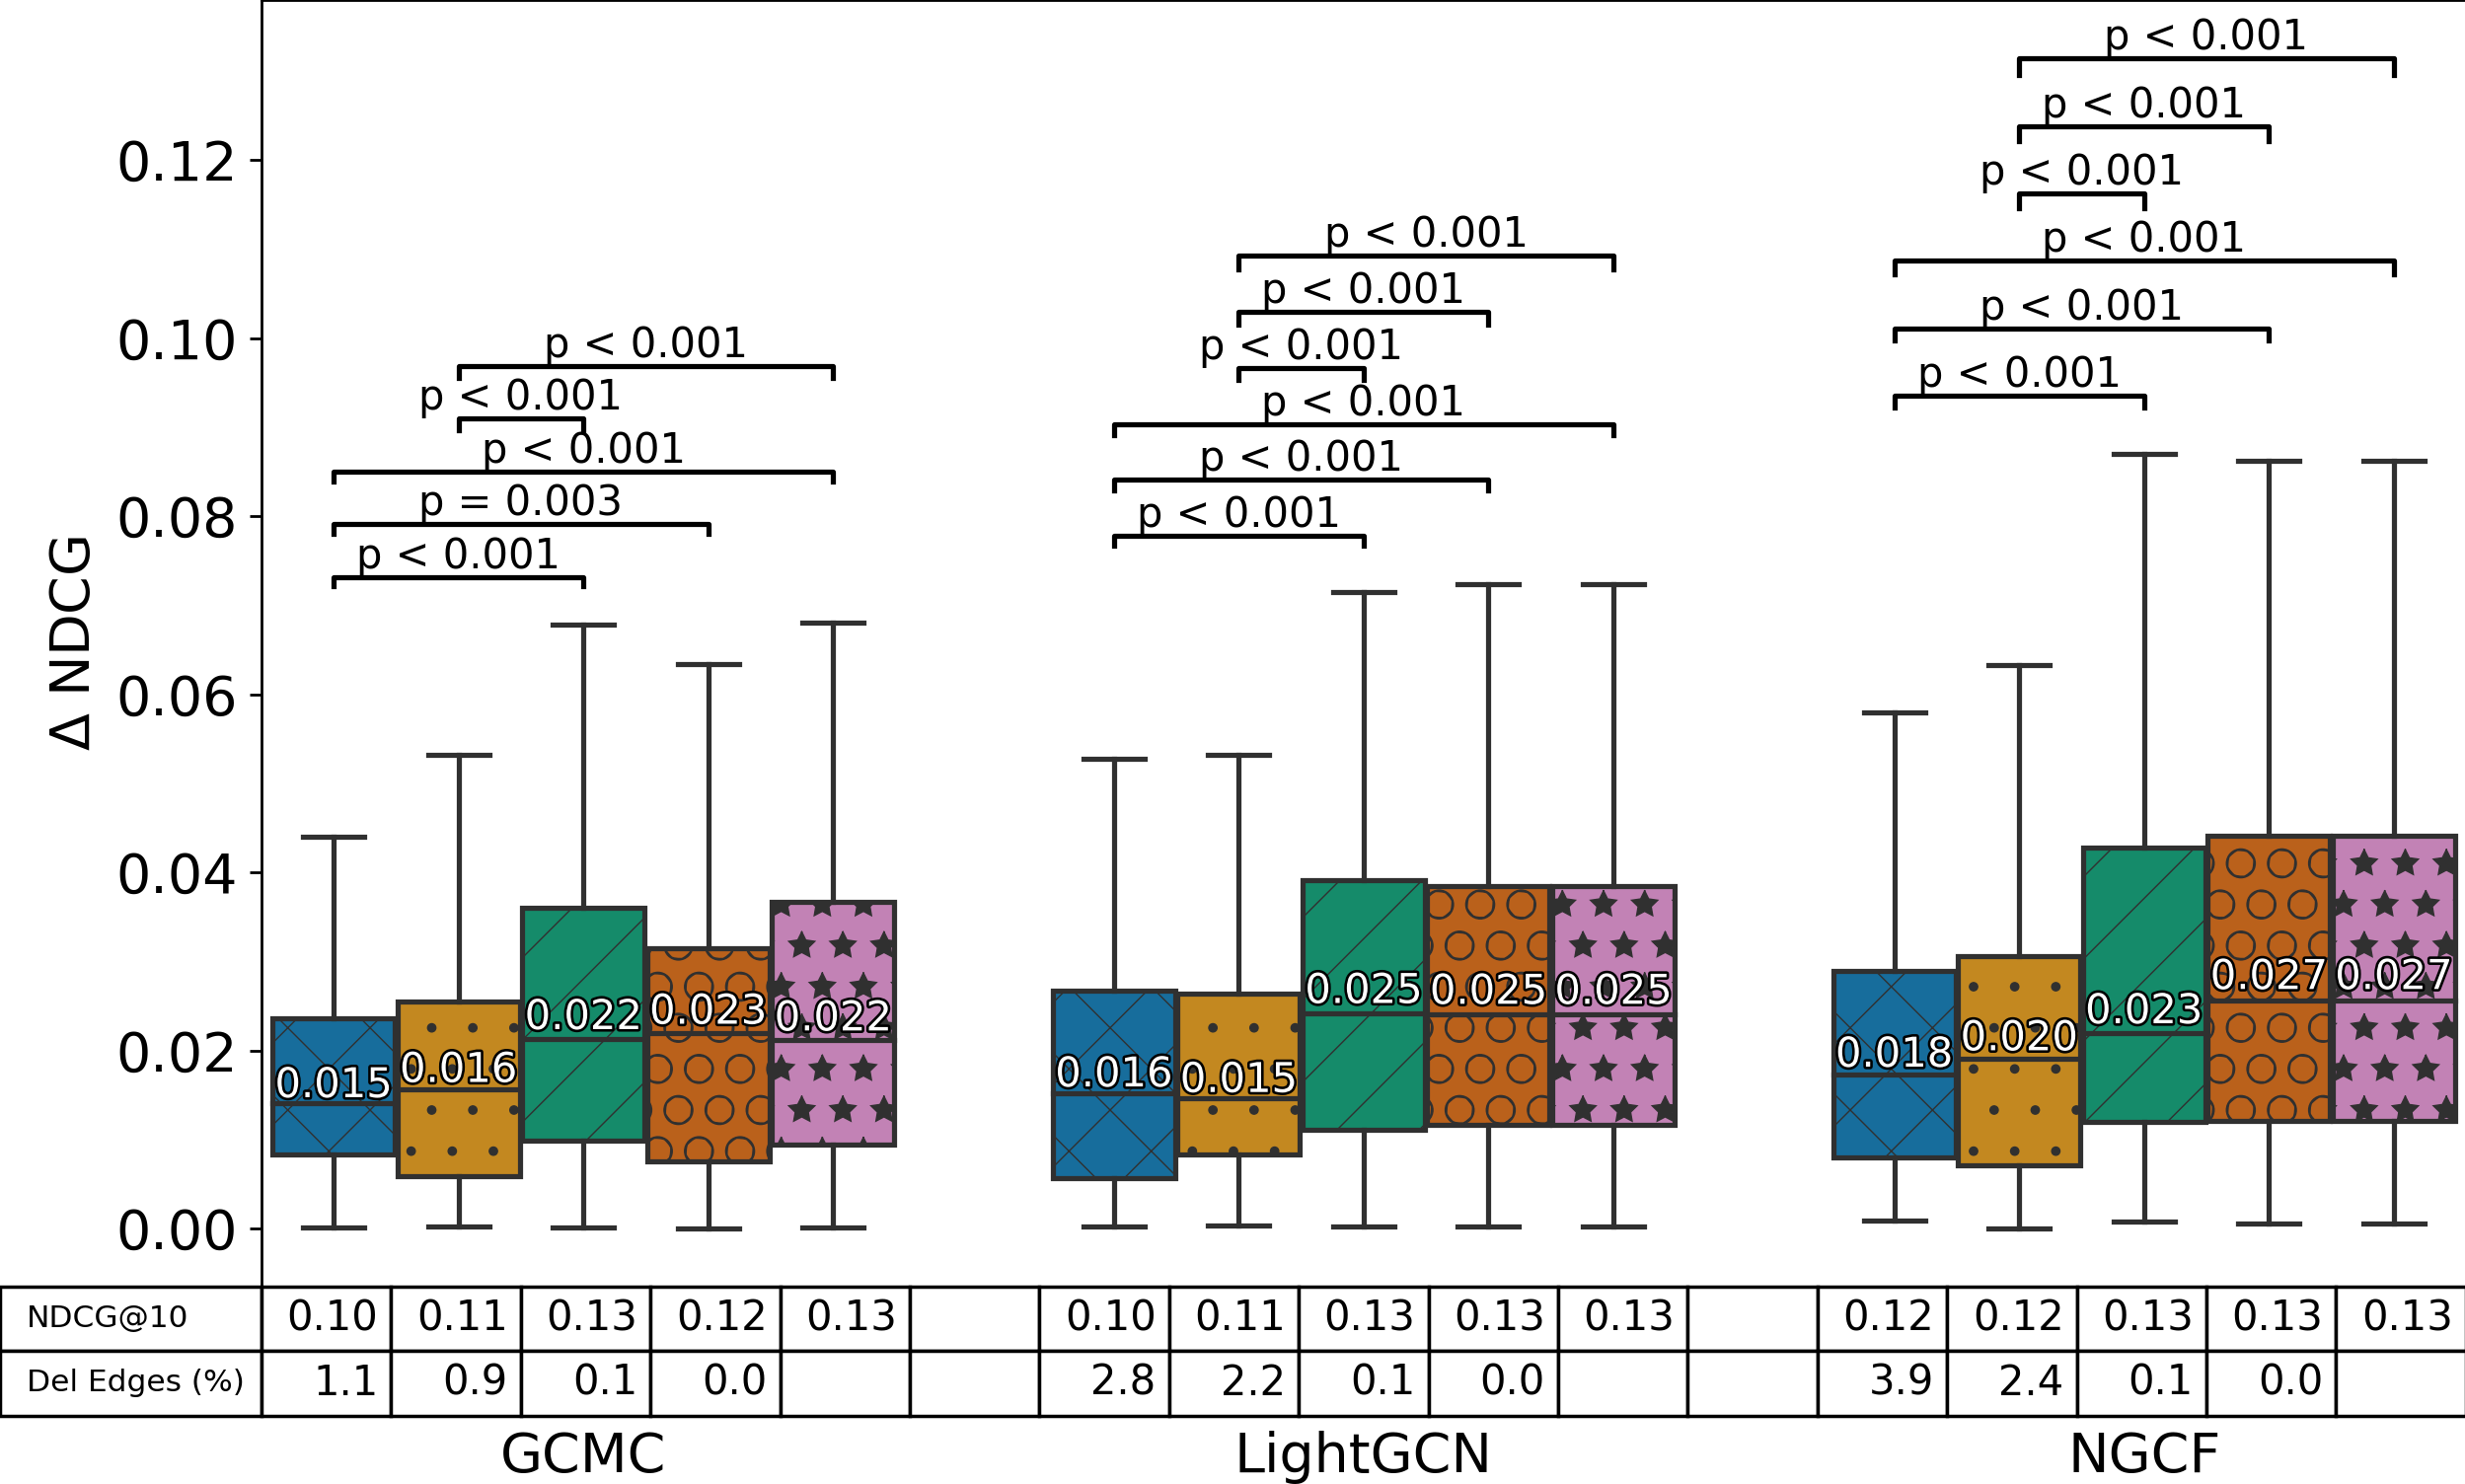
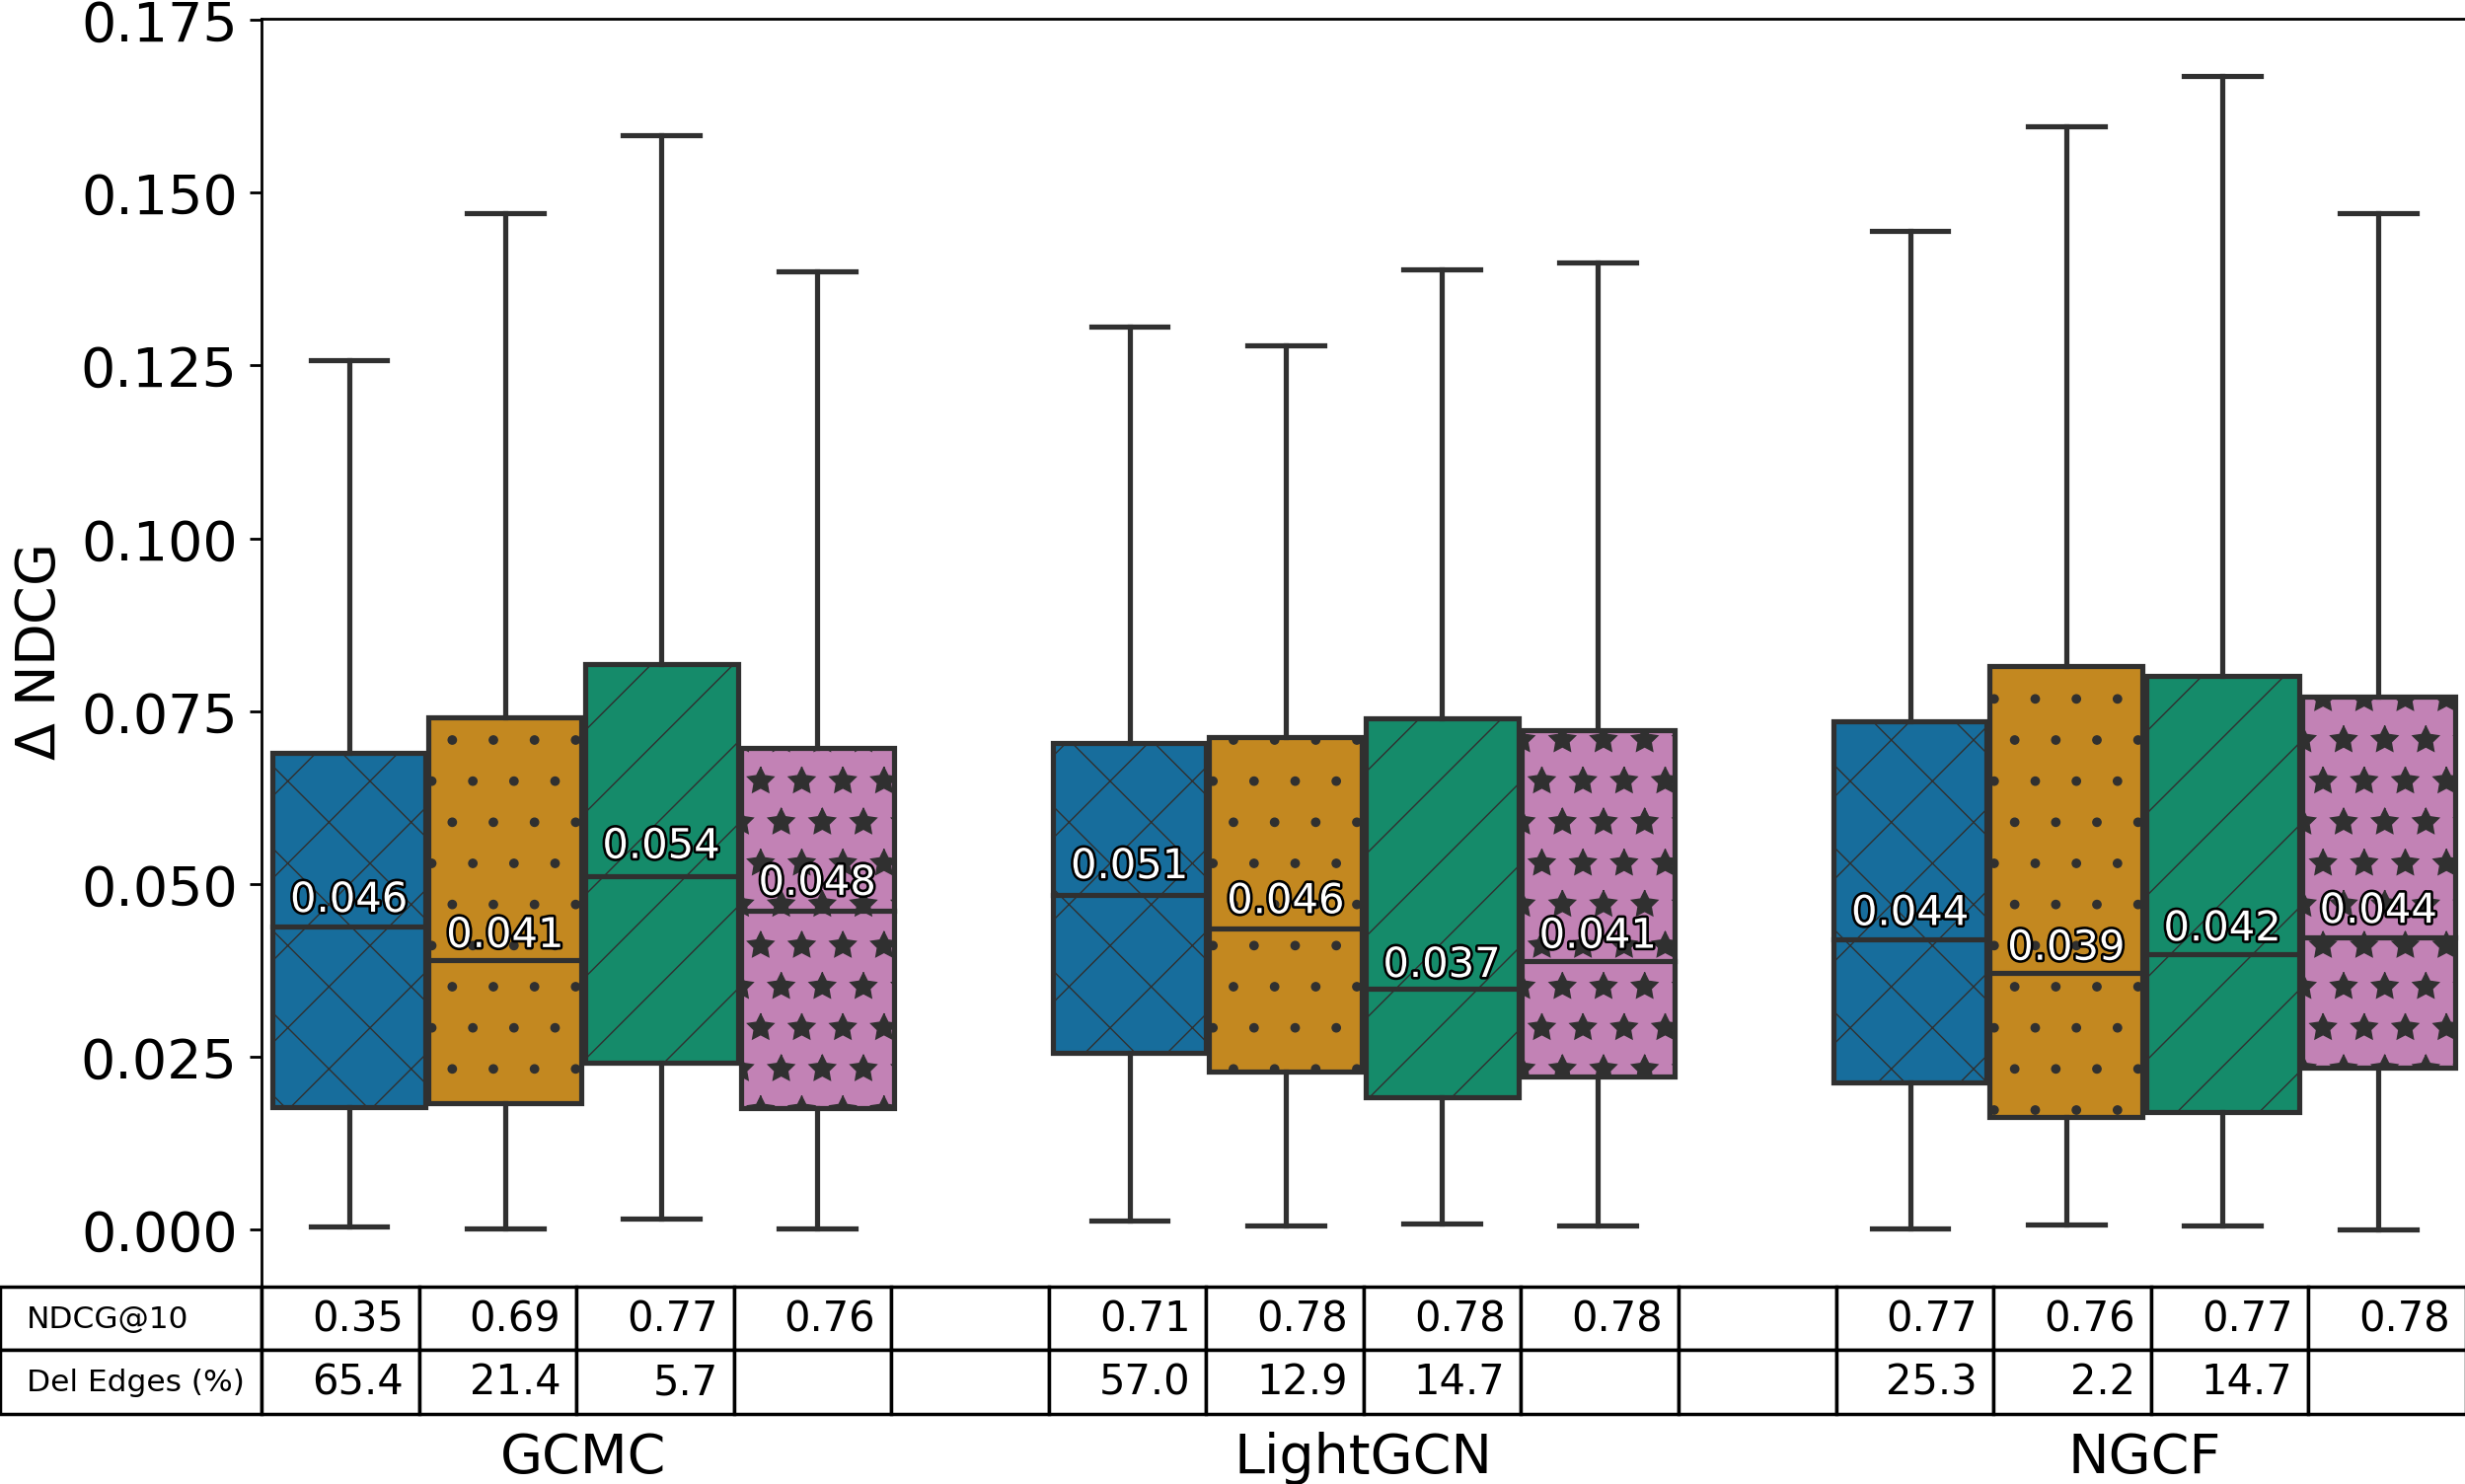
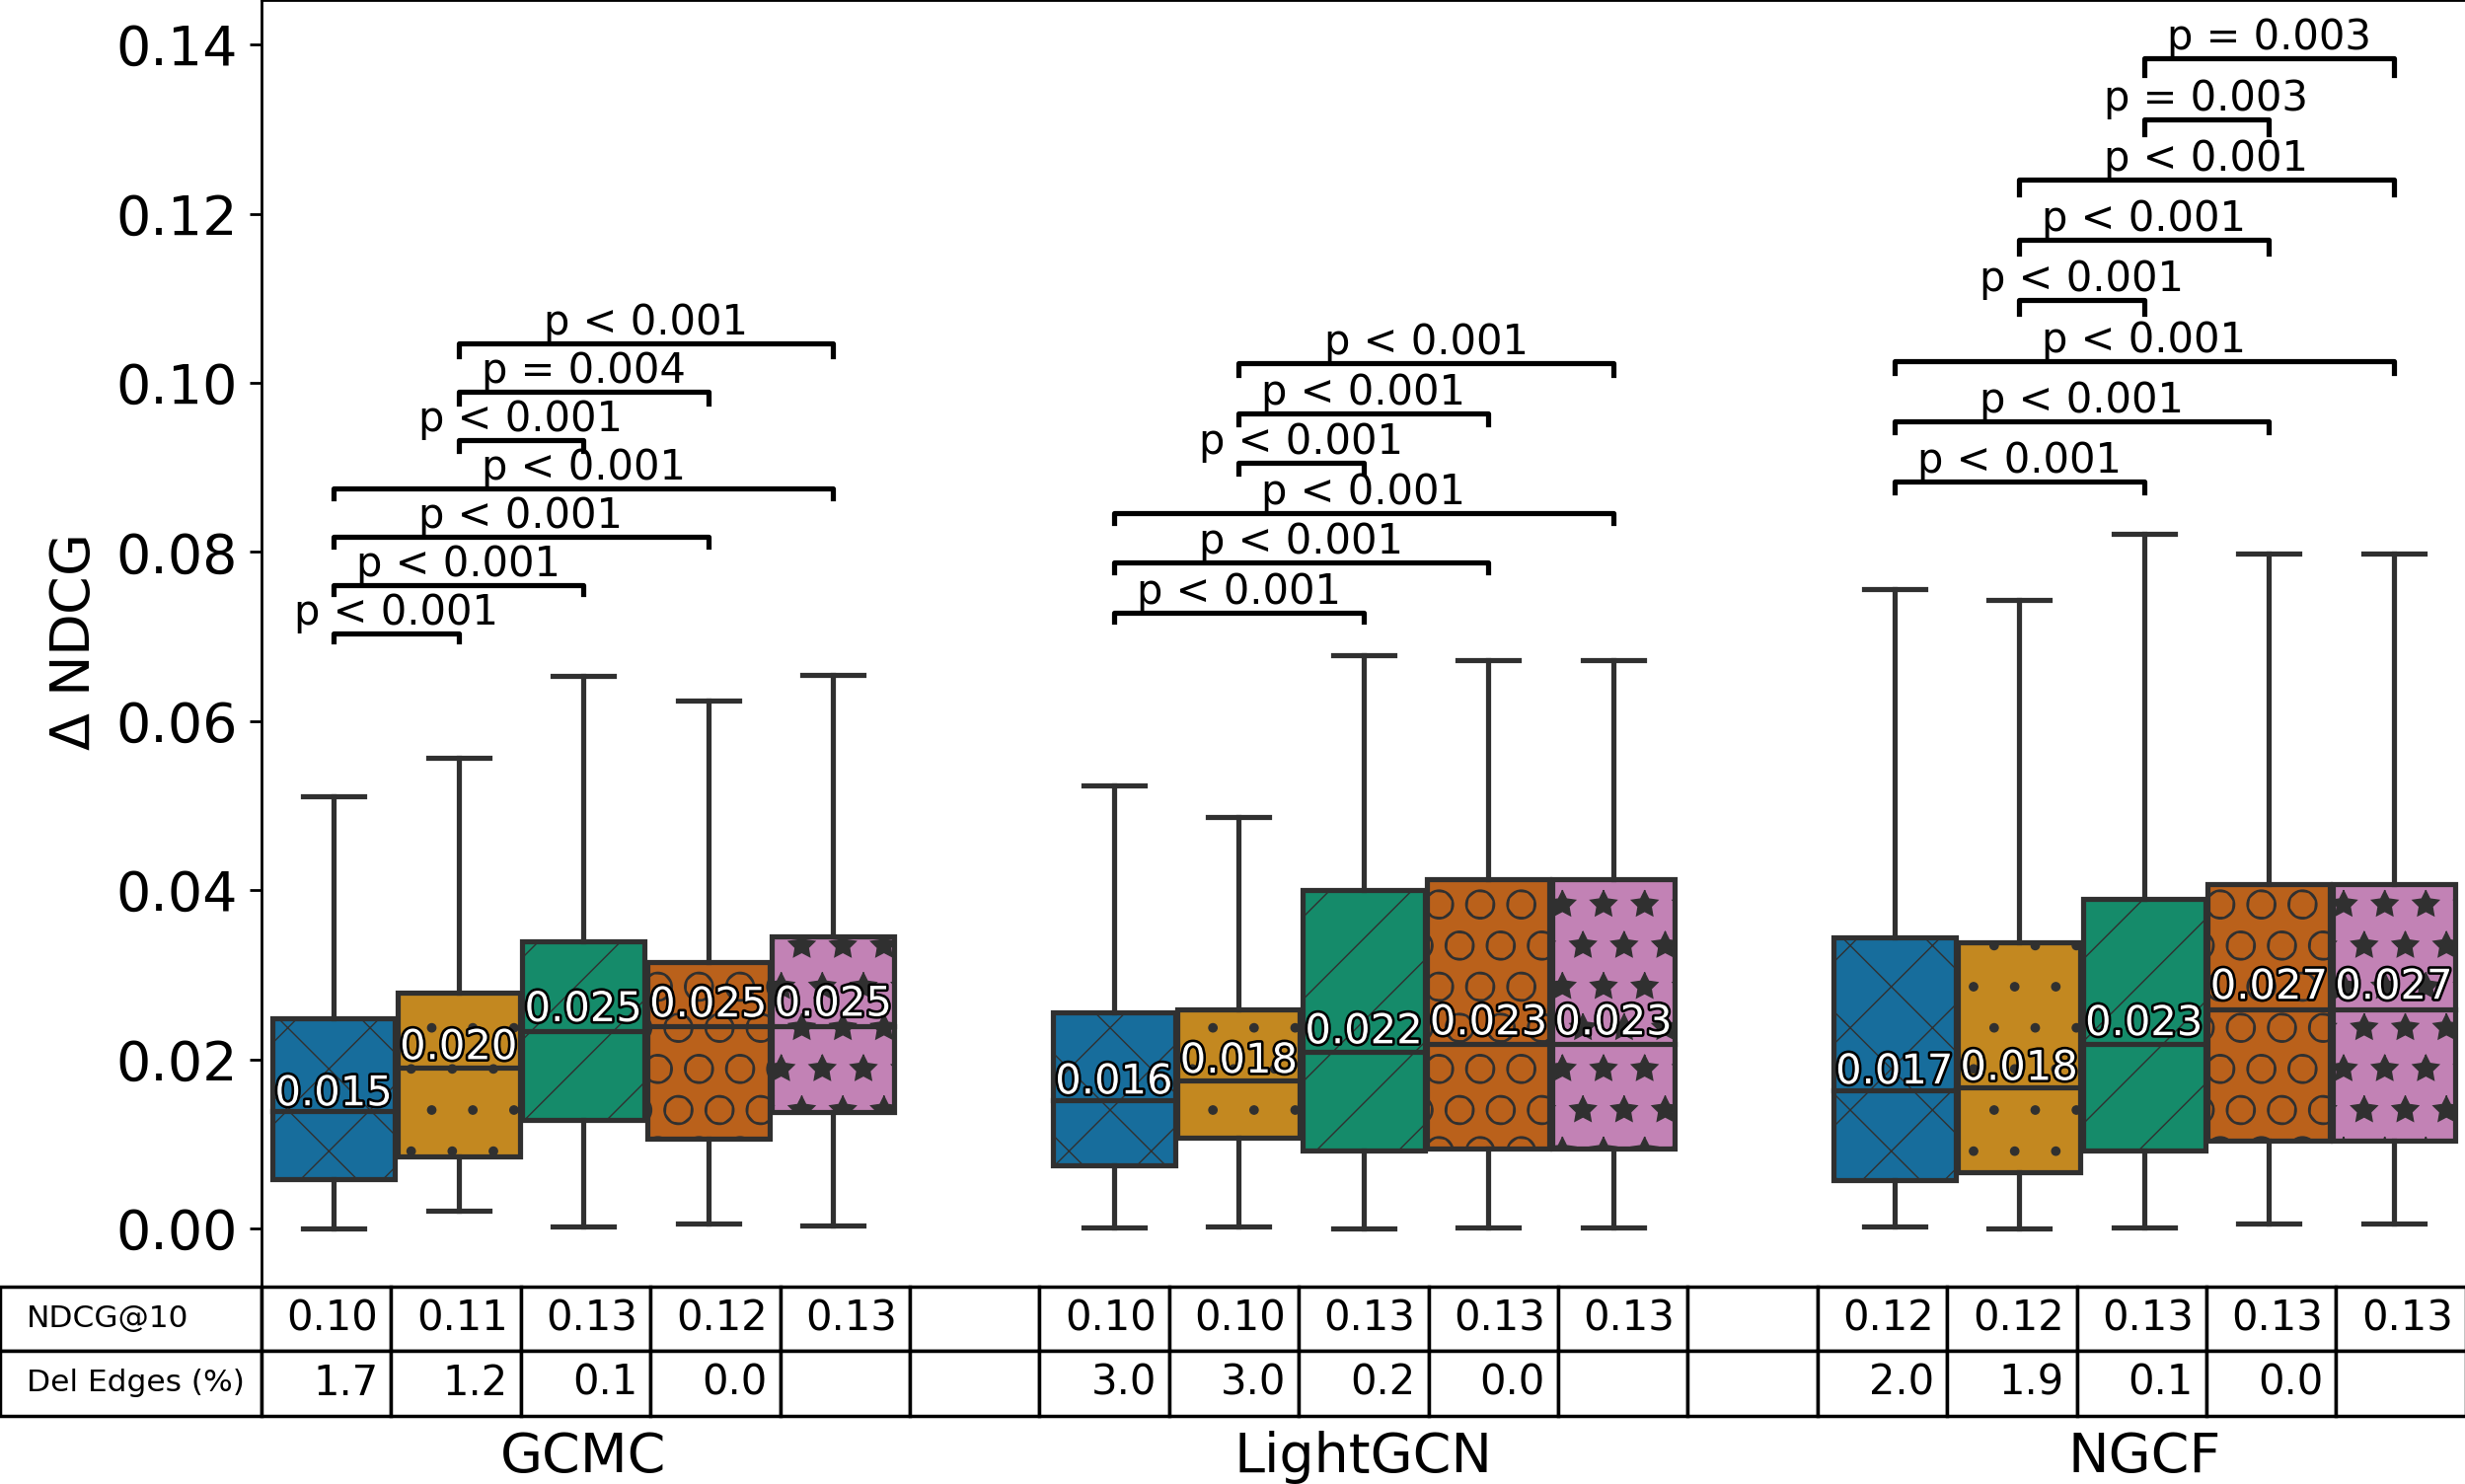
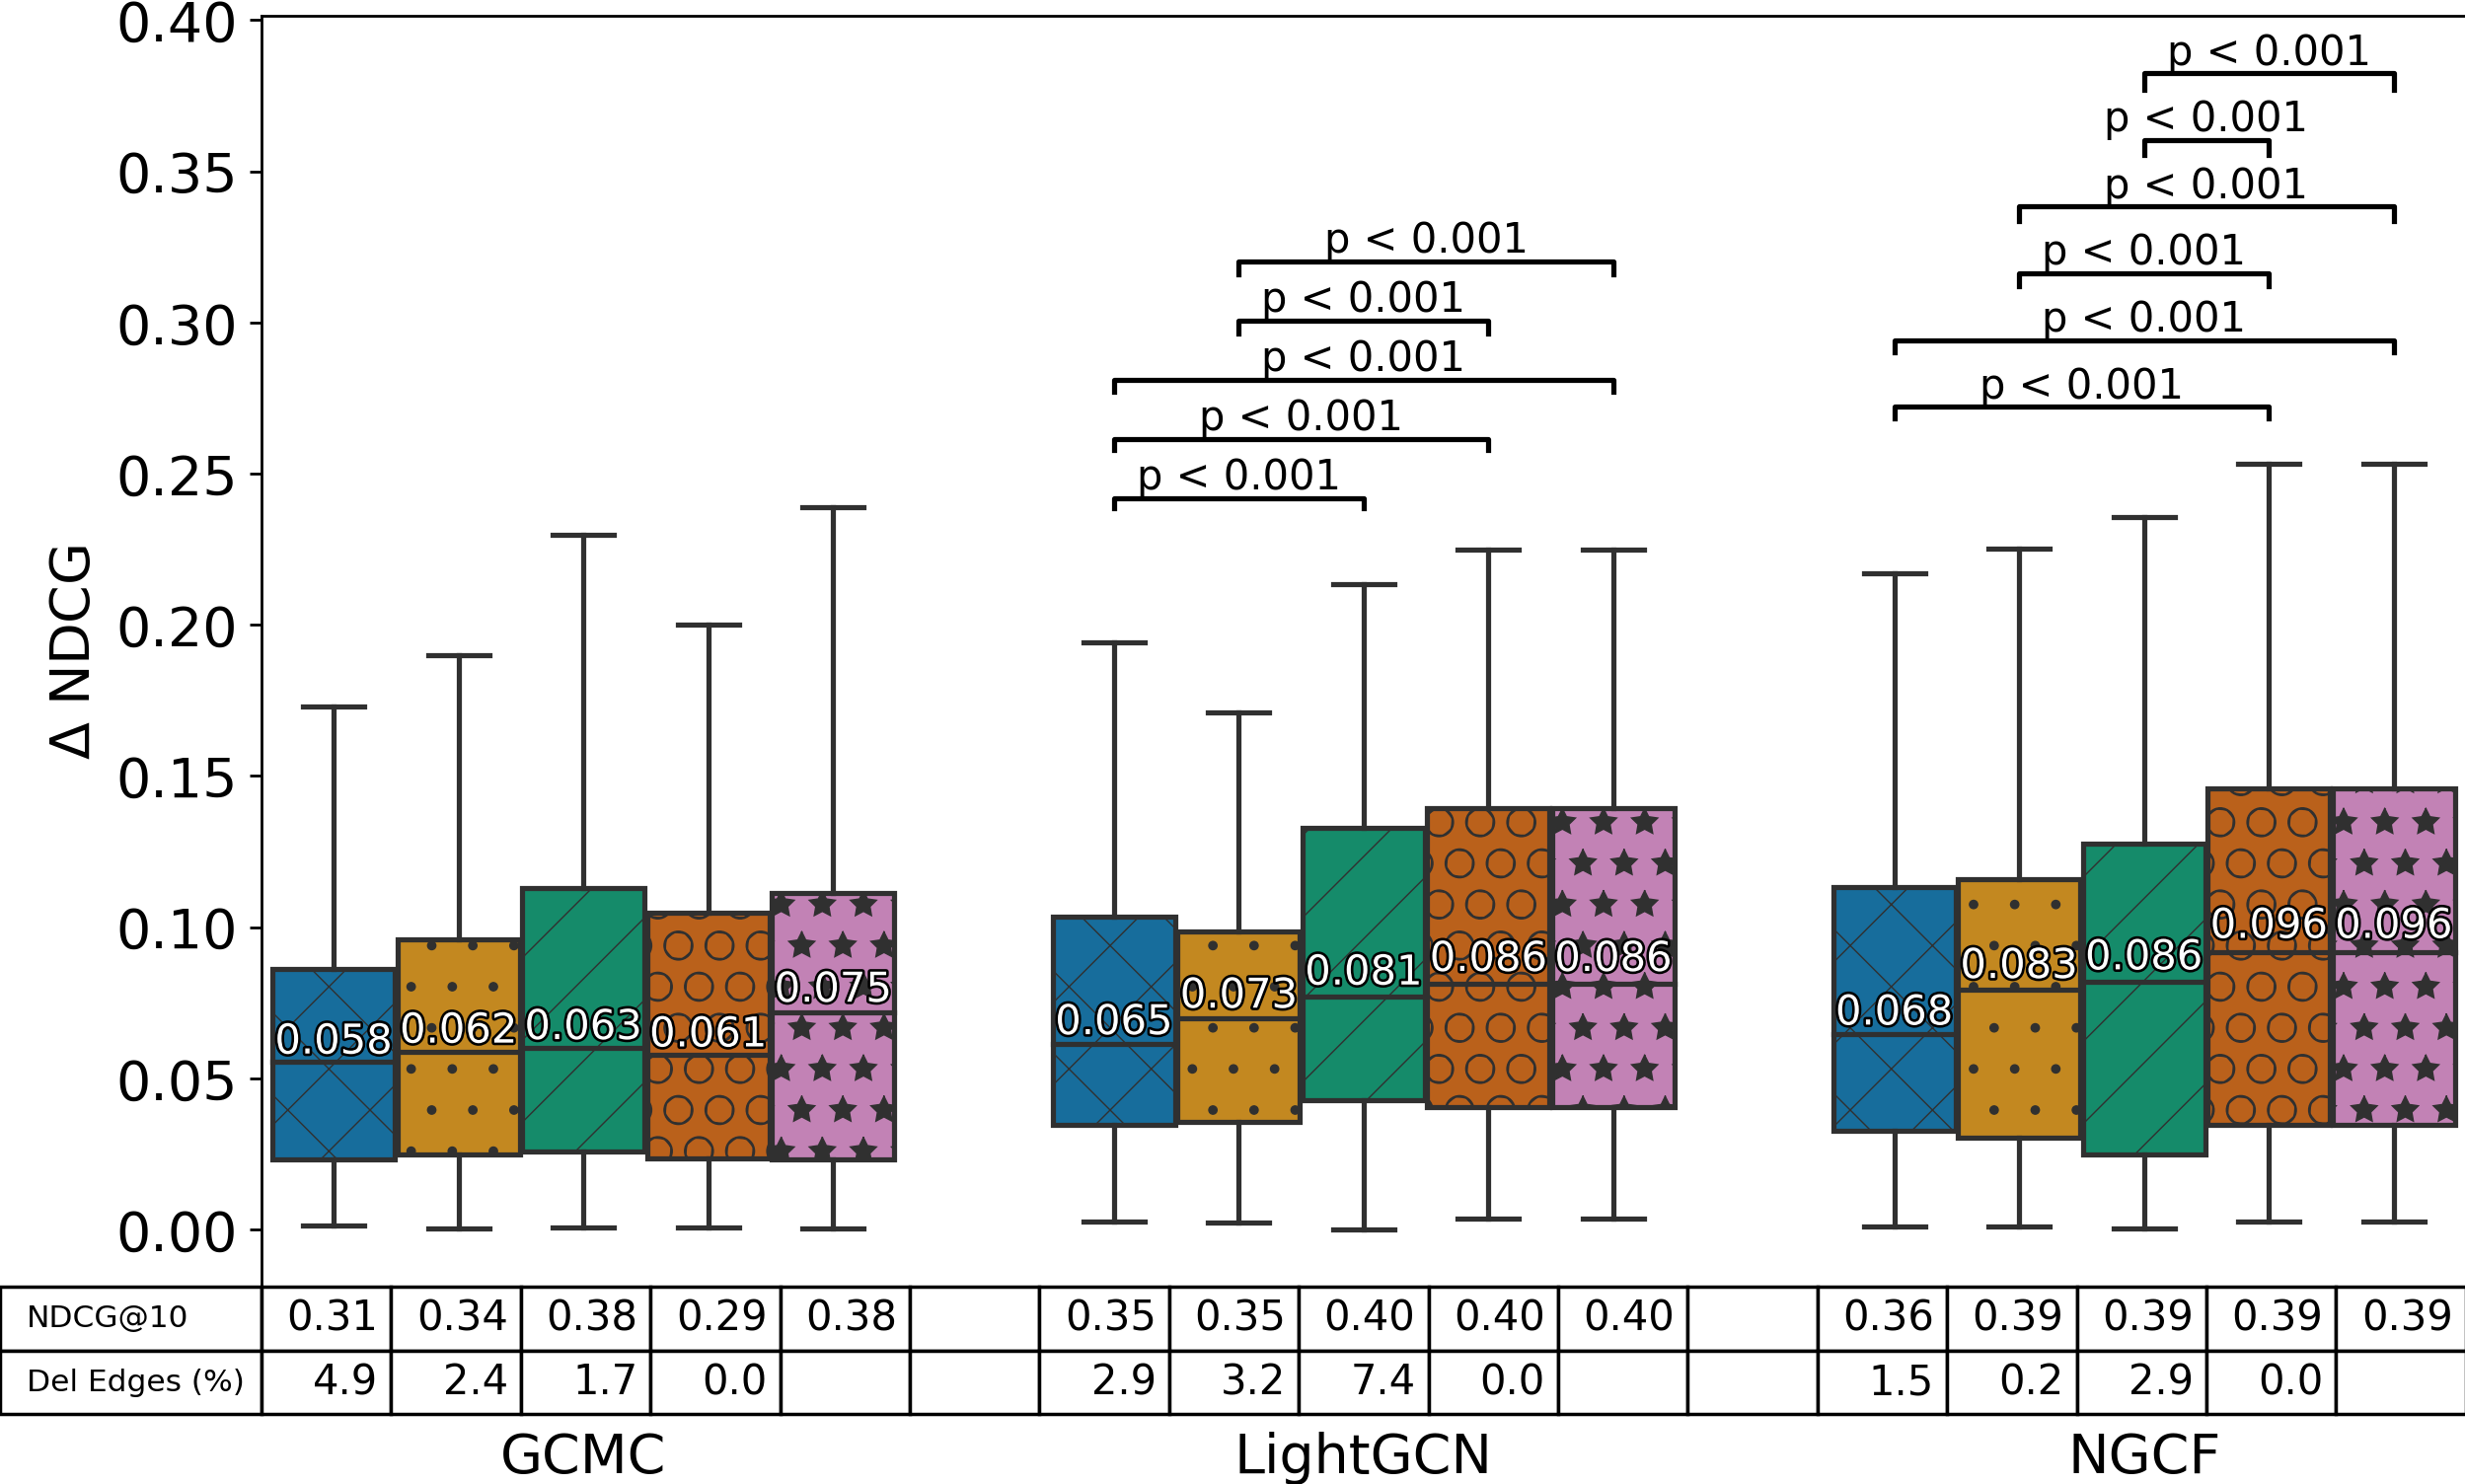
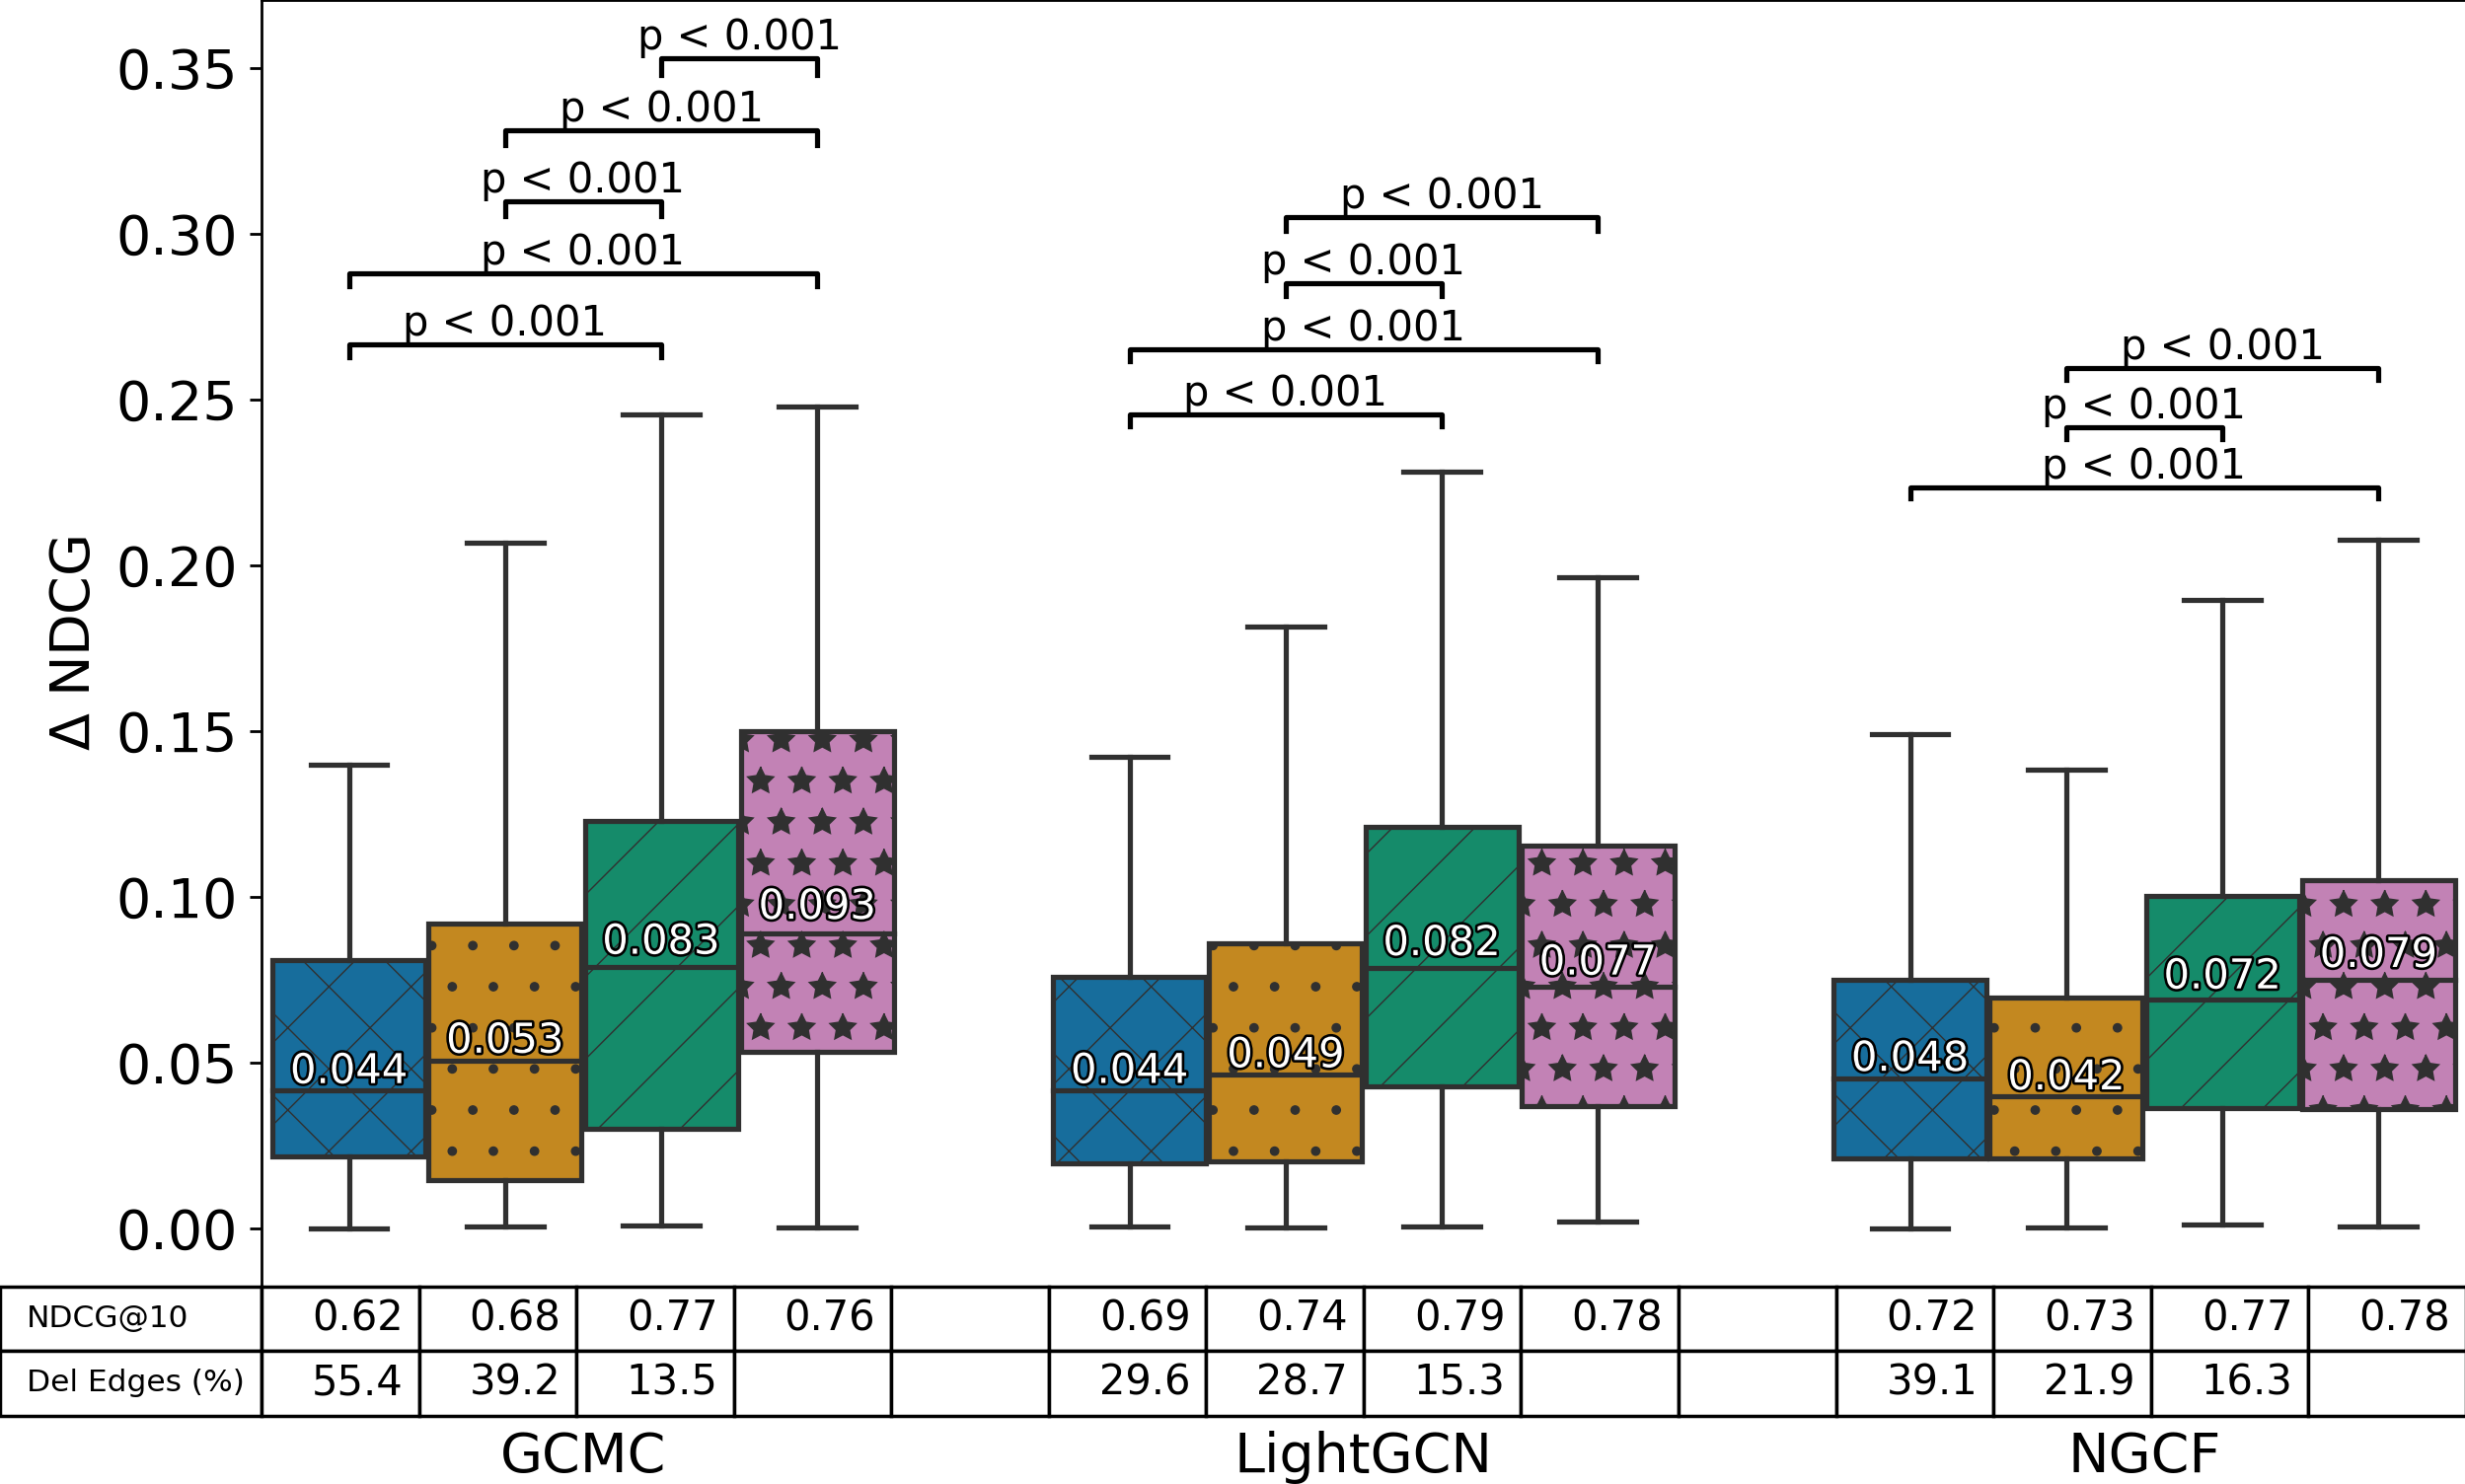
We first investigated the capability of GNNUERS to select counterfactual explanations that effectively optimize (3). GNNUERS learning process selects users coming from both demographic groups, stores them in fixed size batches according to their distribution in the dataset and, optimizes the loss to minimize disparity in NDCG@10 (average) between the protected and unprotected group. The evaluation follows an analogous process: we randomly sample 100 subgroups with the same demographic groups distribution, with sample size equal to the batch size. This choice is also due to reduce the sampling bias present in the datasets, i.e. the evaluation is not affected by the different sample size of unprotected and protected groups. The batch size for each dataset is selected such that it splits the users in at least five partitions, guaranteeing a low probability of picking the same users in the randomly sampled subgroups. We measure the differences in each subgroup with NDCG, which corresponds to the differences in performance between the two user groups, related to the unfairness level measured by (3) (without the modulus operator). We compare our proposed solution with CASPER, RND-P and the original values of NDCG.
Age. The Figure 2 shows the NDCG distribution across the subgroups by the demographic groups of ”age”. For each boxplot, on top of it, we include the Wilcoxon signed-rank test p-value significance of the difference between the means of each distributions pair (it is included IFF the p-values are lower than according to the Bonferroni correction, where is the number of pairwise comparisons performed for each model). On the bottom of the plots, we include the NDCG@10 after the perturbation and the percentage of deleted edges. First, we can see how in ML-1M and FENG, our methods significantly narrow the NDCG distribution of the age subgroups compared with NP by perturbing just 1% of the edges in some settings. The single edge deleted by CASPER minimally affects the recommendations of all the experiments, with more prominent effects on GCMC under several datasets, e.g. ML-1M, FENG. On the other hand, the perturbation applied by RND-P, in some cases, can generate a decrease in unfairness, but the early stopping prevents it from removing too many edges, which highlights its inefficiency in reducing NDCG. Among our methods, GNNUERS+CN reports the least perturbations and generates competitive decreases in NDCG.
On INS, no explanation method is consistent in reducing NDCG. This means that the differences in performance between the demographics groups derived from ”age” are not affected by the perturbation of individual interactions, but other aspects, e.g. specific nodes, caused the original disparity. Generally, we can see how both GNNUERS and GNNUERS+CN, are able to significantly reduce NDCG in most of the settings, selecting small subsets of deleted edges. Interestingly, in some cases, the NDCG@10 drops significantly (LFM-1K and FENG), while in others remain consistent (ML-1M). This means that our algorithms are able to generate explanations of the unfairness by detecting edges that contribute significantly to increase unfairness and to improve performances for only one subgroup.
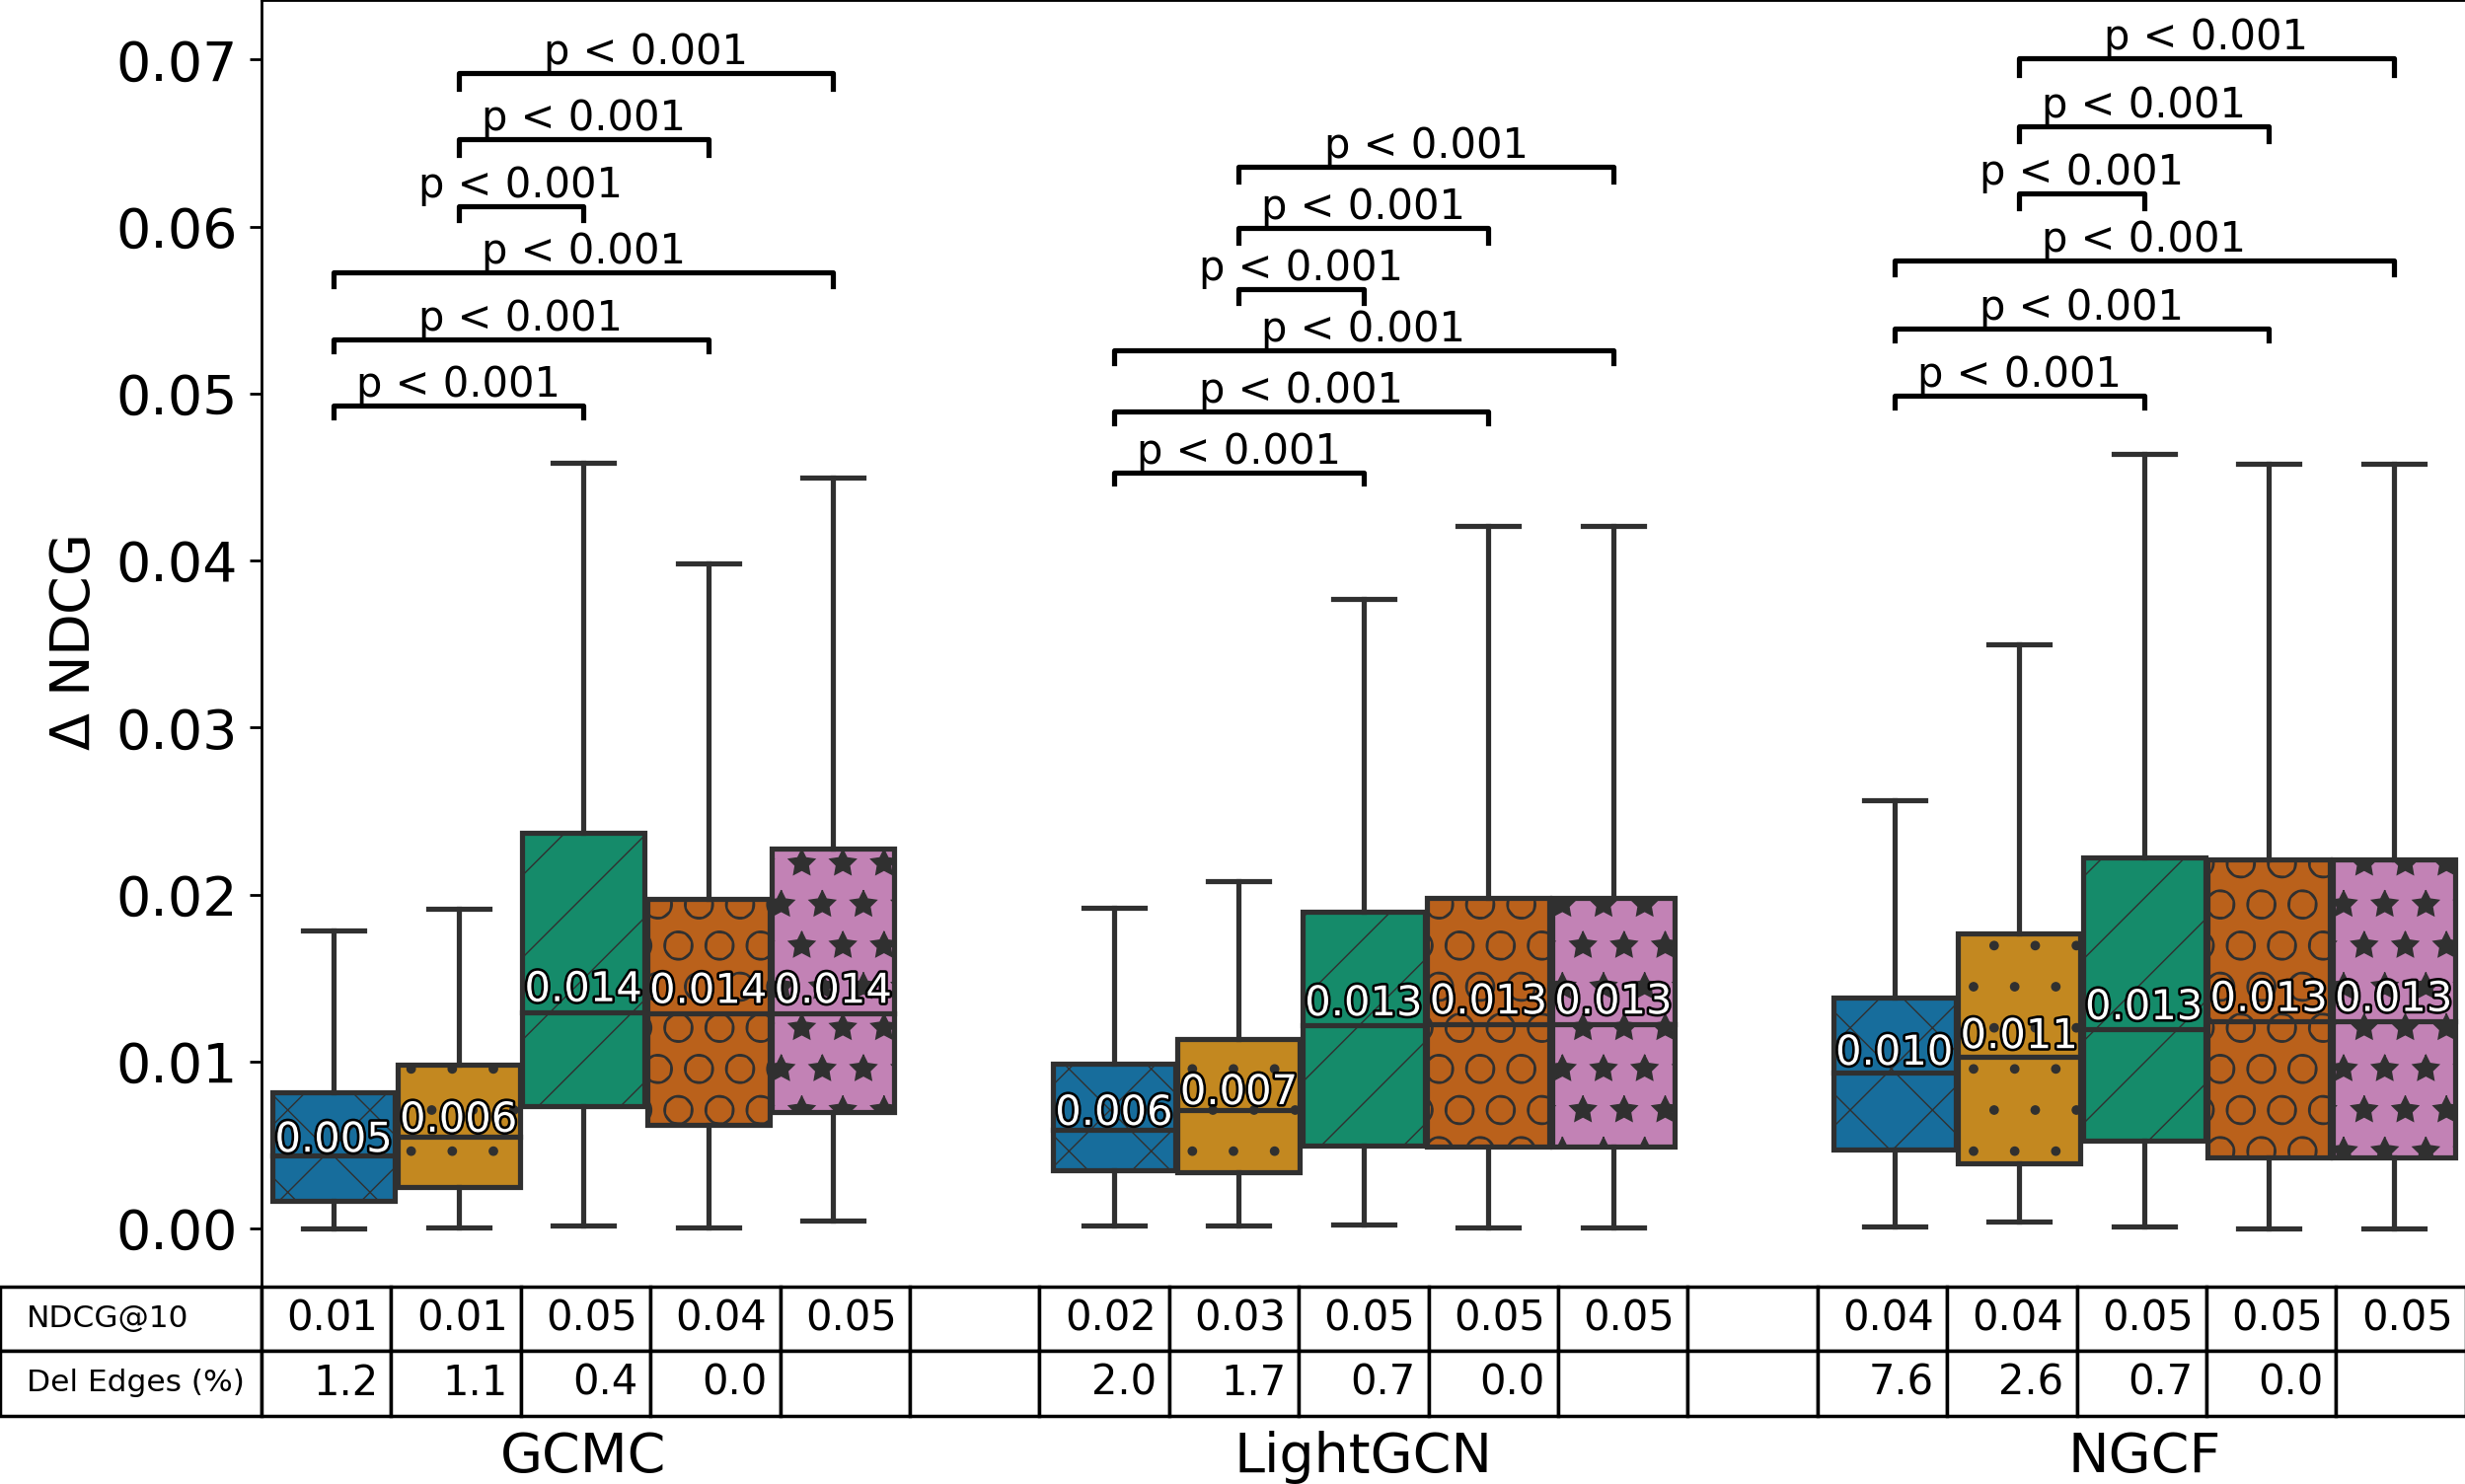
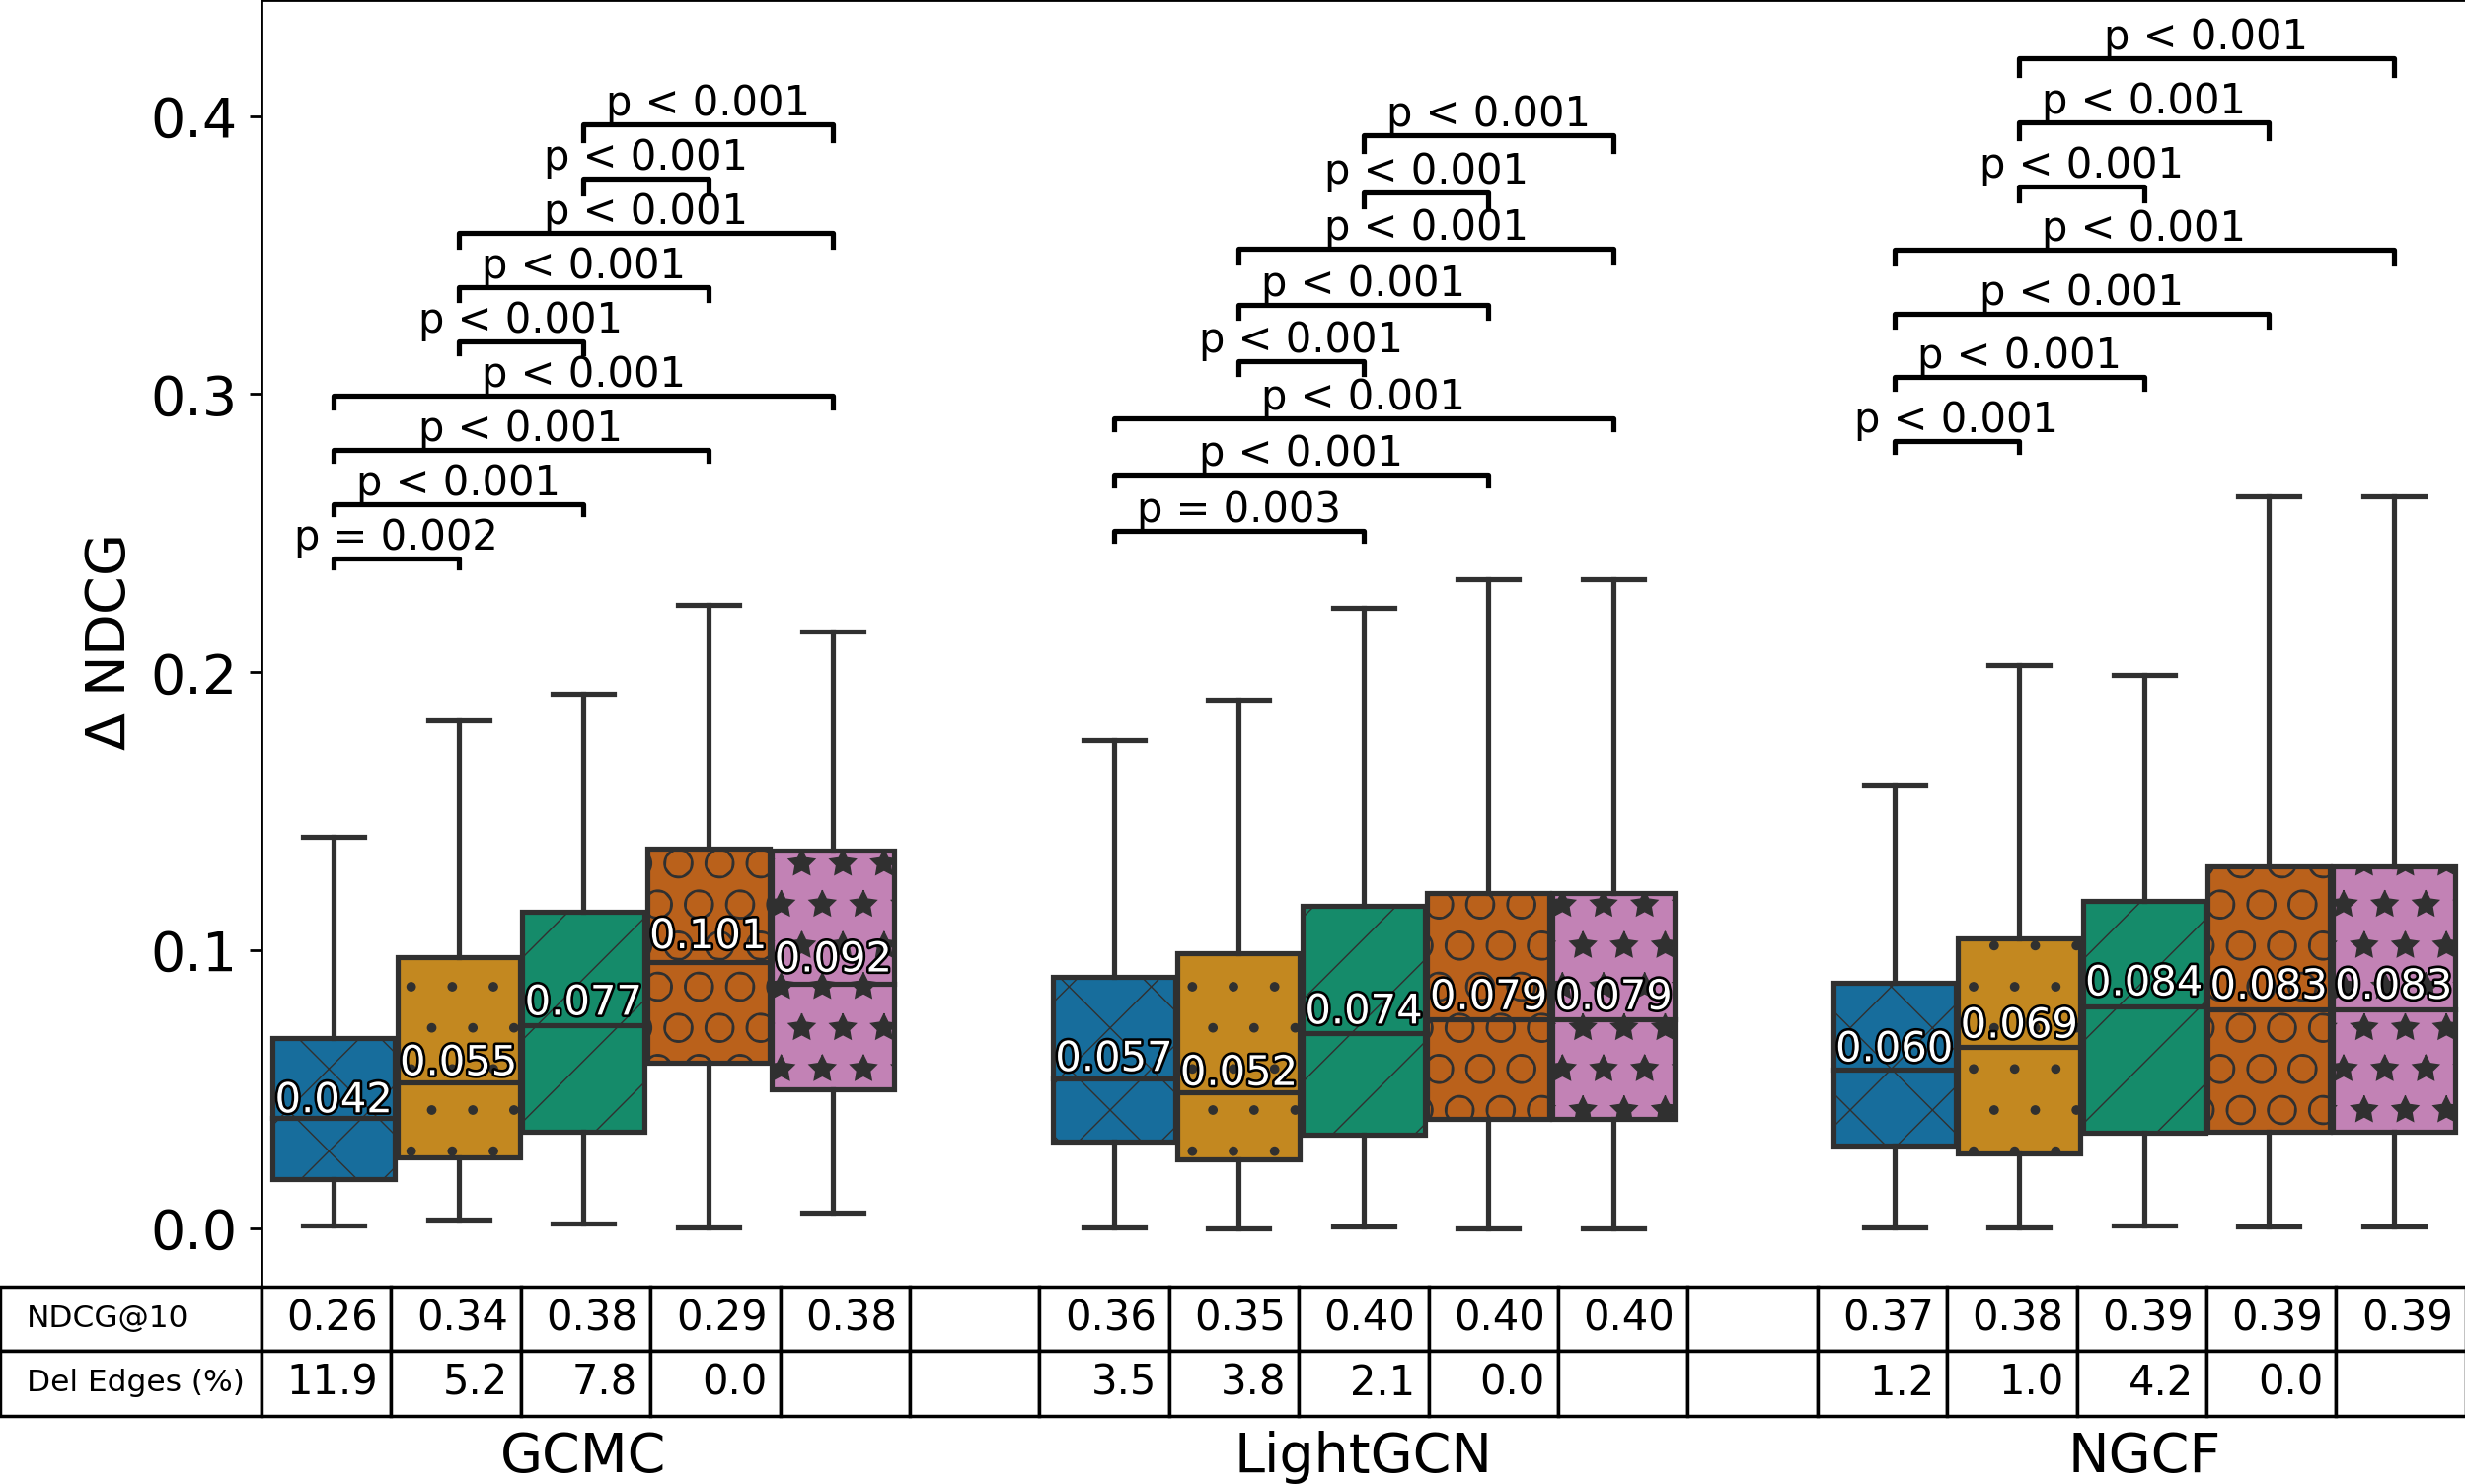
Gender. GNNUERS generates a significant decrease in NDCG also for the subgroups generated by the attribute ”gender”, as shown in Figure 3. In ML-1M and LFM-1K, GNNUERS significantly explains unfairness for all the models, reducing NDCG by a relatively lower amount compared to the same experiments on age groups, in particular on LFM-1K. Perturbing a single edge (CASPER) or more in a random way (RND-P) does not decrease NDCG in these cases (except for GCMC on LFM-1K), while our method has proven to be effective regardless of the sensitive attribute that defines the demographic groups. On INS, differently from what seen before, GNNUERS can reduce unfairness between gender groups, by deleting a relevant higher number of edges compared to other experiments. This result emphasizes how crucial is to select the right demographic attribute affecting the results.
RQ1. Except extreme cases, GNNUERS selects edges that systematically and significantly explain unfairness, regardless of the data, models and demographic groups on which is applied.
As shown in both demographic groups, NDCG is not always drastically impacted globally, for this reason we run a more thorough analysis on the impact on utility.
5.6. RQ2: Impact on Recommendation Utility
| Age | Gender | |||||
|---|---|---|---|---|---|---|
| Model | Policy | Younger | Older | Males | Females | |
| ML-1M | GCMC | GNNUERS | 0.11* (-21.6%) | 0.11* (-11.6%) | 0.10* (-24.2%) | 0.10* (-14.6%) |
| GNNUERS+CN | 0.12* (-14.0%) | 0.11* (-06.7%) | 0.11* (-16.3%) | 0.10* (-10.2%) | ||
| LightGCN | GNNUERS | 0.11* (-21.6%) | 0.10* (-15.4%) | 0.10* (-22.8%) | 0.09* (-17.6%) | |
| GNNUERS+CN | 0.11* (-16.7%) | 0.10* (-10.6%) | 0.11* (-19.4%) | 0.09* (-14.1%) | ||
| NGCF | GNNUERS | 0.12* (-11.6%) | 0.11* (-02.7%) | 0.13* (-07.8%) | 0.11* (-01.8%) | |
| GNNUERS+CN | 0.13* (-09.2%) | 0.12 (-00.4%) | 0.13* (-07.1%) | 0.11 (-01.0%) | ||
| FENG | GCMC | GNNUERS | 0.01* (-67.0%) | 0.01* (-78.9%) | - | - |
| GNNUERS+CN | 0.02* (-62.4%) | 0.01* (-77.6%) | - | - | ||
| LightGCN | GNNUERS | 0.02* (-51.3%) | 0.02* (-61.2%) | - | - | |
| GNNUERS+CN | 0.03* (-36.7%) | 0.03* (-51.2%) | - | - | ||
| NGCF | GNNUERS | 0.04* (-10.4%) | 0.04* (-28.1%) | - | - | |
| GNNUERS+CN | 0.04* (-01.9%) | 0.05* (-13.2%) | - | - | ||
| LFM-1K | GCMC | GNNUERS | 0.27* (-22.8%) | 0.26* (-40.4%) | 0.33* (-12.0%) | 0.31* (-26.4%) |
| GNNUERS+CN | 0.32* (-08.0%) | 0.36* (-16.4%) | 0.35* (-05.9%) | 0.35* (-17.4%) | ||
| LightGCN | GNNUERS | 0.34* (-05.9%) | 0.37* (-15.5%) | 0.34* (-07.9%) | 0.37* (-16.7%) | |
| GNNUERS+CN | 0.33* (-09.5%) | 0.37* (-15.8%) | 0.35* (-07.4%) | 0.38* (-13.9%) | ||
| NGCF | GNNUERS | 0.35* (-01.5%) | 0.39* (-09.6%) | 0.36 (-00.9%) | 0.38* (-12.4%) | |
| GNNUERS+CN | 0.35 ( 00.2%) | 0.40* (-05.9%) | 0.37* ( 02.5%) | 0.42* (-04.1%) | ||
| INS | GCMC | GNNUERS | 0.37* (-52.7%) | 0.33* (-56.8%) | 0.62* (-20.0%) | 0.60* (-13.3%) |
| GNNUERS+CN | 0.69* (-10.6%) | 0.70* (-08.0%) | 0.68* (-12.4%) | 0.67* (-02.7%) | ||
| LightGCN | GNNUERS | 0.71* (-09.9%) | 0.71* (-08.4%) | 0.69* (-12.8%) | 0.69* (-05.2%) | |
| GNNUERS+CN | 0.79 ( 00.1%) | 0.78 ( 00.3%) | 0.74* (-06.7%) | 0.73* ( 01.5%) | ||
| NGCF | GNNUERS | 0.78 (-00.3%) | 0.77* (-02.4%) | 0.72* (-09.6%) | 0.73* (-01.2%) | |
| GNNUERS+CN | 0.77* (-01.1%) | 0.76* (-03.8%) | 0.73* (-08.7%) | 0.74 ( 00.7%) | ||
GNNUERS is devised to minimize the gap in recommendation utility between the demographic groups, without or minimally affecting the utility for the protected group. We empirically evaluate this aspect, by examining the edges deletion impact on the utility for each group. The NDCG@10 was measured individually for both demographic groups to then averaging it by groups. The impact on recommendation utility was measured as the change in utility after applying the perturbation. To estimate this change significance, a Wilcoxon signed-rank was performed between the 100 NDCG@10 averages measured on the recommendations altered from each explanation method and the ones generated from the non-perturbed network. For this analysis we consider GNNUERS and its extended version GNNUERS+CN.
The Table 2 shows: the average utility (highlighted for the unprotected group) after perturbing the edges and its relative change from the original one between brackets; for each value, the symbol (*) denotes the significance of the statistical test with the 95% of confidence interval. We can see how, for any dataset and model, the NDCG change for the unprotected group is greater than the protected group one. This confirms that our algorithms can select the edges responsible for an higher utility for the unprotected group. However, also the NDCG for the protected group is affected in most of the experiments. This is because the results are model dependent, and removing edges reduces the connectivity, and then the information propagation through the GNN. Also, higher NDCG losses for the unprotected groups reflect a better unfairness explanation, as seen for all the models in FENG555GNNUERS learning process could be stopped once a desired level of fairness or utility is reached for the explanation, depending on the application requirements.. Based on this observation, since GNNUERS perturbations for NGCF result in the least faithful unfairness explanation w.r.t. the other models in the previous RQ, for the same model it reports the lowest loss in utility for both demographic groups. As a matter of fact, not only for NGCF the NDCG for the protected group is minimally affected, but it also increases in some settings, e.g., for males users in LFM-1K. The GNNUERS+CN policy enforces this behavior more than GNNUERS by a slight amount, except for FENG, where the NDCG is equal between deomgraphic groups, but GNNUERS reports an additional 10% loss in utility. Using GNNUERS+CN edges selection is then beneficial to reduce the impact on the NDCG for the protected group.
RQ2. GNNUERS and GNNUERS+CN reduce the utility for unprotected groups, detecting edges that generated a disparity in performance, while reporting a negligible loss for the protected one.
5.7. RQ3: Edges Selection Process
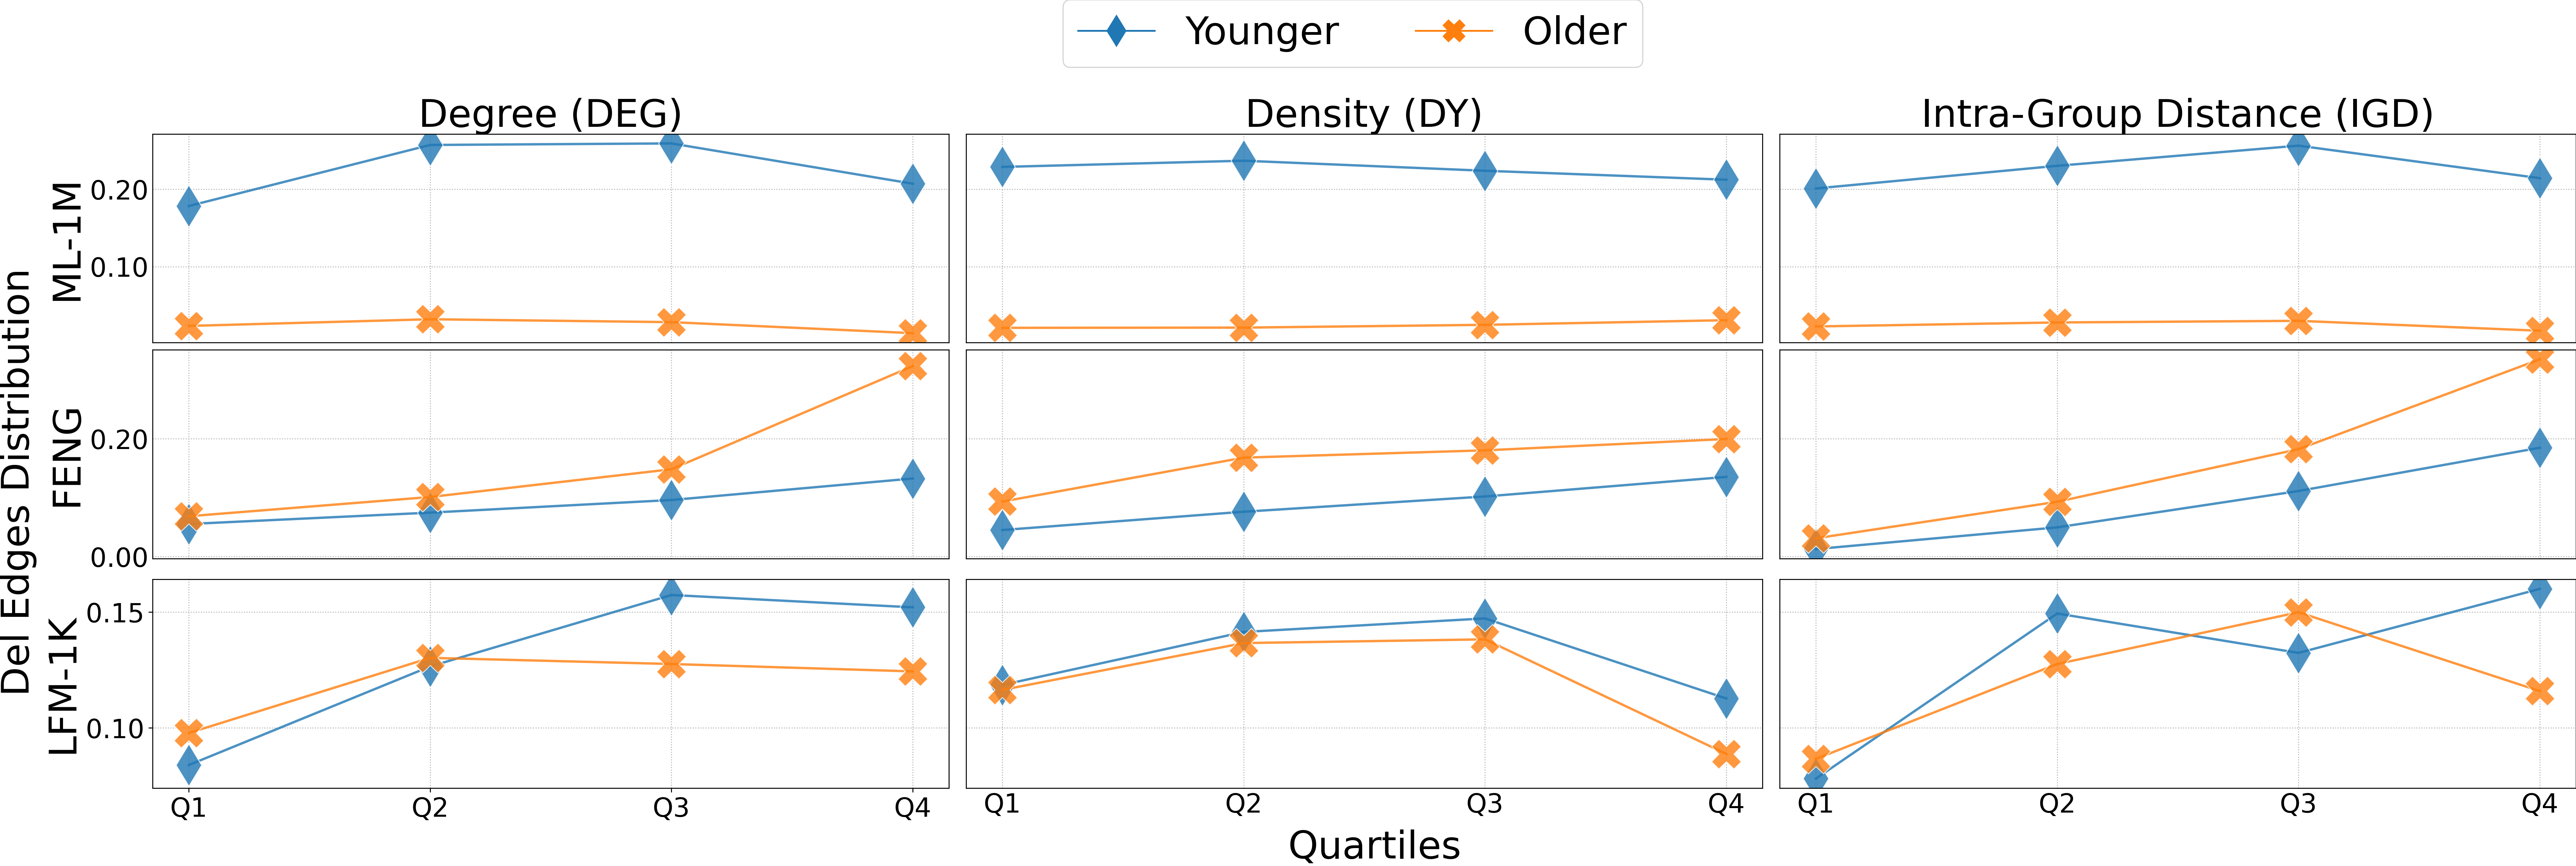
The findings of the first two research questions regard the GNNUERS performance in explaining the unfairness and its impact on the recommendation utility of each demographic group. However, despite the edges selected by GNNUERS represent themselves the counterfactual explanations of the utility disparity across demographic groups, the edges taken as they are do not provide sufficient information to fully understand the graph features that contribute to the unfairness. To this purpose, we leverage the user nodes connected to such edges and categorize them by the properties defined in Section 5.1. Specifically, user nodes were distinguished by demographic groups (Males, Females, Younger, Older) and the nodes in each group were partitioned in quartiles: the order of the data points was defined by the value of each graph property that characterizes the users in each quartile, e.g. low-DEG nodes (Q1). Thus, the graph properties were individually measured for each demographic group by defining the subgroups Males, Females, Younger, Older as the set one at a time, e.g. if is the subgroup of Males, represents how the male is close to the other males .
For each demographic group and each quartile, the number of perturbed edges was taken and normalized by the total number of edges perturbed in each experiment. Therefore, the perturbed edges can be categorized as well based on the extent such edges are distributed over the quartiles for each graph property. A higher distribution over nodes with low or high DEG, DY, IGD levels highlights the aspects that drove our explanation method to perturb the given edges, and, therefore, highlights the aspects that led to the unfairness in the original recommendations.
GNNUERS+CN was not included in the following experiments because the edges deletion constraint could only reflect the distribution over quartiles defined for the unprotected group. RQ1 reported FENG, ML-1M, LFM-1K as the datasets on which our method consistently explain unfairness by reducing the disparity in NDCG between the demographic groups derived by both ”gender” and ”age”. RQ2 highlighted NGCF as the model where GNNUERS can explain unfairness while affecting the recommendation utility of the protected group the least. GNNUERS selection process will be analyzed only on the experiments with these settings, as they would better reflect the properties characterizing biased recommendations.
Age. For each graph property, the Figure 4 reports the distribution of the edges deleted by GNNUERS over the quartiles, which are defined for each demographic group derived from ”age”. Except for LFM-1K, the distribution of deleted edges is significantly higher for the unprotected groups (ML-1M: Younger, FENG: Older), which highlights that the unfair recommendations are highly dependent on the unprotected users’ interactions. On ML-1M, the over-representation and over-DEG of the unprotected group is enough to deviate the recommendations in their favor. No relevant pattern is reported across quartiles, but, on the basis of the unbalanced groups’ representation, the nodes themselves could be related to the unfairness: GNNUERS explains it by consistently pruning more their edges compared to the protected group ones. For both FENG and LFM-1K, GNNUERS deletes more edges connected to high-DEG and high-IGD unprotected users (LFM-1K: Younger, FENG: Older), i.e. at the last quartile (Q4), which represents those unprotected users with the most interactions and the closest ones to other unprotected user nodes. According to Table 1, Older users in FENG are less represented, but their higher average DEG and IGD reflects the observations derived from Figure 4. On LFM-1K, the edges of the unprotected user nodes selected by GNNUERS are also characterized by a high DY (Q4), that is regarding users connected with more popular artists (items) on average compared to the protected users. Indeed, this category (high DEG, DY, IGD on Table 1) of Younger users could have increased the popularity of such connected artists, causing them to be more recommended to Younger in lower quartiles and increasing their recommendations utility.
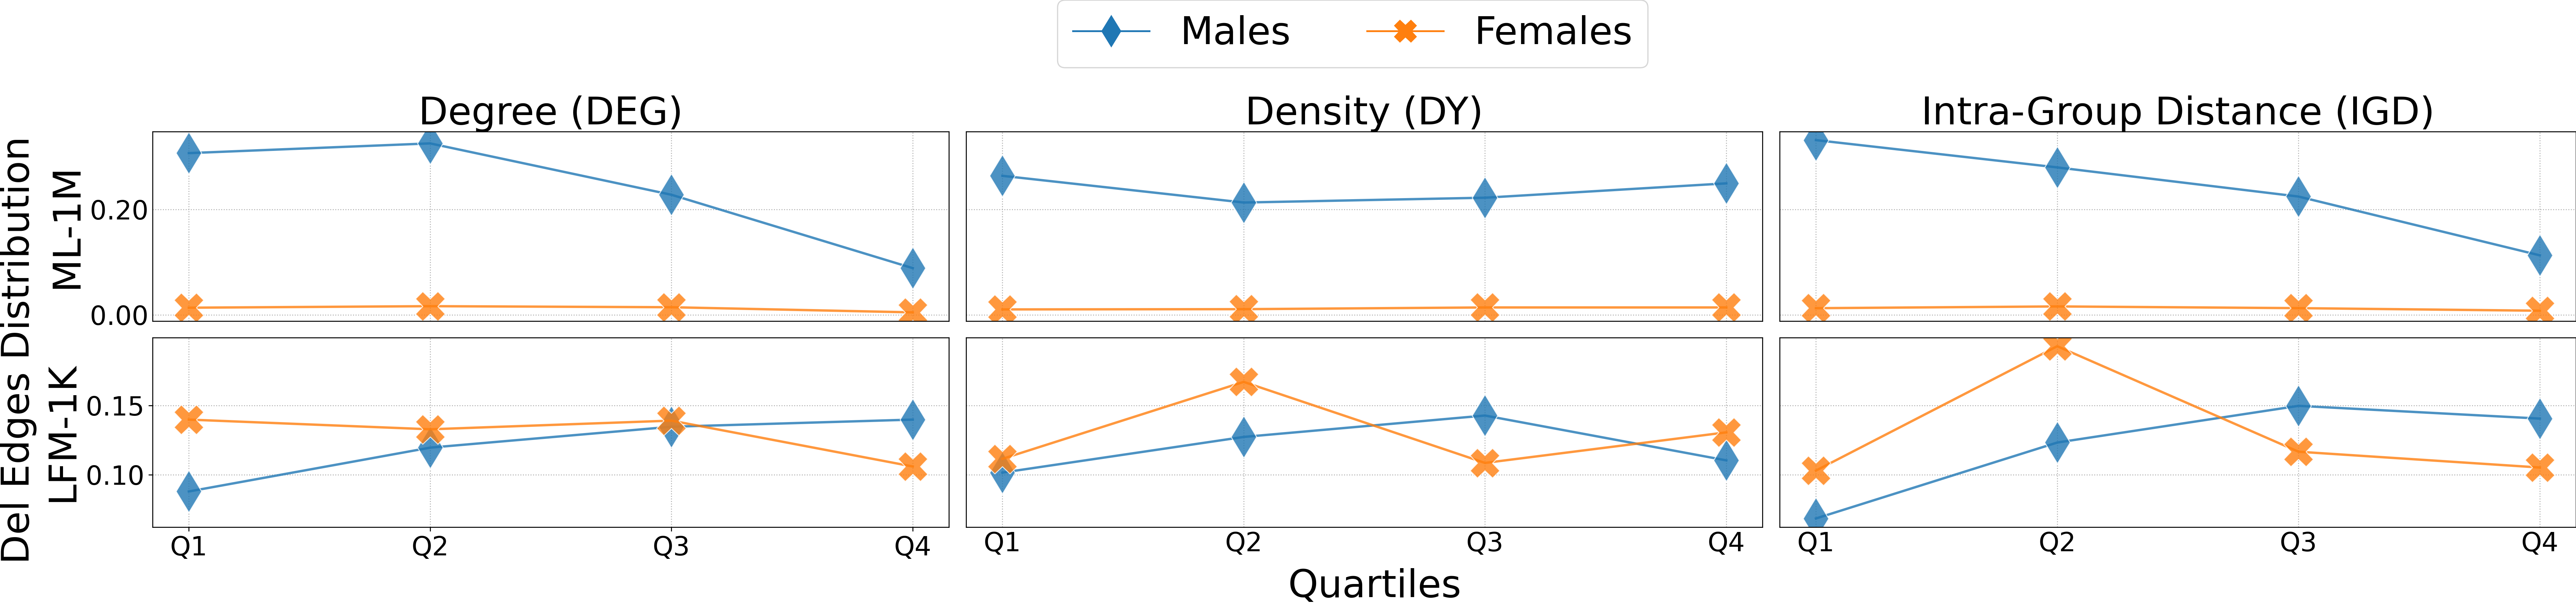
Gender. Figure 5 reports the distribution of the deleted edges over the graph properties quartiles, defined for each gender group. FENG does not include gender labels, so it could not be included in this figure. On ML-1M, the significant difference of deleted edges between Males and Females denotes the extent the unfairness is caused by an over-representation of the unprotected group (Males), in terms of nodes and edges, i.e. over-DEG, according to Table 1. Additionally, unfairness seems related to the Males nodes characterized by a low DEG and IGD (Q1). Hence, GNNUERS uncovers unfairness as the connections regarding isolated (low IGD) Males who prefer not to watch many movies (low DEG). The deleted edges distribution over the latter is slightly higher towards the lowest (DY Q1) and highest (DY Q4) popularity levels, restricting the GNNUERS edges selection to isolated Males connected with just a few of mostly niche or mainstream movies. On LFM-1K, GNNUERS perturbes the interactions applying a dual effect. Except for DY, lower values (Q1) of the graph properties report a higher amount of deleted edges connected to the unprotected (Females) nodes, while the nodes with higher values (Q4) that lost more edges are the protected (Males) ones. Unfairness explanation is then accomplished by the simultaneous perturbation of low-DEG, low-IGD Females and high-DEG, high-IGD Males. Removing the interactions of isolated (low IGD) Females listening to a few artists (low DEG) could drastically impact the fairness levels, causing GNNUERS to inevitably perturb edges connected to nodes with the opposite properties, i.e. high-IGD, high-DEG Males. The fact that Males report a higher Gini on DY compared to Females suggests the former tend more to interact with artists of diverse popularity, which emphasizes how the modification of the artists’ popularity impacts the recommendations.
RQ3. GNNUERS edges selection process is significantly affected by the dataset domain. Experiments uncovered an unfairness mainly related to differences between demographic groups in interest (DEG) and closeness (IGD).
6. Discussion
In this work we introduced GNNUERS, a framework to explain unfairness in GNN-based recommender systems. GNNUERS aims to find the set of edges generating unfairness in GNNs recommendations (Section 4) through counterfactuality. We proved the effectiveness of our method on three state-of-the-art GNN-based recommender systems and evaluated it on four real-world datasets, focusing on the disparity in recommendation utility between gender and age groups (Section 5). In this section, we discuss the GNNUERS explanations interpretation, as well as other limitations and future extensions.
6.1. Interpretation of the Unfairness Explanations
The counterfactual explanations generated by GNNUERS aims at supporting the system designers and service providers to improve the fairness of recommendation models outcomes. However, differently from other model-level explanations methods in GNNs (Yuan et al., 2020; Huang et al., 2023), the user-item interaction networks, e.g. the ones used in our experiments, generally consist of a significantly high number of nodes and edges. It follows that visualizing the original graphs with the application of the edges mask selected by GNNUERS does not convey sufficient information to interpret the aspects affecting the prior unfairness. Analyzing the edges as they are is therefore challenging and it is crucial to account for other features and properties of the nodes connected to such edges.
In the previous section, we leveraged the graph properties introduced in Section 5.1 to characterize the edges identified by GNNUERS as a possible source of the user unfairness. The selected properties reflect different aspects of the GNNs architecture and of the recommendation scenario: DEG represents the users’ interest in the items and the available nodes for the GNNs aggregation step, DY represents the users’ tendency to interact with popular items, IGD represents the users’ closeness in the network. It follows that the insights provided by the nodes categorization of the unfairness explanations by means of the selected properties could be syntethized in a more compact and user-friendly form, e.g. a textual description. We implicitly performed such a synthesis in Section 5.7 when we stated that ”GNNUERS uncovers unfairness as the connections regarding isolated Males who prefer not to watch many movies” for ML-1M and that ”unfairness explanation is then accomplished by the simultaneous perturbation of low-DEG, low-IGD Females and high-DEG, high-IGD Males” for LFM-1K. Despite these statements highlight relevant aspects of the prior user unfairness in the recommendations, they could be extended by accounting for other user and item features, e.g. the movie (ML-1M) and the songs (LFM-1K) genres, which, however, are not available for all the datasets used in our experiments, e.g. INS. Hence, a more thorough and comprehensive investigation, according, for instance, to the requirements defined by service providers, could provide more informative findings and it will be one of the main objectives in our future works.
6.2. Limitations and Future works
GNNUERS is the first step towards explaining unfairness in GNN-based recommender systems through counterfactuality, hence, finding which interactions of the sensitive groups led to model unfairness. GNN-based recommender systems reduce the unfairness in recommendations, but with the purpose of explaining the phenomenon, not mitigating it. Indeed, we devised our method to seek to eliminating edges from the original graph because of our objective of finding one of the possible sources of the unfairness, represented as a set of users’ actions (interactions) affecting the model bias. As shown through the experiments, this procedure might lead to reduced recommendation utility for the unprotected groups, due to the fact that their interactions are deleted and identified by GNNUERS as compromising the recommendation fairness. We plan to extend GNNUERS in the future to augment the original graph, i.e. adding edges and/or nodes, as an explanation tool, but also as a procedure to mitigate the unfairness without loss in accuracy.
GNNUERS was used to explain recommendation utility unfairness among demographic subgroups in a binary setting. Having only two subgroups better highlights the edges selection performed by our framework and offers a clearer overview of the GNNUERS explainability power. Even if we considered protected attributes as binary features, they are by no means binary and the age labels binarization was performed according only to the desired final groups distribution, without any discriminatory intentions against users’ age. Nonetheless, we plan to extend GNNUERS in settings presenting more subgroups for each sensitive attribute, and also with different subgroups cardinality.
Moreover, given the flexibility of the framework, GNNUERS can be also extended to other GNN-based architectures, with different aggregation methods or GNN-layers, e.g. GAT.
References
- (1)
- Agarwal et al. (2021) Chirag Agarwal, Himabindu Lakkaraju, and Marinka Zitnik. 2021. Towards a unified framework for fair and stable graph representation learning. In Proceedings of the Thirty-Seventh Conference on Uncertainty in Artificial Intelligence, UAI 2021, Vol. 161. AUAI Press, 2114–2124.
- Ashokan and Haas (2021) Ashwathy Ashokan and Christian Haas. 2021. Fairness metrics and bias mitigation strategies for rating predictions. Inf. Process. Manag. 58, 5 (2021), 102646. https://doi.org/10.1016/j.ipm.2021.102646
- Balloccu et al. (2022) Giacomo Balloccu, Ludovico Boratto, Gianni Fenu, and Mirko Marras. 2022. Post Processing Recommender Systems with Knowledge Graphs for Recency, Popularity, and Diversity of Explanations. In SIGIR ’22: The 45th International ACM SIGIR Conference on Research and Development in Information Retrieval, Madrid, Spain, July 11 - 15, 2022. ACM, 646–656. https://doi.org/10.1145/3477495.3532041
- Boratto et al. (2022) Ludovico Boratto, Gianni Fenu, Mirko Marras, and Giacomo Medda. 2022. Consumer Fairness in Recommender Systems: Contextualizing Definitions and Mitigations. In Advances in Information Retrieval. Springer International Publishing, Cham, 552–566.
- Brunot et al. (2022) Léo Brunot, Nicolas Canovas, Alexandre Chanson, Nicolas Labroche, and Willeme Verdeaux. 2022. Preference-based and local post-hoc explanations for recommender systems. Inf. Syst. 108 (2022), 102021. https://doi.org/10.1016/j.is.2022.102021
- Burke et al. (2018) Robin Burke, Nasim Sonboli, and Aldo Ordonez-Gauger. 2018. Balanced Neighborhoods for Multi-sided Fairness in Recommendation. In Conference on Fairness, Accountability and Transparency, FAT 2018, Vol. 81. PMLR, 202–214. http://proceedings.mlr.press/v81/burke18a.html
- Celma (2010) Òscar Celma. 2010. Music Recommendation and Discovery - The Long Tail, Long Fail, and Long Play in the Digital Music Space. Springer. https://doi.org/10.1007/978-3-642-13287-2
- Chen et al. (2021) Weijian Chen, Fuli Feng, Qifan Wang, Xiangnan He, Chonggang Song, Guohui Ling, and Yongdong Zhang. 2021. CatGCN: Graph Convolutional Networks with Categorical Node Features. IEEE Transactions on Knowledge and Data Engineering (2021).
- Chen et al. (2019) Weijian Chen, Yulong Gu, Zhaochun Ren, Xiangnan He, Hongtao Xie, Tong Guo, Dawei Yin, and Yongdong Zhang. 2019. Semi-supervised user profiling with heterogeneous graph attention networks. In Proceedings of the 28th International Joint Conference on Artificial Intelligence. 2116–2122.
- Chen et al. (2022b) Xu Chen, Yongfeng Zhang, and Ji-Rong Wen. 2022b. Measuring ”Why” in Recommender Systems: a Comprehensive Survey on the Evaluation of Explainable Recommendation. CoRR abs/2202.06466 (2022). arXiv:2202.06466 https://arxiv.org/abs/2202.06466
- Chen et al. (2022a) Ziheng Chen, Fabrizio Silvestri, Jia Wang, Yongfeng Zhang, Zhenhua Huang, Hongshik Ahn, and Gabriele Tolomei. 2022a. GREASE: Generate Factual and Counterfactual Explanations for GNN-based Recommendations. In Machine Learning and Principles and Practice of Knowledge Discovery in Databases - International Workshops of ECML PKDD 2022, Proceedings. Springer.
- Cui et al. (2022) Hejie Cui, Jiaying Lu, Yao Ge, and Carl Yang. 2022. How Can Graph Neural Networks Help Document Retrieval: A Case Study on CORD19 with Concept Map Generation. In European Conference on Information Retrieval. Springer, 75–83.
- Deldjoo et al. (2021) Yashar Deldjoo, Alejandro Bellogín, and Tommaso Di Noia. 2021. Explaining recommender systems fairness and accuracy through the lens of data characteristics. Inf. Process. Manag. 58, 5 (2021), 102662. https://doi.org/10.1016/j.ipm.2021.102662
- Dong et al. (2023) Yushun Dong, Song Wang, Jing Ma, Ninghao Liu, and Jundong Li. 2023. Interpreting Unfairness in Graph Neural Networks via Training Node Attribution. In Thirty-Seventh AAAI Conference on Artificial Intelligence, AAAI 2023, Thirty-Fifth Conference on Innovative Applications of Artificial Intelligence, IAAI 2023, Thirteenth Symposium on Educational Advances in Artificial Intelligence, EAAI 2023, Washington, DC, USA, February 7-14, 2023. 7441–7449. https://ojs.aaai.org/index.php/AAAI/article/view/25905
- Ekstrand et al. (2022) Michael D. Ekstrand, Anubrata Das, Robin Burke, and Fernando Diaz. 2022. Fairness in Information Access Systems. Found. Trends Inf. Retr. 16, 1-2 (2022), 1–177. https://doi.org/10.1561/1500000079
- Ekstrand et al. (2018) Michael D. Ekstrand, Mucun Tian, Ion Madrazo Azpiazu, Jennifer D. Ekstrand, Oghenemaro Anuyah, David McNeill, and Maria Soledad Pera. 2018. All The Cool Kids, How Do They Fit In?: Popularity and Demographic Biases in Recommender Evaluation and Effectiveness. In Conference on Fairness, Accountability and Transparency, FAT 2018, Vol. 81. PMLR, 172–186. http://proceedings.mlr.press/v81/ekstrand18b.html
- Fabbri et al. (2022) Francesco Fabbri, Maria Luisa Croci, Francesco Bonchi, and Carlos Castillo. 2022. Exposure Inequality in People Recommender Systems: The Long-Term Effects. In Proceedings of the Sixteenth International AAAI Conference on Web and Social Media, ICWSM 2022. AAAI Press, 194–204.
- Frisch et al. (2021) Gabriel Frisch, Jean-Benoist Léger, and Yves Grandvalet. 2021. Stereotype-aware collaborative filtering. In Proceedings of the 16th Conference on Computer Science and Intelligence Systems, Online, September 2-5, 2021. 69–79. https://doi.org/10.15439/2021F117
- Ge et al. (2022) Yingqiang Ge, Juntao Tan, Yan Zhu, Yinglong Xia, Jiebo Luo, Shuchang Liu, Zuohui Fu, Shijie Geng, Zelong Li, and Yongfeng Zhang. 2022. Explainable Fairness in Recommendation. In SIGIR ’22: The 45th International ACM SIGIR Conference on Research and Development in Information Retrieval. ACM, 681–691. https://doi.org/10.1145/3477495.3531973
- Ghazimatin et al. (2020) Azin Ghazimatin, Oana Balalau, Rishiraj Saha Roy, and Gerhard Weikum. 2020. PRINCE: Provider-side Interpretability with Counterfactual Explanations in Recommender Systems. In WSDM ’20: The Thirteenth ACM International Conference on Web Search and Data Mining. ACM, 196–204.
- Ghazimatin et al. (2021) Azin Ghazimatin, Soumajit Pramanik, Rishiraj Saha Roy, and Gerhard Weikum. 2021. ELIXIR: Learning from User Feedback on Explanations to Improve Recommender Models. In WWW ’21: The Web Conference 2021. ACM / IW3C2.
- Hamilton et al. (2017) Will Hamilton, Zhitao Ying, and Jure Leskovec. 2017. Inductive representation learning on large graphs. Advances in neural information processing systems 30 (2017).
- Harper and Konstan (2016) F. Maxwell Harper and Joseph A. Konstan. 2016. The MovieLens Datasets: History and Context. ACM Trans. Interact. Intell. Syst. 5, 4 (2016), 19:1–19:19. https://doi.org/10.1145/2827872
- He et al. (2020) Xiangnan He, Kuan Deng, Xiang Wang, Yan Li, Yong-Dong Zhang, and Meng Wang. 2020. LightGCN: Simplifying and Powering Graph Convolution Network for Recommendation. In Proceedings of the 43rd International ACM SIGIR conference on research and development in Information Retrieval, SIGIR 2020, Virtual Event, China, July 25-30, 2020. ACM, 639–648. https://doi.org/10.1145/3397271.3401063
- Huang et al. (2023) Zexi Huang, Mert Kosan, Sourav Medya, Sayan Ranu, and Ambuj K. Singh. 2023. Global Counterfactual Explainer for Graph Neural Networks. In Proceedings of the Sixteenth ACM International Conference on Web Search and Data Mining, WSDM 2023, Singapore, 27 February 2023 - 3 March 2023, Tat-Seng Chua, Hady W. Lauw, Luo Si, Evimaria Terzi, and Panayiotis Tsaparas (Eds.). ACM, 141–149. https://doi.org/10.1145/3539597.3570376
- Kamishima et al. (2018) Toshihiro Kamishima, Shotaro Akaho, Hideki Asoh, and Jun Sakuma. 2018. Recommendation Independence. In Conference on Fairness, Accountability and Transparency, FAT 2018, Vol. 81. PMLR, 187–201.
- Kang et al. (2021) Bo Kang, Jefrey Lijffijt, and Tijl De Bie. 2021. Explanations for Network Embedding-Based Link Predictions. In Machine Learning and Principles and Practice of Knowledge Discovery in Databases - International Workshops of ECML PKDD 2021, Vol. 1524. Springer, 473–488.
- Kipf and Welling (2017) Thomas N. Kipf and Max Welling. 2017. Semi-Supervised Classification with Graph Convolutional Networks. In 5th International Conference on Learning Representations, ICLR 2017, Conference Track Proceedings.
- Li et al. (2021a) Yunqi Li, Hanxiong Chen, Zuohui Fu, Yingqiang Ge, and Yongfeng Zhang. 2021a. User-oriented Fairness in Recommendation. In WWW ’21: The Web Conference 2021. ACM / IW3C2, 624–632. https://doi.org/10.1145/3442381.3449866
- Li et al. (2021b) Yunqi Li, Hanxiong Chen, Shuyuan Xu, Yingqiang Ge, and Yongfeng Zhang. 2021b. Towards Personalized Fairness based on Causal Notion. In SIGIR ’21: The 44th International ACM SIGIR Conference on Research and Development in Information Retrieval. ACM, 1054–1063.
- Lucic et al. (2022) Ana Lucic, Maartje A. ter Hoeve, Gabriele Tolomei, Maarten de Rijke, and Fabrizio Silvestri. 2022. CF-GNNExplainer: Counterfactual Explanations for Graph Neural Networks. In International Conference on Artificial Intelligence and Statistics, AISTATS 2022, Vol. 151. PMLR, 4499–4511.
- Ma et al. (2022) Jing Ma, Ruocheng Guo, Mengting Wan, Longqi Yang, Aidong Zhang, and Jundong Li. 2022. Learning Fair Node Representations with Graph Counterfactual Fairness. In WSDM ’22: The Fifteenth ACM International Conference on Web Search and Data Mining. ACM, 695–703.
- Mansoury et al. (2019) Masoud Mansoury, Bamshad Mobasher, Robin Burke, and Mykola Pechenizkiy. 2019. Bias Disparity in Collaborative Recommendation: Algorithmic Evaluation and Comparison. In Proceedings of the Workshop on Recommendation in Multi-stakeholder Environments co-located with the 13th ACM Conference on Recommender Systems (RecSys 2019) (CEUR Workshop Proceedings, Vol. 2440). CEUR-WS.org.
- Mehrabi et al. (2021) Ninareh Mehrabi, Fred Morstatter, Nripsuta Saxena, Kristina Lerman, and Aram Galstyan. 2021. A Survey on Bias and Fairness in Machine Learning. ACM Comput. Surv. 54, 6 (2021), 115:1–115:35. https://doi.org/10.1145/3457607
- Oh et al. (2022) Sejoon Oh, Berk Ustun, Julian J. McAuley, and Srijan Kumar. 2022. Rank List Sensitivity of Recommender Systems to Interaction Perturbations. In Proceedings of the 31st ACM International Conference on Information & Knowledge Management. ACM, 1584–1594.
- Qin et al. (2010) Tao Qin, Tie-Yan Liu, and Hang Li. 2010. A general approximation framework for direct optimization of information retrieval measures. Inf. Retr. 13, 4 (2010), 375–397. https://doi.org/10.1007/s10791-009-9124-x
- Rahmani et al. (2022) Hossein A. Rahmani, Mohammadmehdi Naghiaei, Mahdi Dehghan, and Mohammad Aliannejadi. 2022. Experiments on Generalizability of User-Oriented Fairness in Recommender Systems. In SIGIR ’22: The 45th International ACM SIGIR Conference on Research and Development in Information Retrieval. ACM, 2755–2764. https://doi.org/10.1145/3477495.3531718
- Singh and Joachims (2018) Ashudeep Singh and Thorsten Joachims. 2018. Fairness of Exposure in Rankings. In Proceedings of the 24th ACM SIGKDD International Conference on Knowledge Discovery & Data Mining, KDD 2018, London, UK, August 19-23, 2018. ACM, 2219–2228.
- Srinivas et al. (2017) Suraj Srinivas, Akshayvarun Subramanya, and R. Venkatesh Babu. 2017. Training Sparse Neural Networks. In 2017 IEEE Conference on Computer Vision and Pattern Recognition Workshops, CVPR Workshops 2017. IEEE Computer Society, 455–462. https://doi.org/10.1109/CVPRW.2017.61
- Tan et al. (2021) Juntao Tan, Shuyuan Xu, Yingqiang Ge, Yunqi Li, Xu Chen, and Yongfeng Zhang. 2021. Counterfactual Explainable Recommendation. In CIKM ’21: The 30th ACM International Conference on Information and Knowledge Management, Virtual Event, Queensland, Australia, November 1 - 5, 2021, Gianluca Demartini, Guido Zuccon, J. Shane Culpepper, Zi Huang, and Hanghang Tong (Eds.). ACM, 1784–1793. https://doi.org/10.1145/3459637.3482420
- van den Berg et al. (2017) Rianne van den Berg, Thomas N. Kipf, and Max Welling. 2017. Graph Convolutional Matrix Completion. CoRR abs/1706.02263 (2017). arXiv:1706.02263
- Veličković et al. (2017) Petar Veličković, Guillem Cucurull, Arantxa Casanova, Adriana Romero, Pietro Liò, and Yoshua Bengio. 2017. Graph Attention Networks. In International Conference on Learning Representations.
- Wang et al. (2022a) Nan Wang, Lu Lin, Jundong Li, and Hongning Wang. 2022a. Unbiased Graph Embedding with Biased Graph Observations. In WWW ’22: The ACM Web Conference 2022, Virtual Event, Lyon, France, April 25 - 29, 2022. ACM, 1423–1433.
- Wang et al. (2022c) Nan Wang, Shaoliang Nie, Qifan Wang, Yi-Chia Wang, Maziar Sanjabi, Jingzhou Liu, Hamed Firooz, and Hongning Wang. 2022c. COFFEE: Counterfactual Fairness for Personalized Text Generation in Explainable Recommendation. CoRR abs/2210.15500 (2022). https://doi.org/10.48550/arXiv.2210.15500 arXiv:2210.15500
- Wang et al. (2022d) Shoujin Wang, Xiuzhen Zhang, Yan Wang, Huan Liu, and Francesco Ricci. 2022d. Trustworthy Recommender Systems. CoRR abs/2208.06265 (2022).
- Wang et al. (2019) Xiang Wang, Xiangnan He, Meng Wang, Fuli Feng, and Tat-Seng Chua. 2019. Neural Graph Collaborative Filtering. In Proceedings of the 42nd International ACM SIGIR Conference on Research and Development in Information Retrieval, SIGIR 2019, Paris, France, July 21-25, 2019. ACM.
- Wang et al. (2022b) Yifan Wang, Weizhi Ma, Min Zhang, Yiqun Liu, and Shaoping Ma. 2022b. A Survey on the Fairness of Recommender Systems. ACM Trans. Inf. Syst. (jul 2022). https://doi.org/10.1145/3547333 Just Accepted.
- Wu et al. (2021) Chuhan Wu, Fangzhao Wu, Xiting Wang, Yongfeng Huang, and Xing Xie. 2021. Fairness-aware News Recommendation with Decomposed Adversarial Learning. In Thirty-Fifth AAAI Conference on Artificial Intelligence, AAAI 2021. AAAI Press, 4462–4469.
- Wu et al. (2022) Haolun Wu, Chen Ma, Bhaskar Mitra, Fernando Diaz, and Xue Liu. 2022. A Multi-Objective Optimization Framework for Multi-Stakeholder Fairness-Aware Recommendation. ACM Trans. Inf. Syst. (aug 2022). https://doi.org/10.1145/3564285 Just Accepted.
- Yan et al. (2021) Qilong Yan, Yufeng Zhang, Qiang Liu, Shu Wu, and Liang Wang. 2021. Relation-aware Heterogeneous Graph for User Profiling. In Proceedings of the 30th ACM International Conference on Information & Knowledge Management. Association for Computing Machinery, New York, NY, USA.
- Yao et al. (2019) Liang Yao, Chengsheng Mao, and Yuan Luo. 2019. Graph convolutional networks for text classification. In Proceedings of the AAAI Conference on Artificial Intelligence, Vol. 33. 7370–7377.
- Ying et al. (2018) Rex Ying, Ruining He, Kaifeng Chen, Pong Eksombatchai, William L Hamilton, and Jure Leskovec. 2018. Graph convolutional neural networks for web-scale recommender systems. In Proceedings of the 24th ACM SIGKDD International Conference on Knowledge Discovery & Data Mining. 974–983.
- Yuan et al. (2020) Hao Yuan, Jiliang Tang, Xia Hu, and Shuiwang Ji. 2020. XGNN: Towards Model-Level Explanations of Graph Neural Networks. In KDD ’20: The 26th ACM SIGKDD Conference on Knowledge Discovery and Data Mining, Virtual Event, CA, USA, August 23-27, 2020. ACM, 430–438.
- Yuan et al. (2023) Hao Yuan, Haiyang Yu, Shurui Gui, and Shuiwang Ji. 2023. Explainability in Graph Neural Networks: A Taxonomic Survey. IEEE Trans. Pattern Anal. Mach. Intell. 45, 5 (2023), 5782–5799. https://doi.org/10.1109/TPAMI.2022.3204236
- Zhang et al. (2023) Shichang Zhang, Jiani Zhang, Xiang Song, Soji Adeshina, Da Zheng, Christos Faloutsos, and Yizhou Sun. 2023. PaGE-Link: Path-based Graph Neural Network Explanation for Heterogeneous Link Prediction. In Proceedings of the ACM Web Conference 2023, WWW 2023, Austin, TX, USA, 30 April 2023 - 4 May 2023, Ying Ding, Jie Tang, Juan F. Sequeda, Lora Aroyo, Carlos Castillo, and Geert-Jan Houben (Eds.). ACM, 3784–3793. https://doi.org/10.1145/3543507.3583511
- Zhang and Chen (2020) Yongfeng Zhang and Xu Chen. 2020. Explainable Recommendation: A Survey and New Perspectives. Found. Trends Inf. Retr. 14, 1 (mar 2020), 1–101.
- Zhang et al. (2022) Ziwei Zhang, Peng Cui, and Wenwu Zhu. 2022. Deep Learning on Graphs: A Survey. IEEE Transactions on Knowledge and Data Engineering 34, 1 (2022), 249–270.
- Zhao et al. (2021) Wayne Xin Zhao, Shanlei Mu, Yupeng Hou, Zihan Lin, Yushuo Chen, Xingyu Pan, Kaiyuan Li, Yujie Lu, Hui Wang, Changxin Tian, Yingqian Min, Zhichao Feng, Xinyan Fan, Xu Chen, Pengfei Wang, Wendi Ji, Yaliang Li, Xiaoling Wang, and Ji-Rong Wen. 2021. RecBole: Towards a Unified, Comprehensive and Efficient Framework for Recommendation Algorithms. In CIKM ’21: The 30th ACM International Conference on Information and Knowledge Management. ACM, 4653–4664.
- Zhong and Negre (2022) Jinfeng Zhong and Elsa Negre. 2022. Shap-enhanced counterfactual explanations for recommendations. In SAC ’22: The 37th ACM/SIGAPP Symposium on Applied Computing, Virtual Event, April 25 - 29, 2022, Jiman Hong, Miroslav Bures, Juw Won Park, and Tomás Cerný (Eds.). ACM, 1365–1372. https://doi.org/10.1145/3477314.3507029