[4.0]by
Angler: Helping Machine Translation Practitioners Prioritize Model Improvements
Abstract.
Machine learning (ML) models can fail in unexpected ways in the real world, but not all model failures are equal. With finite time and resources, ML practitioners are forced to prioritize their model debugging and improvement efforts. Through interviews with 13 ML practitioners at Apple, we found that practitioners construct small targeted test sets to estimate an error’s nature, scope, and impact on users. We built on this insight in a case study with machine translation models, and developed Angler, an interactive visual analytics tool to help practitioners prioritize model improvements. In a user study with 7 machine translation experts, we used Angler to understand prioritization practices when the input space is infinite, and obtaining reliable signals of model quality is expensive. Our study revealed that participants could form more interesting and user-focused hypotheses for prioritization by analyzing quantitative summary statistics and qualitatively assessing data by reading sentences.
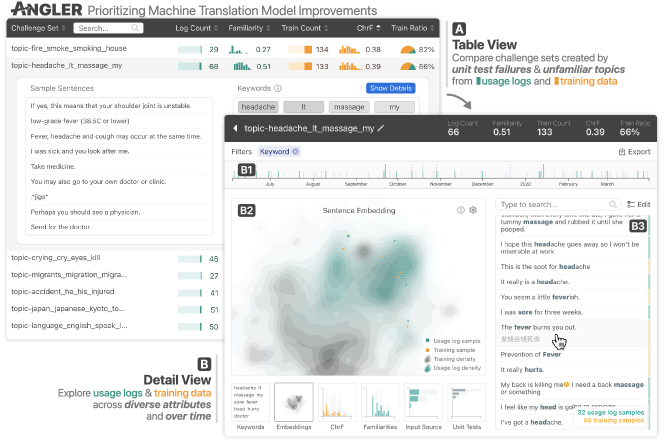
Two components: (A) a screenshot of Angler’s Table View, and (B) a screenshot of Angler’s Detail View. The Table View aims to compare multiple challenge sets created by unit test failures and unfamiliar topics. The Table View contains a sortable table with column headers: Challenge Set, Log Count, Familiarity, Train Count, ChrF, and Train Ratio. Each row in the table represents a challenge set. A challenge set named “topic-headache_it_massage_my” is extended, where sample sentences and representative keywords are shown below that row. The Detail View explores training and traffic data across diverse attributes and over time. At the top of the Detail View, there is a header describing the Name, Log count, Familiarity, Train Count, ChrF, and Train Ratio of the challenge set “topic-headache_it_massage_my”. Below the header, there is a filter bar with a filter tag “Keyword”. Below the filter bar, there is a timeline histogram from June to April. There are two components below the timeline. On the left, there is a large embedding view visualizing the embedding spaces of the training data and usage logs. Below the embedding view, there are six thumbnails labeled as “Keywords”, “Embeddings”, “ChrF”, “Familiarities”, “Input Source”, and “Unit Tests”. On the right, there is a list of sentences with a search bar and an edit button. Each sentence is an English input. A clicked sentence has a Chinese translation below the input.
1. Introduction
In machine learning (ML), out-of-sample evaluation metrics are used to approximate how well a model will perform in the real world. However, numerous high-profile failures have demonstrated that aggregate performance metrics only estimate how a model will perform most of the time and obscure harmful failure modes (e.g. Koenecke et al., 2020; de Vries et al., 2019; Bolukbasi et al., 2016; Obermeyer et al., 2019). In response, researchers have explored how to anticipate model failures before they impact end users. For example, disaggregated error analysis has helped identify errors that impact people with marginalized identities. Prominent examples include facial recognition models failing to recognize women with dark skin tones (Buolamwini and Gebru, 2018) or translation models perpetuating gender stereotypes (Stanovsky et al., 2019). However, subgroups where a model fails can be highly contextual, specific, and may not match any social category (i.e., “men wearing thin framed glasses” (Cabrera et al., 2021) or “busy/cluttered workspace” (d’Eon et al., 2022)). It remains an open challenge for ML practitioners to detect which specific use case scenarios are likely to fail out of a possibly infinite space of model inputs —and prioritize which failures have the greatest potential for harm (Holstein et al., 2019; Barocas et al., 2021).
With finite time and resources, where should machine learning practitioners spend their model improvement efforts? In this work, we aim to help practitioners detect and prioritize underperforming subgroups where failures are most likely to impact users. Towards this goal, we contribute the following research:
-
•
A formative interview study with 13 ML practitioners at Apple to understand their process for prioritizing and diagnosing potentially under-performing subgroups (§ 3). Practitioners rely on the model type, usage context, and their own values and experiences to judge error importance. To test suspected issues, practitioners collect similar data to form challenge sets. Using a challenge set, practitioners rely on a combination of signals from model performance and usage patterns to gauge the prevalence and severity of a failure case. The most common fix for an under-performing subgroup is dataset augmentation to increase the model’s coverage for that subgroup.
-
•
Angler (Fig. 1), an open-source111Angler code: https://github.com/apple/ml-translate-vis. interactive visualization tool for supporting error prioritization for machine translation (MT) (§ 4). Since our research centers on the issue of prioritization (rather than specific error identification) we chose an ML domain where practitioners cannot directly observe model errors. MT developers do not speak all the languages that their translation models support. They rely on proxy metrics like BLEU (Papineni et al., 2002) to estimate model performance but ultimately depend on human expert translators to obtain any ground-truth. Since gathering feedback from human translators is expensive and time-consuming, careful allocation of annotation resources is crucial. To help MT practitioners prioritize suspected error cases that most align with user needs, we worked with an industry MT product team to develop Angler. By adapting familiar visualization techniques such as overview + detail, brushing + linking, and animations, Angler allows MT practitioners to explore and prioritize potential model performance issues by combining multiple model metrics and usage signals.
-
•
A user study of 7 MT practitioners using Angler to assess the relative importance of potentially under-performing subgroups (§ 5). MT practitioners completed a realistic exercise to allocate a hypothetical budget for human translators. Observing MT practitioners using Angler revealed how they use their intuition, values, and expertise to prioritize model improvements. Direct inspection of data showed the potential to encourage more efficient allocation of annotation resources than would have been possible by solely relying on quantitative metrics. While rule-based error analysis allowed participants to more successfully find specific model failure patterns, exploring data grouped by topic encouraged practitioners to think about how to improve support for specific use cases. The study also prompted discussion for future data collection and helped practitioners imagine new features for translation user experiences.
No model is perfect, and large production models have a daunting space of potential error cases. Prioritization of subgroup analysis is a practical challenge that impacts model end users. By exploring prioritization in the context of MT, where there are no reliable quality signals for previously unseen model inputs, we highlight the value of flexible visual analytics systems for guiding choices and trade-offs. Our findings support the potential for mixed-initiative approaches: where automatic visualizations & challenge sets help reveal areas of model uncertainty, and human ML practitioners use their judgment to decide where to spend time and money on deeper investigation.
2. Related Work
This research builds on substantial prior work across general ML evaluation practices, visualization tooling for ML error analysis, and a broad body of work from our target domain, machine translation.
2.1. ML Evaluation and Error Analysis
First, we review standard evaluation practices in ML, and discuss how visualization tools can support ML error discovery.
2.1.1. How do Practitioners Evaluate ML Models?
Standard practice in machine learning is to evaluate models by computing aggregate performance metrics on held-out test sets before using them in the real world (offline evaluation) (Amershi et al., 2019; M and M.N, 2015). The goal of using held-out test sets, i.e., data that was not used during model development, is to estimate how well the model will generalize to real world use cases. However, offline evaluations are limited. For example, held-out datasets can be very different from real usage data (Patel et al., 2008; Recht et al., 2019), as data in the wild is often noisy (Kiela et al., 2021) and the real world is ever-changing (Koh et al., 2021). Held-out datasets tend to contain the same biases as the training data so they cannot detect potentially harmful behaviors of the model (Rajpurkar et al., 2018; Geva et al., 2019). While summarizing a model’s performance in aggregate metrics is undeniably useful, it is insufficient for ensuring model quality.
To overcome these limitations, researchers have proposed additional approaches to help discover model weaknesses (e.g., Burlot and Yvon, 2017; Gardner et al., 2020; Hooker et al., 2020). For example, practitioners can apply subgroup analysis to discover fairness issues (Dudík et al., 2020), use perturbed adversarial examples to evaluate a model’s robustness to noise (Bhatt et al., 2021; Wu et al., 2021; Rajpurkar et al., 2018), create rule-based unit tests to detect errors (Ribeiro et al., 2020; Röttger et al., 2021), and conduct interactive error analysis to expand known failure cases (Naik et al., 2018; Wu et al., 2019; Ribeiro and Lundberg, 2022). ML practitioners also continuously monitor a deployed model’s performance and distribution shifts over time (Barocas et al., 2021).
We build on this work by focusing on the question of prioritization: how ML practitioners judge where to spend their time and resources among many possible model failure cases. This understanding can help inform the design of future tooling and techniques for surfacing model issues that are more attuned to urgency or severity.
2.1.2. Visualization Tools for Supporting Error Discovery
Interactive visualization is a powerful method for helping ML developers explore and interpret their models (Hohman et al., 2019; Beauxis-Aussalet et al., 2021). While many visualizations have been built to help practitioners evaluate models over time, one area of recent work has focused on designing and developing analytic tools for ML error discovery (e.g. Wexler et al., 2019; Liu et al., 2018; Li et al., 2022; Ono et al., 2021; Chung et al., 2020; Zhang et al., 2022). For example, FairVis (Cabrera et al., 2019) uses visualizations to help ML developers discover model bias by investigating known subgroups and exploring similar groups in the tabular data. Similarly, Visual Auditor (Munechika et al., 2022) automatically surfaces underperforming subgroups and leverages graph visualizations to help practitioners interpret the relationships between subgroups and discover new errors. For image data, explAIner (Spinner et al., 2019) combines interactive visualization and post-hoc ML explanation techniques (e.g., Ribeiro et al., 2016; Lundberg and Lee, 2017) to help practitioners diagnose problems with image classifiers. For text data, Seq2seq-Vis (Strobelt et al., 2018) helps practitioners debug sequence-to-sequence models by visualizing the model’s internal mechanisms throughout each of its inference stages.
The success of these recent visual ML diagnosis systems highlights the outstanding potential of applying visualization techniques to help ML developers detect errors. Instead of visualizing a model’s internals (e.g., Strobelt et al., 2018; Hoover et al., 2020), we treat ML models as black-box systems and focus on probing their behaviors on different data subsets. While prior systems have focused on ML applications like image captioning where errors are directly observable (Cabrera et al., 2019, 2021), we designed Angler for the more challenging modeling domain where practitioners cannot always spot-check errors and must rely on proxy metrics to estimate the likelihood of an error.
2.2. Evaluating Machine Translation Models
Evaluating translation quality is extremely nuanced and difficult (Han, 2018; Koehn, 2007; Vilar et al., 2006; Sai et al., 2022). Language can mean different things and be written in different ways by different people at different times. There are also often multiple “correct” translations of the same input (King and Maeggard, 1998).
The gold standard for machine translation evaluation is to have professional translators directly judge the quality of model outputs, for instance, by rating translation fluency and adequacy (Callison-Burch et al., 2007). There are also automatic metrics for machine translation—such as BLEU (Papineni et al., 2002), ChrF (Popović, 2015) and METEOR (Banerjee and Lavie, 2005)—which measure the similarity between a candidate text translation (model output) and one or more reference translations. Intuitively, these metrics apply different heuristics to measure token overlap between two sentences. While these metrics are less reliable and nuanced than human judgment (Post, 2018; Callison-Burch et al., 2006; Lin and Och, 2004; Reiter, 2018; Mathur et al., 2020; Stent et al., 2005; Sai et al., 2022), they are intended to correlate as much as possible with human judgments and are widely used for comparing the aggregate performance of different MT models.
An overarching challenge in MT evaluation is that it is especially resource intensive. Both human and automatic evaluation depends on the expertise of human translators, to either directly judge translation quality, or generate reference translations. Since translators have high levels of expertise and are often difficult to find for rare language pairs (Freitag et al., 2021; Moré and Climent, 2014), it is expensive to evaluate translation quality if the input data does not already have a reference translation (e.g., users’ requests to a model). In addition, it is difficult to maintain consistent quality within and across human evaluators (Popović, 2021; Saldías Fuentes et al., 2022; Ipeirotis et al., 2010). Since evaluating the quality of translations from real world use cases requires human annotation, online monitoring and debugging MT models presents a resource allocation problem. In this work, we explore how interactive visualization of online model usage might help MT practitioners prioritize data for human evaluation.
2.2.1. Subgroups in Machine Translation
More recently, researchers have explored how to systematically identify specific kinds of errors in MT models (Stanovsky et al., 2019; Isabelle et al., 2017; Popović and Castilho, 2019). Many of these are language-dependent challenge sets to probe the syntactic competence of MT models (Burchardt et al., 2017; Avramidis et al., 2019; Macketanz et al., 2018). For example, Isabelle et al. introduces a dataset of difficult sentences designed to test linguistic divergence phenomena between English and French. Stanovsky et al. analyzed sentences with known stereotypical and non-stereotypical gender-role assignments in MT, which falls in a broader body of work on detecting gender bias in MT (Zhao et al., 2018; Rudinger et al., 2018; Vanmassenhove and Monti, 2021; Troles and Schmid, 2021).
While these approaches deepen our understanding of specific model failure modes, it is unclear how different errors impact end users of MT models. As a recent survey suggests (Popović and Castilho, 2019), most of these challenge test sets are created either manually by MT experts or automatically with linguistic rule-based heuristics (e.g., Choshen and Abend, 2019; Raganato et al., 2019; Burlot et al., 2018). An alternative approach has been to examine the performance of MT models in specific domains like law (Kit and Wong, 2008; Yates, 2006; Prabhu et al., 2021) or healthcare (Khoong et al., 2019; Das et al., 2019; Taira et al., 2021). These domain-specific challenge sets are deeply informed by knowledge of a particular use case, but are limited in scope. It is difficult for researchers to develop broader challenge sets guided by real users’ needs because we lack a clear understanding of how people use MT models, and how they can be impacted by errors. In this work we strive to narrow this gap by working with an industry MT team to understand how practitioners might prioritize model improvements based on their users’ needs.
2.2.2. Visualization Tools for Evaluation in Machine Translation
There is a growing body of research focused on designing visual analytics tools for MT researchers and engineers (e.g., Lee et al., 2017; Park et al., 2022). For example, with the Chinese Room system MT practitioners can interactively decode and correct translations by visualizing the source and translation tokens side by side (Albrecht et al., 2009). Similarly, NMTVis (Munz et al., 2022), SoftAlignments (Rikters et al., 2017), and NeuralMonkey (Helcl and Libovický, 2017) use interactive visualization techniques such as parallel coordinate plots, node-link diagrams, and heatmaps to help MT practitioners analyze attention weights and verify translation results. MT researchers also use visual analytics tools (e.g., Klejch et al., 2015; Neubig et al., 2019; Wang et al., 2019) to better understand MT evaluation metrics such as BLEU, ChrF, and METEOR scores. For example, iBLEU (Madnani, 2011) allows researchers to visually compare BLEU scores between two MT models at both corpus and sentence levels. VEMV (Steele and Specia, 2018) uses an interactive table view and bar charts to help researchers compare MT models across various metric scores.
In contrast, our work focuses on evaluation based on usage of a deployed model. We use interactive visualization as a probe to understand how practitioners prioritize model evaluation when reliable quality signals are expensive to obtain. Our findings provide insight into what kind of information practitioners need to assess potential model failures with respect to their impact on users.
3. Interview Study: Prioritizing Model Improvements
This work began in close collaboration with an industry machine translation team, with the goal of helping them prioritize model debugging and improvement resources on problems that had the greatest potential to impact end users. From initial conversations with team members, we learned that their existing process for identifying and addressing problems was largely driven by specific errors (e.g., bug reports, or biases surfaced in academic research), or based on random sampling of online requests. Further, this process was limited to team members with the technical expertise to conduct one-off data analyses. To gain insight into a broader range of existing approaches to prioritization, we turned to practitioners across other ML domains.
We conducted a semi-structured interview study with 13 ML practitioners at Apple. In this section, we describe how practitioners identify and solve specific issues with ML models that impact the user experience. First, we discuss how practitioners navigate a large space of possible failure cases (§ 3.2). Next, we describe how they build challenge sets to assess the cause, scope and severity of an issue, which then informs which issues they address and how they fix them (§ 3.3). At each stage, we highlight how practitioners bring a range of approaches and perspectives to the task of prioritization. We synthesize these findings into four design implications for tooling to support prioritization in model debugging (§ 3.4).
3.1. Data Collection and Analysis
We recruited practitioners from both internal mailing lists related to ML and snowball sampling at Apple. Each interview lasted between 30 to 45 minutes. We recorded the interviews when participants gave permission, and otherwise took detailed notes. The study was approved by our internal IRB. We recruited practitioners who have worked on developing and/or evaluating models that are embedded in user-facing tools and products. Incorrect, offensive, or misleading model predictions are detrimental to users’ experiences with these models. Therefore, engineers and data scientists that are working on evaluating and improving user-facing ML models are more likely to consider how their models shape users’ experiences than other kinds of ML practitioners. Indeed, we found in our interviews that participants often considered how different kinds of model failures may impact end users. An overview of the participants’ primary ML application is shown in Table 1.
| Participant | ML Application | Role |
|---|---|---|
| P1 | Business forecasting | Data Scientist |
| P2 | Multiple NLP tasks | Data Scientist |
| P3 | Image segmentation | ML Engineer |
| P4 | ML Tooling | ML Engineer |
| P5 | Image classification | Data Scientist |
| P6 | Image classification | Research Scientist |
| P7 | Various CV tasks | ML Manager |
| P8 | Image classification | ML Engineer |
| P9 | Resource use forecasting | ML Engineer |
| P10 | Image segmentation | Research Scientist |
| P11 | Recommender systems | ML Manager |
| P12 | Image captioning | Robustness Analyst |
| P13 | Gesture recognition | Research Scientist |
A table that links each interview participant with their primary machine learning application area. P1 works on business forecasting. P2 works on multiple NLP tasks. P3 works on image segmentation. P4 works on ML tooling. P5 works on image classification. P6 works on image classification. P7 works on various CV tasks. P8 works on image classification. P9 works on resource use forecasting. P10 works on image segmentation and classification. P11 works on recommender systems. P12 works on image captioning. P13 works on gesture recognition.
Two authors conducted inductive qualitative analysis of the interview data. One author conducted three rounds of open coding, synthesizing and combining codes each round (Merriam and Associates, 2002). Next, a second author took the code book in development and independently coded two interviews, adding new codes where relevant and noting disagreements. These two authors then discussed these transcripts and codes to ensure mutual understanding and shared interpretation of the codes, and converged on a final code book. Lastly, they used this code book to code half of the transcripts each.
3.2. Sourcing Potential Issues
Out of the many ways an ML model could fail, we found that practitioners want to prioritize those that are most consequential for end users. Participants discussed three approaches to find such issues: (1) analyzing errors reported by users; (2) brainstorming potential errors in collaboration with domain experts; and (3) comparing usage patterns against model training data to find areas where the distributions of these two data sources differ.
3.2.1. User Testing and User-Reported Errors
Six participants discussed identifying potential issues through direct feedback from users or from user testing [P3, P4, P5, P7, P10, P13]. Even ad hoc testing with a small sample of people can reveal issues that are not surfaced in standard offline evaluations. For example, P5 once “just showed the [model-driven] app to other people” and found a “weird edge case” where the model always (and often erroneously) classified images containing hands as a certain output class. This was an error that was not surfaced in offline model evaluations because the test data was drawn from the same distribution as the training data, and both contained a spurious correlation between images with hands and this particular output class. “That’s why you do your user testing” (P5).
User feedback outside of user testing can be difficult to source. In some settings, failures are detectable from signals in usage data, e.g., whether a user accepts or rejects a suggested word from a predictive text model [P5]. More often, real users need to take additional steps to report errors, which they are unlikely to do for every error they encounter: “I think it takes a lot of [effort] and willingness to go and file these things” [P4]. In the most difficult case, users are not able to assess prediction quality themselves (e.g., if someone is using MT to translate to or from a language they do not know). In such contexts, direct user feedback is particularly rare.
3.2.2. Brainstorming with Domain Experts
Another approach is to brainstorm potential failure modes with people who hold specialized knowledge of what may be both important to users and challenging for the model [P1, P4, P9, P12, P13].
“Sometimes we involve partners, like other teams or providers who are specialized in the area, to attack the model make the model fail.” — P4
P13 works on gesture recognition models and followed this approach of brainstorming potential errors. P13 had a deep understanding of how their model worked, and thus what kinds of inputs might be difficult to classify accurately. They then collaborated with designers and accessibility experts, who have a deep understanding of users’ needs, to identify how the model’s weaknesses lined up with realistic and important use cases.
Sometimes ML practitioners have built this kind of expertise themselves over years of working with a similar model type [P1], or through precedent with prior reported model failures [P7]. P4 and P12 pointed to academic research (e.g., work published at venues focused on fairness and ethics in AI), the press, and social media as additional helpful sources of potential failure cases. These sources, while not necessarily directly related to any specific model they are working on, can help practitioners understand patterns in ML failures more systematically, and anticipate high-stakes failures.
Brainstorming is particularly useful for identifying types of failures that could impact users (Ribeiro et al., 2020; Ribeiro and Lundberg, 2022). However, it is difficult to translate these types into actual failure cases and keep them up to date (Ribeiro and Lundberg, 2022; Bhatt et al., 2021).
“We can go with things like what’s known as the OVS list—offensive, vulgar, slur. Those are quite obvious, but things can be more subtly offensive… Frankly, there are ways to be offensive that we just simply probably haven’t anticipated and language evolves and slang becomes apparent, and even the global situation changes and things that weren’t offensive before could become offensive.” — P7
3.2.3. Identifying Usage Patterns with Low Training Data Coverage
A third approach is to identify suspected areas of weakness for the model by looking for differences between how users are interacting with a model and the data with which that model was trained. We use the term coverage to describe how well a model’s training data “covers” the space of inputs that the model receives after deployment (i.e., use cases). The coverage of a particular use case is a measure of how much the model “knows” about those kinds of inputs, and can be used as a proxy for model performance when other quality signals are not available.
“We know that the [training] datasets that we have, however large they are, they don’t cover the entire space. So wherever we don’t have coverage we don’t expect the [model] performance to be that great.” — P3
To detect coverage issues, practitioners monitor online data to see how people are using a model, and compare that against their training data:
“If it is a classification task, you were expecting to have a very balanced dataset, but online [you see] that almost 90% of the traffic is coming for 1 class. That means your offline [data] was not representative of what is going to happen in an online setting. So, by monitoring and looking at all data distributions, you will get a sense of those discrepancies.” — P2
Considering coverage allows practitioners to move beyond the kinds of failures that they already know of or suspect based on past experience and identify new failure modes that they were not previously aware of [P7].
3.3. Creating Challenge Sets to Validate and Evaluate Issues
When practitioners identify reported or suspected failures, they still need to determine whether this is a systematic problem with the model and, if so, assess the scope and severity of the error. Participants first wanted to understand if a potential failure is a one-off error (as can be expected given ML is probabilistic) or a more systematic problem [P4, P7, P12]. We found that practitioners shared a common general approach of:
“Collecting more similar data and testing the model behavior and seeing if it’s systemically failing.” — P7
Practitioners in our sample referred to these curated data subsets as aggressor sets, golden test sets, and stress tests. In the remainder of this paper, we refer to these kinds of datasets as challenge sets.
Challenge sets differ from standard test sets in ML because they are designed to target a specific failure case, and are thus often more reflective of how people really use a model in practice. As P6 described, “that kind of test while we call it stress test is probably closer to what happens in reality than when you do random sampling for testing.” Creating these sets can be challenging. In particular, it might not be immediately clear what kind of “similar” data will replicate a failure mode, and the axis of similarity that matters might not be annotated explicitly in the data.
“The length of the beard seemed to play a role [in a failure mode]. It [the dataset] was just annotated as has beard or not, and not so much the length.” — P6
Once practitioners have built a challenge set and determined that a suspected failure case is indeed a systematic problem with a model, they can then conduct quantitative and qualitative analyses of the challenge set to deeply understand the cause of the issue and how it might impact users. This understanding is critical to prioritizing issues to solve and informs the choice of solution.
3.3.1. Assessing the Cause of the Problem
Practitioners look for patterns in challenge sets to understand the potential cause of a problem. A first step is usually to compare the challenge set to the model’s training data to identify coverage issues or other data problems, e.g., spurious correlations. This analysis could be a simple process of “manually going through [the challenge set] and looking for any general trends” [P5], although models with larger output spaces or high dimensional data may require more sophisticated techniques like embedding space visualization and dimensionality reduction techniques [P7].
3.3.2. Assessing the Impact of the Problem on Users
Practitioners also want to assess the impact of the problem on users to judge its urgency. Model failures might be prioritized if they impact many users, happen frequently [P1], or if they produce a negative user experience [P7, P11, P12]. In this way, prioritization is “not just a pure data science question” [P1], but involves considering different and possibly conflicting perspectives and values.
For example, in P7’s work, “certain mispredictions could be more offensive than others,” so when gathering feedback from quality annotators, they ask annotators to “exercise some judgment,” and specifically flag anything they feel are “potentially offensive or egregious mistakes.”
Practitioners might also prioritize improvements to ensure no subpopulation of users is experiencing particularly poor performance compared to others:
“What we want to do is, reduce the length of the tail end of users that have poor experience and talk more about, how can we bring these people up and what is it about [their use context] that causes the models to perform poorly.” — P11
3.3.3. Assessing Potential Solutions
The choice of appropriate solution depends on understanding the scope and nature of the problem, and discussing these with reference to how the issues impact end users. Often, problems are the result of poor coverage and can be addressed by increasing training data in a specific area and retraining the model [P9]. For some participants, this was the default approach: “the answer is pretty much always going to be more representative data across all classes.” [P5]. However, our findings highlight a wider range of approaches that practitioners can take when they deeply understand the nature and stakes of a problem.
For example, three participants talked about strategies to augment the model’s output space. This could mean adding or removing classes from a classification taxonomy [P4], preventing specific outputs using a block list or an additional classification model, or hard-coding outputs for certain inputs using a lookup table [P4, P7, P12]. Other approaches included improving annotation quality [P7, P10], removing problematic data from the training set [P5], changing the user interaction with the model to control the input environment in production [P8], adjusting the model architecture or loss function [P12], or adding additional data pre-processing steps [P5].
These approaches differ in complexity, cost, and effectiveness. The choice of solution is not solely based on technical and resource constraints, but could involve negotiating trade-offs, considering conflicting values, and accounting for the urgency of the error. For example, practitioners might select a fix that is faster to implement if an error impacts many users or is particularly offensive. Such decisions require input from stakeholders with a broad range of expertise. Therefore, ML practitioners must be able to discuss problems with reference to business metrics and user experience and in terms that are accessible to stakeholders without ML expertise [P1].
3.4. Design Implications
Our findings demonstrate how challenge sets allow practitioners to develop a deep understanding of a problem’s cause, scope, and impact on users. This understanding is necessary to effectively prioritize resources on the most egregious and urgent model failures. Existing tooling for model evaluation and debugging have largely focused on identifying model weaknesses rather than prioritizing resources on weaknesses with the greatest potential impact on users. Based on the practices uncovered through our interview study, we developed four design implications for tooling to support prioritization:
-
D1.
Compare usage patterns to training data to support exploration of suspected model weaknesses in addition to known errors.
-
D2.
Build collections of similar data (challenge sets) to assess and prioritize problems, and allow users to compare challenge sets.
-
D3.
Provide information about model performance and usage patterns to surface issues that matter most to users.
-
D4.
Since prioritization is not solely a technical question and does not have a singular solution, account for prioritization subjectivity, and make the tools easy to use for stakeholders with diverse backgrounds.
Interactive visualizations have successfully helped ML practitioners discover ML errors (§ 2.1.2) and understand model behaviors (§ 2.2.2). Interactive visualization techniques are especially useful for exploring data to support hypothesis generation and serendipitous discoveries (D1), comparing and contrasting slices of data (D2), analyzing data from multiple perspectives (D3), and supporting collaborative interpretation of data among stakeholders with diverse skill sets (D4). For these reasons, visual analytics is a promising choice for supporting prioritization.
The remainder of this paper focuses on Angler (Fig. 1), a visual analytics tool to support prioritization in the context of machine translation (MT). While our interview study revealed common practices across ML domains, prioritization depends on measures of prediction quality and insight into usage patterns, both of which are extremely specific to a particular model. Therefore, to understand these practices more deeply and begin to explore what tooling support for prioritization might look like, it is useful to choose a specific ML task as a case study. We chose MT because it poses unique challenges that make prioritization both especially important and especially difficult: it is difficult and expensive to attain reliable measures of prediction quality (Callison-Burch, 2009); MT models accept open-ended input from users, opening a vast space of possible failures; and we know relatively little about how people use MT models in the real world (Liebling et al., 2020).
4. Designing Angler: Exploring Machine Translation Usage with Challenge Sets
Given the design implications (D1–D4) described in § 3.4, we present Angler (Fig. 1), an interactive visualization tool that helps MT developers prioritize model improvements by exploring and curating challenge sets. Angler leverages both usage logs and training data to help users discover model weaknesses (D1, § 4.1). Angler introduces two novel techniques to automatically surface challenge sets and expand challenge sets with similar data (D2, § 4.1). Angler uses the overview + detail design pattern (Cockburn et al., 2009) to tightly integrate two major components: the Table View that summarizes challenge sets as table rows (§ 4.2) and the Detail View that enables users to explore one challenge set in depth with different attributes over time (D3, § 4.3). Finally, to lower the barrier for different stakeholders to easily prioritize model improvements (D4), Angler allows users to conduct quantitative and qualitative analyses without needing to write custom code and manipulate complex data and model pipelines. We develop Angler with modern web technologies so that anyone can access it without installation overhead, and we open-source our implementation (§ 4.4).
We designed and developed Angler in conversation with an industry MT product team. To contextualize our design in the team’s practices and gain iterative feedback, we used one of the team’s MT models (English Spanish), with a sample of their training data and usage logs. Usage logs are only available from users who have opted-in. For privacy and security reasons, members of our research team required special permissions and security protocols to access this data. Therefore, we cannot show Angler with the original model or dataset from our design process. Moreover, to demonstrate how Angler can support many different MT models and language pairs, we instead describe the Angler interface in this section using a public MT model (English Simplified Chinese) and public datasets (§ 4.4).
4.1. Subgroup Analysis through Challenge Sets
In Angler, we introduce two novel techniques to surface interesting subsets from the usage logs and training data. We automatically extract challenge sets by sampling data that either fails our model performance unit tests (§ 4.1.1) or involves topics the model is less familiar with (§ 4.1.2).
4.1.1. Unit Test Failures
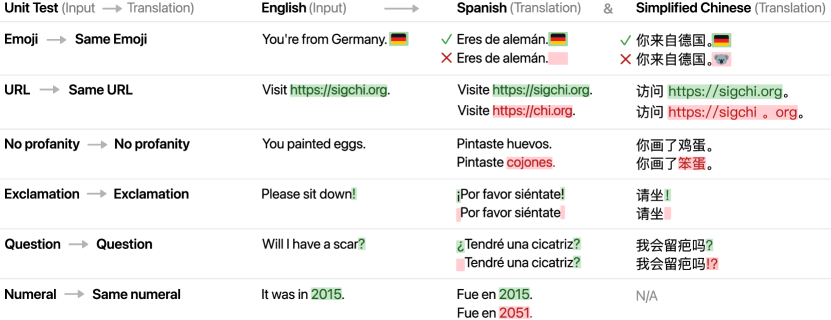
The current state-of-the-art approach to building challenge sets for machine translation is to build rule-based unit tests (2.2.1). In line with this practice, the first type of challenge sets that we include in Angler extends the team’s existing suite of unit tests to identify unexpected model behavior (Fig. 2). These unit tests use regex search to find patterns in a source-translation pair and verify that each match meets some pre-defined rules. For example, when a source includes an emoji, we expect the translation to have the same emoji. Similarly, when a source does not contain offensive, vulgar, or slur (OVS) words, we expect the translation not to include OVS words either. Some unit tests are language-specific: consider translating English to Spanish; if a source is a question, we expect the translation output to have both ‘‘¿’’ and ‘‘?’’ characters. For simplified Chinese, however, we would expect the translation output to end with the “?” unicode instead. For our English Chinese demo in this section, we apply 5 unit tests to both usage logs and training data (D1), and collect data samples that fail any unit test into challenge sets (Fig. 2). Each unit test corresponds to one challenge set.
4.1.2. Unfamiliar Topics
While unit tests can reveal some straightforward errors, they do not offer insight into issues of coverage, which our interview participants highlighted as critical to identifying failure modes that are highly consequential for end users (§ 3.2.3). In the context of MT, coverage refers to how much a translation model “knows” from its training data about a particular topic or way of speaking. For example, coverage is a major concern with domain-specific language: e.g., doctors use domain-specific phrases to talk about medicine, while video game players use language specific to their game. Coverage can be improved by collecting more training data to give the model more exposure to that particular language pattern.
Extending existing techniques for building challenge sets in MT, we sought to help MT practitioners prioritize which domains may need better coverage based on what their users are requesting. To identify topics that are not well represented in the training data, we first use a sentence transformer (Reimers and Gurevych, 2019) to extract high-dimensional latent representations of sentences in the training data. This latent representation is trained to cluster sentences with similar meaning close together in high-dimensional space. We then apply UMAP (McInnes et al., 2018), a dimensionality reduction method, to project the latent representation into 2D. We choose to use UMAP instead of other dimensionality reduction techniques, such as PCA (Pearson, 1901) and t-SNE (van der Maaten and Hinton, 2008), because UMAP is faster and has better preservation of the data’s global structure (McInnes et al., 2018). We use the cosine similarity to measure the distance between two samples in the high-dimensional space, as previous works have shown that cosine distance provides better and more consistent results than the Euclidean distance (Vermeulen et al., 2021). Following the suggested practice in applying UMAP (Coenen and Pearce, 2019), we fine-tune UMAP’s hyperparameters n_neighbors and min_dist through a grid search of about 200 parameter combinations; we choose hyperparameters that spread out the training samples in the 2D space while maintaining local clusters. With about 47,000 training sentences and a latent representation size of 768, it takes about 50 seconds on average to fit a UMAP model with one parameter combination on a MacBook Pro laptop.
We use Kernel Density Estimation (KDE) (Scott, 2015) to estimate the training data’s distribution. For the KDE, we choose a standard multivariate Gaussian kernel with a Silverman bandwidth (Silverman, 2018). It only takes about 1 second to fit a KDE model on 47,000 training sentences’ 2D representations. Then, we use this trained KDE model to compute the familiarity score (FA) (Hopkins et al., 2023) for each sentence from the usage logs. We define the familiarity score (Equation 1) of a sentence from the usage log as the log-likelihood of observing that sentence’s UMAP 2D coordinate under the training data’s UMAP distribution . This concept of familiarity can be generalized to other data types and ML domains, and has shown to be a powerful tool for debugging data (Hopkins et al., 2023).
| (1) |
Computing FA is slow when the training data is large (i.e., is large in Equation 1), because the algorithm needs to iterate through all points in the training data for each sentence from the usage logs. Therefore, to accelerate FA computation, we apply a 2D binning approximation approach. We first pre-compute the log-likelihoods over a 2D grid of training data’s UMAP 2D space , constrained by the range of the training data’s UMAP coordinates. Then, to approximate the FA of a sentence, we only need to (1) locate the cell in the grid that the sentence falls into, and (2) look up the pre-computed log-likelihood associated with that cell . If a sentence falls out of the 2D grid, we extrapolate its FA by using the log-likelihood associated with the closest grid cell. Note that one can choose a different grid density other than ; we tune the grid density () to balance the computation time and the approximation accuracy. Our binning approximation is scalable to large usage logs () and training data (), as it decreases the FA computation’s time complexity from a quadratic time to a linear time , where is the dimension of the UMAP space ( in our case), and is the grid density (). In addition, we use the KDE implementation from Scikit-Learn (Pedregosa et al., 2011), which leverages KD Tree (Bentley, 1975) for more efficient distance computation. With a tree-based KDE, our FA computation method has a logarithmic time complexity on average and a linear time complexity in the worst case.
After estimating the FAs for all sentences in the usage logs, we use BERTopic (Grootendorst, 2022) to build a topic model on a sample of 50,000 sentences from the usage logs with the lowest FA and select the 100 largest topics from this model. To estimate the model’s performance on these topics, we need labeled training data. Therefore, we extend each extracted topic set with a sample of training sentences that are close to the topic set in the high-dimensional space (D2). To reduce the computational cost of this search, we randomly sample 15 “seed sentences” from each topic and add any sentences from the training data that are close to at least one of the “seed sentences” in the high-dimensional space (threshold selected through manual inspection). We have tuned the number of “seed sentences” to balance the computational cost and the number of close training sentences that we can find. Finally, we have controlled random seeds for random sampling, UMAP computation, and BERTopic, so that our topic results are reproducible.
4.1.3. Limitations
Identifying new model failure modes and collecting examples to replicate the failure is extremely challenging. Developing automatic, expert-driven, and crowd-sourcing methods for identifying failures is an active area of research in machine learning and human-computer interaction (Zhang et al., 2022; Chung et al., 2020; DeVos et al., 2022; Shen et al., 2021; Wexler et al., 2019; Cabrera et al., 2019; Munechika et al., 2022). Compared to prior research, it is especially difficult to automatically identify MT model failures because there are no explicit, interpretable features or metadata on which to slice data into subgroups, and automatic evaluation metrics are very noisy. Further, prior work largely focuses on identifying failure modes by comparing predictions to ground-truth labels (e.g. Zhang et al., 2022; Chung et al., 2020), which does not give practitioners insight into failure modes that impact end-users but are not yet represented in offline, labeled datasets.
Our goal in this work is to understand how practitioners prioritize their resources across many potential failure modes, and what information they need to do so. We generate example challenge sets to guide this exploration using pattern-matching rules (the current state-of-the-art in MT) and topic modeling on areas of low coverage. However, further research is needed to evaluate and extend these methods. While we did not conduct a formal evaluation of our challenge sets in this work, both kinds of sets are certainly imperfect in terms of error identification – there are perfect translations included in the challenge sets, and there are translation errors in the larger data that are not included in any challenge set. Given the large space of possible inputs, and probabilistic nature of machine learning, we cannot expect to ever have methods to identify all possible failures with perfect accuracy. Thus, there is a need for interactive visualization tools that support practitioners to explore and make sense of potential failure modes and prioritize development and annotation resources under uncertainty.
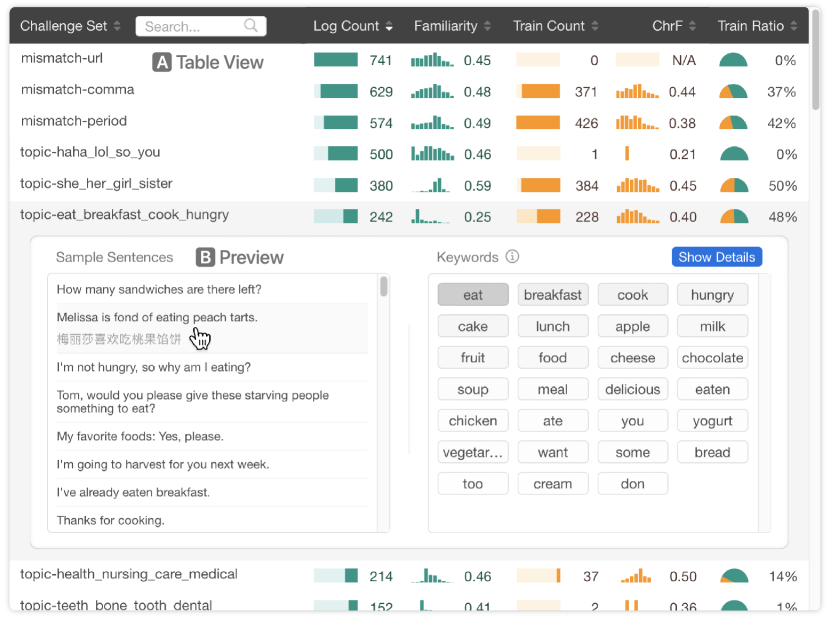
Screenshot of the table view \Description A screenshot of Angler’s Table View. The Table View contains a sortable table with column headers: Challenge Set, Log Count, Familiarity, Train Count, ChrF, and Train Ratio. Each row in the table represents a challenge set. A challenge set named ”topic-eat_breakfast_cook_hungry” is extended, where sample sentences and representative keywords are shown below that row. Each sample sentence is an English input. A clicked sentence has its Chinese translation below the input.
4.2. Table View
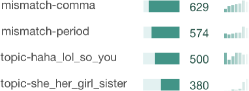
A screenshot of the name of the challenge sets and their log counts in the table view. From top to bottom, the names are “mismatch-comma”, “mismatch-period”, “topic-haha_lol_so_you” and “topic-she_her_girl_sister”. Their log counts are 629, 574, 500, and 380.
When users launch Angler, they first see the Table View listing all pre-computed challenge sets in a table (Fig. 3A). Each challenge set can contain samples from the training data and usage logs, color coded as orange and green respectively throughout Angler. We name challenge sets based on their construction methods (Fig. 4). For challenge sets created by unit test failures, we name them “mismatch-[unit test name].” For challenge sets created by unfamiliar topics, we name them “topic-[top-4 keywords].” These keywords are the same as keywords shown in the Set Preview (Fig. 3-B). In addition to the names of challenge sets, the Table View view provides five metrics associated with each set:
-
•
Train Count and Log Count: the number of training and usage log samples in the set.
-
•
ChrF: a measure of the model’s performance on the training samples in the set. ChrF is the F-score based on character n-gram overlap between the hypothesis translation produced by the model and a validated reference translation (Popović, 2015). We use the open-source SacreBLEU implementation of ChrF (Post, 2018).
-
•
Familiarity: a measure of how familiar the usage log samples in the set are to the model, by reference to the training data distribution (§ 4.1.2).
-
•
Train Ratio: the percentage of samples in the set that are training samples.
Users can sort challenge sets by any of these metrics by clicking the sorting button
![]() in the table header.
To help users quickly compare these metrics across challenge sets, the Table View also provides sparkline-like visualizations (Tufte, 2013) in each row.
For each challenge set, the Table View visualizes its sample counts as in-line bar charts, ChrF and Familiarity distributions as histograms, and the training sample ratio as a semi-circle pie chart.
in the table header.
To help users quickly compare these metrics across challenge sets, the Table View also provides sparkline-like visualizations (Tufte, 2013) in each row.
For each challenge set, the Table View visualizes its sample counts as in-line bar charts, ChrF and Familiarity distributions as histograms, and the training sample ratio as a semi-circle pie chart.
After identifying an interesting challenge set, users can click the row to open a Set Preview (Fig. 3B) in the table to see a preview of that set. This view provides users with a quick summary of the set on demand. On the left, users can browse 100 randomly sampled sentences from this challenge set; users can also click on each sentence to see the model’s output translation. The number of sentences in each challenge set varies from about 100 to 1000; challenge sets constructed from unit tests tend to have more sentences than ones constructed from unfamiliar topics. We choose the number 100 because it gives a fair coverage of all sentences in the set and users can have a smooth experience in quickly browsing sentences from different sets. If they are interested in one particular challenge set, they can view all sentences in that set’s Detail View (§ 4.3). On the right, users can inspect the most representative keywords from this set. Keywords are extracted and sorted by their class-based TF-IDF scores (Grootendorst, 2022). Intuitively, these keywords are words that appear more frequently in this set than in all other sets. In Angler, we list all keywords returned from BERTopic; future researchers and developers can determine a class-based TF-IDF score threshold to only display more frequent keywords (keywords with a darker background).
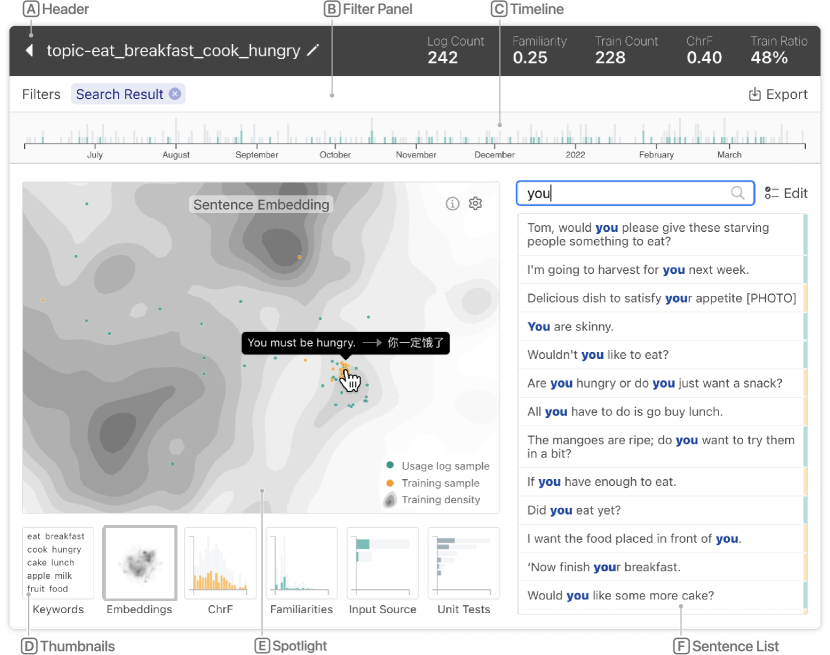
A screenshot of Angler’s Detail View. At the top of the Detail View, there is a header describing the Name, Log count, Familiarity, Train Count, ChrF, and Train Ratio of the challenge set “topic-eat_breakfast_cook_hungry”. Below the header, there is a filter bar with the filter tag “Search Result”. Below the filter bar, there is a timeline histogram from June to April. There are two components below the timeline. On the left, there is a large embedding view visualizing the embedding spaces of the training data and usage logs. The cursor is hovering over a dot on the embedding view with a tooltip writing “You must be hungry. → 你一定饿了。” Below the embedding view, there are six thumbnails labeled as “Keywords”, “Embeddings”, “ChrF”, “Familiarities”, “Input Source”, and “Unit Tests”. On the right, there is a list of sentences with a search bar and an edit button. The search bar is filled with a search query “you.” Each sentence is an English input with the word “you” highlighted in blue.
4.3. Detail View
To help users further analyze individual challenge sets (D3), Angler presents the Detail View (Fig. 5) when a user clicks the
![]() button under a challenge set in the Table View (Fig. 3).
In the header of the Detail View (Fig. 5A), users can inspect the metrics associated with this challenge set and edit the set’s name.
To explore sentences in this set through different perspectives, users can use the Timeline (Fig. 5C) and Spotlight (Fig. 5E) to filter sentences by different attributes.
The Filter Bar (Fig. 5B) displays the currently applied filters, and the Sentence List (Fig. 5F) only shows sentences that satisfy these filters.
There are six visualization variations of the Spotlight (Fig. 6).
Users can switch between them to fit their exploration needs (D4) by clicking the corresponding Thumbnails (Fig. 5D).
Each Thumbnail is a simplified version of a Spotlight variation, where the visualization also updates in real-time when users add or remove filters.
button under a challenge set in the Table View (Fig. 3).
In the header of the Detail View (Fig. 5A), users can inspect the metrics associated with this challenge set and edit the set’s name.
To explore sentences in this set through different perspectives, users can use the Timeline (Fig. 5C) and Spotlight (Fig. 5E) to filter sentences by different attributes.
The Filter Bar (Fig. 5B) displays the currently applied filters, and the Sentence List (Fig. 5F) only shows sentences that satisfy these filters.
There are six visualization variations of the Spotlight (Fig. 6).
Users can switch between them to fit their exploration needs (D4) by clicking the corresponding Thumbnails (Fig. 5D).
Each Thumbnail is a simplified version of a Spotlight variation, where the visualization also updates in real-time when users add or remove filters.
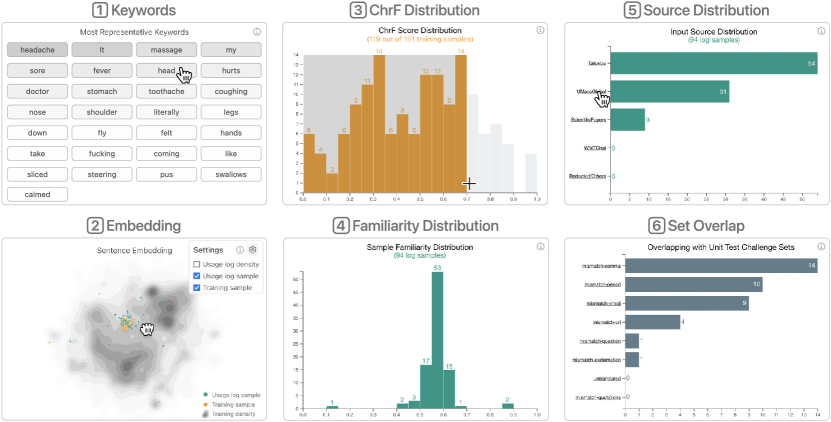
Six screenshots of different Spotlight View variations. (1) Keywords Spotlight is a grid of the most representative keywords. (2) Embedding Spotlight shows the embedding of all training data as well as colored dots representing training and usage log samples from this challenge set. (3) ChrF Distribution Spotlight is an orange bar chart where the bars in the range from 0 to 0.7 are selected by brushing. (4) Familiarity Distribution Spotlight is a green bar chart. (5) Source Distribution Spotlight is a green horizontal bar chart. (6) Set Overlap Spotlight is a gray horizontal bar char.
4.3.1. Timeline
To help users investigate how usage logs change over time, the Detail View provides a Timeline (Fig. 5C) panel on top of the window. The Timeline visualizes the number of user requests in this set over time as a histogram, where the x-axis represents the time and the y-axis represents the request count. Users can zoom and pan to inspect different periods. Users can also brush the histogram to filter usage logs that are from a particular time window.
4.3.2. Keyword Spotlight
Similar to the Keyword panel in the Set Preview (§ 4.2), the Keyword Spotlight (Fig. 6-1) displays the most representative words in a challenge set. It sorts keywords by their representativeness, which is measured by the class-based TF-IDF scores (Grootendorst, 2022). This view uses the darkness of the background color to encode a word’s representativeness. Users can click keywords to filter sentences that contain selected keywords.
4.3.3. Embedding Spotlight
To help users explore the semantic similarity of sentences in a challenge set, the Embedding Spotlight (Fig. 6-2) visualizes a 2D projection of the sentences’ high-dimensional representations (§ 4.1.2) in a scatter plot. Each dot in the scatter plot represents a sentence, and it is positioned by its UMAP coordinates. Furthermore, we visualize the KDE density distributions (§ 4.1.2) of all training data and all usage logs as contour plots. Augmenting the scatter plot with density distributions of overall training data and usage logs allows users to discover use cases that are not well supported by existing training data (D1).
4.3.4. ChrF Spotlight
The ChrF Spotlight (Fig. 6-3) visualizes the model’s ChrF score distribution on the training data in this set as a histogram, allowing users to gain more insights regarding the model’s performance on a particular set. The x-axis encodes the ChrF scores, and the y-axis encodes the distribution frequency of training data in the set. In addition, users can brush to select bins in the histogram, which would filter sentences with a ChrF score in the specified range.
4.3.5. Familiarity Spotlight
The Familiarity Spotlight (Fig. 6-4) is similar to the ChrF Spotlight. However, the x-axis here represents the model’s familiarity scores on usage logs in the set. The familiarity score is determined by the log-likelihood of observing a user request under the distribution of all training data (§ 4.1.2). Users can brush the histogram to filter sentences with particular familiarity scores.
4.3.6. Source Spotlight
To allow users to compare usage logs by the sources of these user requests, the Source Spotlight (Fig. 6-5) visualizes usage log count as a horizontal bar chart. The x-axis encodes the count of usage logs from one particular source, and the y-axis encodes the source category. To focus on logs from particular sources, users can click the source names to create filters. In our open-source demo, the Source Spotlight shows the source dataset from which each sentence was sampled. In the version of the tool developed for the MT team, the Source Spotlight shows the source application from which a request was made (available for a sample of usage logs).
4.3.7. Overlap Spotlight
The design of the Overlap Spotlight (Fig. 6-6) is similar to Source Spotlight. Instead of encoding the source category, the y-axis here represents other challenge sets. For example, for a challenge set created by unit test failures, the y-axis in its Overlap Spotlight represents other challenge sets created by unfamiliar topics. As unfamiliar topics are strictly non-overlapping, this view only shows overlap with challenge sets of the other type. By cross-referencing two challenge set types (unit test failures and unfamiliar topics), this visualization can help users explore syntactic errors within semantic topics, and vice versa.
4.3.8. Sentence List
The Sentence List (Fig. 5F) shows all sentences in the challenge set that satisfy the currently applied filters.
Users can click a sentence to see the model’s translation.
To further fine-tune a challenge set, users can click the
![]() Edit button and remove unhelpful sentences from the set.
Finally, users can click the
Edit button and remove unhelpful sentences from the set.
Finally, users can click the
![]() Export button to export sentences shown in the list along with their translations and attributes; users can then easily share these sentences with colleagues and human annotators (D4).
Export button to export sentences shown in the list along with their translations and attributes; users can then easily share these sentences with colleagues and human annotators (D4).
4.4. Open-source Implementation
Angler is an open-source interactive visualization system built with D3.js (Bostock et al., 2011): users with diverse backgrounds (D4) can easily access our tool directly in their web browsers without installing any software or writing code. We use the standard NLP suite for data processing (e.g., NLTK (Loper and Bird, 2002), Scikit-learn (Pedregosa et al., 2011)) and topic modeling (e.g., BERTopic (Grootendorst, 2022), UMAP (McInnes et al., 2018)). We first implemented Angler with an industry-scale MT model (English Spanish) and real training data and usage logs. For demonstrations in this paper, we use the public MT model OPUS-MT (English Simplified Chinese) (Tiedemann and Thottingal, 2020) and its training data (Tiedemann, 2020). To simulate usage logs we augment a sample of the model’s test data (Tiedemann, 2020) with publicly available sources to emulate realistic use cases that can be difficult for MT models: social media (Blodgett et al., 2017), conversation (Farinha et al., 2022), and scientific articles (Soares et al., 2018).
4.5. Usage Scenario
We present a hypothetical usage scenario to illustrate how Angler can help Priya, an MT engineer, explore usage logs and guide new training data acquisition. The first part of this usage scenario, in which the user explores and selects challenge sets of interest, is informed by real user interactions that we observed in the user study (§ 5). The second phase of the scenario describes how we envision extending Angler in future work to help practitioners use the datasets they collect with Angler to improve model performance.
Priya works on improving an English–Chinese translation model, and she only speaks English. Priya first applies the challenge set extraction pipeline (§ 4.1) to the training data and usage logs from the past 6 months. The pipeline yields 100 challenge sets from unfamiliar topics and 6 challenge sets from unit test failures. After Priya opens Angler to load extracted challenge sets in a web browser, she sees the Table View (Fig. 1A) summarize all 106 sets in a table with a variety of statistics. Priya wants to prioritize subsets of data where the model may not perform well, but which are important to the end-users of the model, e.g., because they occur frequently in the usage logs, or represent a high-stakes use case. To focus on data on which the current MT model may not perform well, Priya sorts challenge sets in ascending order by their mean ChrF scores by clicking the sort button. After inspecting the top rows and their Set Previews, the topic-headache set draws Priya’s attention—the MT model performs poorly on this set (mean ChrF score is only 0.39), and this set involves high-stakes medical topics where the MT quality is critical (observed from the Keywords in the Set Preview).
To learn more about this challenge set, Priya clicks the
![]() button to open the Detail View (Fig. 1B).
Priya notices that the number of usage logs is consistent across the past nine months (from July 2021 to March 2022) in the Timeline (Fig. 1-B1).
She then clicks the Embedding Thumbnail (Fig. 5D) to switch the Spotlight from the default Keywords view (Fig. 6-1) to the Embedding view (Fig. 6-2).
Through zooming and hovering over the scatter plot, Priya finds that most sentences from this set form a cluster in the high-dimensional representation space, and all these sentences are about health issues.
She is surprised to see that people are using the model to communicate about health concerns, and wonders whether the training data covers this use case.
To explore this, Priya opens the Familiarity Distribution Spotlight (Fig. 6-4) and brushes the histogram to select the region with low familiarity scores.
The Timeline, charts in Thumbnails, and the Sentence List update in-real time to focus on the usage logs with a familiarity score in the selected range.
Browsing the sentences in the Sentence List, Priya realizes that many of these unfamiliar sentences are about fever.
She worries that wrong translations about fevers could pose a health risk to users.
Therefore, Priya decides to prioritize improving her model’s performance on this challenge set; she clicks the
button to open the Detail View (Fig. 1B).
Priya notices that the number of usage logs is consistent across the past nine months (from July 2021 to March 2022) in the Timeline (Fig. 1-B1).
She then clicks the Embedding Thumbnail (Fig. 5D) to switch the Spotlight from the default Keywords view (Fig. 6-1) to the Embedding view (Fig. 6-2).
Through zooming and hovering over the scatter plot, Priya finds that most sentences from this set form a cluster in the high-dimensional representation space, and all these sentences are about health issues.
She is surprised to see that people are using the model to communicate about health concerns, and wonders whether the training data covers this use case.
To explore this, Priya opens the Familiarity Distribution Spotlight (Fig. 6-4) and brushes the histogram to select the region with low familiarity scores.
The Timeline, charts in Thumbnails, and the Sentence List update in-real time to focus on the usage logs with a familiarity score in the selected range.
Browsing the sentences in the Sentence List, Priya realizes that many of these unfamiliar sentences are about fever.
She worries that wrong translations about fevers could pose a health risk to users.
Therefore, Priya decides to prioritize improving her model’s performance on this challenge set; she clicks the
![]() Export button to save all sentences along with their translations from this challenge set.
Export button to save all sentences along with their translations from this challenge set.
The current Angler prototype was designed to explore what information practitioners need to prioritize subsets of data to send to annotators. Priya follows a similar process to identify and export a few other challenge sets of high importance and sends all of this data to human annotators to acquire additional training data. Human annotators can speak both English and Chinese. They write reference Chinese translations for given English sentences by directly editing the translations produced by the model. In the future, Angler could be extended to allow Priya to continue her analysis after the data has been annotated.
For example, Priya could check a few sentences from the health-related challenge set whose reference translations are significantly different from their translations produced by Priya’s model. At this point, Priya might find that her model has made several serious translation errors. For example, her model translates the input sentence “The fever burns you out” to “发烧会烧死你” in Chinese (Fig. 1-B3), which means “fever will burn you to death.” After retraining the MT model with the newly annotated data, Priya would hope to see that the model’s ChrF scores and familiarity scores on the original challenge sets have significantly improved. In this case, Priya would schedule to deploy her new MT model in the next software release cycle, now with better support for a safety-critical use case.
5. User Study
We used Angler in a user study with seven people who contribute to machine translation development at Apple as ML engineers (E1–3), and in user experience-focused roles, such as product management, design, or analytics (UX1–4). Our goal in this study was to understand how users with different expertise would use Angler to explore and prioritize challenge sets. We were also interested in whether exploring challenge sets using Angler could help practitioners to uncover new insights about their models, and identify new ways to improve their models in line with users’ needs. Our goal was not to measure whether Angler can support prioritization more effectively than another tool, e.g., by finding more translation errors, but rather to explore what kind of information is useful to practitioners, and how the process of exploring challenge sets could shape future evaluation practices.
The study was approved by our internal IRB. Each session was conducted over video chat and lasted between 45 minutes and one hour. With participants’ consent, each session was recorded and transcribed for analysis. During each study session, we introduced Angler with a tutorial demonstrating each view (Fig. 3–Fig. 6). Angler showed training and usage data from the team’s own translation model, for the language pair English Spanish. Next, we sent the participant a one-time secure link that allowed them to access the tool in their own browser, and asked them to share their screen while they explored the tool. For the remainder of the session, we asked the participant to think aloud as they completed three tasks:
-
T1.
First, we asked the participant to navigate to the Detail View of a unit test challenge set that targeted mismatches in numbers between source and output translations, and to discuss what they saw.
-
T2.
Second, we asked the participant to choose a topic-based challenge set that was interesting to them, explain their choice, and again explore the Detail View to learn more.
-
T3.
Finally, we gave the participant a hypothetical budget of 2,000 sentences that they could choose to get evaluated by expert human translators, and asked them to explain how they would allocate that budget. The evaluation by professional translators could involve rating the quality of model-produced translations and/or correcting the translations to create gold standard reference translations that could be used for future model training.
We analyzed the transcripts following a similar qualitative data analysis procedure to that of the formative interview study (§ 3.1). One author conducted two rounds of open coding, synthesizing and combining codes each round (Merriam and Associates, 2002). Next, a second author took the code book in development and independently coded all of the transcripts, adding new codes where relevant and noting disagreements. These two authors then discussed and resolved disagreements, and converged on final coding scheme.
We found that T1 and T2 mainly served as a way for participants to acclimate to Angler’s interface, and understand the two types of challenge sets. Although participants confirmed that T3 was a realistic task for the team, most participants did not do the task as we had originally planned. We report our findings regarding how participants picked which challenge sets they deemed important for model improvements, but we do not report on their fictional budget allocations because the majority of participants were resistant to allocating concrete (even completely hypothetical) numbers. We discuss this tension more in limitations § 5.3. All three tasks required participants to prioritize among the available challenge sets, but our findings focus largely on participants’ judgments during T3, where they spent the majority of the study time.
As discussed in Section 3, the team’s existing approaches to model debugging and improvement were either one-off, focused analyses, which do not require prioritization between issues, or random samples of usage logs, which implicitly prioritize use cases based on frequency of requests. Participants informally compared what they could do with Angler to these existing practices. Our goal in this study was to explore the space of possibilities for visual analytics tools to support prioritization, rather than quantify the relative benefit of our specific prototype compared to existing practices.
5.1. Results: Prioritizing under Uncertainty
Participants had to rely on imperfect and incomplete metrics to estimate the quality of translations. All participants knew a little Spanish, but not enough to spot-check the quality of a translation in most cases. Though Angler shows sentences from usage data and model training data, only the training data had reference translations certified as correct by human translators. Sentences from the usage logs have no quality annotations (§ 4.1). Thus the ChrF quality estimation for any challenge set was based on the limited data with reference translations. This evaluation setup is far from ideal, yet realistic to what MT practitioners ordinarily encounter.
Participants knew that no one metric was a reliable source of quality information, so they weighed multiple signals and still knew that human annotation would generally be required to get a reliable measure of quality. Three participants discussed how they incorporated uncertainty when interpreting metrics like average ChrF to ensure they were getting meaningful estimates of quality [E1, E2, UX4]:
“You might get a low metric or a low familiarity score, but the smaller the sample is the more likely it is [that] there’s gonna be some noise in there that’s kind of moving the metric.” — UX4
Future iterations of the tool could use re-sampling methods to estimate confidence intervals for challenge set summary statistics to make this uncertainty more explicit.
Despite available metrics in Angler being uncertain proxies for model performance, participants nonetheless used metrics to judge the relative importance of a challenge set:
“It’s better to have a statistical way, I mean, [rather than] just by what I’m thinking, right?” — E2
All participants tended to rank the challenge sets by potential risk of model failure by combining low ChrF, low familiarity, and low train-ratio. Low ChrF indicates that the limited training data that falls within the challenge set might be poorly translated (Popović, 2015). Low familiarity and low train-ratio are proxies for where the training data set might lack coverage of the usage data. Low familiarity suggests that the user request data that falls within the challenge set is semantically different from the overall training data. Low train-ratio indicates that this challenge set represents a subgroup that is much more represented in the user requests than in the training data. Familiarity and train-ratio were calculated in a way that correlates (§ 4.1).
As a first pass, most participants used the sorting feature in the Table View (Fig. 3) to rank which challenge sets scored the lowest on one or more of these three metrics [E1, E2, UX1, UX3, UX4]. Four of these five participants additionally considered set size, with a preference for larger sets. While participants could have stopped at this point, given the opportunity to explore further, none of the practitioners relied solely on the available metrics. Next, we discuss other ways that participants used Angler to explore the data beyond aggregate metrics and decide which sets to annotate.
5.1.1. Estimating Meaningful Use Cases
From the list of challenge sets in the Table View sorted by metrics, three participants chose to prioritize topics that appeared to represent a “meaningful,” coherent use case [UX1, E2, UX2]. Partially, this is because the BERTopic (Grootendorst, 2022) model tends to generate some “topics” with little meaning, e.g., the topic topic-haha_lol_so_you versus the more meaningful topic-health_nursing_care_medical in Fig. 3.
Partially, participants needed to make judgments on the value of improving the model on various sentence types, since some challenge sets mostly contained data that appeared to be fraud, spam, or automated messages. Participants demonstrated the value of being able to directly read sentences in the Detail View (Fig. 5) to make these judgments:
“Yeah, a lot of these are spam. […] As I’m kind of going through them, it’s like a lot of spam, a lot of porn and a lot of things that are like, automated messages. So I would use my discretion, of course, and wouldn’t just use the numbers.” — UX1
E1 knew from prior experience that “it’s always good to look at what the data actually are […] besides looking at the high level statistics.” They had seen in the past that even keyword summaries can be misleading and obscure complexity that is apparent when directly inspecting the data:
“From my past experience, sometimes we have seen some data contain some keywords and we imagine them to be, for example, articles, but looking at the actual example, they are kind of fraud messaging. […] Combining them together as a single dedicated targeted test would not make too much sense for us to understand the performance on it.” — E1
Some of the dataset contained explicit sexual content and profanity, to which participants ascribed different value. UX1 argued for prioritizing model improvement resources towards use cases that aligned with their organization’s values (such as supporting small business owners), over explicit content. UX4 was far more accepting of explicit content, arguing that if users were translating that content, there was no reason to treat it differently.
5.1.2. Estimating Impact on Users
Participants assessed how severe the consequences of specific model failures would be for end users. They considered the stakes of the interaction mediated by the model [UX1, UX2, UX3], whether a failure was especially sensitive, e.g., offensive outputs, and how likely a user was to be misled if they were to receive an erroneous translation of this nature, such as an incorrect date [UX2].
In task T1 all participants looked at number mismatch translations (Fig. 2). All participants skimmed the raw translations to focus on specific sub-cases of number translation, for instance how the model converts roman numerals, dates, or currency. Even though they could not read the Spanish translation, E2, UX2, and UX4 talked about wanting to find “obvious” errors where they could clearly see numbers changing from English to Spanish. e.g., 1,100 dollars to 100 dollars. An obvious error may not mislead a user, but could degrade their trust in the translation product. Participants dug into specific sub-cases through filtering and search in Angler to get a sense for the severity of an error:
“It’s a really nice way of quickly getting into the patterns to see whether or not we’re looking at something like a serious problem with translation or if it’s just kind of surface level formatting issues.” — UX4
5.1.3. Estimating Complexity of the Error
Practitioners wanted to prioritize annotation resources on more complex kinds of failures, rather than those that could be solved internally without additional annotations [UX1, E1]. For example, issues with translating numbers could be identified within the team by using regular expressions to match source and translations. For pattern-based failures, such as translating numbers or translating automated messages, E1 proposed trying data augmentation techniques first. Data augmentation includes increasing the samples and variations on existing data, e.g., the sentence “I ate breakfast on Sunday” can be duplicated to create a sentence for all the weekdays “I ate breakfast on Monday”:
“If it’s a lack of data issue, it should be very easy to augment the data for this particular example.” — E1
While they used train-ratio and familiarity metrics to identify potential coverage issues, directly inspecting the data gave them insight into whether a problem was complex enough to warrant annotation. E3, E2, and UX2 used the Embedding view to develop more nuanced hypotheses about how customers’ use of the model differs from the training data. Even within an apparently similar topic, participants used clusters of usage data with comparatively less training data to estimate subtopics that may need better coverage [UX1, E2, E3]. They used their experience to hypothesize why or why not an area of low-coverage might be difficult for the model. For instance a cluster with a lot of domain-specific language may be best improved by paying for additional annotations [E2].
While we had initially prompted practitioners to budget annotation resources between the challenge sets we gave them, more often we found that they wanted to prioritize subgroups within those sets to optimize annotation for the most complex and impactful issues.
We observed that practitioners were able to form more interesting and user-focused hypotheses for prioritization when they combined summary statistics with qualitative assessment of the data by reading sentences. Their use of Angler was promising evidence for the strength of a visual analytics approach in MT prioritization. At the same time, practitioners demanded more features for flexibly creating challenge sets and exploring more analytics lenses than the Angler prototype supported. We next discuss strengths and limitations of the tool to inform next steps.
5.2. Results: Angler Strengths and Usefulness
5.2.1. Develop Intuition for Model Behavior
Neural machine translation models are large language models that are not easily understandable even to those who have developed them (Johnson et al., 2017). We found that exploring data with Angler helped practitioners develop a deeper understanding of how their models work. UX4 said that “a lot of what I like to do is just develop my like, mental model of how our translation models are working.” Exploring challenge sets by the quality metrics gave E2 “some insights into the weaknesses of the model.” Given that practitioners’ intuitions about model weaknesses guide their future debugging effort (§ 3.2.2), this can bring value beyond identifying specific failures in the moment.
5.2.2. Develop Intuition for Translation Usage
Participants used the topic-based challenge sets to improve their understanding of how customers use their translation products. The Keyword Spotlight, Sentence List, and Source Spotlight were especially useful for participants to develop hypotheses about how people use the model and the context where they are using it [UX1, UX2, UX3, E3]. UX1 works in a user experience focused role and said that, “it helps us inform feature development when we understand the conversation topics that people are using [the model for].” While browsing the unit test challenge set based on mismatches in numbers between source and output, E3 imagined potential future features that could give users greater control over how different number formats are handled in translation, e.g., when to use Roman numerals or convert date formats.
5.2.3. Develop a Shared Interdisciplinary Understanding
UX-focused participants expressed excitement for using a visual analytics tool like Angler to broadly explore the use cases surrounding potential failure-modes—as opposed to a purely metrics-driven report that does not allow them to develop their sense of the use context. UX1 and E3 pointed out that being able to describe specific use cases makes it easier to engage cross-functional teams in planning and prioritizing product improvements and developments. UX1 wanted to spend time using Angler to “generate some insights about each of [the topics] in human understandable terms” that they could then present to other team members.
“Our [team members] come from a variety of backgrounds […] not all of them are engineers. So it’s like, could I translate the high level findings here into something that they could understand in a brief?” — UX1
Using Angler, UX2 and UX3 even learned new insights about where the model performs unexpectedly well on specific kinds of inputs: “the date formatting changed. I didn’t even know if that’s something that we do” — UX2.
Discussing improvements in terms of use cases and specific customer needs not only supports internal cross-functional collaboration, but also makes it easier to acquire new data targeting specific topics from external vendors [UX1].
5.3. Results: Angler Limitations and Usability Issues
As we mentioned in § 5, most participants did not assign concrete numbers in the annotation budgeting task T3. Partially this was a limitation of the study setup, since we provided participants with a long list of pre-made challenge sets in Angler, and there was not enough time for a participant to closely examine all of them. However, in many cases participants also wanted more information and analytics features to drive their prioritization than Angler provides —or else wanted to refine challenge sets from those we pre-made. A major design takeaway for future work is that although Angler is already a relatively complex visualization tool, far more lenses and interactions were desired to complete the MT annotation prioritization task. We discuss these key areas for improvement next.
5.3.1. Provide More Context and Comparison
Participants wanted to contextualize the data they were seeing in each challenge set with reference to the overall distribution of data in the training data and usage logs. For example, UX3 and UX4 wanted to know what the average familiarity score was over all of the usage logs to interpret familiarity scores on specific challenge sets. Other participants suggested additional useful reference points, for instance, understanding overall ChrF score distribution by language pair [E2, UX3] or understanding the overall distribution of topics in the training data and usage logs [UX2, UX4]. E3 suggested that it would be helpful to be able to more easily compare challenge sets:
“It’s not so easy for me to compare them [challenge sets]. So it would be great if I can somehow select a cluster and compare them side by side.” — E3
5.3.2. Support Authoring and Refining Challenge Sets
Our focus in this work was on how visual analytics tools could support the process of prioritizing specific areas for improving MT models. Therefore, we chose two plausible methods for constructing challenge sets to use as examples in the study. While participants found those sets interesting, there was a clear need for future tooling to support challenge set creation in addition to exploration.
Participants wanted to search all of the data by specific terms [UX3, E3] and refine the unit test logic to better capture specific types of errors [E1, E2, UX2, E3, UX4]. UX4 even asked if they could onboard their own datasets that they already had available to explore them with Angler’s visualizations.
5.3.3. Offer Advanced Export Options for Custom Analysis
Two participants [UX1, E2] expressed a desire to conduct their own analyses on the data, e.g., conduct a custom analysis over time [UX1] or experiment with the underlying topic model [E2]. While Angler offers a simple export option, these options could be made more sophisticated to support users with advanced skills to build on the default visualizations.
5.3.4. Expand Filtering and Sorting Capabilities
Several participants found issues with the data filtering and sorting features that made it difficult to organize and prioritize data in the way they wished [UX1, E1, UX3, E3]. For example, two participants expected to be able to filter to all sentences containing all of the keywords selected, but the tool returned any such sentences [UX3, E3]. Two participants also struggled to keep track of which filters they had applied when navigating between views [E1, UX3], suggesting potentials to make the ability to view and remove filters more prominent in the interface. Two participants wanted to sort the Table View by multiple columns to be able to organize and prioritize sets by multiple metrics or factors, e.g., find large sets within the sets with the lowest average ChrF score [UX1, E1].
5.3.5. Validate and Extend Challenge Set Creation Methods
Grouping data using a topic model was a useful way for practitioners to explore data and better understand use cases for the model. However, it is not clear whether a group of sentences that are close together in a latent embedding space that was trained to group together sentences with similar meaning are also likely to be similarly difficult for an MT model.
There are certainly other dimensions by which to group data. As UX3 described,
“When I think about trying to determine where we’re doing poorly, there are a lot of dimensions you can look at. Topic is one, right? But there could be other dimensions, like how long the sentence is.” — UX3
In this paper, we found that exploring challenge sets has the potential to help practitioners prioritize their model evaluation and development resources on issues that are important to end-users. An important direction for future work is to validate that the challenge sets presented indeed represent areas where the translation model performance is relatively weaker. For instance, rather than asking practitioners to allocate hypothetical budgets, they could allocate real budgets and have professional translators evaluate the challenge sets selected to see whether they were able to identify new model failure cases using Angler.
In general, we designed Angler to be agnostic to the method of generating challenge sets. Thus, research developing and evaluating methods for generating challenge sets can proceed in parallel to efforts to improve visual analytics support for exploring, comparing, and prioritizing them.
6. Discussion and Future Work
To conclude, we discuss our findings in the broader context of tooling for ML evaluation and debugging and highlight directions for future work.
6.1. Trade-offs Between Automation and Human Curation
Angler encourages MT practitioners to inspect training data and usage logs, so that they can better understand how end-users use MT models and detect model failures. Practitioners can then annotate related data samples and retrain the model to address detected failures. Since exploring raw data is a manual and tedious process, we introduce an approach that uses unit tests and topic modeling to automatically surface interesting challenge sets (§ 4.1). Our approach yields many challenge sets, but it still takes time for MT practitioners to inspect and fine-tune these sets. One might argue that we should automate the whole pipeline and have human raters annotate all extracted challenge sets. However, annotating MT data is expensive (Freitag et al., 2021; Moré and Climent, 2014). In our study, some challenge sets reveal MT errors that are trivial, where MT experts hesitate to spend the budget to annotate the challenge sets (§ 5.1.1). Besides data acquisition prioritization, our mixed-initiative approach can also help users interact with raw usage logs and gain insights into the real-life use cases of MT models. Future researchers can use Angler as a research instrument to further study the trade-offs between automation and human curation for challenge set creation. To further reduce human effort, researchers can surface challenge sets more precisely before presenting them to MT practitioners.
6.2. Generalization to Different Model Types
We situate Angler in the MT context, as it is particularly challenging to discover failures for MT models due to the scarcity of ground truth and the high cost of human annotators (§ 2.2). However, our method is generalizable to different model types. In our formative interview study, we find that it is a common practice to use challenge sets to test and monitor NLP, computer vision, and time-series models (§ 3.3). ML practitioners can adapt our unit tests and topic modeling (clustering) approach to surface challenge sets for other model types. Consider an image classification model; practitioners could define perturbation-based unit tests to detect model weaknesses. For example, we would expect a model to give the same prediction when the input image is rotated, resized, or with different lighting (Rebuffi et al., 2021; Joshi et al., 2022). Then, we can create challenge sets by collecting images where the model’s prediction changes after adding image perturbations. Similar to topic modeling, practitioners could use embedding clustering (Baktashmotlagh et al., 2016; Cai et al., 2019) and sub-group analysis (Krishnakumar et al., 2021; Lee et al., 2022) to identify unfamiliar images from both usage logs and training data. For example, if an image classifier team receives a user’s complaint about a misclassification, they can use embedding-based image search (Radford et al., 2021) to identify similar images and create a challenge set. Finally, researchers can adapt Angler’s overview+detail design (§ 4) and open-source implementation (§ 4.4) to summarize extracted challenge sets and allow practitioners to explore and curate potentially error-prone images through different perspectives.
6.3. Unit Tests for Machine Learning
Researchers have argued that unit tests can help pay down the technical debt in ML systems (Sculley et al., 2015; Sculley, 2022). There are many different ways to apply unit tests to an ML system. For example, practitioners can write unit tests to validate the data quality (Polyzotis et al., 2019; Schelter et al., 2019), verify a model’s behavior (Ribeiro et al., 2020; Lovering and Pavlick, 2022), and maintain ML operations (MLOps) (Garg et al., 2021; Huyen, 2022). In Angler, we design simple rule-based unit tests, such as if the source does not contain offensive words, then the translation should not either. We then apply these tests to the training data and usage logs to surface challenge sets (§ 4.1.1). Since they were intended to be a proof of concept, our unit tests were blunt and imperfect. Still, MT practitioners in the evaluation study especially appreciated the unit tests, as they are powerful to detect glaring translation mistakes and yet are easy to adopt in the current model development workflow (§ 5.2.2). Therefore, we see rich research opportunities to study unit tests for ML systems. For example, future researchers could extend our unit tests to support MT data validation and MLOps in general. Researchers could also adapt Angler to design future interactive tools that allow ML practitioners to easily write, organize, and maintain unit tests for ML systems.
6.4. Broader Impact
To overcome the limitations of aggregate metrics on held-out test sets (§ 2.1, § 2.2), Angler uses real usage logs to help MT practitioners gain a better understanding of how their models are used and prioritize model failures. Drawing on usage data raises privacy and security concerns. All of the authors have received training and license to use usage logs from their institution for this research. Researchers adapting Angler should carefully consider the ethical implications of their choice of data source (Barocas et al., 2021). Before collecting usage logs, researchers need to obtain consent from the users (Raji et al., 2020) and compensate them when applicable (Arrieta-Ibarra et al., 2018). Usage logs must be de-identified before viewing them with Angler. Finally, we encourage researchers and developers to thoroughly document their process of adopting Angler with new models and datasets (Heger et al., 2022), including how they approach these ethical considerations.
7. Conclusion
In this work, we present Angler, an open-source interactive visualization system that empowers MT practitioners to prioritize model improvements by exploring and curating challenge sets. To inform the design of the system, we conducted a formative interview study with 13 ML practitioners to explore current practices in evaluating ML models and prioritizing evaluation resources. Through a user study with 7 MT stakeholders across engineering and user experience-focused roles, we revealed how practitioners prioritize their efforts based on an understanding of how problems could impact end users. We hope our work can inspire future researchers to design human-centered interactive tools that help ML practitioners improve their models in ways that enrich and improve the user experience.
Acknowledgements.
We thank our colleagues at Apple for their time during the interview study and evaluating our system. We especially thank Danielle Olson who sparked early ideas and connections for pursuing this line of research, and Yanchao Ni for lending his expertise in machine translation for our work.References
- (1)
- Albrecht et al. (2009) Joshua Albrecht, Rebecca Hwa, and G. Elisabeta Marai. 2009. The Chinese Room: Visualization and Interaction to Understand and Correct Ambiguous Machine Translation. Computer Graphics Forum 28 (June 2009), 1047–1054. https://doi.org/10.1111/j.1467-8659.2009.01443.x
- Amershi et al. (2019) Saleema Amershi, Andrew Begel, Christian Bird, Robert DeLine, Harald Gall, Ece Kamar, Nachiappan Nagappan, Besmira Nushi, and Thomas Zimmermann. 2019. Software Engineering for Machine Learning: A Case Study. In 2019 IEEE/ACM 41st International Conference on Software Engineering: Software Engineering in Practice (ICSE-SEIP). IEEE, Montreal, QC, Canada, 291–300. https://doi.org/10.1109/ICSE-SEIP.2019.00042
- Arrieta-Ibarra et al. (2018) Imanol Arrieta-Ibarra, Leonard Goff, Diego Jiménez-Hernández, Jaron Lanier, and E. Glen Weyl. 2018. Should We Treat Data as Labor? Moving beyond ”Free”. AEA Papers and Proceedings 108 (May 2018), 38–42. https://doi.org/10.1257/pandp.20181003
- Avramidis et al. (2019) Eleftherios Avramidis, Vivien Macketanz, Ursula Strohriegel, and Hans Uszkoreit. 2019. Linguistic Evaluation of German-English Machine Translation Using a Test Suite. In Proceedings of the Fourth Conference on Machine Translation (Volume 2: Shared Task Papers, Day 1). Association for Computational Linguistics, Florence, Italy, 445–454. https://doi.org/10.18653/v1/w19-5351
- Baktashmotlagh et al. (2016) Mahsa Baktashmotlagh, Mehrtash Har, i, and Mathieu Salzmann. 2016. Distribution-Matching Embedding for Visual Domain Adaptation. Journal of Machine Learning Research 17, 108 (2016), 1–30. http://jmlr.org/papers/v17/15-207.html
- Banerjee and Lavie (2005) Satanjeev Banerjee and Alon Lavie. 2005. METEOR: An Automatic Metric for MT Evaluation with Improved Correlation with Human Judgments. In Proceedings of the Acl Workshop on Intrinsic and Extrinsic Evaluation Measures for Machine Translation and/or Summarization. Association for Computational Linguistics, Ann Arbor, Michigan, 65–72.
- Barocas et al. (2021) Solon Barocas, Anhong Guo, Ece Kamar, Jacquelyn Krones, Meredith Ringel Morris, Jennifer Wortman Vaughan, W. Duncan Wadsworth, and Hanna Wallach. 2021. Designing Disaggregated Evaluations of AI Systems: Choices, Considerations, and Tradeoffs. In Proceedings of the 2021 AAAI/ACM Conference on AI, Ethics, and Society (Virtual Event, USA) (AIES ’21). Association for Computing Machinery, New York, NY, USA, 368–378. https://doi.org/10.1145/3461702.3462610
- Beauxis-Aussalet et al. (2021) Emma Beauxis-Aussalet, Michael Behrisch, Rita Borgo, Duen Horng Chau, Christopher Collins, David Ebert, Mennatallah El-Assady, Alex Endert, Daniel A. Keim, Jorn Kohlhammer, Daniela Oelke, Jaakko Peltonen, Maria Riveiro, Tobias Schreck, Hendrik Strobelt, and Jarke J. van Wijk. 2021. The Role of Interactive Visualization in Fostering Trust in AI. IEEE Computer Graphics and Applications 41 (Nov. 2021), 7–12. https://doi.org/10.1109/mcg.2021.3107875
- Bentley (1975) Jon Louis Bentley. 1975. Multidimensional Binary Search Trees Used for Associative Searching. Commun. ACM 18 (1975). https://doi.org/10.1145/361002.361007
- Bhatt et al. (2021) Shaily Bhatt, Rahul Jain, Sandipan Dandapat, and Sunayana Sitaram. 2021. A Case Study of Efficacy and Challenges in Practical Human-in-Loop Evaluation of NLP Systems Using Checklist. In Workshop on Human Evaluation of NLP Systems.
- Blodgett et al. (2017) Su Lin Blodgett, Johnny Wei, and Brendan O’Connor. 2017. A Dataset and Classifier for Recognizing Social Media English. In Proceedings of the 3rd Workshop on Noisy User-generated Text. Association for Computational Linguistics, Copenhagen, Denmark, 56–61. https://doi.org/10.18653/v1/W17-4408
- Bolukbasi et al. (2016) Tolga Bolukbasi, Kai-Wei Chang, James Y Zou, Venkatesh Saligrama, and Adam T Kalai. 2016. Man Is to Computer Programmer as Woman Is to Homemaker? Debiasing Word Embeddings. In NeurIPS, Vol. 29.
- Bostock et al. (2011) M. Bostock, V. Ogievetsky, and J. Heer. 2011. D3 Data-Driven Documents. IEEE TVCG 17 (Dec. 2011). https://doi.org/10.1109/tvcg.2011.185
- Buolamwini and Gebru (2018) Joy Buolamwini and Timnit Gebru. 2018. Gender Shades: Intersectional Accuracy Disparities in Commercial Gender Classification. In Proceedings of the 1st Conference on Fairness, Accountability and Transparency (Proceedings of Machine Learning Research, Vol. 81).
- Burchardt et al. (2017) Aljoscha Burchardt, Vivien Macketanz, Jon Dehdari, Georg Heigold, Peter Jan-Thorsten, and Philip Williams. 2017. A Linguistic Evaluation of Rule-Based, Phrase-Based, and Neural MT Engines. The Prague Bulletin of Mathematical Linguistics 108 (2017). https://doi.org/10.1515/pralin-2017-0017
- Burlot et al. (2018) Franck Burlot, Yves Scherrer, Vinit Ravishankar, Ondřej Bojar, Stig-Arne Grönroos, Maarit Koponen, Tommi Nieminen, and François Yvon. 2018. The WMT’18 Morpheval Test Suites for English-Czech, English-German, English-Finnish and Turkish-English. In Proceedings of the Third Conference on Machine Translation: Shared Task Papers. https://doi.org/10.18653/v1/w18-6433
- Burlot and Yvon (2017) Franck Burlot and François Yvon. 2017. Evaluating the Morphological Competence of Machine Translation Systems. In Proceedings of the Second Conference on Machine Translation. https://doi.org/10.18653/v1/w17-4705
- Cabrera et al. (2021) Ángel Alexander Cabrera, Abraham J. Druck, Jason I. Hong, and Adam Perer. 2021. Discovering and Validating AI Errors With Crowdsourced Failure Reports. Proceedings of the ACM on Human-Computer Interaction 5 (Oct. 2021). https://doi.org/10.1145/3479569
- Cabrera et al. (2019) Angel Alexander Cabrera, Will Epperson, Fred Hohman, Minsuk Kahng, Jamie Morgenstern, and Duen Horng Chau. 2019. FAIRVIS: Visual Analytics for Discovering Intersectional Bias in Machine Learning. In 2019 IEEE Conference on Visual Analytics Science and Technology (VAST). https://doi.org/10.1109/vast47406.2019.8986948
- Cai et al. (2019) Carrie J. Cai, Emily Reif, Narayan Hegde, Jason Hipp, Been Kim, Daniel Smilkov, Martin Wattenberg, Fernanda Viegas, Greg S. Corrado, Martin C. Stumpe, and Michael Terry. 2019. Human-Centered Tools for Coping with Imperfect Algorithms During Medical Decision-Making. In Proceedings of the 2019 CHI Conference on Human Factors in Computing Systems. https://doi.org/10.1145/3290605.3300234
- Callison-Burch (2009) Chris Callison-Burch. 2009. Fast, Cheap, and Creative: Evaluating Translation Quality Using Amazon’s Mechanical Turk. In Proceedings of the 2009 Conference on Empirical Methods in Natural Language Processing. Association for Computational Linguistics, Singapore, 286–295. https://aclanthology.org/D09-1030
- Callison-Burch et al. (2007) Chris Callison-Burch, Cameron Fordyce, Philipp Koehn, Christof Monz, and Josh Schroeder. 2007. (Meta-) Evaluation of Machine Translation. In Proceedings of the Second Workshop on Statistical Machine Translation. Association for Computational Linguistics, Prague, Czech Republic, 136–158. https://aclanthology.org/W07-0718
- Callison-Burch et al. (2006) Chris Callison-Burch, Miles Osborne, and Philipp Koehn. 2006. Re-Evaluating the Role of Bleu in Machine Translation Research. In 11th Conference of the European Chapter of the Association for Computational Linguistics.
- Choshen and Abend (2019) Leshem Choshen and Omri Abend. 2019. Automatically Extracting Challenge Sets for Non-Local Phenomena in Neural Machine Translation. In CoNLL. https://doi.org/10.18653/v1/k19-1028
- Chung et al. (2020) Yeounoh Chung, Tim Kraska, Neoklis Polyzotis, Ki Hyun Tae, and Steven Euijong Whang. 2020. Automated Data Slicing for Model Validation: A Big Data - AI Integration Approach. IEEE Transactions on Knowledge and Data Engineering 32, 12 (2020), 2284–2296. https://doi.org/10.1109/TKDE.2019.2916074
- Cockburn et al. (2009) Andy Cockburn, Amy Karlson, and Benjamin B. Bederson. 2009. A Review of Overview+Detail, Zooming, and Focus+Context Interfaces. ACM Comput. Surv. 41 (Jan. 2009). https://doi.org/10.1145/1456650.1456652
- Coenen and Pearce (2019) Andy Coenen and Adam Pearce. 2019. Understanding UMAP. https://pair-code.github.io/understanding-umap/
- Das et al. (2019) Prithwijit Das, Anna Kuznetsova, Meng’ou Zhu, and Ruth Milanaik. 2019. Dangers of Machine Translation: The Need for Professionally Translated Anticipatory Guidance Resources for Limited English Proficiency Caregivers. Clinical Pediatrics (Phila) 58 (Feb. 2019).
- de Vries et al. (2019) Terrance de Vries, Ishan Misra, Changhan Wang, and Laurens van der Maaten. 2019. Does Object Recognition Work for Everyone?. In Proceedings of the IEEE/CVF Conference on Computer Vision and Pattern Recognition (CVPR) Workshops.
- d’Eon et al. (2022) Greg d’Eon, Jason d’Eon, James R Wright, and Kevin Leyton-Brown. 2022. The Spotlight: A General Method for Discovering Systematic Errors in Deep Learning Models. In 2022 ACM Conference on Fairness, Accountability, and Transparency. https://doi.org/10.1145/3531146.3533240
- DeVos et al. (2022) Alicia DeVos, Aditi Dhabalia, Hong Shen, Kenneth Holstein, and Motahhare Eslami. 2022. Toward User-Driven Algorithm Auditing: Investigating Users’ Strategies for Uncovering Harmful Algorithmic Behavior. In Proceedings of the 2022 CHI Conference on Human Factors in Computing Systems (CHI ’22). Article 626. https://doi.org/10.1145/3491102.3517441
- Dudík et al. (2020) Miro Dudík, Sarah Bird, Hanna Wallach, and Kathleen Walker. 2020. Fairlearn: A Toolkit for Assessing and Improving Fairness in AI. (May 2020).
- Farinha et al. (2022) Ana C. Farinha, M. Amin Farajian, Patrick Fernandes José Souza João Alves António Lopes, Helena Moniz, and André Martins. 2022. WMT22 Chat Task. https://wmt-chat-task.github.io/
- Freitag et al. (2021) Markus Freitag, George Foster, David Grangier, Viresh Ratnakar, Qijun Tan, and Wolfgang Macherey. 2021. Experts, Errors, and Context: A Large-Scale Study of Human Evaluation for Machine Translation. Transactions of the Association for Computational Linguistics 9 (Dec. 2021). https://doi.org/10.1162/tacl_a_00437
- Gardner et al. (2020) Matt Gardner, Yoav Artzi, Victoria Basmov, Jonathan Berant, Ben Bogin, Sihao Chen, Pradeep Dasigi, Dheeru Dua, Yanai Elazar, Ananth Gottumukkala, Nitish Gupta, Hannaneh Hajishirzi, Gabriel Ilharco, Daniel Khashabi, Kevin Lin, Jiangming Liu, Nelson F. Liu, Phoebe Mulcaire, Qiang Ning, Sameer Singh, Noah A. Smith, Sanjay Subramanian, Reut Tsarfaty, Eric Wallace, Ally Zhang, and Ben Zhou. 2020. Evaluating Models’ Local Decision Boundaries via Contrast Sets. In Findings of the Association for Computational Linguistics: EMNLP 2020. https://doi.org/10.18653/v1/2020.findings-emnlp.117
- Garg et al. (2021) Satvik Garg, Pradyumn Pundir, Geetanjali Rathee, P.K. Gupta, Somya Garg, and Saransh Ahlawat. 2021. On Continuous Integration / Continuous Delivery for Automated Deployment of Machine Learning Models Using MLOps. In 2021 IEEE Fourth International Conference on Artificial Intelligence and Knowledge Engineering (AIKE). https://doi.org/10.1109/aike52691.2021.00010
- Geva et al. (2019) Mor Geva, Yoav Goldberg, and Jonathan Berant. 2019. Are We Modeling the Task or the Annotator? An Investigation of Annotator Bias in Natural Language Understanding Datasets. In EMNLP-IJCNLP. https://doi.org/10.18653/v1/d19-1107
- Grootendorst (2022) Maarten Grootendorst. 2022. BERTopic: Neural Topic Modeling with a Class-Based TF-IDF Procedure. arXiv preprint arXiv:2203.05794 (2022).
- Han (2018) Lifeng Han. 2018. Machine Translation Evaluation Resources and Methods: A Survey. arxiv:1605.04515 (Sept. 2018).
- Heger et al. (2022) Amy K. Heger, Liz B. Marquis, Mihaela Vorvoreanu, Hanna Wallach, and Jennifer Wortman Vaughan. 2022. Understanding Machine Learning Practitioners’ Data Documentation Perceptions, Needs, Challenges, and Desiderata. arxiv:2206.02923 (Aug. 2022).
- Helcl and Libovický (2017) Jindřich Helcl and Jindřich Libovický. 2017. Neural Monkey: An Open-Source Tool for Sequence Learning. The Prague Bulletin of Mathematical Linguistics (2017). https://doi.org/10.1515/pralin-2017-0001
- Hohman et al. (2019) Fred Hohman, Minsuk Kahng, Robert Pienta, and Duen Horng Chau. 2019. Visual Analytics in Deep Learning: An Interrogative Survey for the Next Frontiers. IEEE Transactions on Visualization and Computer Graphics 25 (Aug. 2019). https://doi.org/10.1109/tvcg.2018.2843369
- Holstein et al. (2019) Kenneth Holstein, Jennifer Wortman Vaughan, Hal Daumé III, Miro Dudik, and Hanna Wallach. 2019. Improving Fairness in Machine Learning Systems: What Do Industry Practitioners Need?. In Proceedings of the 2019 CHI Conference on Human Factors in Computing Systems. https://doi.org/10.1145/3290605.3300830
- Hooker et al. (2020) Sara Hooker, Nyalleng Moorosi, Gregory Clark, Samy Bengio, and Emily Denton. 2020. Characterising Bias in Compressed Models. arxiv:2010.03058 (Dec. 2020).
- Hoover et al. (2020) Benjamin Hoover, Hendrik Strobelt, and Sebastian Gehrmann. 2020. exBERT: A Visual Analysis Tool to Explore Learned Representations in Transformer Models. In Proceedings of the 58th Annual Meeting of the Association for Computational Linguistics: System Demonstrations. https://doi.org/10.18653/v1/2020.acl-demos.22
- Hopkins et al. (2023) Aspen Hopkins, Fred Hohman, Luca Zappella, Xavier Suau Cuadros, and Dominik Moritz. 2023. Designing data: Proactive data collection and iteration for machine learning. arXiv preprint arXiv:2301.10319 (2023).
- Huyen (2022) Chip Huyen. 2022. Designing Machine Learning Systems: An Iterative Process for Production-Ready Applications (first edition ed.).
- Ipeirotis et al. (2010) Panagiotis G. Ipeirotis, Foster Provost, and Jing Wang. 2010. Quality Management on Amazon Mechanical Turk. In Proceedings of the ACM SIGKDD Workshop on Human Computation - HCOMP ’10. https://doi.org/10.1145/1837885.1837906
- Isabelle et al. (2017) Pierre Isabelle, Colin Cherry, and George Foster. 2017. A Challenge Set Approach to Evaluating Machine Translation. In Proceedings of the 2017 Conference on Empirical Methods in Natural Language Processing. https://doi.org/10.18653/v1/d17-1263
- Johnson et al. (2017) Melvin Johnson, Mike Schuster, Quoc V. Le, Maxim Krikun, Yonghui Wu, Zhifeng Chen, Nikhil Thorat, Fernanda Viégas, Martin Wattenberg, Greg Corrado, Macduff Hughes, and Jeffrey Dean. 2017. Google’s Multilingual Neural Machine Translation System: Enabling Zero-Shot Translation. Transactions of the Association for Computational Linguistics (2017), 339–351. https://doi.org/10.1162/tacl_a_00065
- Joshi et al. (2022) Aparna R Joshi, Xavier Suau Cuadros, Nivedha Sivakumar, Luca Zappella, and Nicholas Apostoloff. 2022. Fair SA: Sensitivity Analysis for Fairness in Face Recognition. In Algorithmic Fairness through the Lens of Causality and Robustness Workshop. PMLR.
- Khoong et al. (2019) Elaine C Khoong, Eric Steinbrook, Cortlyn Brown, and Alicia Fernandez. 2019. Assessing the Use of Google Translate for Spanish and Chinese Translations of Emergency Department Discharge Instructions. JAMA internal medicine 179 (2019). https://doi.org/10.1001/jamainternmed.2018.7653
- Kiela et al. (2021) Douwe Kiela, Max Bartolo, Yixin Nie, Divyansh Kaushik, Atticus Geiger, Zhengxuan Wu, Bertie Vidgen, Grusha Prasad, Amanpreet Singh, Pratik Ringshia, Zhiyi Ma, Tristan Thrush, Sebastian Riedel, Zeerak Waseem, Pontus Stenetorp, Robin Jia, Mohit Bansal, Christopher Potts, and Adina Williams. 2021. Dynabench: Rethinking Benchmarking in NLP. In Proceedings of the 2021 Conference of the North American Chapter of the Association for Computational Linguistics: Human Language Technologies. https://doi.org/10.18653/v1/2021.naacl-main.324
- King and Maeggard (1998) Margaret King and Bente Maeggard. 1998. Issues in Natural Language Systems Evaluation.. In LREC.
- Kit and Wong (2008) Chunyu Kit and Tak Ming Wong. 2008. Comparative Evaluation of Online Machine Translation Systems with Legal Texts. Law Library Journal 100 (2008).
- Klejch et al. (2015) Ondrej Klejch, Eleftherios Avramidis, Aljoscha Burchardt, and Martin Popel. 2015. MT-ComparEval: Graphical Evaluation Interface for Machine Translation Development. Prague Bull. Math. Linguistics 104 (2015). https://doi.org/10.1515/pralin-2015-0014
- Koehn (2007) Philipp Koehn. 09 10-14 2007. EuroMatrix – Machine Translation for All European Languages. In Proceedings of Machine Translation Summit XI: Invited Papers.
- Koenecke et al. (2020) Allison Koenecke, Andrew Nam, Emily Lake, Joe Nudell, Minnie Quartey, Zion Mengesha, Connor Toups, John R. Rickford, Dan Jurafsky, and Sharad Goel. 2020. Racial Disparities in Automated Speech Recognition. Proceedings of the National Academy of Sciences 117 (April 2020). https://doi.org/10.1073/pnas.1915768117
- Koh et al. (2021) Pang Wei Koh, Shiori Sagawa, Henrik Marklund, Sang Michael Xie, Marvin Zhang, Akshay Balsubramani, Weihua Hu, Michihiro Yasunaga, Richard Lanas Phillips, Irena Gao, Tony Lee, Etienne David, Ian Stavness, Wei Guo, Berton Earnshaw, Imran Haque, Sara M Beery, Jure Leskovec, Anshul Kundaje, Emma Pierson, Sergey Levine, Chelsea Finn, and Percy Liang. 2021. WILDS: A Benchmark of in-the-Wild Distribution Shifts. In ICML (Proceedings of Machine Learning Research, Vol. 139).
- Krishnakumar et al. (2021) Arvindkumar Krishnakumar, Viraj Prabhu, Sruthi Sudhakar, and Judy Hoffman. 2021. UDIS: Unsupervised Discovery of Bias in Deep Visual Recognition Models. arxiv:2110.15499 (Oct. 2021).
- Lee et al. (2017) Jaesong Lee, Joong-Hwi Shin, and Jun-Seok Kim. 2017. Interactive Visualization and Manipulation of Attention-based Neural Machine Translation. In Proceedings of the 2017 Conference on Empirical Methods in Natural Language Processing: System Demonstrations.
- Lee et al. (2022) Seongmin Lee, Zijie J. Wang, Judy Hoffman, and Duen Horng Chau. 2022. VisCUIT: Visual Auditor for Bias in CNN Image Classifier. In Proceedings of the IEEE/CVF Conference on Computer Vision and Pattern Recognition (CVPR).
- Li et al. (2022) Zhen Li, Xiting Wang, Weikai Yang, Jing Wu, Zhengyan Zhang, Zhiyuan Liu, Maosong Sun, Hui Zhang, and Shixia Liu. 2022. A Unified Understanding of Deep NLP Models for Text Classification. IEEE Transactions on Visualization and Computer Graphics (2022). https://doi.org/10.1109/tvcg.2022.3184186
- Liebling et al. (2020) Daniel J. Liebling, Michal Lahav, Abigail Evans, Aaron Donsbach, Jess Holbrook, Boris Smus, and Lindsey Boran. 2020. Unmet Needs and Opportunities for Mobile Translation AI. In Proceedings of the 2020 CHI Conference on Human Factors in Computing Systems (Honolulu, HI, USA) (CHI ’20). Association for Computing Machinery, New York, NY, USA, 1–13. https://doi.org/10.1145/3313831.3376261
- Lin and Och (2004) Chin-Yew Lin and Franz Josef Och. 2004. ORANGE: A Method for Evaluating Automatic Evaluation Metrics for Machine Translation. In COLING 2004: Proceedings of the 20th International Conference on Computational Linguistics. https://doi.org/10.3115/1220355.1220427
- Liu et al. (2018) Shixia Liu, Jiannan Xiao, Junlin Liu, Xiting Wang, Jing Wu, and Jun Zhu. 2018. Visual Diagnosis of Tree Boosting Methods. IEEE TVCG 24 (Jan. 2018). https://doi.org/10.1109/tvcg.2017.2744378
- Loper and Bird (2002) Edward Loper and Steven Bird. 2002. NLTK: The Natural Language Toolkit. In Proceedings of the ACL-02 Workshop on Effective Tools and Methodologies for Teaching Natural Language Processing and Computational Linguistics -, Vol. 1. https://doi.org/10.3115/1219044.1219075
- Lovering and Pavlick (2022) Charles Lovering and Ellie Pavlick. 2022. Unit Testing for Concepts in Neural Networks. arxiv:2208.10244 (July 2022).
- Lundberg and Lee (2017) Scott M. Lundberg and Su-In Lee. 2017. A Unified Approach to Interpreting Model Predictions. In Proceedings of the 31st International Conference on Neural Information Processing Systems (NIPS’17).
- M and M.N (2015) Hossin M and Sulaiman M.N. 2015. A Review on Evaluation Metrics for Data Classification Evaluations. International Journal of Data Mining & Knowledge Management Process 5 (March 2015). https://doi.org/10.5121/ijdkp.2015.5201
- Macketanz et al. (2018) Vivien Macketanz, Eleftherios Avramidis, Aljoscha Burchardt, and Hans Uszkoreit. 2018. Fine-Grained Evaluation of German-English Machine Translation Based on a Test Suite. In Proceedings of the Third Conference on Machine Translation: Shared Task Papers. https://doi.org/10.18653/v1/w18-6436
- Madnani (2011) Nitin Madnani. 2011. iBLEU: Interactively Debugging and Scoring Statistical Machine Translation Systems. In 2011 IEEE Fifth International Conference on Semantic Computing. https://doi.org/10.1109/icsc.2011.36
- Mathur et al. (2020) Nitika Mathur, Timothy Baldwin, and Trevor Cohn. 2020. Tangled up in BLEU: Reevaluating the Evaluation of Automatic Machine Translation Evaluation Metrics. In Proceedings of the 58th Annual Meeting of the Association for Computational Linguistics. https://doi.org/10.18653/v1/2020.acl-main.448
- McInnes et al. (2018) L. McInnes, J. Healy, and J. Melville. 2018. UMAP: Uniform Manifold Approximation and Projection for Dimension Reduction. ArXiv e-prints (Feb. 2018).
- Merriam and Associates (2002) Sharan B Merriam and Associates. 2002. Introduction to qualitative research. In Qualitative research in practice: Examples for discussion and analysis. Jossey-Bass, Hoboken, NJ, USA, 1–17.
- Moré and Climent (2014) Joaquim Moré and Salvador Climent. 2014. Machine Translationness: Machine-likeness in Machine Translation Evaluation. In Proceedings of the Ninth International Conference on Language Resources and Evaluation (LREC’14).
- Munechika et al. (2022) David Munechika, Zijie J. Wang, Jack Reidy, Josh Rubin, Krishna Gade, Krishnaram Kenthapadi, and Duen Horng Chau. 2022. Visual Auditor: Interactive Visualization for Detection and Summarization of Model Biases. In 2022 IEEE Visualization Conference (VIS).
- Munz et al. (2022) Tanja Munz, Dirk Väth, Paul Kuznecov, Ngoc Thang Vu, and Daniel Weiskopf. 2022. Visualization-Based Improvement of Neural Machine Translation. Computers & Graphics 103 (April 2022). https://doi.org/10.1016/j.cag.2021.12.003
- Naik et al. (2018) Aakanksha Naik, Abhilasha Ravichander, Norman Sadeh, Carolyn Rose, and Graham Neubig. 2018. Stress Test Evaluation for Natural Language Inference. In The 27th International Conference on Computational Linguistics (COLING).
- Neubig et al. (2019) Graham Neubig, Zi-Yi Dou, Junjie Hu, Paul Michel, Danish Pruthi, and Xinyi Wang. 2019. Compare-Mt: A Tool for Holistic Comparison of Language Generation Systems. In Proceedings of the 2019 Conference of the North. https://doi.org/10.18653/v1/n19-4007
- Obermeyer et al. (2019) Ziad Obermeyer, Brian Powers, Christine Vogeli, and Sendhil Mullainathan. 2019. Dissecting Racial Bias in an Algorithm Used to Manage the Health of Populations. Science 366 (Oct. 2019). https://doi.org/10.1126/science.aax2342
- Ono et al. (2021) Jorge Piazentin Ono, Sonia Castelo, Roque Lopez, Enrico Bertini, Juliana Freire, and Claudio Silva. 2021. PipelineProfiler: A Visual Analytics Tool for the Exploration of AutoML Pipelines. IEEE Transactions on Visualization and Computer Graphics 27 (Feb. 2021).
- Papineni et al. (2002) Kishore Papineni, Salim Roukos, Todd Ward, and Wei-Jing Zhu. 2002. Bleu: A Method for Automatic Evaluation of Machine Translation. In Proceedings of the 40th Annual Meeting of the Association for Computational Linguistics.
- Park et al. (2022) Sebeom Park, Soohyun Lee, Youngtaek Kim, Hyeon Jeon, Seokweon Jung, Jinwook Bok, and Jinwook Seo. 2022. VANT: A Visual Analytics System for Refining Parallel Corpora in Neural Machine Translation. In 2022 IEEE 15th Pacific Visualization Symposium (PacificVis). https://doi.org/10.1109/pacificvis53943.2022.00029
- Patel et al. (2008) Kayur Patel, James Fogarty, James A. Landay, and Beverly Harrison. 2008. Investigating Statistical Machine Learning as a Tool for Software Development. In Proceeding of the Twenty-Sixth Annual CHI Conference on Human Factors in Computing Systems - CHI ’08. https://doi.org/10.1145/1357054.1357160
- Pearson (1901) Karl Pearson. 1901. On Lines and Planes of Closest Fit to Systems of Points in Space. The London, Edinburgh, and Dublin Philosophical Magazine and Journal of Science 2 (1901). https://doi.org/10.1080/14786440109462720
- Pedregosa et al. (2011) Fabian Pedregosa, Gaël Varoquaux, Alexandre Gramfort, Vincent Michel, Bertrand Thirion, Olivier Grisel, Mathieu Blondel, Peter Prettenhofer, Ron Weiss, Vincent Dubourg, et al. 2011. Scikit-Learn: Machine Learning in Python. the Journal of machine Learning research 12 (2011).
- Polyzotis et al. (2019) Neoklis Polyzotis, Martin Zinkevich, Sudip Roy, Eric Breck, and Steven Whang. 2019. Data Validation for Machine Learning. In Proceedings of Machine Learning and Systems, Vol. 1.
- Popović (2015) Maja Popović. 2015. chrF: Character n-Gram F-score for Automatic MT Evaluation. In Proceedings of the Tenth Workshop on Statistical Machine Translation. https://doi.org/10.18653/v1/w15-3049
- Popović (2021) Maja Popović. 2021. Agree to Disagree: Analysis of Inter-Annotator Disagreements in Human Evaluation of Machine Translation Output. In Proceedings of the 25th Conference on Computational Natural Language Learning. https://doi.org/10.18653/v1/2021.conll-1.18
- Popović and Castilho (2019) Maja Popović and Sheila Castilho. 2019. Challenge Test Sets for MT Evaluation. In Proceedings of Machine Translation Summit XVII: Tutorial Abstracts.
- Post (2018) Matt Post. 2018. A Call for Clarity in Reporting BLEU Scores. In Proceedings of the Third Conference on Machine Translation: Research Papers. https://doi.org/10.18653/v1/w18-6319
- Prabhu et al. (2021) Vinay Prabhu, Ryan Teehan, Eniko Srivastava, and Abdul Nimeri. 2021. Did They Direct the Violence or Admonish It? A Cautionary Tale on Contronomy, Androcentrism and Back-Translation Foibles. In AfricaNLP Workshop at EACL.
- Radford et al. (2021) Alec Radford, Jong Wook Kim, Chris Hallacy, Aditya Ramesh, Gabriel Goh, Sandhini Agarwal, Girish Sastry, Amanda Askell, Pamela Mishkin, Jack Clark, Gretchen Krueger, and Ilya Sutskever. 2021. Learning Transferable Visual Models from Natural Language Supervision. In Proceedings of the 38th International Conference on Machine Learning (Proceedings of Machine Learning Research, Vol. 139). https://proceedings.mlr.press/v139/radford21a.html
- Raganato et al. (2019) Alessandro Raganato, Yves Scherrer, and Jörg Tiedemann. 2019. The MuCoW Test Suite at WMT 2019: Automatically Harvested Multilingual Contrastive Word Sense Disambiguation Test Sets for Machine Translation. In Proceedings of the Fourth Conference on Machine Translation (Volume 2: Shared Task Papers, Day 1). https://doi.org/10.18653/v1/w19-5354
- Raji et al. (2020) Inioluwa Deborah Raji, Timnit Gebru, Margaret Mitchell, Joy Buolamwini, Joonseok Lee, and Emily Denton. 2020. Saving Face: Investigating the Ethical Concerns of Facial Recognition Auditing. In Proceedings of the AAAI/ACM Conference on AI, Ethics, and Society (AIES ’20). https://doi.org/10.1145/3375627.3375820
- Rajpurkar et al. (2018) Pranav Rajpurkar, Robin Jia, and Percy Liang. 2018. Know What You Don’t Know: Unanswerable Questions for SQuAD. In Proceedings of the 56th Annual Meeting of the Association for Computational Linguistics (Volume 2: Short Papers). https://doi.org/10.18653/v1/p18-2124
- Rebuffi et al. (2021) Sylvestre-Alvise Rebuffi, Sven Gowal, Dan Andrei Calian, Florian Stimberg, Olivia Wiles, and Timothy A Mann. 2021. Data Augmentation Can Improve Robustness. In Advances in Neural Information Processing Systems, Vol. 34.
- Recht et al. (2019) Benjamin Recht, Rebecca Roelofs, Ludwig Schmidt, and Vaishaal Shankar. 2019. Do ImageNet Classifiers Generalize to ImageNet?. In Proceedings of the 36th International Conference on Machine Learning (Proceedings of Machine Learning Research, Vol. 97).
- Reimers and Gurevych (2019) Nils Reimers and Iryna Gurevych. 2019. Sentence-BERT: Sentence Embeddings Using Siamese BERT-Networks. In EMNLP. https://doi.org/10.18653/v1/d19-1410
- Reiter (2018) Ehud Reiter. 2018. A Structured Review of the Validity of BLEU. Computational Linguistics 44 (Sept. 2018). https://doi.org/10.1162/coli_a_00322
- Ribeiro and Lundberg (2022) Marco Tulio Ribeiro and Scott Lundberg. 2022. Adaptive Testing and Debugging of NLP Models. In Proceedings of the 60th Annual Meeting of the Association for Computational Linguistics (Volume 1: Long Papers). https://doi.org/10.18653/v1/2022.acl-long.230
- Ribeiro et al. (2016) Marco Tulio Ribeiro, Sameer Singh, and Carlos Guestrin. 2016. ”Why Should I Trust You?”: Explaining the Predictions of Any Classifier. In Proceedings of the 22nd ACM SIGKDD International Conference on Knowledge Discovery and Data Mining. https://doi.org/10.1145/2939672.2939778
- Ribeiro et al. (2020) Marco Tulio Ribeiro, Tongshuang Wu, Carlos Guestrin, and Sameer Singh. 2020. Beyond Accuracy: Behavioral Testing of NLP Models with CheckList. In Proceedings of the 58th Annual Meeting of the Association for Computational Linguistics. https://doi.org/10.18653/v1/2020.acl-main.442
- Rikters et al. (2017) Matīss Rikters, Mark Fishel, and Ondřej Bojar. 2017. Visualizing Neural Machine Translation Attention and Confidence. The Prague Bulletin of Mathematical Linguistics 109 (Oct. 2017). https://doi.org/10.1515/pralin-2017-0037
- Röttger et al. (2021) Paul Röttger, Bertie Vidgen, Dong Nguyen, Zeerak Waseem, Helen Margetts, and Janet Pierrehumbert. 2021. HateCheck: Functional Tests for Hate Speech Detection Models. In Proceedings of the 59th Annual Meeting of the Association for Computational Linguistics and the 11th International Joint Conference on Natural Language Processing (Volume 1: Long Papers). https://doi.org/10.18653/v1/2021.acl-long.4
- Rudinger et al. (2018) Rachel Rudinger, Jason Naradowsky, Brian Leonard, and Benjamin Van Durme. 2018. Gender Bias in Coreference Resolution. In Proceedings of the 2018 Conference of the North American Chapter of the Association for Computational Linguistics: Human Language Technologies, Volume 2 (Short Papers). https://doi.org/10.18653/v1/n18-2002
- Sai et al. (2022) Ananya B. Sai, Akash Kumar Mohankumar, and Mitesh M. Khapra. 2022. A Survey of Evaluation Metrics Used for NLG Systems. Acm Computing Surveys 55 (Jan. 2022). https://doi.org/10.1145/3485766
- Saldías Fuentes et al. (2022) Belén Saldías Fuentes, George Foster, Markus Freitag, and Qijun Tan. 2022. Toward More Effective Human Evaluation for Machine Translation. In Proceedings of the 2nd Workshop on Human Evaluation of NLP Systems (HumEval). https://doi.org/10.18653/v1/2022.humeval-1.7
- Schelter et al. (2019) Sebastian Schelter, Felix Biessmann, Dustin Lange, Tammo Rukat, Phillipp Schmidt, Stephan Seufert, Pierre Brunelle, and Andrey Taptunov. 2019. Unit Testing Data with Deequ. In Proceedings of the 2019 International Conference on Management of Data (SIGMOD ’19). https://doi.org/10.1145/3299869.3320210
- Scott (2015) David W. Scott. 2015. Multivariate Density Estimation: Theory, Practice, and Visualization. https://doi.org/10.1002/9781118575574
- Sculley (2022) D. Sculley. 2022. A Data-Centric View of Technical Debt in AI. https://datacentricai.org/data-in-deployment/
- Sculley et al. (2015) D. Sculley, Gary Holt, Daniel Golovin, Eugene Davydov, Todd Phillips, Dietmar Ebner, Vinay Chaudhary, Michael Young, Jean-François Crespo, and Dan Dennison. 2015. Hidden Technical Debt in Machine Learning Systems. In Advances in Neural Information Processing Systems, Vol. 28.
- Shen et al. (2021) Hong Shen, Alicia DeVos, Motahhare Eslami, and Kenneth Holstein. 2021. Everyday Algorithm Auditing: Understanding the Power of Everyday Users in Surfacing Harmful Algorithmic Behaviors. Proc. ACM Hum.-Comput. Interact. 5, Article 433 (Oct. 2021). https://doi.org/10.1145/3479577
- Silverman (2018) Bernard W Silverman. 2018. Density Estimation for Statistics and Data Analysis. https://doi.org/10.1201/9781315140919
- Soares et al. (2018) Felipe Soares, Viviane Moreira, and Karin Becker. 2018. A Large Parallel Corpus of Full-Text Scientific Articles. In Proceedings of the Eleventh International Conference on Language Resources and Evaluation (LREC-2018) (Miyazaki, Japan). European Language Resource Association. http://aclweb.org/anthology/L18-1546
- Spinner et al. (2019) Thilo Spinner, Udo Schlegel, Hanna Schafer, and Mennatallah El-Assady. 2019. explAIner: A Visual Analytics Framework for Interactive and Explainable Machine Learning. IEEE Transactions on Visualization and Computer Graphics (2019). https://doi.org/10.1109/tvcg.2019.2934629
- Stanovsky et al. (2019) Gabriel Stanovsky, Noah A. Smith, and Luke Zettlemoyer. 2019. Evaluating Gender Bias in Machine Translation. In ACL. https://doi.org/10.18653/v1/p19-1164
- Steele and Specia (2018) David Steele and Lucia Specia. 2018. Vis-Eval Metric Viewer: A Visualisation Tool for Inspecting and Evaluating Metric Scores of Machine Translation Output. In Proceedings of the 2018 Conference of the North American Chapter of the Association for Computational Linguistics: Demonstrations.
- Stent et al. (2005) Amanda Stent, Matthew Marge, and Mohit Singhai. 2005. Evaluating Evaluation Methods for Generation in the Presence of Variation. In Proceedings of the 6th International Conference on Computational Linguistics and Intelligent Text Processing (CICLing’05). https://doi.org/10.1007/978-3-540-30586-6_38
- Strobelt et al. (2018) Hendrik Strobelt, Sebastian Gehrmann, Michael Behrisch, Adam Perer, Hanspeter Pfister, and Alexander M Rush. 2018. S Eq 2s Eq-v Is: A Visual Debugging Tool for Sequence-to-Sequence Models. IEEE transactions on visualization and computer graphics 25 (2018). https://doi.org/10.1109/tvcg.2018.2865044
- Taira et al. (2021) Breena R Taira, Vanessa Kreger, Aristides Orue, and Lisa C Diamond. 2021. A Pragmatic Assessment of Google Translate for Emergency Department Instructions. Journal of Geneneral Internal Medicine 36 (Nov. 2021). https://doi.org/10.1007/s11606-021-06666-z
- Tiedemann (2020) Jörg Tiedemann. 2020. The Tatoeba Translation Challenge – Realistic Data Sets for Low Resource and Multilingual MT. In Proceedings of the Fifth Conference on Machine Translation. Association for Computational Linguistics, Online, 1174–1182. https://www.aclweb.org/anthology/2020.wmt-1.139
- Tiedemann and Thottingal (2020) Jörg Tiedemann and Santhosh Thottingal. 2020. OPUS-MT — Building Open Translation Services for the World. In Proceedings of the 22nd Annual Conferenec of the European Association for Machine Translation (EAMT).
- Troles and Schmid (2021) Jonas-Dario Troles and Ute Schmid. 2021. Extending Challenge Sets to Uncover Gender Bias in Machine Translation: Impact of Stereotypical Verbs and Adjectives. In Proceedings of the Sixth Conference on Machine Translation.
- Tufte (2013) Edward R. Tufte. 2013. The Visual Display of Quantitative Information (2nd ed., 8th print ed.).
- van der Maaten and Hinton (2008) Laurens van der Maaten and Geoffrey Hinton. 2008. Visualizing Data Using T-SNE. Journal of Machine Learning Research 9 (2008). http://jmlr.org/papers/v9/vandermaaten08a.html
- Vanmassenhove and Monti (2021) Eva Vanmassenhove and Johanna Monti. 2021. gENder-IT: An Annotated English-Italian Parallel Challenge Set for Cross-Linguistic Natural Gender Phenomena. In Proceedings of the 3rd Workshop on Gender Bias in Natural Language Processing. https://doi.org/10.18653/v1/2021.gebnlp-1.1
- Vermeulen et al. (2021) Marc Vermeulen, Kate Smith, Katherine Eremin, Georgina Rayner, and Marc Walton. 2021. Application of Uniform Manifold Approximation and Projection (UMAP) in Spectral Imaging of Artworks. Spectrochimica Acta Part A: Molecular and Biomolecular Spectroscopy 252 (2021). https://doi.org/10.1016/j.saa.2021.119547
- Vilar et al. (2006) David Vilar, Jia Xu, Luis Fernando D’Haro, and Hermann Ney. 2006. Error Analysis of Statistical Machine Translation Output. In Proceedings of the Fifth International Conference on Language Resources and Evaluation (LREC’06).
- Wang et al. (2019) Changhan Wang, Anirudh Jain, Danlu Chen, and Jiatao Gu. 2019. VizSeq: A Visual Analysis Toolkit for Text Generation Tasks. In Proceedings of the 2019 Conference on Empirical Methods in Natural Language Processing and the 9th International Joint Conference on Natural Language Processing (EMNLP-IJCNLP): System Demonstrations. https://doi.org/10.18653/v1/d19-3043
- Wexler et al. (2019) James Wexler, Mahima Pushkarna, Tolga Bolukbasi, Martin Wattenberg, Fernanda Viegas, and Jimbo Wilson. 2019. The What-If Tool: Interactive Probing of Machine Learning Models. IEEE TVCG 26 (2019). https://doi.org/10.1109/tvcg.2019.2934619
- Wu et al. (2019) Tongshuang Wu, Marco Tulio Ribeiro, Jeffrey Heer, and Daniel Weld. 2019. Errudite: Scalable, Reproducible, and Testable Error Analysis. In Proceedings of the 57th Annual Meeting of the Association for Computational Linguistics. https://doi.org/10.18653/v1/p19-1073
- Wu et al. (2021) Tongshuang Wu, Marco Tulio Ribeiro, Jeffrey Heer, and Daniel Weld. 2021. Polyjuice: Generating Counterfactuals for Explaining, Evaluating, and Improving Models. In Proceedings of the 59th Annual Meeting of the Association for Computational Linguistics and the 11th International Joint Conference on Natural Language Processing (Volume 1: Long Papers). https://doi.org/10.18653/v1/2021.acl-long.523
- Yates (2006) Sarah Yates. 2006. Scaling the Tower of Babel Fish: An Analysis of the Machine Translation of Legal Information. Law Library Journal 98 (2006).
- Zhang et al. (2022) Xiaoyu Zhang, Jorge Piazentin Ono, Huan Song, Liang Gou, Kwan-Liu Ma, and Liu Ren. 2022. SliceTeller : A Data Slice-Driven Approach for Machine Learning Model Validation. IEEE Transactions on Visualization and Computer Graphics (2022), 1–11. https://doi.org/10.1109/TVCG.2022.3209465
- Zhao et al. (2018) Jieyu Zhao, Tianlu Wang, Mark Yatskar, Vicente Ordonez, and Kai-Wei Chang. 2018. Gender Bias in Coreference Resolution: Evaluation and Debiasing Methods. In Proceedings of the 2018 Conference of the North American Chapter of the Association for Computational Linguistics: Human Language Technologies, Volume 2 (Short Papers). https://doi.org/10.18653/v1/n18-2003