Multiphase Gas Nature in the Sub-parsec Region of the Active Galactic Nuclei I: Dynamical Structures of Dusty and Dust-free Outflow
Abstract
We investigated dusty and dust-free gas dynamics for a radiation-driven sub-parsec-scale outflow in an active galactic nucleus (AGN) associated with a supermassive black hole and bolometric luminosity erg s-1 based on the two-dimensional radiation-hydrodynamic simulations. A radiation-driven “lotus-like” multi-shell outflow is launched from the inner part ( pc) of the geometrically thin disk, and it repeatedly and steadily produces shocks as mass accretion continues through the disk to the center. The shape of the dust sublimation radius is not spherical and depends on the angle () from the disk plane, reflecting the nonspherical radiation field and nonuniform dust-free gas. Moreover, we found that the sublimation radius of – deg varies on a timescale of several years. The “inflow-induced outflow” contributes the obscuration of the nucleus in the sub-parsec region. The column density of the dust-free gas is cm-2 for pc. Gases near the disk plane ( degree) can be the origin of the Compton-thick component, which was suggested by the recent X-ray observations of AGNs. The dusty outflow from the sub-parsec region can be also a source of material for the radiation-driven fountain for a larger scale.
1 Introduction
The current paradigm of the structures of active galactic nuclei (AGNs) is that the broad emission line region (BLR) is surrounded by a geometrically thick dusty material, so-called “dusty torus” (Antonucci 1993; Hönig 2019; see also the review Netzer 2015). Thanks to the recent progress in radio and infrared interferometric techniques, the structures of molecular tori and their inner edge regions were partially resolved using the Very Large Telescope Interferometer (VLTI: Gravity Collaboration et al. 2020; Isbell et al. 2022, and see also Hönig et al. 2018) and the Atacama Large Millimeter/submillimeter Array (ALMA: Izumi et al. 2018; García-Burillo et al. 2019, 2021; Impellizzeri et al. 2019; Izumi et al. 2023, and see also Combes 2021). In this paradigm, the inner edge of the dusty tori is determined by the sublimation of the dust grains illuminated by the AGN radiation (Barvainis, 1987; Mor & Netzer, 2012). For the dust sublimation temperature (), the sublimation radius is
| (1) |
where denotes the ultraviolet luminosity. The reverberation mapping observations of nearby AGNs suggested that the dust sublimation radius is close to considering the size–luminosity relation (Suganuma et al. 2006; Kishimoto et al. 2007; Koshida et al. 2014). Based on the time variability of the optical and infrared bands used for reverberation measurements, several studies have examined the radial profile of dusty tori (Kishimoto et al., 2011b; Lyu & Rieke, 2021). Time variability is reported to be several years or less (Kishimoto et al., 2011a; Koshida et al., 2014; Minezaki et al., 2019).
However, the structures of the transition regions of dusty and dust-free gases near still are not observationally clear. Davies et al. (2015) suggested that a geometrically thick neutral gas torus coexists with the BLR and bridges the gap with the dusty torus by analyzing the X-ray-selected sample of nearby AGNs. Based on the comparison of the X-ray spectral energy distribution (SED) between hydrodynamic models and observations, Buchner et al. (2021) found that a Compton-thick material is necessary at pc to reproduce the hard X-ray spectrum of the nearby (4.2 Mpc) type-2 Seyfert, the Circinus galaxy. Moreover, this necessary is confirmed by soft X-ray absorption features concerning warm absorbers (Ogawa et al., 2022).
The structure of an inner surface of the dusty torus has been theoretically studied by Kawaguchi & Mori (2010), Kawaguchi & Mori (2011); Hönig & Kishimoto (2011), and Almeyda et al. (2017, 2020) with respect to reverberation mapping based on a simple, static picture. However, dusty and dust-free gases around the AGN may not be static as suggested in torus-scale radiation-hydrodynamic simulations (Dorodnitsyn et al., 2016; Chan & Krolik, 2016; Namekata & Umemura, 2016; Williamson et al., 2019, 2020). Wada (2012, 2015) proposed that the radiation pressure and heating in AGN are essential to drive gas circulation in the central parsec region. The “radiation-driven fountain” model is consistent with the multiwavelength observations of the central parsec to 10 pc of the Circinus galaxy (Wada et al. 2016; Izumi et al. 2018; Wada et al. 2018a, b; Uzuo et al. 2021; Matsumoto et al. 2022; Ogawa et al. 2022; Izumi et al. 2023).
Their hydrodynamical studies have focused on the parsec-scale structure. Therefore, we do not understand the structures and dynamics of dusty and dust-free gases in the transition region, around pc for a supermassive black hole (SMBH) and bolometric luminosity erg s-1 (see, Equation (1)) In this study, we performed two-dimensional (i.e., axisymmetric) radiation-hydrodynamic simulations that spatially resolve the dust sublimation radius to understand the structures and dynamics of the radiation-driven outflow. We focus on the following questions: (1) Where and how is the radiation-driven dusty outflow launched? (2) How do dusty and dust-free gases contribute to column density? (3) What are the realistic shape of the dust sublimation radius and its time variability under the effect of fueling and its feedback in the AGN sub-parsec scale?
This paper is organized as follows. In Section 2, we describe the solving equations and physical models of the dusty gas around the AGN. The numerical method and model setup are described in Section 2.5. We present the results of the radiation-driven dusty outflow for the multiscale propagation of the shell structure (§3.1). We also show the viewing angle dependence of the column density, dust sublimation radius, and time-variable nature of the transition region (§3.2). The relation between the current results and the structures of the torus scale is discussed in Section 4. In Section 5, we summarize our findings
2 Methods
Following the parsec-scale radiation-driven fountain model (Wada, 2012, 2015), we focus on the inner pc - pc region. We solved the dynamics of the gas–dust disk accreting to a central SMBH () under the effect of an anisotropic central radiation field. Herein, we assume an axisymmetric system to achieve high spatial resolution ( pc) (§2.5). We also modified the dust opacity model and the source SED described in §§2.2–2.4.
2.1 basic equations
The basic equations are
| (2) |
| (3) |
| (4) |
where the total energy density is . denotes the specific heat ratio obtained adiabatically, i.e., . denotes the net heating/cooling rate per unit mass. We consider the gravitational force, i.e., , where denotes the gravitational constant and denotes the distance from the center of SMBH with and denotes the unit vector indicating the direction away from the center. The total density () is the sum of gas and dust densities, , and denotes the barycentric velocity, i.e., , where indexes d and g denote dust and gas, respectively.
We assume the kinematic viscosity with parameter as (-disk model; Shakura & Sunyaev 1973). The viscous force in Equation 3 and viscous heating in Equation 4 are described in Ohsuga et al. (2005) as
| (5) |
| (6) |
where denotes the unit vector indicating the azimuthal direction. We assume that the gas supply to the nucleus is achieved using the thin disk, and the viscosity parameter is set to
| (7) |
2.2 Luminosity in AGN radiation sources
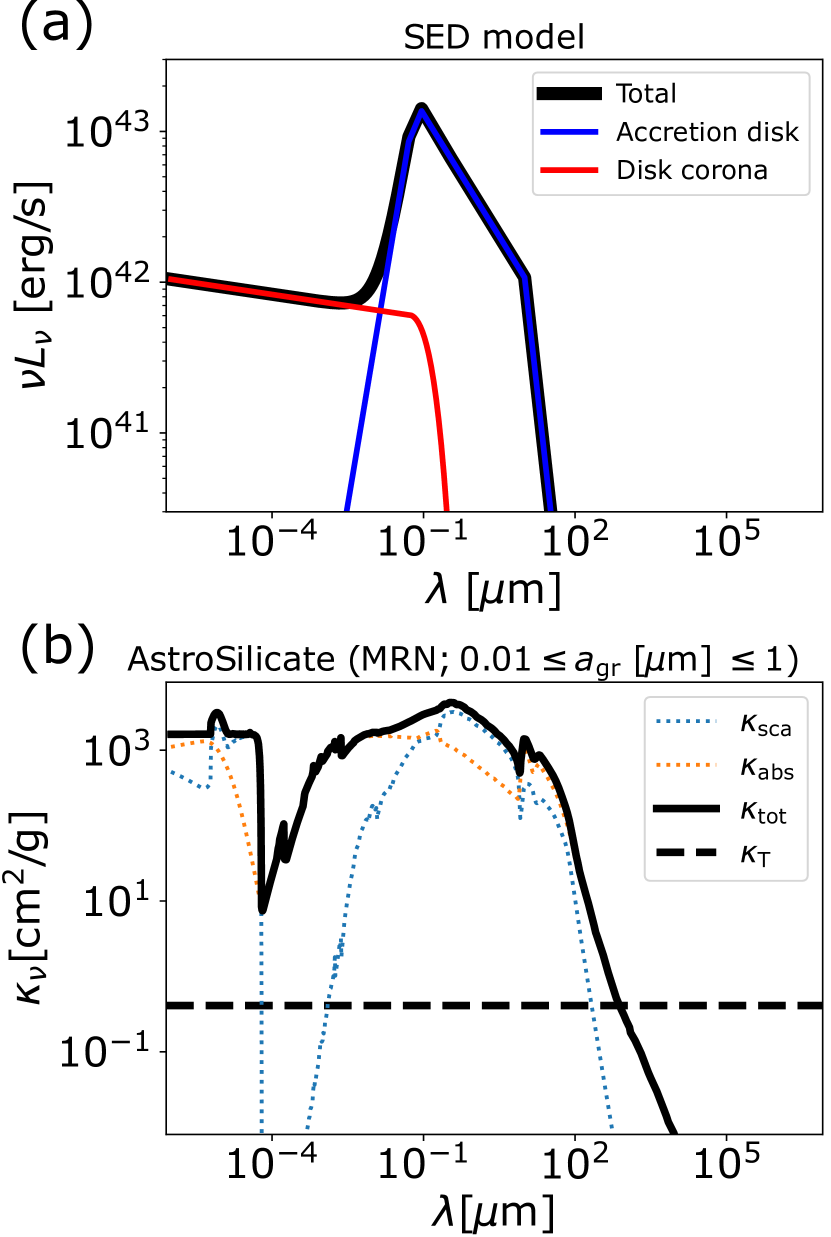
We modeled steady continuum radiation sources assuming the SEDs of accretion disk luminosity () and its corona () around the central SMBH. We assumed that luminosity is proportional to the broken power law with respect to wavelength (Namekata & Umemura 2016), which has the accretion disk component (Schartmann et al., 2005, 2011) corresponding to the standard disk (Shakura & Sunyaev, 1973) and the corona component , where the photon index is (Brightman et al., 2013). We adopted the radiative flux ratio between 2500 Åand 2 keV, i.e., (Liu et al., 2021), and the bolometric luminosity erg s-1, which is integrated over the wavelength, i.e., . Figure 1a. shows the SED used in this study.
2.3 radiation force and radiative cooling/heating
The radiation force in Equation (3) is determined based on the radiation flux or the amount of radiation energy absorbed by the medium in small volumes (see also Section 2.5),
| (8) |
where and . Therefore, the radiation flux is exponentially extinctive with the optical depth ,
| (9) |
and
| (10) |
where the Thomson opacity is explained from electron scattering, i.e., . The radiation flux for the accretion disk is anisotropic given by explained by limb darkening and the change in the projected surface area (Netzer 1987). The angle from the equatorial plane is defined in the range of 0– deg.
We obtain dust opacity based on the weighted average of dust grain sizes .
| (11) |
where the total dust density is defined as
| (12) |
The opacity model for each grain size is based on Astronomical Silicate (Draine, 2003; Draine & Tan, 2003), which provides the optical properties of spherical carbonaceous and amorphous silicate grains, excluding polycyclic aromatic hydrocarbon molecules (PAHs), with the grain density of g cm-3. This model includes absorption () and scattering (). Opacities are considered along the direction of radiation, i.e., for Equations (8) and (11). Here, we assume the size range of to with distribution, , where is (Mathis et al., 1977) and is determined by the dust-to-gas mass ratio of 0.01. The size range follows the assumption of reproducing the observations in Schartmann et al. (2011). The opacities are shown in Figure 1b.
The radiative energy received by dust and gas becomes the work done by the radiation forces () and radiative heating (), as expressed in Equation 4. We consider Coulomb heating for the cold gas and Compton heating and photoionized heating for the warm and hot gas (Wada, 2012). In particular, the radiative heating is determined by evaluating the ionization parameter , where is the Planck constant and the integral range is defined as eV to keV (see, Netzer, 2015). We adopted the cooling model with the metallicity of solar abundance from Meijerink & Spaans (2005) and Wada et al. (2009). We assume the time evolution of chemistry and metallicity is ignored.
2.4 Dust sublimation and sputtering
We consider dust destruction based on the interaction with thermal gas (thermal sputtering) and AGN radiation (sublimation). The time scale of sputtering is estimated by the approximate formula of Tsai & Mathews (1995) (see also, Draine & Salpeter, 1979; Namekata & Umemura, 2016),
| (14) | |||||
We assume that the dusty gas immediately becomes dust-free gas if in a particular grid cell is shorter than the dynamical time scale, yr . Moreover, we consider dust sublimation; dust grains are sublimated when the dust temperature exceeds K. The dust temperature is calculated from the local thermal equilibrium,
| (15) |
The first term denotes the energy gained by the dust from AGN radiation and the second term denotes the energy lost by the blackbody radiation from the dust.
2.5 Simulation setup
We use the public magnetohydrodynamics code CANS+ (Matsumoto et al., 2019) 111https://github.com/chiba-aplab/cansplus with the additional module to evaluate the radiation force and radiative heating/cooling, without the magnetic field. Equations (2)–(4) are solved for the axisymmetric cylindrical coordinate in the - plane. Moreover, we solve Equation (3) for the azimuthal direction as the conservation equation of the angular momentum.
From Equation (8), the radiation force generated owing to the irradiation flux of gas and dust (Equation (9)) is measured by the following approximation: (e.g., Whalen & Norman, 2006; Klassen et al., 2014; Namekata & Umemura, 2016; Chan & Krolik, 2017). This formula means that the total amount of radiation energy in a cell can be determined by the radiation flux of the cell surface. The radiation force can be estimated without considering optical thickness in the cell.
The optical depth is calculated by the long-characteristics method, which traces rays from the center to target cells. However, cells in which dust destruction occurs are evaluated using Thomson opacity instead of Equation (10), i.e., . Furthermore, we assume that, under these conditions, dust is instantaneously destroyed/solidified.
The numerical time step is determined by where the timescales are hydrodynamics , radiation force , and -viscosity . In this study, we assume , i.e., the number of computational cells in each direction set . The cell size in the uniform region is pc for and pc. The cells at pc and pc gradually increase to approximately 0.1 pc for the maximum simulation box pc.
We assume symmetries for , and and anti-symmetries for and as boundary conditions for the –axis. The outflow condition is assumed for the outer boundary. In the central region pc, we adopted the absorbed boundaries as g cm-3, K, and .
Initial density distribution in the Keplerian dusty-gas disk is given by
| (16) |
where the midplane density at pc is g cm3 considering the radial power (Kawaguchi 2003) and the disk scale height is . The initial disk mass of gas and dust for pc pc have the and . The initial gas temperature in the disk is constant as K. For the grid cell with g cm-3, we set floor values with g cm-3, K, and .
3 Results
3.1 Multiscale and multiphase outflows
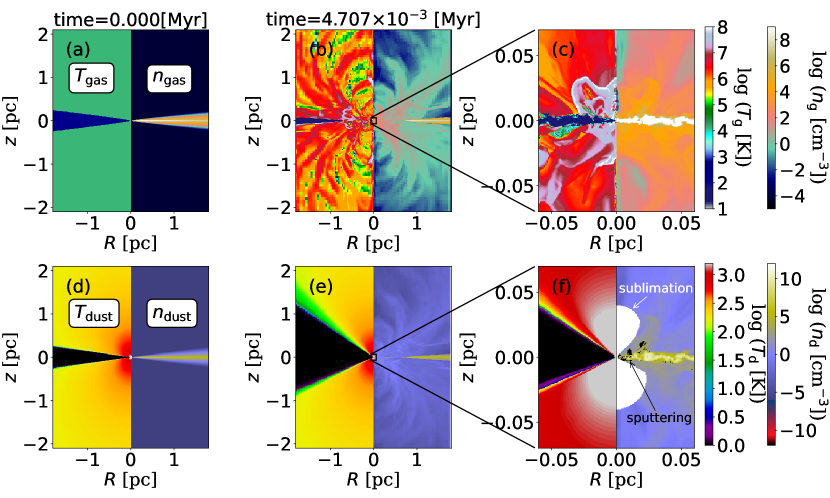
We first overview the time evolution of gas distribution in the central 2 pc of the model considering the bolometric luminosity of erg s-1 (Figure 2). It shows that multiphase outflows are driven by the radiation force at pc. The bottom three panels of Figure 2 show that dusty gas is distributed in the disk; the dust is associated with shell-like outflows, which propagate up to scales of a few parsecs. The dusty outflows are launched from the surface of the dense dusty disk inner 0.01 pc (Figures 2c and f). The dust temperature near the disk plane is low ( K; Figures 2d–f). This is because of the nonspherical UV radiation field (Equation 9) and the attenuation caused by the dense gas. As a result, the dust sublimation region is not spherical, as is evident in the white region of Figure 2f, where the dust temperature exceeds the limit (1500 K). Most dusty outflows are not fast enough to escape from the central parsec region and thus fall back to the disk, eventually infall to the central region through the disk. This circulation mechanism of the dusty gas is similar to the “radiation-driven fountain”, which was proposed as a mechanism to form a geometrically thick torus-like structure on a 10 parsec scale (Wada, 2012, 2015; Wada et al., 2016).
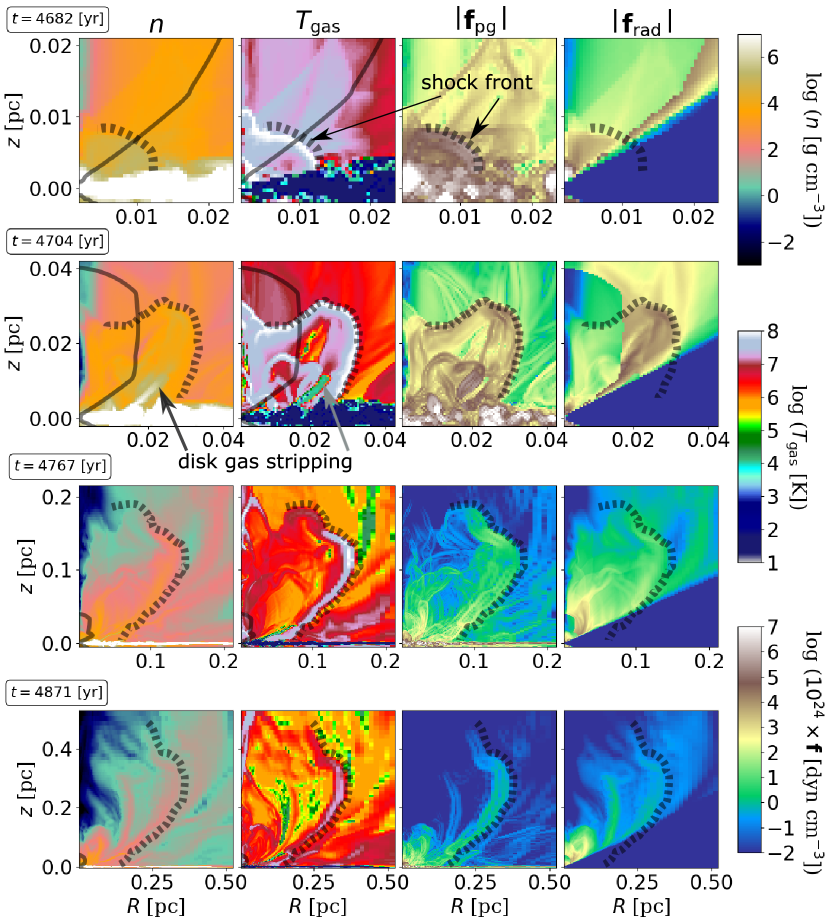
Let us see the formation process of the nonspherical multi-shell outflows in detail. Figure 3 shows the generation and propagation of a shell with regard to density, temperature, gas-pressure force, and radiation force distributions. The time scale of the formation and propagation of one shell is roughly yr, which is comparable to a rotational timescale ( yr) at pc. Around the dust sublimation scale ( pc), the gas density and temperature are steepened by a shock with Mach number , where the forces of the gas pressure () and radiation ( of Eq.8) contribute to the acceleration of outflows; these are shown by the dashed lines in Figure 3. Beyond the dust sublimation radius, the expansion of the shock front is accelerated by the radiation force of the dust, which is greater than the gas pressure (Figure 4). Furthermore, the effect of the anisotropic radiation transforms one shell from a spherical shape to an hourglass shape, thereby resulting in a lotus-flower-like structure with multiple outflowing shells.
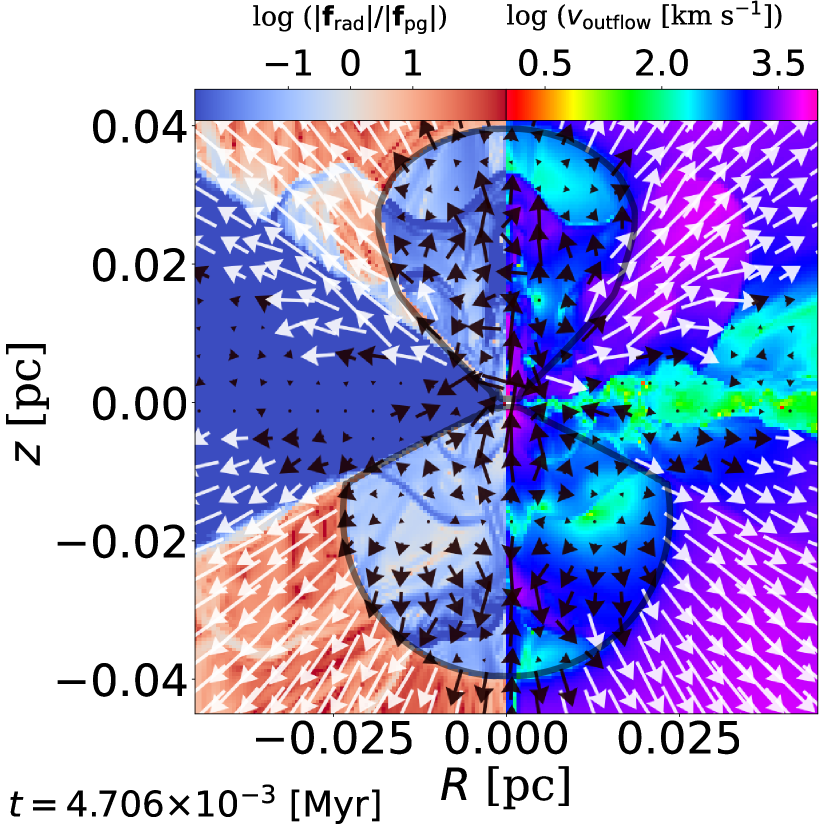
According to the dust sublimation scale, the outflow associated with the expanding shells is driven by the radiation force and radiative heating. The left-half panel of Figure 4 shows the force balance between radiation () and gas pressure (). In the region inside the sublimation radius (gray solid line), the gas pressure dominates the radiation force, and the gas outflow velocity is less than the escape velocity represented by the black arrows. This is in contrast to the outer region, where the gas velocity exceeds the escape velocity, represented by the white arrows around the sub-parsec scale.
Notes that the sublimation radius is not symmetric above and below the disk plane, even though the radiation field is symmetric in the equatorial plane. This asymmetric feature is always observed with the outflowing gas density and velocity field 222 See Figures 2 and 3, lotus-flower-like gas structure propagate independently irrespective of the disk top and bottom. in the gas-pressure-dominant region of Figure 4. Symmetry is broken by the nonlinear interaction between the radiation field and gas.
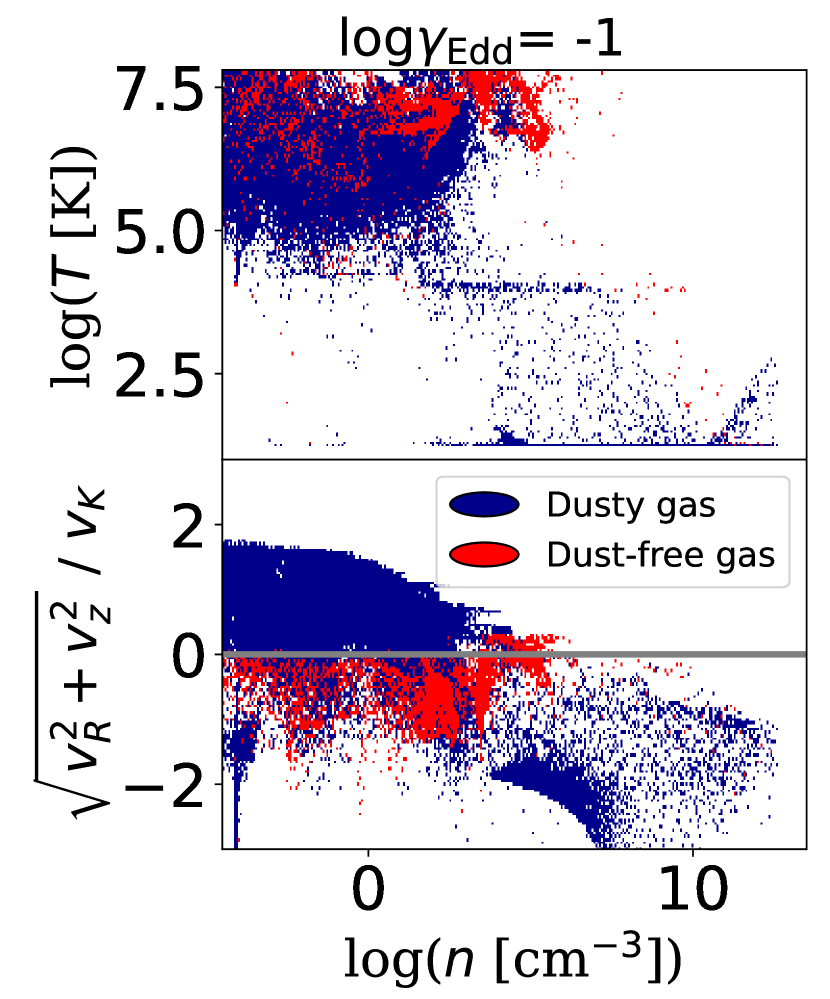
We found that the gas in the sub-parsec scale exhibits a wide range of temperature and density (Figure 5). The dust-free gas coexists with the dusty gas on the density–temperature or density–velocity plane; however, the hot gas ( K) with cm-3 tends to be dust-free. The dust-free gas is mostly caused by the dust sublimation due to the intense radiation field, not by the sputtering effect 333 At pc, the spattering time scale is shorter than the dynamical time scale, i.e., (eq. 14). The lower limit of number density at which sputtering occurs is for K. At low temperatures, the density increases by a factor of . ; the spatial distributions of sublimation and sputtering are shown in Figure 2f.
Figure 5(bottom) shows that the dusty gas with cm-3 is gravitationally bound (), and the low-density dusty gas is gravitationally unbound. The high and low-velocity gases spatially correspond to the gas in the radiation-dominated and gas-pressure-dominated regions shown in Figure 4, respectively. In contrast, the velocity of the dust-free gas is less than the Keplerian velocity.
The complicated multiphase structure is a natural consequence of the interaction between the non-spherical central radiation field and the nonuniform dusty/dust-free gases. Moreover, shocks propagating outward peel off the cold dense gas on the disk surface (Figure 3). This causes transition in phases from the cold dense gas ( cm-3) in the disk to hot diffused gas by shock-heating, in addition to direct heating by central radiation.
3.2 Column density and dust sublimation radius
In this section, we investigate the column density of dusty and dust-free gases and their relation to the structures of the dust sublimation region in radiation-driven outflows. The following discussion is based on the density field averaged over a five-rotation timescale at pc to remove the time variability of the outflow (see, e.g., Figure 8).
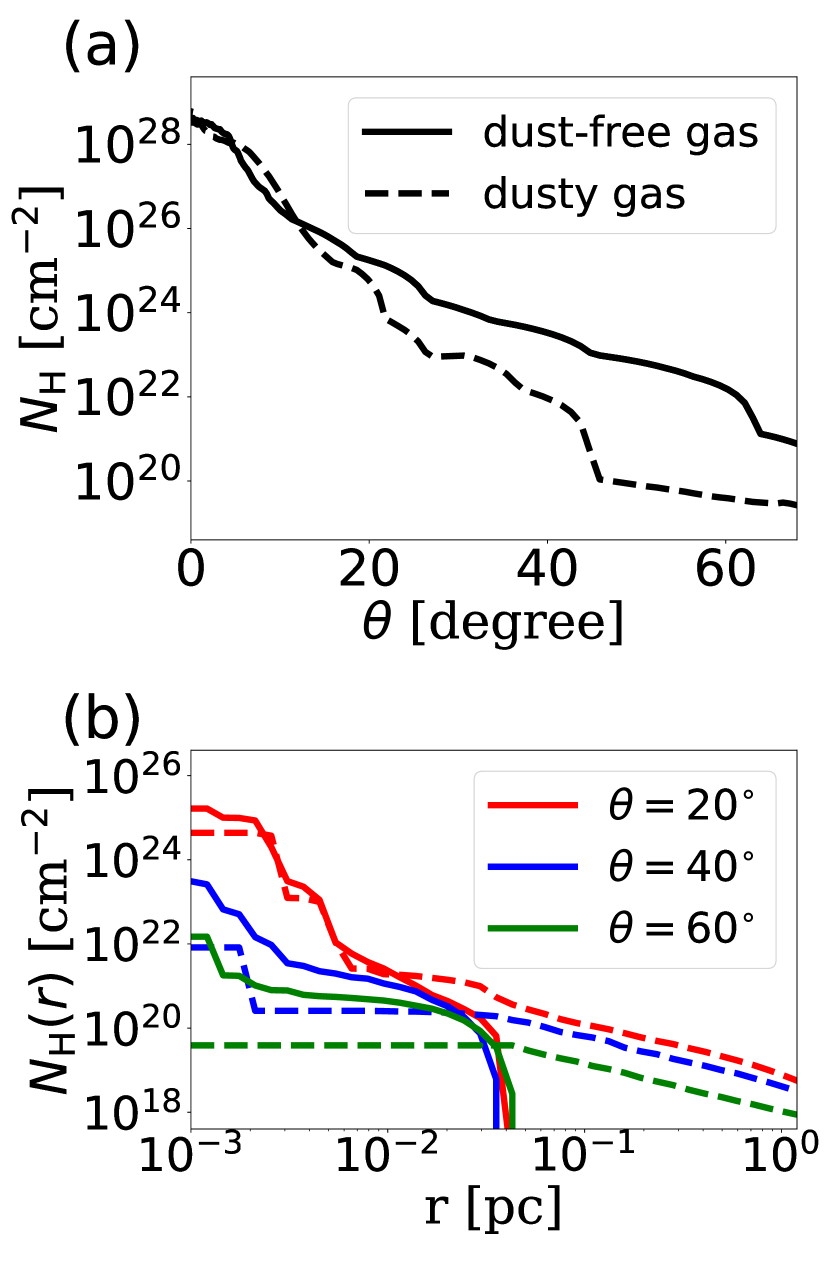
Figure 6a shows the column density distribution as a function of the angle from the disk () (Figure 7a). It shows that the column density monotonically decreases from – deg for dusty and dust-free gases. While the column densities of the dust-free and dusty gases are almost the same near the disk ( degree), these differences are evident for larger . Figure 6b shows the column density as a function of radius for dusty and dust-free gases for three viewing angles. The dust-free gas appears at pc for all the viewing angles, and the central pc region is mostly dust-free.
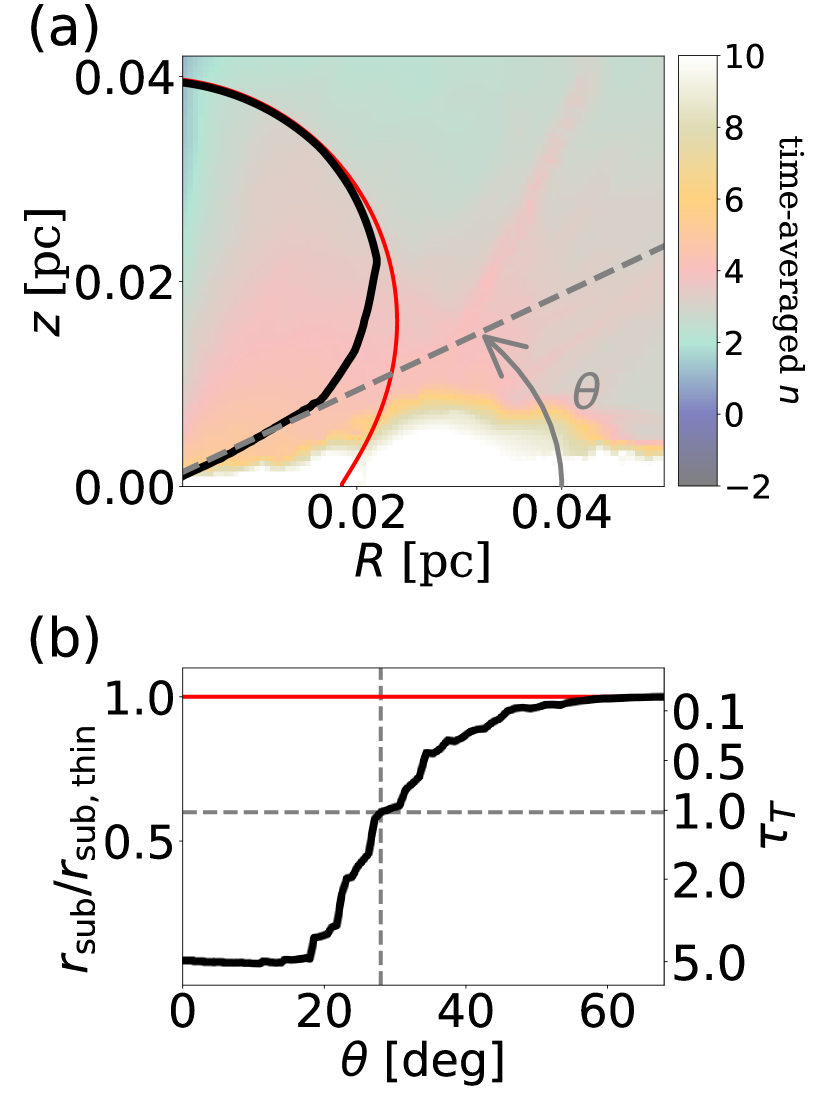
The dust sublimation region in the radiation-driven outflow explained in Section 3.1 should not be spherical, as suggested by Kawaguchi & Mori (2010) and Baskin & Laor (2018). In other words, the shape of the dust sublimation region is not expressed by a single critical radius, i.e., , where a point source and optically thin material are assumed.
In Figure 7, we show the difference in the sublimation radii of the optically thin case (red line) and that derived from the numerical result considering the central 0.04 pc. The latter is always less than the optically thin case 444 The sublimation radius for the optically thin case is not zero for the disk plane because the X-ray radiation of the central source is assumed to be spherical (see also Equation (9)). . The decrease in the size of the sublimation radius is evident owing to deg (Figure 7a ). This difference is caused by the attenuation of the dust-free gas, i.e., Thomson scattering. In Figure 7b, we show the ratio of the sublimation radii as a function of for the two cases; this ratio corresponds to the optical depth , i.e., . We found that is for degree. This angle corresponds to that for cm-2 (Figure 6a). The result implies that dust-free gas is an essential component that determines the shape of the dust sublimation region.
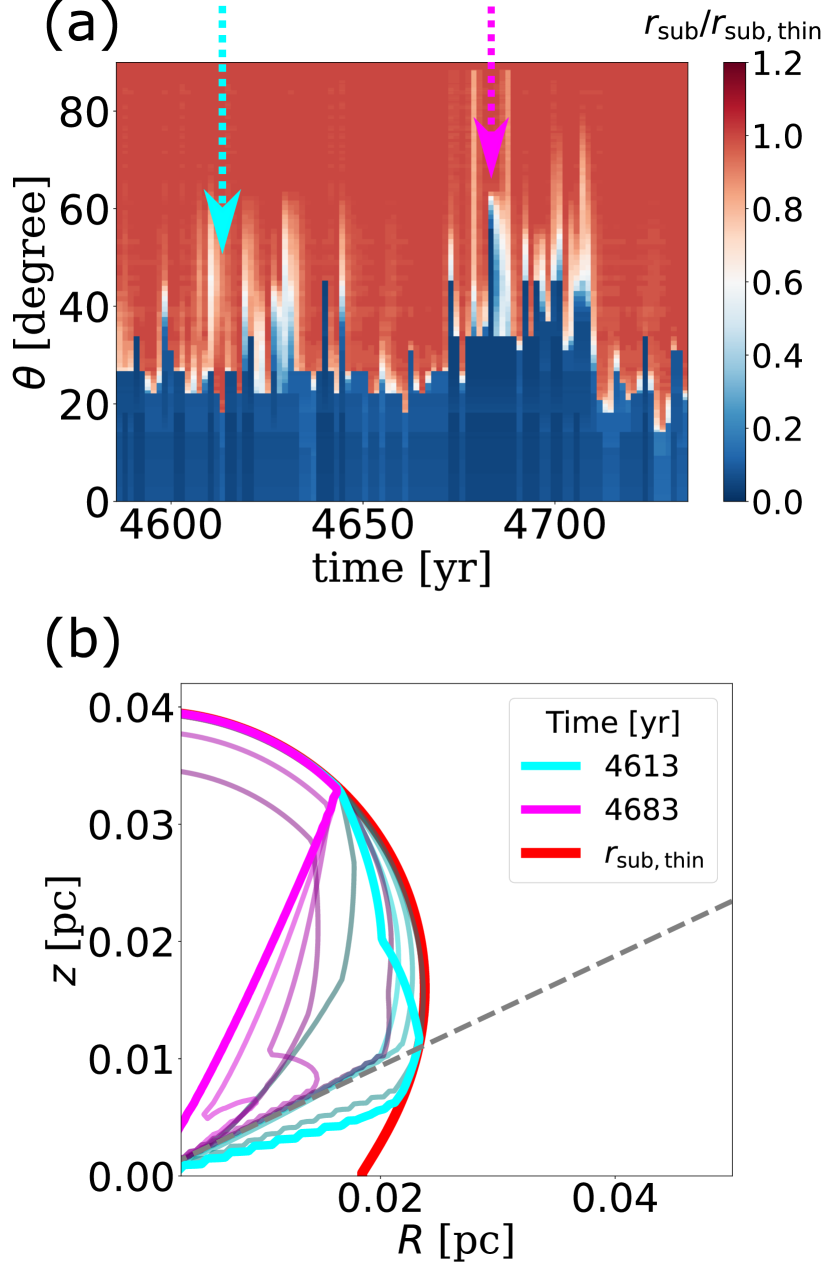
We found that the dust sublimation radius in the simulation shows time variation (Figure 8a), where is plotted as a function of time and . The ratio is equivalent to the optical depth for the Thomson opacity (see also conversion in the dual axis of Figure 7b). This is also confirmed in the radii of – plane (Figure 8b). Contrary to the optically thin case (red curve: ), the sublimation radius calculated from the gas distribution inside is not static, and its variation depends on . For deg deg, the sublimation radius fluctuates on a timescale a few years, reflecting the nonsteady outflow.
4 Discussion
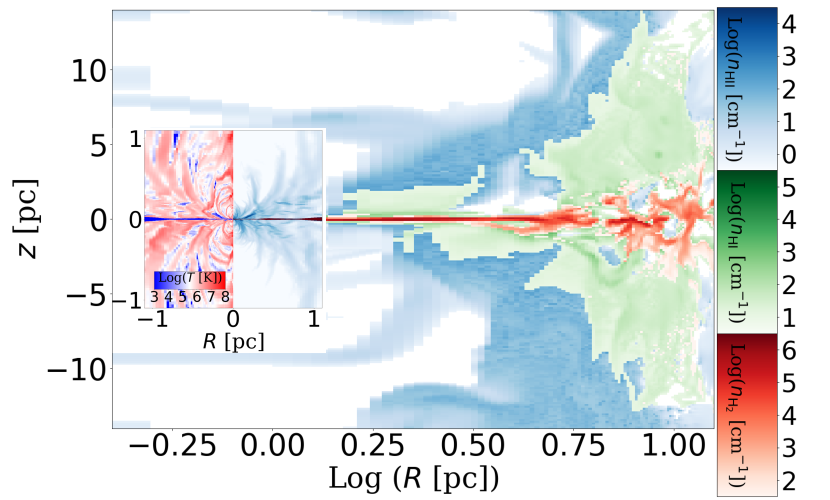
The outer radius of the simulation box in our model is 2 pc. Therefore, we cannot follow fate of the outflow on a torus scale (i.e., 10 pc). Figure 9 shows the multiphase gas structures based on two different scales: the present model and radiative-driven fountain model in Wada et al. (2016). If the mass is supplied through the geometrically thin molecular dusty disk from 10 to 0.1 pc, ionized multi-shell outflow is formed. This inflow-induced outflow may propagate outward and form the ionized gas envelope (e.g., warm absorbers Ogawa et al. 2022 and the narrow emission line region Wada et al. 2018b). The stratified multiphase structure is actually consistent with recent high-resolution ALMA observations in the nearest type-2 Seyfert galaxy, the Circinus galaxy (Izumi et al., 2023).
In the radiation-driven fountain model (Schartmann et al., 2014; Wada et al., 2016), the observed polar dust emission in mid-IR (Tristram et al., 2014; López-Gonzaga et al., 2016; Isbell et al., 2022) originated in the dusty outflow. However, the innermost region of the outflow (i.e., 0.1 pc) was not resolved in these simulations. Our model suggests that the dusty outflow originates inside the dust sublimation radius, i.e., 0.04 pc on the scale. The high-density dust-free gas inside pc (Figure 6) could be the origin of Compton-thick obscuration, which has been confirmed by the X-ray observations of nearby AGNs (Davies et al., 2015; Ichikawa et al., 2019; Buchner et al., 2021; Ogawa et al., 2022). We suggest that the dust sublimation radius, which varies on the timescale below a few years, contributes to the variability observed in X-ray (e.g., Noda et al., 2020; Lyu et al., 2022) as related to IR (e.g., Kishimoto et al., 2011a; Koshida et al., 2014; Minezaki et al., 2019).
Furthermore, our results imply that a hot dust ( K) component in a central sub-parsec region can exist in the near-IR source, we expect to be observed by molecular CO absorption lines in ultra-luminous infrared galaxies (e.g. Baba et al. 2018, 2022; Onishi et al. 2021) and Seyfert galaxies (Uzuo et al. 2021; Matsumoto et al. 2022).
In this paper, we investigated a case for Seyfert-like AGN with an SMBH of . For more massive BHs, the outflow structures may change, as Wada 2015 suggested, in which the radiation-driven outflows on a scale for various parameters (e.g., the Eddington ratio and SMBH mass) are investigated. They found that the opening angle of the outflow tends to be larger for a larger Eddington ratio. This should also be the case for the sub-parsec scale outflows. However, we expect that the size of the dust-sublimation region may affect the launching of the sub-parsec scale outflows. In subsequent papers, we will investigate how outflows change depending on the Eddington ratio, SMBH mass, and SEDs.
The inflow-induced outflow presented in this paper is suitable for standard accretion disk assuming anisotropy of the central radiation field. The SED of the central source varies with surface density and accretion rate (see, e.g., Abramowicz et al., 1995). Therefore, the outflow structure may depend on the accretion disk model and AGN type. This remains an issue for future work.
5 Summary
We investigated the dusty outflow driven by AGN radiation fields with the bolometric luminosity erg s-1 and SMBH mass . We performed radiation-hydrodynamic 2D simulations for –2 pc, in which the dust sublimation scale is resolved.
We conclude on the following points:
-
(1)
The dusty gas in the outflow is intermittently launched from the geometrically thin disk of pc forming “lotus-like” multiple shells. Each shell is accompanied by shock where the number density, temperature, and Mach number are cm-3, K, and at 0.01 pc, respectively. Because of the anisotropic radiation in the thin accretion disk, shells propagated to a parsec scale are deformed to an hourglass-like shape. Moreover, we observed that, within 20 degrees from the disk midplane, the outflow velocity of the dusty gas is less than the escape velocity. The gas pressure dominates this region.
-
(2)
The column density is determined by dust-free gas. Below 27 degrees, there are optically thick dusty/dust-free gases, i.e., the column density is cm-2. For cm-2, the column density is a smaller fraction of dusty gas compared to dust-free gas. The dust-free gas outflows in the central region pc, where cm-3, K, and .
-
(3)
The shape of the dust sublimation radius is determined not only by the radiation flux density and its anisotropy, but also by the obscuration of the dust-free gas. Moreover, we found that the sublimation radius at degrees varies with time on the scale of a few years or less owing to the nonsteady dusty outflow.
We found that the inflow-induced dusty outflow is multiphase-stratified from the molecular cold disk to the atomic gas and formed an ionized envelope owing to the AGN radiation. This is consistent with the recent high-resolution ALMA observations of the nearest Seyfert galaxy, the Circinus galaxy (Izumi et al., 2023).
References
- Abramowicz et al. (1995) Abramowicz, M. A., Chen, X., Kato, S., Lasota, J.-P., & Regev, O. 1995, ApJ, 438, L37, doi: 10.1086/187709
- Almeyda et al. (2020) Almeyda, T., Robinson, A., Richmond, M., Nikutta, R., & McDonough, B. 2020, ApJ, 891, 26, doi: 10.3847/1538-4357/ab6aa1
- Almeyda et al. (2017) Almeyda, T., Robinson, A., Richmond, M., Vazquez, B., & Nikutta, R. 2017, ApJ, 843, 3, doi: 10.3847/1538-4357/aa7687
- Antonucci (1993) Antonucci, R. 1993, ARA&A, 31, 473, doi: 10.1146/annurev.aa.31.090193.002353
- Baba et al. (2018) Baba, S., Nakagawa, T., Isobe, N., & Shirahata, M. 2018, ApJ, 852, 83, doi: 10.3847/1538-4357/aa9f25
- Baba et al. (2022) Baba, S., Imanishi, M., Izumi, T., et al. 2022, ApJ, 928, 184, doi: 10.3847/1538-4357/ac57c2
- Barvainis (1987) Barvainis, R. 1987, ApJ, 320, 537, doi: 10.1086/165571
- Baskin & Laor (2018) Baskin, A., & Laor, A. 2018, MNRAS, 474, 1970, doi: 10.1093/mnras/stx2850
- Brightman et al. (2013) Brightman, M., Silverman, J. D., Mainieri, V., et al. 2013, MNRAS, 433, 2485, doi: 10.1093/mnras/stt920
- Buchner et al. (2021) Buchner, J., Brightman, M., Baloković, M., et al. 2021, A&A, 651, A58, doi: 10.1051/0004-6361/201834963
- Chan & Krolik (2016) Chan, C.-H., & Krolik, J. H. 2016, ApJ, 825, 67, doi: 10.3847/0004-637X/825/1/67
- Chan & Krolik (2017) —. 2017, ApJ, 843, 58, doi: 10.3847/1538-4357/aa76e4
- Combes (2021) Combes, F. 2021, Active Galactic Nuclei: Fueling and Feedback, doi: 10.1088/2514-3433/ac2a27
- Davies et al. (2015) Davies, R. I., Burtscher, L., Rosario, D., et al. 2015, ApJ, 806, 127, doi: 10.1088/0004-637X/806/1/127
- Dorodnitsyn et al. (2016) Dorodnitsyn, A., Kallman, T., & Proga, D. 2016, ApJ, 819, 115, doi: 10.3847/0004-637X/819/2/115
- Draine (2003) Draine, B. T. 2003, ApJ, 598, 1017, doi: 10.1086/379118
- Draine & Salpeter (1979) Draine, B. T., & Salpeter, E. E. 1979, ApJ, 231, 77, doi: 10.1086/157165
- Draine & Tan (2003) Draine, B. T., & Tan, J. C. 2003, ApJ, 594, 347, doi: 10.1086/376855
- García-Burillo et al. (2019) García-Burillo, S., Combes, F., Ramos Almeida, C., et al. 2019, A&A, 632, A61, doi: 10.1051/0004-6361/201936606
- García-Burillo et al. (2021) García-Burillo, S., Alonso-Herrero, A., Ramos Almeida, C., et al. 2021, A&A, 652, A98, doi: 10.1051/0004-6361/202141075
- Gravity Collaboration et al. (2020) Gravity Collaboration, Dexter, J., Shangguan, J., et al. 2020, A&A, 635, A92, doi: 10.1051/0004-6361/201936767
- Hönig (2019) Hönig, S. F. 2019, ApJ, 884, 171, doi: 10.3847/1538-4357/ab4591
- Hönig et al. (2018) Hönig, S. F., Alonso Herrero, A., Gandhi, P., et al. 2018, Experimental Astronomy, 46, 413, doi: 10.1007/s10686-018-9612-3
- Hönig & Kishimoto (2011) Hönig, S. F., & Kishimoto, M. 2011, A&A, 534, A121, doi: 10.1051/0004-6361/201117750
- Ichikawa et al. (2019) Ichikawa, K., Ricci, C., Ueda, Y., et al. 2019, ApJ, 870, 31, doi: 10.3847/1538-4357/aaef8f
- Impellizzeri et al. (2019) Impellizzeri, C. M. V., Gallimore, J. F., Baum, S. A., et al. 2019, ApJ, 884, L28, doi: 10.3847/2041-8213/ab3c64
- Isbell et al. (2022) Isbell, J. W., Meisenheimer, K., Pott, J. U., et al. 2022, A&A, 663, A35, doi: 10.1051/0004-6361/202243271
- Izumi et al. (2018) Izumi, T., Wada, K., Fukushige, R., Hamamura, S., & Kohno, K. 2018, ApJ, 867, 48, doi: 10.3847/1538-4357/aae20b
- Izumi et al. (2023) Izumi, T., Wada, K., Imanishi, M., et al. 2023, arXiv e-prints, arXiv:2305.03993, doi: 10.48550/arXiv.2305.03993
- Kawaguchi (2003) Kawaguchi, T. 2003, ApJ, 593, 69, doi: 10.1086/376404
- Kawaguchi & Mori (2010) Kawaguchi, T., & Mori, M. 2010, ApJ, 724, L183, doi: 10.1088/2041-8205/724/2/L183
- Kawaguchi & Mori (2011) —. 2011, ApJ, 737, 105, doi: 10.1088/0004-637X/737/2/105
- Kishimoto et al. (2011a) Kishimoto, M., Hönig, S. F., Antonucci, R., et al. 2011a, A&A, 527, A121, doi: 10.1051/0004-6361/201016054
- Kishimoto et al. (2011b) —. 2011b, A&A, 536, A78, doi: 10.1051/0004-6361/201117367
- Kishimoto et al. (2007) Kishimoto, M., Hönig, S. F., Beckert, T., & Weigelt, G. 2007, A&A, 476, 713, doi: 10.1051/0004-6361:20077911
- Klassen et al. (2014) Klassen, M., Kuiper, R., Pudritz, R. E., et al. 2014, ApJ, 797, 4, doi: 10.1088/0004-637X/797/1/4
- Koshida et al. (2014) Koshida, S., Minezaki, T., Yoshii, Y., et al. 2014, ApJ, 788, 159, doi: 10.1088/0004-637X/788/2/159
- Liu et al. (2021) Liu, H., Luo, B., Brandt, W. N., et al. 2021, ApJ, 910, 103, doi: 10.3847/1538-4357/abe37f
- López-Gonzaga et al. (2016) López-Gonzaga, N., Burtscher, L., Tristram, K. R. W., Meisenheimer, K., & Schartmann, M. 2016, A&A, 591, A47, doi: 10.1051/0004-6361/201527590
- Lyu et al. (2022) Lyu, B., Wu, Q., Yan, Z., Yu, W., & Liu, H. 2022, ApJ, 927, 227, doi: 10.3847/1538-4357/ac5256
- Lyu & Rieke (2021) Lyu, J., & Rieke, G. H. 2021, ApJ, 912, 126, doi: 10.3847/1538-4357/abee14
- Mathis et al. (1977) Mathis, J. S., Rumpl, W., & Nordsieck, K. H. 1977, ApJ, 217, 425, doi: 10.1086/155591
- Matsumoto et al. (2022) Matsumoto, K., Nakagawa, T., Wada, K., et al. 2022, ApJ, 934, 25, doi: 10.3847/1538-4357/ac755f
- Matsumoto et al. (2019) Matsumoto, Y., Asahina, Y., Kudoh, Y., et al. 2019, PASJ, 71, 83, doi: 10.1093/pasj/psz064
- Meijerink & Spaans (2005) Meijerink, R., & Spaans, M. 2005, A&A, 436, 397, doi: 10.1051/0004-6361:20042398
- Minezaki et al. (2019) Minezaki, T., Yoshii, Y., Kobayashi, Y., et al. 2019, ApJ, 886, 150, doi: 10.3847/1538-4357/ab4f7b
- Mor & Netzer (2012) Mor, R., & Netzer, H. 2012, MNRAS, 420, 526, doi: 10.1111/j.1365-2966.2011.20060.x
- Namekata & Umemura (2016) Namekata, D., & Umemura, M. 2016, MNRAS, 460, 980, doi: 10.1093/mnras/stw862
- Netzer (1987) Netzer, H. 1987, MNRAS, 225, 55, doi: 10.1093/mnras/225.1.55
- Netzer (2015) —. 2015, ARA&A, 53, 365, doi: 10.1146/annurev-astro-082214-122302
- Noda et al. (2020) Noda, H., Kawamuro, T., Kokubo, M., & Minezaki, T. 2020, MNRAS, 495, 2921, doi: 10.1093/mnras/staa1376
- Ogawa et al. (2022) Ogawa, S., Ueda, Y., Wada, K., & Mizumoto, M. 2022, ApJ, 925, 55, doi: 10.3847/1538-4357/ac3cb9
- Ohsuga et al. (2005) Ohsuga, K., Mori, M., Nakamoto, T., & Mineshige, S. 2005, ApJ, 628, 368, doi: 10.1086/430728
- Onishi et al. (2021) Onishi, S., Nakagawa, T., Baba, S., et al. 2021, ApJ, 921, 141, doi: 10.3847/1538-4357/ac1c6d
- Schartmann et al. (2011) Schartmann, M., Krause, M., & Burkert, A. 2011, MNRAS, 415, 741, doi: 10.1111/j.1365-2966.2011.18751.x
- Schartmann et al. (2005) Schartmann, M., Meisenheimer, K., Camenzind, M., Wolf, S., & Henning, T. 2005, A&A, 437, 861, doi: 10.1051/0004-6361:20042363
- Schartmann et al. (2014) Schartmann, M., Wada, K., Prieto, M. A., Burkert, A., & Tristram, K. R. W. 2014, MNRAS, 445, 3878, doi: 10.1093/mnras/stu2020
- Shakura & Sunyaev (1973) Shakura, N. I., & Sunyaev, R. A. 1973, A&A, 500, 33
- Suganuma et al. (2006) Suganuma, M., Yoshii, Y., Kobayashi, Y., et al. 2006, ApJ, 639, 46, doi: 10.1086/499326
- Tristram et al. (2014) Tristram, K. R. W., Burtscher, L., Jaffe, W., et al. 2014, A&A, 563, A82, doi: 10.1051/0004-6361/201322698
- Tsai & Mathews (1995) Tsai, J. C., & Mathews, W. G. 1995, ApJ, 448, 84, doi: 10.1086/175943
- Uzuo et al. (2021) Uzuo, T., Wada, K., Izumi, T., et al. 2021, ApJ, 915, 89, doi: 10.3847/1538-4357/ac013d
- Wada (2012) Wada, K. 2012, ApJ, 758, 66, doi: 10.1088/0004-637X/758/1/66
- Wada (2015) —. 2015, ApJ, 812, 82, doi: 10.1088/0004-637X/812/1/82
- Wada et al. (2018a) Wada, K., Fukushige, R., Izumi, T., & Tomisaka, K. 2018a, ApJ, 852, 88, doi: 10.3847/1538-4357/aa9e53
- Wada et al. (2009) Wada, K., Papadopoulos, P. P., & Spaans, M. 2009, ApJ, 702, 63, doi: 10.1088/0004-637X/702/1/63
- Wada et al. (2016) Wada, K., Schartmann, M., & Meijerink, R. 2016, ApJ, 828, L19, doi: 10.3847/2041-8205/828/2/L19
- Wada et al. (2018b) Wada, K., Yonekura, K., & Nagao, T. 2018b, ApJ, 867, 49, doi: 10.3847/1538-4357/aae204
- Whalen & Norman (2006) Whalen, D., & Norman, M. L. 2006, ApJS, 162, 281, doi: 10.1086/499072
- Williamson et al. (2019) Williamson, D., Hönig, S., & Venanzi, M. 2019, ApJ, 876, 137, doi: 10.3847/1538-4357/ab17d5
- Williamson et al. (2020) —. 2020, ApJ, 897, 26, doi: 10.3847/1538-4357/ab989e