Evaluation of short range depth sonifications for visual-to-auditory sensory substitution
Abstract
Visual to auditory sensory substitution devices convert visual information into sound and can provide valuable assistance for blind people. Recent iterations of these devices rely on depth sensors. Rules for converting depth into sound (i.e. the sonifications) are often designed arbitrarily, with no strong evidence for choosing one over another. The purpose of this work is to compare and understand the effectiveness of five depth sonifications in order to assist the design process of future visual to auditory systems for blind people which rely on depth sensors. The frequency, amplitude and reverberation of the sound as well as the repetition rate of short high-pitched sounds and the signal-to-noise ratio of a mixture between pure sound and noise are studied. We conducted positioning experiments with twenty-eight sighted blindfolded participants. Stage 1 incorporates learning phases followed by depth estimation tasks. Stage 2 adds the additional challenge of azimuth estimation to the first stage’s protocol. Stage 3 tests learning retention by incorporating a 10-minute break before re-testing depth estimation. The best depth estimates in stage 1 were obtained with the sound frequency and the repetition rate of beeps. In stage 2, the beep repetition rate yielded the best depth estimation and no significant difference was observed for the azimuth estimation. Results of stage 3 showed that the beep repetition rate was the easiest sonification to memorize. Based on statistical analysis of the results, we discuss the effectiveness of each sonification and compare with other studies that encode depth into sounds. Finally we provide recommendations for the design of depth encoding.
Index Terms:
Sonification, comparison, depth, sensory substitution, vision to audition, blindI Introduction
Sonification is the use of non-verbal sound to convey information [1]. Common examples include audio alerts in cars, computers, mobile phones, or the sound produced by traffic lights for blind people.
Sonification of visual information 111information that is usually captured by vision can provide essential assistance with the audio modality [2]. Sensory substitution of vision by audition (SSVA) systems for the blind are one straightforward application of such sonification. Early SSVA devices encode 2D camera images into sounds and have shown potential for visual rehabilitation [3, 4, 5, 6, 7, 8]. A new generation of SSVA devices takes advantage of the rapid development of 3D sensors to explicitly sonify depth [9, 10, 11, 12, 13, 14, 15, 16, 17, 18, 19, 20, 21, 22].
A variety of depth sonifications are used in devices that rely on 3D sensors. Some systems encode depth into sound amplitude to sonify 3D images from a Kinect camera [9, 10], locate object within virtual environments [11, 12] or indicate the length of the traversable area in front of users [13, 14]. Other devices encode depth into pitch for 3D space perception [15], sightless navigation [16, 17] or hazard detection [18]. Others use the repetition rate of beeps 222short, high-pitched periodic sounds to encode the distance of pedestrians in front of users [19] or to warn them of nearby obstacles [20]. Finally, some systems use reverberation to represent the depth of objects [21] or to inform users about the size of a room [22].
To date, there is no standardized depth sonification for SSVA systems based on an extensive study. Yet, several works underline the importance of choosing effective vision to audition mappings for designing such systems [23, 24, 25]. In [23], the authors claim that more research is needed to answer the question “what sort of stimulation is most effective for conveying particular information ?”. In [24], the authors argue that the design of human machine interface systems could greatly benefit from the study of natural cross modal correspondences (CMCs) 333CMCs are defined as a “tendency for a sensory feature in one modality to be associated with a sensory feature in another sensory modality” [26].. In [25] the authors showed that the use of CMCs as a basis for designing color to sound association rules improved performance in memory and recognition tasks.
In this work, we compare the effectiveness of five different depth sonifications for SSVA devices that rely on 3D sensors. In such systems, 3D sensors can usually capture depth up to 8 meters. We developed a system and protocol to precisely evaluate the accuracy that can give different depth sonifications in a depth range of 1 meter in front of the user. We discuss in section V-E whether our results could be extended to larger depth ranges.
To our knowledge, sonification comparison works of short range depth (i.e. with a depth that is within the range of 3D sensors used in SSVA devices) were always conducted with sighted participants and are reported below.
Parseihian et al. [27] found that repetition rate of beeps and pitch were more accurate than reverberation to encode the distance between the position of the hand and a reference point. Later, Parseihian et al. [28] evaluated the potential of 4 sound parameters (pitch, rhythm, timbre and loudness) for a one dimensional guidance task. They found that performance was dependent on both the sonification strategy and the given instructions. Bazilinsky et al. [29] investigated, with 29 sighted individuals, 3 sound parameters (pitch, amplitude and repetition rate of beeps) to encode distance between the cursor and a reference point on a computer screen. The authors did not find significant differences in the estimation accuracy between the 3 sonifications.
The aforementioned sonification comparisons were performed with sighted non-blindfolded individuals. Participants therefore had visual feedback combined with audio during the learning phase as well as during the position estimation and guidance tasks. It is reasonable to hypothesize that behavioral and motor control differences exist when people cannot rely on vision to estimate the audio encoded depth. Therefore, in the context of sensory substitution for blind individuals, we compare sonifications without visual feedback. In addition, we conducted experiments with a physical object to imitate a real life situation in which a blind person wants to understand the position of an object. The importance of using a physical object in the sensory substitution context has been highlighted by Auvray et al. [30]. They showed that the distal attribution 444The distal attribution is the ability to create a mental representation of a distant object from sensory stimulation in the sensory substitution process relies on the ability to manipulate the physical object that is encoded with sounds. Finally, conducting experiments in the real world rather than in a virtual environment allows to remove performance biases due to different skill levels of participants with controllers such as a game pad or a mouse.
Our protocol comprises three experimental stages that are described in section III-C. Experiments were conducted with 28 sighted blindfolded participants. Participant’s position estimation accuracy was measured for five different sonifications. At the end of the experiment, participants completed a short questionnaire to give qualitative feedback on the sonifications. We also conducted an online experiment to estimate Just Noticeable Differences (JND), which we report on in the discussion section.
Of the five investigated sonifications, two are based on natural depth cues used to estimate the distance of a sound source: the amplitude which is commonly used in sonification systems, and the reverberation (as in the work of Ribeiro et al. [21]). These may provide an intuitive way to encode depth. However, humans tend to naturally underestimate and overestimate far and near sound sources [31, 32]. We therefore tested 3 other sonifications based on artificial cues that could potentially overcome these natural biases. One is a mix of a pure tone and a white noise. The amplitude ratio of the two signals is used to encode depth. Plazak et al. [33] showed that this sonification can be used to assist neurosurgeons to encode distance between a surgical probe and an anatomical region. To our knowledge, this is the first time that such a sonification is investigated in a sensory substitution context. Finally, we investigated two other common depth sonifications used in vision to audition devices that rely on depth: the frequency, and the repetition rate of beeps. It is hypothesized that the 5 evaluated sonifications give significantly different depth estimation accuracy and user preferences.
II Depth sonification system
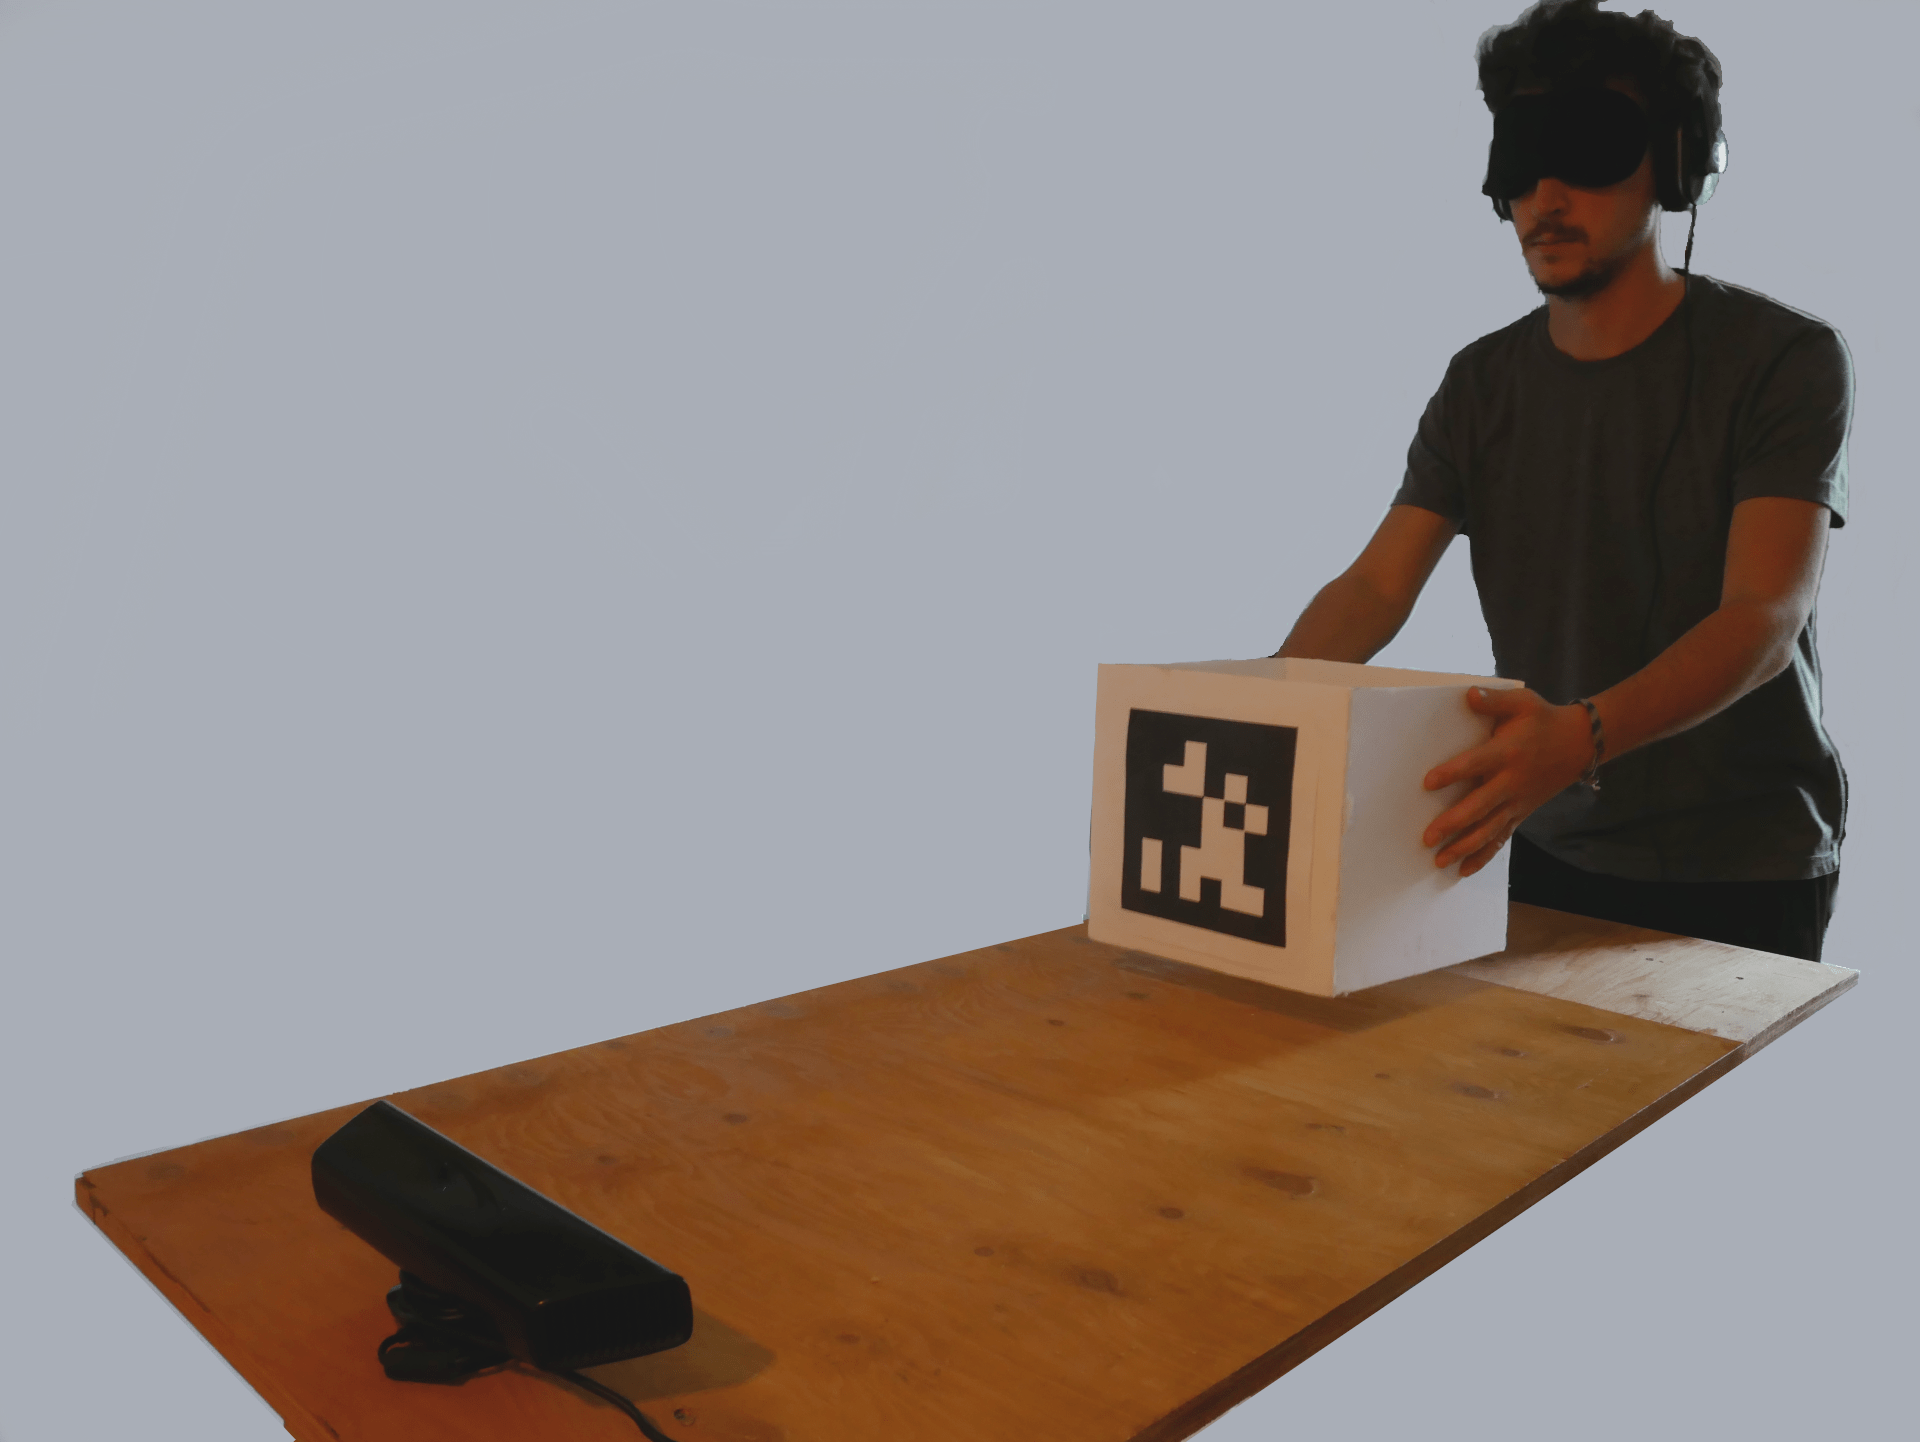
The system consists of a styrofoam box along with a camera and a computer to capture and sonify the position of the box (Fig. 1). The audio feedback is delivered through a pair of Audio-technica headphones (model ATH-M50X).
The system has two modes: one for the learning and one for positioning tasks. During the learning, the position of the styrofoam box is tracked and sonified in real-time while participants are moving the box. For the positioning task, an audio encoded position is played and participants have to move the box to the perceived location. The system encodes either the depth only or the azimuth and the depth (defined in Fig. 2).
The camera is the RGB sensor of a XBOX Kinect 360 (model 1414). It would be possible to use the depth sensor of the Kinect, but we designed our experiments to be reproducible with a simple RGB camera. The position tracking of the box is implemented in Python. Sound is synthesized with the Supercollider [34] audio programming environment.
II-1 Box position tracking
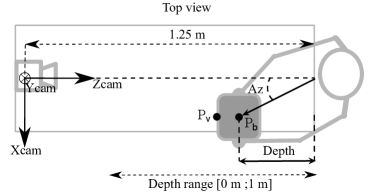
The position of the box is estimated in real time thanks to a visual marker pasted on the box (Fig. 1) that is detected by the AprilTag algorithm [35]. AprilTag estimates 3D positions of visual markers relative to a camera. We detail below the computation of the depth and azimuth (Fig. 2).
We denote the position of the box and the position of the visual marker in the camera’s coordinate system (Fig. 2). AprilTag gives the position of the visual marker in . We first compute the position of the box from the position of the visual marker: , with being the length of the box edges, equal here to cm. We then estimate the depth in centimeters as . We also compute the azimuth (in degree) with:
II-2 Sonification design
| Sonification | Encoding parameter | Sound signal s(t): | |
| \rowcolor[HTML]EFEFEF Freq | : Midi note number | ||
| Amp | : Amplitude (DB) | ||
| \rowcolor[HTML]EFEFEF Reverb | : Reverberation time | ||
| BRR | : Repetition rate (Hz) | ||
| \rowcolor[HTML]EFEFEF SNR | : Signal-Noise ratio |
Each depth sonification algorithm has one sound parameter that is linearly mapped to the depth with the following equation:
| (1) |
with and (described in Table II-2) being the values of sound parameters used to encode a depth of 0 and 1 meter, respectively. Outside of the meter depth range, sound parameters are not changed.
Table II-2 gives the sound parameter ranges and equations for each sonification. We provide additional details below:
-
•
Freq: A pure tone with frequency varying according to the western chromatic musical scale. The sound frequency is therefore equally distinguishable within all the depth range. Small and large depths are respectively encoded into high and low pitch notes. The amplitude is weighted according the “equal loudness curve” of the standard ISO 226:2003 [36] to ensure that the perception of loudness is equal throughout the frequency range.
-
•
Amp: The amplitude of a pure tone () according to a decibel scale. Small and large depths are respectively encoded into high and low sound amplitude.
-
•
Reverb: the reverberation time of beeps. Here, beeps are high pitched pure tones that lasts and that are repeated at a fixed rate of one beep per second. Beeps are reverberated with Schroeder reverberators [37] implemented by the synthesizer FreeVerb of Supercollider. FreeVerb consists of 8 low-pass feedback comb filters in parallel followed by 4 all-pass feedback filters in series [38]. The reverberation time is defined as the time for the low frequencies (below 1500Hz) of the sound to be reduced by 60 dB. Small and large depths are encoded respectively into short and long reverberation time.
-
•
Beep Repetition Rate (BRR) 555We use the same notation as proposed by [29]: the repetition rate of beeps (high pitch tone of ). Small and large depths are encoded into fast and slow repetition rates, respectively.
-
•
SNR: a pure tone () mixed with white noise. The varying parameter is the ratio of the amplitude of the pure tone over the amplitude of the white noise. Small and large depths are encoded respectively into high amplitude of the pure tone (low amplitude of the noise) and high amplitude of the noise (low amplitude of the pure tone).
When sonified, the azimuth angle (Fig. 2) is linearly mapped to stereo panning. The stereo panning is the distribution of the volume in the left and right channels of the headphones. Azimuths of and are encoded with the signal being entirely played in the left ear and the right ear, respectively.
III Methods
III-A Participants
Twenty-eight voluntary subjects were recruited from the Université de Sherbrooke (11 women and 17 men; mean age: years). All were naive regarding the purpose of the experiment and none of the subjects reported any hearing losses. None of them were relatives or friends of the authors. Each individual received the same amount of financial compensation.
III-B Design
We performed a within-subjects study where each participant performed the tasks with the 5 different sonifications. Independent variables are the depth sonification type and the 3 experimental stages (describe in section III-C). Dependent variables are the depth estimation accuracy and participants preferences.
III-C Procedure
Individuals were standing in front of a table and listening with headphones (Fig. 1). Participants were first asked to calibrate the volume of the loudest sound in the experiment by increasing it while remaining at a comfortable level. The protocol was divided into three experimental stages 666The 3 stages were approved by the ethical committee from “lettres et sciences humaines” faculty from Université de Sherbrooke under reference number 2014-85/Rouat., each completed with the 5 sonifications. Before the beginning of each stage, participants were blindfolded.
-
1.
Stage 1 - Depth estimation with learning tasks : the stage comprised 3 sequences of [1 learning task followed by 5 positioning tasks] (total of 3 learning and 15 positioning tasks). During the learning task, participants were asked to actively explore the space by moving the box and to try to understand how the sound changed depending on its position. There was no time limit for this task. For the positioning task, a random target position (either a depth or a depth and an azimuth for stage 2) was generated from an uniform distribution. The generated target was constrained to the area within the field of view of the camera in front of the participant. A two second sound encoding the target position was then played and participants had to place the box at the perceived location.
The purpose was to quantify how well participants estimated the depth and how the learning tasks impacted the positioning accuracy. Only the depth was encoded into sounds.
-
2.
Stage 2 - Depth and azimuth estimation: the purpose was to investigate the simultaneous perception of the encoded azimuth and depth. The stage comprised one learning task followed by 5 positioning tasks. Learning and positioning tasks were the same as those described above for stage 1, but with both depth and azimuth encoded into sounds.
-
3.
Stage 3 - Depth estimation after a 10 minutes break: the purpose was to evaluate how well the different sonifications could be remembered in the short term. Participants therefore took a 10 minutes break before performing the stage and there was no new learning task. Then they had to complete 5 positioning tasks, which were the same as in stage 1.
Participants could rest and remove their blindfolds whenever they needed during experiments. We did not provide feedback on the accuracy of their estimation. Following the experiments, they answered a questionnaire comprising 4 questions to give qualitative feedback on the sonifications.
III-D Graphical representation and statistical analysis
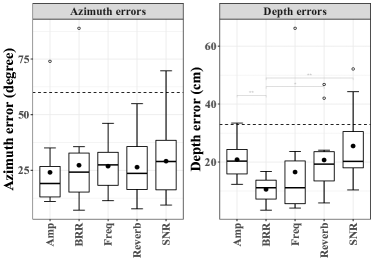
Distribution of depth and azimuth errors are displayed with Boxplots [39]. Horizontal edges of the box show first and third quartiles and ends of the vertical lines represent minima and maxima. Medians and averages are shown with middle line in the box and black filled circles, respectively. Outliers 777Data points that are more than 1.5 Interquartile Range (IQR) away from the first or third quartile are shown with with empty black circles.
We define the chance level as the expected error if participants had randomly positioned the box without the help of sonifications. The computation of the chance level is shown in Appendix section A and is equal to of the range (i.e. for the depth and for the azimuth).
To analyze the effect of sonifications on participant’s performance, we use different versions of the ANalysis Of Variance (ANOVA) [40]. An ANOVA determines whether the means of two or more distributions are different, by comparing inter- and intra-group variances. For each ANOVA, we give the F statistic 888The F statistic represents the ratio between the inter- and the intra- group variance. F is computed from the Fisher distribution and the degree of freedom of the inter- and intra- group. and the p-value 999The p-value is computed from the F statistic and represent the probability of obtaining the observed means by chance. The significance level for the ANOVAs is set with the p-value at .
A two-factors 101010Several factors ANOVAs are used for analyzing the effect of several independent variables on one outcome variable repeated measure 111111The repeated measure ANOVA is used when data are collected from the same individuals under different conditions or at different times ANOVA is used to analyze the effect of learning and sonifications on depth errors (section IV-A). One-factor repeated measure ANOVAs are used to study the effect of sonifications on depth (section IV-B,IV-C) and azimuth (section IV-B) errors. When ANOVAs are significant (i.e. ), multiple pairwise posthoc [41] t-tests are performed to determine which sonification pairs yield significant different errors. The significance level 121212Significance levels of the multiple pairwise comparisons were adjusted with the Holm method. of the pairwise comparisons are shown with gray asterisks above boxplots as follows: * for , ** for and *** for .
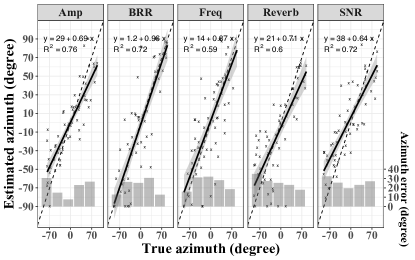
Simple linear regressions are computed to analyze to model the estimated depths or azimuths and the actual target depths (section IV-A) or azimuths (section IV-A) generated by the system. For each linear regression, we give the goodness of fit 131313 The goodness of fit is the percentage of the variance of the dependent variable explained by the linear model and the regression equation. On each linear regression figure (Figs. 4 and 6), the dashed line is the identity function (i.e. when the target depth is equal to the depth estimate). The plain black line shows the linear model. The shaded area represents the 95% confidence interval of the linear model.
IV Results
Results are reported for 28 blindfolded sighted individuals. Of the 28 participants, 14 completed the experimental stages 1 and 2 and 14 the stages 1 and 3. One participant felt sick during the experiment and completed only stage 1 and the questionnaire. Results of the first, second and third experimental stages are therefore reported for 28, 13 and 14 individuals.
IV-A stage 1, depth estimation with learning tasks
In the rest of the paper, positioning errors refer to absolute positioning errors.
We consider a sonification to have failed to encode depth for individuals when their average depth error over the 15 positioning tasks was above the chance level (). During this stage, one participant had an average error above the chance level with Amp () and Reverb (), while a second had an error level above chance with Reverb ().
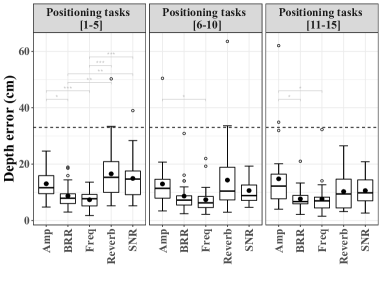
Figure 3 shows the distribution of participants’ average depth errors with each sonification after each learning task.
The two-factor repeated measure ANalysis Of Variance (ANOVA) showed a statistically significant interaction between the effect of the sonification and learning tasks on depth errors (141414Non integer degrees of freedom for the F statistic are due to the Greenhouse Geisser correction applied to adjust the non-equality of variances, which is a necessary assumption to conduct a repeated-measure ANOVA). Simple main effect analysis showed that sonifications had a significant effect on depth errors after the first (positioning tasks [1-5]) (), second (positioning tasks [6-10]) () and third (positioning tasks [11-15]) learning task (). Pairwise comparisons further indicated that (i) Freq and BRR (Beep Repetition Rate) were significantly better than the 3 other sonifications after learning task 1, (ii) Freq was significantly better than Amp after learning task 2 and (iii) Freq and BRR were significantly better than Amp after learning task 3 (Fig. 3). Freq and BRR are the most effective 2). Reverb and SNR are initially not effective but, with practice, results improve. Amp is not effective, even after practice. Smaller Interquartile ranges of depth errors obtained with Freq and BRR shows more consistency between participants’ performances with these 2 sonifications.
Simple main effect analysis also showed that learning tasks had a significant effect on depth errors with Reverb () and SNR (). Pairwise comparisons further showed that (i) Reverb led to significantly better accuracy after the learning task 3 than during after the learning task 1 () and (ii) SNR led to significantly better accuracy after learning task 2 () and 3 () than after learning task 1. This supports the idea that practice with Reverb and SNR allowed participants to increase their positioning accuracy.
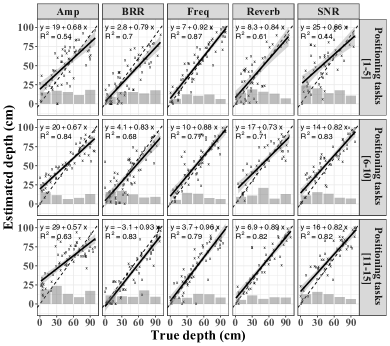
Linear regressions were estimated to model perceived depths as a function of target depths (Fig. 4). We define the depth estimation bias as the difference between the regression curve and the identity function (showed with dashed lines in Fig. 4). To compute the regressions, we removed data when a sonification failed to encode depth for one participant (i.e. when the average depth error was above the chance level).
Significant regression was found for each sonification and phase (), suggesting that estimates linearly change with target depths. Amp resulted in the largest estimation biases with a clear tendency to overestimate small depths and underestimate large depths. Freq gave the smallest estimation biases over the 3 phases. BRR, Reverb and SNR gave similar estimation biases. Except with Amp, estimation biases were smaller in phase 3 than in phases 1 and 2.
IV-B stage 2, depth and azimuth simultaneous estimation
Figure 5 presents the distribution of participants’ average depth and azimuth errors. Two had their average azimuth error over the chance level. One with Amp and SNR with an average azimuth error of and ) and one with BRR (Beep Repetition Rate) with an average azimuth error of . These participants reported to be confused by the encoding of the azimuth angle as they rather expected the cartesian coordinate (Fig. 2) of the box to be audio encoded.
Although Amp gave slightly better azimuth accuracy, close averages and large variances suggest that there were no significant differences between the sonifications (Fig. 5). This was confirmed by a repeated measure ANOVA (). This suggests that the perception of the audio encoded azimuth is independent of the depth sonification.
Depth errors were significantly higher during this stage than during the first stage. The average depth error over all sonifications and all participants was (compared to for the first stage). Five out of thirteen individuals had their mean depth errors over the chance level () with at least one of the following sonifications: Amp, Freq, Reverb and SNR. The simultaneous estimation of azimuth and depth was more difficult than depth estimation alone.
A repeated measure ANOVA showed a significant effect of the sonifications on depth errors (). Pairwise comparisons indicated that BRR gave significantly better accuracy than Reverb, SNR and Amp.
Linear regressions were computed to model the estimated azimuths as a function of the target azimuths (Fig. 6). We remove participants from the data when their average azimuth error with a sonification was above the chance level. All regressions were significant (). As for the depth in section IV-A, we define azimuth estimation biases as the difference between regression curves and the identity function. With BRR and Freq, estimates were almost unbiased. With the other sonifications, participants estimates were biased toward the center (i.e., they underestimated the magnitude of both the left and right azimuth).
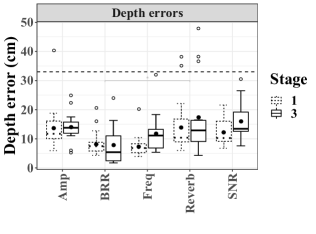
IV-C stage 3: Depth estimation after a 10 minutes break
Figure 7 displays the distribution of participants’ average depth errors for stage 3. Distributions are given for the 14 individuals who completed both stages 1 and 3. During stage 3, 3 out of 14 participants (21,4%) had their average depth errors above the chance level () with Reverb (, and ). This suggests that Reverb is not well remembered. A repeated measure ANOVA showed a significant effect of the sonifications on depth errors (). Pairwise comparisons indicated that positioning accuracy with BRR (Beep Repetition Rate) was significantly better than with Reverb. Except with BRR, sonifications led to larger positioning errors than in stage 1. With BRR, averages are similar for stages 1 and 3 and the median for stage 3 is even lower than the median for stage 1. This suggests that BRR is the easiest sonification to remember.
IV-D Qualitative feedback
The questionnaire comprised the 4 following questions:
-
•
(Easy) Were sonifications easy to use to estimate depth positions? (rate from 1: “very easy” to 5: “very difficult”)
-
•
(Pleasant) Were sonifications pleasant to listen to? (rate from 1: “very pleasant” to 5: “very unpleasant”)
-
•
(Strategy) What was your strategy to position the box? (open question)
-
•
(Natural) What sonification did you find the most natural to encode the depth? (forced choice)
Figure 8 shows participants’ answers to questions (Easy) and (Plaseant). A one-factor ANOVA showed a significant effect of the sonifications on answers to questions (Easy) () and (Pleasent) (). Pairwise comparisons showed that BRR (Beep Repetition Rate) obtained a significantly better score than Reverb and SNR for the question (Easy). This is not surprising since BRR led to overall better positioning accuracy than Reverb and SNR. For the question (Easy), Amp scores were similar to Freq scores, and not significantly higher than BRR scores. Yet, the accuracy with Amp was overall worse than with BRR and Freq. Also, only 11 out of 28 participants (39%) were more accurate with the sonification that they rated as the easiest to estimate depth positions. This suggests that a majority were not able to accurately accurately self-assess their performance.
The lower median score with Amp and BRR for question (Pleasant) suggest that individuals found these two latter sonifications more pleasant to listen to.
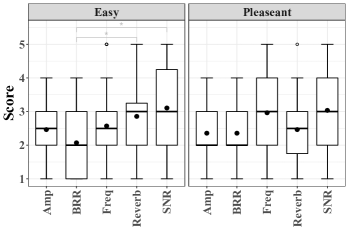
Table IV-D present answers to question (Natural). BRR had the best results with 11 participants who found it to be the most natural sonification. We hypothesized that the most natural sonification for individuals was also the one that they found the easiest to estimate depth. Sixteen out of twenty-eight participants (57%) responded that the most natural sonification was te one to which they gave the best score on question (Easy). For 12 of them (43%), there was therefore a difference between the most natural sonification and the easiest sonification. While Freq gave the best positioning errors in the first experimental stage, only 2 participants answered that it was the most natural sonification to encode depth. Finally, only 4 out of 28 (14%) had their best performance with what they found to be the most natural sonification to encode depth. This also supports the idea that individuals were not able to accurately self-assess their performance.
| BRR | Amp | SNR | Freq | Reverb | |||||||||||||
|
|
|
|
|
|
Answers to question Strategy allowed us to analyze the learning strategies. One was to memorize two or three audio encoded reference positions (e.g. closest, farthest, and middle position). Participants then used the memorized reference positions to find the target depth position by interpolation. The other was to move the box slowly and repeatedly across the depth range to hear the entire range of sound.
There were also strategies that depended on sonifications. With BRR, some participants tried to count the number of repetitions per second. With Freq, some used their knowledge of music to associate depths with musical notes.
V Discussion
Many recent sensory substitution systems use audio-encoded depth. However, no study has yet focused on the encoding of depth with sound in such systems. Our protocol was designed to evaluate 5 different sonifications of depth without the need for visual feedback. Importantly, the sonification system can be set up with any camera and a standard laptop and could be easily adapted to investigate other depth sonifications. Twenty-eight sighted blindfolded individuals completed positioning tasks using the 5 depth sonifications describe in section II-2.
All sonifications resulted in average errors that are under chance level. They are therefore all potentially viable for encoding depth in sensory substitution systems. Nevertheless, we observed significant differences that we discuss below.
V-A Comparison with studies conducted with sighted non-blindfolded participants
We compared our results to studies that have conducted research on the effectiveness of distance sonification, but with non-blindfolded participants. Those studies take place within the generic context of auditory display while we focus on sonification for sensory substitution. Despite the different contexts, we are interested in comparing the effectiveness of sonifications with and without visual feedback. This could also potentially help to better understand multi-sensory integration.
In [28], participants had to complete a one dimensional guidance task to a target location. The distance between the experimental object and a target is sonified. We sonify the distance between the user and the object. In one of their experimental setups, the authors compare the sonifications that we name Freq, BRR (Beep Repetition Rate) and Amp. Despite the differences to our experimental protocol, they also found that Freq and BRR gave better accuracy than Amp.
In [27], the distance between the hand and a central reference point is sonified. Similar to our protocol, participants were asked to perform a positioning task after a learning phase. The authors compare the sonifications that we name BRR, Freq and Reverb. Similar to our findings, Reverb gives worse accuracy than Freq and BRR. However, they found that BRR gives better performance than Freq while we found similar performance between these two sonifications. This could be explained by the use of a linear scale for Freq in their sonification design while we use a logarithmic scale (based on the Western music scale) which better fits to human perception of frequency. Moreover, they observe a strong tendency to overestimate small depths and underestimate large depths. We observe a similar but less significant effect. Indeed, the slopes of the linear regressions are closer to 1 (i.e. estimated depths were less biased) in our study. Zhang et al. [42] showed that estimated visual depths are subject to a “contraction” bias (i.e., overestimation of small depth and underestimation of large depth). Thus, it is possible that the bias exists also in the estimation and memorization of audio-encoded depths and is reinforced in [27] in which participants had visual feedback.
In [29], the distance between a cursor and line on a computer screen is sonified. Participants were also asked to perform a positioning task after a learning phase. The authors compare the sonifications that we name BRR, Freq and Amp. They found no difference in performance between the 3 sonifications while we found BRR and Freq to be significantly better than Amp. There can be several explanations. First, they used a linear scale for Freq, which could explain why Freq does not give a better accuracy than Amp. Moreover, the learning phase in their work was passive. It consisted in presenting 11 audiovisual stimuli corresponding to 11 positions equally distributed on the screen. There was no sensory-motor feedback loop, which is necessary for effective learning [43, 44]. Thus, it seems that the differences in participants’ accuracy in their work are mainly due to the memorization of audio-visual stimuli presented during learning. It could also explain why they did not observe differences between sonifications.
V-B Additional findings
We found BRR to be the easiest sonification to remember. It is possible that with a longer learning period, the other sonifications would have been memorized in the same way. However, in accordance with Dakopoulos et al. [45], a sensory subsititution device should not require a long learning time. BRR therefore seems to be a promising sonification since it is well memorized without the need for a long learning period. Moreover, we found that BRR gives the best accuracy when depth and azimuth are simultaneously sonified.
With the exception of Amp, the sonifications resulted in estimates with low biases. The large estimation biases obtained with Amp can be explained by the work of Poulton [46], who shows that the quantitative judgment of loudness follows a contraction bias (i.e. an overestimation of soft sounds and underestimation of loud sounds).
Qualitative feedback shows that a majority of participants found BRR to be the most natural and the easiest sonification to encode depth. BRR is present in everyday life and individuals are already used to this type of sound. A significant portion of the participants (25%) found SNR to be the most natural way to encode depth. Participants may have naturally associated this sonification with the visual atmospheric perspective. Atmospheric perspective refers to the less detailed appearance of distant objects due to particles and air between the distant objects and the eyes. Also, a congenitally blind person with whom we had informal discussions about our depth sonifications noted that SNR gives two cues for estimating depth: the volume of noise and the volume of sinusoidal sound. It would be worthwhile to further investigate this sonification.
V-C Differences in effectiveness of sonifications
The positioning accuracy is bounded by the smallest change in depth required to perceive differences in the sonification sounds. This is related to Just Noticeable Differences (JNDs) of each sonification, which are the smallest changes in sound parameters that can be perceived by the auditory system. Parseihian et al. [28] suggest that JNDs might predict the effectiveness of sonifications (small JNDs would give a better effectiveness). We conducted an online audio experiment 151515the experiment is available at: https://openprocessing.org/sketch/1536387 to estimate the minimum depth differences required to perceive distinct sounds. For each sonification, we first played a sound corresponding to a depth and we then played a sound corresponding to a depth , with . Parameter ranges of the online experiment are identical to those of the main experiment. Pairs of sounds were successively presented and listeners had to label the second sound as being different or equivalent to the first sound. was chosen according to a staircase procedure [47]: if the participant’s answer was correct, was reduced and if not, was increased. The procedure was stopped after 20 trials or when participants alternately answered right then wrong 5 times in a row. JNDs were computed as being the mean depth from the 5 last trials. Ten new listeners were recruited for the online experiment. We estimated JNDs for two depths and . Results are in Table V-C.
| Amp | BRR | Freq | Reverb | SNR | |
Freq gives the smallest JNDs. Therefore, it could explain why Freq gives better accuracy than the other sonifications. However, this does not explain why BRR and Freq resulted in similar accuracy. Also, while Amp, Reverb and SNR produced better JNDs around low depths, positioning errors with theses sonifications are higher or similar around low depths than around large depths (see the distribution of errors represented with grey barplots on Fig. 4 page 4). This leads us to conclude that JNDs alone cannot explain differences between sonifications. Accuracy difference could also come from the natural association between depth perception and sound parameters, named cross-modal correspondences (CMCs). CMCs have already proven to be the basis for effective human machine interfaces [25, 24]. Some of these correspondences may emerge from regular exposure in everyday life [48]. BRR is a sonification often used in our daily experience in alarm systems to warn of approaching dangers (e.g. in rear view cameras in cars). This could also explain why a good positioning accuracy is obtained with BRR. Differences could also arise from the potential of the sonifications to develop effective strategies. For example, some participants reported trying to count the number of repetitions per second with BRR, which may be easier to remember and to quantify than other sound parameters.
V-D Guidelines for depth sonification
BRR (Beep Repetition Rate) gives a good accuracy with an unbiased representation of the depth, was the easiest to remember and has good qualitative feedback. Freq also gives good accuracy but is not as easy to remember and participants do not find it a natural sound to encode depth. Although the amplitude of a sound and its reverberations are natural cues used by the brain to estimate distance from the sound source, participants were less accurate with the sonifications Amp and Reverb. Moreover, Amp gives a biased representation of the depth and Reverb received poor qualitative feedback. Finally, even if SNR yields less accuracy than BRR and Freq, participants rated it as a natural sonification to encode depth and it gives a low bias representation of the depth. We therefore believe that this sonification should be investigated further and could be a viable design choice.
Our results lead us to recommend using BRR for depth sonification. However it may not be possible to use BRR (e.g. if it is already used to encode another visual dimension). In this case, we would recommend to use Freq if the task requires accuracy. If not, SNR could also be a good alternative which feels natural for participants. Finally, we do not recommend Amp or Reverb.
V-E Limitations of the work
The experiments were conducted with blindfolded sighted participants. Late blind people maintain their spatial abilities and spatial cognitive map from their early visual experiences [49]. They also adopt similar strategies to those used by sighted people when performing spatial tasks [50, 51]. Therefore, we are confident that results should hold with late blind people. We also conducted a pilot study with a congenitally blind participant who had overall similar results to the blindfolded sighted participants (e.g. the congenitally blind participant was also more accurate with BRR and Freq). In the future, it would be interesting to compare our results with other experiments conducted with late-blind individuals and with more congenitally blind individuals.
The five depth sonifications were evaluated for hand-reachable depths. Our results can therefore be used as such for systems which assist blind users to speed up the process of finding and grasping objects in front of them.
Differences in accuracy between sonifications are possibly partially explained by the JNDs (see section V-C) of the sound parameters. Using the same sonification parameters over a larger depth range could therefore result in larger errors with a similar order of accuracy between sonifications. Beyond the hand reachable area, the accuracy is however less critical. The information would be used to either get into the hand reachable area of the object, or to avoid it. This is supported by Pressl and Wiesel [52], who suggest that a SSVA device dedicated to navigation should encode the position of an object with an accuracy of 1 meter (or less) in order to reach it with a cane or with the hands.
In future works, it would be necessary to verify if sonfications (and particularly BRR which was the best for short depth range sonification) allow for accuracy of 1 meter or less over larger depths. It would also be interesting to compare the potential of the different sonifications to encode the depth of multiple objects at the same time.
VI Conclusion
Vision to audition sensory substitution devices that rely on depth sensors are a promising new tool for assisting blind people to sense their environment. A key challenge in the design of such systems is to define meaningful and intuitive association rules between visual features and sounds. In this work, we quantify the effectiveness of five sonifications of depth based on either loudness, reverberation, frequency, repetition rate of beeps or the signal-to-noise ratio of a pure tone mixed with white noise.
Overall, the repetition rate of beeps is the best both quantitatively (positioning accuracy and memorability) and qualitatively (participants find it the most natural to encode depth). The sonification based on sound frequency provides good accuracy but participants did not find a natural fit to encode depth. The mixture of a pure tone with white noise received good qualitative feedback and could also be considered.
Appendix A Computation of the chance level
We compute the expected absolute postionning error under the assumption that participants would have estimated the object’s position by chance (i.e. without using the sonification). Under this assumption, the target position as generated by the system and the position estimated by the participant would be uniformly distributed within the position range and would follow the probability density function:
| (2) |
The absolute positioning error is:
| (3) | ||||
| (4) |
Still with the same assumption, we can assume that and are independent. We therefore compute the joint probability density function as:
| (5) | ||||
| (6) |
The expectation of the positioning error is :
| (7) | ||||
| (8) | ||||
| (9) | ||||
| (10) | ||||
| (11) |
Acknowledgment
NSERC-CRSNG for funding this research. The members of the NECOTIS research group for proofreading the paper. The participants, I. Balafrej, E. Richan and the members of the NECOTIS research group for testing and providing feedbacks. François Côté for the fruitful discussions on the blind community and providing feedbacks on the sonifications.
References
- [1] G. Kramer, Auditory display: sonification, audification and auditory interfaces. Santa Fe Institute (Santa Fe, N.M.), 1994.
- [2] A. D. Edwards, “Auditory display in assistive technology,” in The sonification handbook. Berlin: Logos Verlag, 2011.
- [3] M. Auvray, S. Hanneton, and J. K. O’Regan, “Learning to perceive with a visuo-auditory substitution system: Localisation and object recognition with the vOICe,” Perception, vol. 36, no. 3, pp. 416–430, 2007.
- [4] M. Proulx et al., “Seeing ‘where’ through the ears: Effects of learning-by-doing and long-term sensory deprivation on localization based on image-to-sound substitution,” PLOS ONE, vol. 3, pp. 1–8, Mar 2008.
- [5] D. Brown, T. Macpherson, and J. Ward, “Seeing with sound? exploring different characteristics of a visual-to-auditory sensory substitution device,” Perception, vol. 40, no. 9, pp. 1120–1135, 2011.
- [6] L. Renier and A. G. D. Volder, “Vision substitution and depth perception: Early blind subjects experience visual perspective through their ears,” Disability and Rehabilitation: Assistive Technology, vol. 5, no. 3, pp. 175–183, 2010.
- [7] B. Durette et al., “Visuo-auditory sensory substitution for mobility assistance: testing the vibe,” in Workshop on Computer Vision Applications for the Visually Impaired, Marseille, France, Oct 2008.
- [8] S. Hanneton, M. Auvray, and B. Durette, “The vibe: a versatile vision-to-audition sensory substitution device,” Applied Bionics and Biomechanics, vol. 7, no. 4, pp. 269–276, Sep 2010.
- [9] C. Stoll et al., “Navigating from a depth image converted into sound,” Applied bionics and biomechanics, vol. 2015, 2015.
- [10] M. Brock and P. O. Kristensson, “Supporting blind navigation using depth sensing and sonification,” in Proceedings of the ACM Conference on Pervasive and Ubiquitous Computing, New York, NY, USA, 2013.
- [11] D. Massiceti, S. L. Hicks, and J. J. van Rheede, “Stereosonic vision: Exploring visual-to-auditory sensory substitution mappings in an immersive virtual reality navigation paradigm,” PLOS ONE, vol. 13, no. 7, pp. 1–32, 07 2018.
- [12] A. Neugebauer et al., “Navigation aid for blind persons by visual-to-auditory sensory substitution: A pilot study,” Plos one, vol. 15, 2020.
- [13] K. Yang et al., “Expanding the detection of traversable area with realsense for the visually impaired,” Sensors, vol. 16, no. 11, p. 1954, 2016.
- [14] ——, “Long-range traversability awareness and low-lying obstacle negotiation with realsense for the visually impaired,” in Proceedings of the International Conference on Information Science and System, 2018, pp. 137–141.
- [15] E. Milios et al., “Sonification of range information for 3-d space perception,” IEEE Transactions on Neural Systems and Rehabilitation Engineering, vol. 11, no. 4, pp. 416–421, 2003.
- [16] A. Aladren et al., “Navigation assistance for the visually impaired using rgb-d sensor with range expansion,” IEEE Systems Journal, vol. 10, no. 3, pp. 922–932, Sep 2016.
- [17] P. Skulimowski et al., “Interactive sonification of u-depth images in a navigation aid for the visually impaired,” Journal on Multimodal User Interfaces, Nov 2018.
- [18] Z. Li et al., “A wearable device for indoor imminent danger detection and avoidance with region-based ground segmentation,” IEEE Access, vol. 8, pp. 184 808–184 821, 2020.
- [19] S. Kayukawa et al., “Bbeep: A sonic collision avoidance system for blind travellers and nearby pedestrians,” in Proceedings of the 2019 CHI Conf. on Human Factors in Computing Systems. Association for Computing Machinery, 2019.
- [20] J. Bai et al., “Wearable travel aid for environment perception and navigation of visually impaired people,” Electronics, vol. 8, no. 6, 2019.
- [21] F. Ribeiro et al., “Auditory augmented reality: Object sonification for the visually impaired,” in 2012 IEEE 14th International Workshop on Multimedia Signal Processing (MMSP), Sep. 2012, pp. 319–324.
- [22] Hamilton-Fletcher et al., “Soundsight: a mobile sensory substitution device that sonifies colour, distance, and temperature,” Journal on Multimodal User Interfaces, pp. 1–17, 2021.
- [23] Kristjánsson et al., “Designing sensory-substitution devices: Principles, pitfalls and potential,” Restorative neurology and neuroscience, vol. 34, no. 5, pp. 769–787, 2016.
- [24] A. Tsiros, “The parallels between the study of crossmodal correspondence and the design of cross-sensory mappings,” Electronic Visualisation and the Arts (EVA 2017), pp. 175–182, 2017.
- [25] G. Hamilton-Fletcher, T. D. Wright, and J. Ward, “Cross-modal correspondences enhance performance on a colour-to-sound sensory substitution device,” Multisensory research, vol. 29, no. 4-5, pp. 337–363, 2016.
- [26] C. Spence, “Crossmodal correspondences: A tutorial review,” Attention, Perception, & Psychophysics, vol. 73, no. 4, pp. 971–995, 2011.
- [27] G. Parseihian, B. Katz, and S. Conan, “Sound effect metaphors for near field distance sonification,” Proceedings of ICAD 2012, pp. 6–13, 2012.
- [28] G. Parseihian et al., “Comparison and evaluation of sonification strategies for guidance tasks,” IEEE Transactions on Multimedia, vol. 18, no. 4, pp. 674–686, 2016.
- [29] P. Bazilinskyy et al., “Sonifying the location of an object: A comparison of three methods,” 13th IFAC Symposium HMS 2016, vol. 49, no. 19, pp. 531 – 536, 2016.
- [30] M. Auvray et al., “There is something out there: Distal attribution in sensory substitution, twenty years later,” Journal of integrative neuroscience, vol. 4, no. 04, pp. 505–21, 2005.
- [31] P. Zahorik, D. S. Brungart, and A. W. Bronkhorst, “Auditory distance perception in humans: A summary of past and present research,” ACTA Acustica united with Acustica, vol. 91, no. 3, pp. 409–420, 2005.
- [32] A. J. Kolarik, B. C. Moore, P. Zahorik, S. Cirstea, and S. Pardhan, “Auditory distance perception in humans: a review of cues, development, neuronal bases, and effects of sensory loss,” Attention, Perception, & Psychophysics, vol. 78, no. 2, pp. 373–395, 2016.
- [33] J. Plazak et al., “Distance sonification in image-guided neurosurgery,” Healthcare Technology Letters, vol. 4, 08 2017.
- [34] J. McCartney, “Rethinking the computer music language: Supercollider,” Computer Music Journal, vol. 26, no. 4, pp. 61–68, 2002.
- [35] E. Olson, “Apriltag: A robust and flexible visual fiducial system,” in Proceedings of ICRA 2011. IEEE, May 2011, pp. 3400–3407.
- [36] “Normal equal-loudness-level contours,” Acoustics International Organization for Standardization, ISO 226:2003, 2003.
- [37] M. R. Schroeder and B. F. Logan, “” colorless” artificial reverberation,” IRE Transactions on Audio, no. 6, pp. 209–214, 1961.
- [38] J. O. Smith, Physical Audio Signal Processing, accessed 2021-01-11, ch. Free Verb, online book, 2010 edition. [Online]. Available: http://ccrma.stanford.edu/~jos/pasp/
- [39] J. A. Rice, Mathematical statistics and data analysis. Thomson Higher Education, 2006, ch. 10, Summarizing Data, pp. 402–404.
- [40] D. A. Kenny, Statistics for the social and behavioral sciences. Little, Brown and Compagny, 1986, ch. One-Way Analysis of Variance, pp. 225–269.
- [41] ——, Statistics for the social and behavioral sciences. Little, Brown and Compagny, 1986, ch. Post Hoc Tests, pp. 237–238.
- [42] K. Zhang, D. Gao, and J. Qian, “Overestimation and contraction biases of depth information stored in working memory depend on spatial configuration,” British Journal of Psychology, vol. 112, no. 1, pp. 230–246, 2021.
- [43] A. Noë, “Precis of action in perception,” PSYCHE: An Interdisciplinary Journal of Research On Consciousness, vol. 12, 2006.
- [44] S. Maidenbaum, S. Abboud, and A. Amedi, “Sensory substitution: closing the gap between basic research and widespread practical visual rehabilitation,” Neuroscience & Biobehavioral Reviews, vol. 41, 2014.
- [45] D. Dakopoulos and N. G. Bourbakis, “Wearable obstacle avoidance electronic travel aids for blind: A survey,” IEEE Transactions on Systems, Man, and Cybernetics, vol. 40, no. 1, pp. 25–35, Jan 2010.
- [46] E. C. Poulton, “Models for biases in judging sensory magnitude.” Psychological bulletin, vol. 86, no. 4, p. 777, 1979.
- [47] T. N. Cornsweet, “The staircase-method in psychophysics,” The American Journal of Psychology, vol. 75, no. 3, pp. 485–491, 1962.
- [48] C. Parise and C. Spence, “Audiovisual cross-modal correspondences in the general population.” 2013.
- [49] G. Dormal, F. Lepore, and O. Collignon, “Plasticity of the dorsal “spatial” stream in visually deprived individuals,” Neural plasticity, 08 2012.
- [50] S. Ungar, “Cognitive mapping without visual experience,” Cognitive mapping: past, present, and future, vol. 4, p. 221, 2000.
- [51] A. Pasqualotto et al., “Visual experience facilitates allocentric spatial representation,” Behavioural Brain Research, vol. 236, 2013.
- [52] B. Pressl and M. Wieser, “A computer-based navigation system tailored to the needs of blind people,” in International Conference on Computers for Handicapped Persons. Springer, 2006, pp. 1280–1286.