[type=editor, style=english, orcid=0000-0002-9367-0892] \fnmark[1] url]https://sites.google.com/view/sunjian/home
1]organization=Department Of Computer Science, University of Denver, addressline=2155 E Wesley Ave, city=Denver, state=Colorado, postcode=80210, country=United States of America
[orcid=0000-0001-7290-8307] \fnmark[2] 2]organization=Department Of Neurology at Harvard Medical School, Harvard University, addressline=Massachusetts General Hospital, 55 Fruit St, city=Boston, state=Massachusetts, postcode=02114, country=United States of America url]https://dodgelab.wixsite.com/dodge-lab
[orcid=0000-0001-8923-4660]
\cormark[1]
3]organization=Department Of Computer Engineering, University of Denver,
addressline=2155 E Wesley Ave,
city=Denver,
state=Colorado,
postcode=80210,
country=United States of America
\fnmark[3]
\cortext[cor1]Corresponding author: Dr.Mohammad H. Mahoor
Tel: +1-303-871-3745 | Fax: +1-303-871-2194
url]http://mohammadmahoor.com
MC-ViViT: Multi-branch Classifier-ViViT to Detect Mild Cognitive Impairment in Older Adults Using Facial Videos
Abstract
Deep machine learning models including Convolutional Neural Networks (CNN) have been successful in the detection of Mild Cognitive Impairment (MCI) using medical images, questionnaires, and videos. This paper proposes a novel Multi-branch Classifier-Video Vision Transformer (MC-ViViT) model to distinguish MCI from those with normal cognition by analyzing facial features. The data comes from the I-CONECT, a behavioral intervention trial aimed at improving cognitive function by providing frequent video chats. MC-ViViT extracts spatiotemporal features of videos in one branch and augments representations by the MC module. The I-CONECT dataset is challenging as the dataset is imbalanced containing Hard-Easy and Positive-Negative samples, which impedes the performance of MC-ViViT. We propose a loss function for Hard-Easy and Positive-Negative Samples (HP Loss) by combining Focal loss and AD-CORRE loss to address the imbalanced problem. Our experimental results on the I-CONECT dataset show the great potential of MC-ViViT in predicting MCI with a high accuracy of 90.63% accuracy on some of the interview videos.
keywords:
Deep Learning, \sepFacial Expression Features, \sepInter- and Intra-class imbalance, \sepMild Cognitive Impairment, \sepMulti-branch Classifier, \sepTransformer, ViViT.1 Introduction
Alzheimer’s disease (AD) and related dementias (ADRD) are national public health issues with pervasive challenges for older adults, their families, and caregivers. ADRD is not only ranked as the sixth-leading cause of death in the U.S., but the COVID-19 pandemic has increased the number of deaths among those with AD (Alzheimer’s_Association, 2021). Symptoms of AD/ADRD usually begin with Mild Cognitive Impairment (MCI) and include early onset memory loss, cognitive decline, and impairments with verbal language and visual/spatial perception. Approximately 12-18% of people age 60 or older are living with MCI in the U.S. Although older adults with MCI have the ability to independently perform most daily living activities such as eating, shopping, and bathing without help, the National Institute on Aging (NIA) estimated that 10 to 20% of subjects with MCI will develop dementia over a one-year period (National_Institute_on_Aging, 2021).
Magnetic Resonance Imaging (MRI) & Positron Emission Tomography (PET) scanning and neuropsychic examination are often used for identifying those with AD and dementia. These methods prove to be challenging for early MCI individuals given that the brain’s structural changes and cognitive test results at this point might be harder to differentiate from those with normal cognitive aging and the invasive nature of these assessments (Tang et al., 2020). Using accurate, non-invasive, and cost-efficient diagnostic technology has the potential to bolster the early detection of MCI and AD. A 2019 study proposed that early detection of AD would decrease healthcare costs, and improve quality of life (Eikelboom et al., 2019). Studies have shown that MCI can affect the patterns of speech, language, and face-to-face communication in older adults (Liu et al., 2022a). There are several studies on using traditional Machine Learning (ML) approaches such as Decision Tree (Neelaveni & Devasana, 2020; Davuluri1 & Rengaswamy, 2020) and K-means clustering (Davuluri1 & Rengaswamy, 2020) to detect AD with a human using collected demographic information (Neelaveni & Devasana, 2020) and MRI (Davuluri1 & Rengaswamy, 2020). Other researchers used Cross-model Augmentation for automated detection of MCI from normal cognition (NC) using speech and language patterns (Liu et al., 2022a). However, there is fewer work on using ML models and particularly Deep Learning models for facial video analysis and then automated detection of MCI using visual features. This paper presents our recent work on developing and using Transformer-based models for the detection of MCI using facial videos collected in the Internet-Based Conversational Engagement Clinical Trial (I-CONECT) Study project111Website: https://www.i-conect.org/. (Carr, 2019; Yu et al., 2021; Wu et al., 2022) (Clinicaltrials.gov #: NCT02871921). I-CONECT Study is a randomized controlled behavioral intervention trial aimed to enhance cognitive functions by providing frequent social interactions using video chats. Semi-structured 30-minute conversations with interviewers were provided 4 times per week for 6 months to older adults. The study was funded by the National Institute on Aging (NIA).
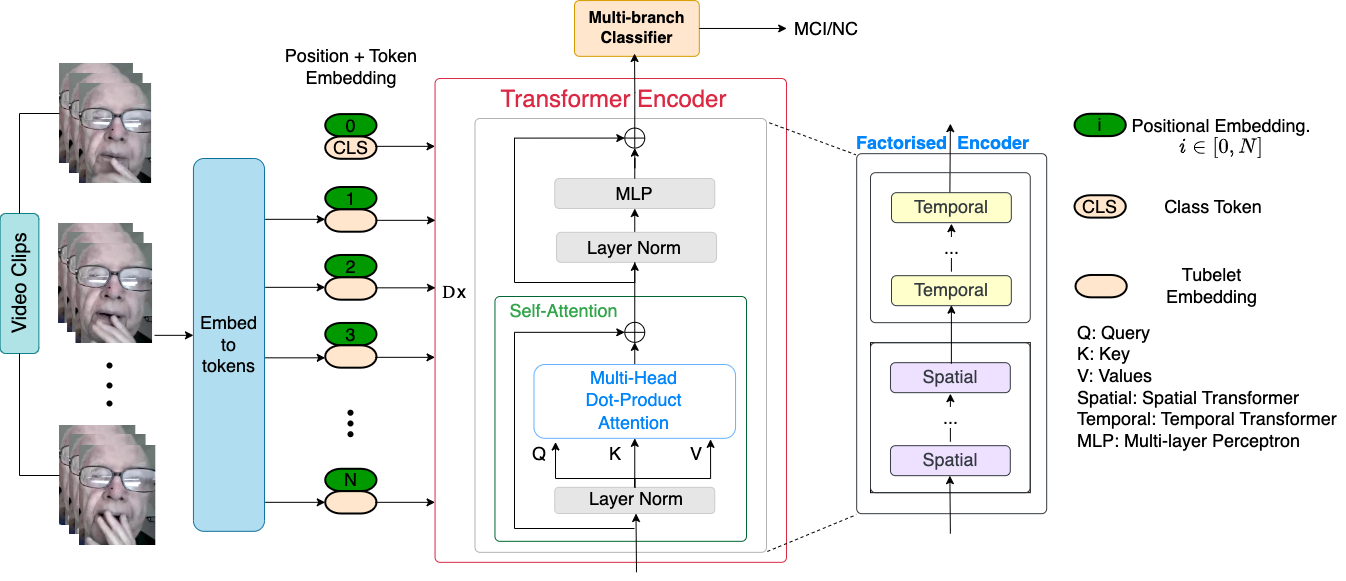
MC-ViViT takes tubelet embedding to divide the video clips into cubes and loads these cubes into Transformer Encoder sequentially. Then, Transformer Encoder takes Factorised Encoder to extract spatio-temporal features. Finally, the output features go into Multi-branch Classifier to finish classification.
Facial videos contain spatial features like facial expressions and head poses. It can also capture facial expression change, track eye gaze motion, head pose movement, and lips activity, which are the temporal features and the key patterns in verbal and non-verbal communication (Tanaka et al., 2019; Nam et al., 2020). We hypothesize that facial videos collected during face-to-face communication in social settings can provide rich information for the detection of MCI from NC subjects. To capture facial features out of facial videos, we develop a variant of the Video Vision Transformer-based model (ViViT (Arnab et al., 2021)). This model takes Vision Transformer (ViT) (Dosovitskiy et al., 2020) as its backbone and captures spatio-temporal features. ViViT has proven its value on Facial Expression Recognition (FER) (Huang et al., 2021) and violence detection (Singh et al., 2022).
The I-CONECT dataset has both inter- and intra-class variations, which makes it a challenging video dataset. First, it is an imbalanced dataset as the distributions of MCI and NC subjects are uneven. This makes the dataset inter-class imbalance (aka Hard-Easy sample problem). The intra-class imbalanced issue happens within each class as the I-CONECT dataset consists of videos in different lengths. Also, the quality of the videos in I-CONECT may vary from subject to subject. The occlusion and lightness problems in the videos decrease the quality of extracted spatio-temporal features. Furthermore, some subjects may not behave any symptoms of MCI, and act like NC in some video clips, which restricts ViViT from extracting enough MCI-related features. This is the so-called Positive-Negative sample problem.
To address these problems, we propose a Multi-branch Classifier (MC) module to augment the representation capability of ViViT. The proposed MC has four levels of Fully Connected (FC) layers, whereas the third one has 4 branches. MC provides more features but gives all features identical weight. Purely depending on MC contributes limitedly to the accuracy. We decide to assign different weights to features and classes while computing loss. Subsequently, we combined Focal loss (Lin et al., 2017) and AD-CORRE loss (Fard & Mahoor, 2022) into the loss function for Hard-Easy and Positive-Negative Samples (HP loss) to relief the negative effect of inter- and intra-class imbalanced issues. Specifically, the Focal Loss is responsible for the Hard-Easy sample problem, while AD-CORRE loss (Fard & Mahoor, 2022) handles the Positive-Negative sample problem.
In summary, we present a new model called Multi-branch Classifier-ViViT (MC-ViViT), by integrating the aforementioned ViViT, MC, and HP Loss. We validated MC-ViViT on several themes of the I-CONECT dataset. Our experimental results show that MC-ViViT is highly capable to detect MCI from NC subjects.
The overall contributions are summarized as follows:
-
•
We propose MC-ViViT to detect MCI from the interview videos provided by the I-CONECT Study.
-
•
We design the MC module to enrich the extracted spatio-temporal features. Its multi-branch structure helps ViViT to capture the visual features from different perspectives.
-
•
We develop the HP loss by combining Focal loss and AD-CORRE loss. The HP loss addresses the inter- and intra-class imbalanced issues and helps the model pay attention to classes with less samples and subjects with short video lengths.
The remainder of this paper is organized as follows. In Section 2, we discuss the previous works on analyzing and recognizing facial expressions and patterns of MCI people in videos using machine learning approaches. We also review the methods for augmenting features and handling Inter- and Intra-class imbalanced problems. Then, in Section 3, we present our new proposed model, including Tubelet Embedding, Factorised Encoder, Multi-branch Classifier, and HP Loss. Section 4 gives the details of our experiments including the dataset, data processing, evaluation metrics, implementation, results, discussion, and the ablation study. We finally conclude the paper with some suggestions for future research in Section 5.
2 Related Work
2.1 Detection of Mild Cognitive Impairment (MCI) Using Machine Learning Methods
Detection of MCI in older adults using innovative machine learning approaches has received great attention in the research community (Cavedoni et al., 2020). It is known that cognitive impairment and dementia adversely affect people’s verbal and nonverbal behaviors, memory, cognitive functions, etc. Since the focus of this paper is on the detection of MCI using nonverbal visual patterns and behaviors expressed in facial videos of older adults using deep machine learning methods, we review the literature on using ML methods for the detection of MCI. Some researchers have utilized traditional ML approaches to detect MCI or more advanced stages of cognitive impairment such as Alzheimer’s disease and dementia. ML methods such as Support Vector Machines (SVM), Decision Trees, PCA+SVM, K-means cluster, hierarchical clustering, and Density-based spatial clusters of applications with noise (DBSCAN) (Asim et al., 2018; Neelaveni & Devasana, 2020; Davuluri1 & Rengaswamy, 2020; Pang et al., 2023; de Mendonça et al., 2023) are the most common algorithms used in this domain.
Some researchers have exploited deep learning models to detect MCI and dementia, such as CNN models with Inception modules (Ding et al., 2019), linking a fully convolutional network (FCN) to a traditional multilayer perceptron (MLP) (Qiu et al., 2020), Inception-ResNet-V2 (Lu et al., 2021), and CNN-based models (Salehi et al., 2020; Poloni et al., 2022; De & Chowdhury, 2021; de Mendonça et al., 2023).
Researchers have proposed that cognitive impairment and AD causes severe face recognition deficits and emotion detection deficits (Sapey-Triomphe et al., 2015; Martinez et al., 2018; Torres Mendonça De Melo Fádel et al., 2019; Dourado et al., 2019; Mazzi et al., 2020; Meléndez et al., 2020; Gil & Arroyo-Anlló, 2021). They collected the reaction of participants to specific emotions to estimate the degree of recognition deficits, which is a kind of MCI.
The aforementioned work did experiments on either brain Magnetic Resonance Imaging (MRI) scans, CT scans, and X-ray Scans (Islam & Zhang, 2018; Asim et al., 2018; Ding et al., 2019; Davuluri1 & Rengaswamy, 2020; Salehi et al., 2020; Mazzi et al., 2020; Rehouma et al., 2021; Mercioni & Stavarache, 2022; Lu et al., 2021; Poloni et al., 2022; De & Chowdhury, 2021; de Mendonça et al., 2023) or demographic information, patient interviews, and structured datasets that are available on line (Sapey-Triomphe et al., 2015; Asim et al., 2018; Martinez et al., 2018; Torres Mendonça De Melo Fádel et al., 2019; Dourado et al., 2019; Neelaveni & Devasana, 2020; Davuluri1 & Rengaswamy, 2020; Qiu et al., 2020; Mazzi et al., 2020; Gil & Arroyo-Anlló, 2021; Hammoudeh et al., 2022; Pang et al., 2023). Collecting brain MRI and CT Scans are expensive. Other data modalities such as demographic information, patient interviews, and online structured datasets contain less complex, subtle, and subjective features. On the other hand, audiovisual collected during social interviews and face-to-face communication either in person or virtually contain rich verbal and nonverbal information.
Some researchers (Nam et al., 2020) video recorded the reaction of participants to different commands and introduced eye gaze and head pose in their study. Jiang et al. (2022) indicated the influence of eye-tracking on predicting cognitive impairment too. Tanaka et al. (2019) filmed the video during the human-agent interaction and considered action units, eye gaze, and lip activity in the study. It asked three fixed queries: Q1) What’s the date today?, Q2) Tell me something interesting about yourself, Q3) How did you come here today? Then, Fei et al. (2019) argued that extracting facial features in dynamic approaches benefits analyzing the evolution of facial expressions and getting spatio-temporal features. It also showed different facial feature extraction techniques, such as Geometric, Appearance, Holistic, and Local. Finally, Umeda-Kameyama et al. (2021) explored the capability of Xception and other CNN-based models to distinguish between people with cognitive impairment and those without dementia. Intuitively, our work explores the feasibility of an advanced deep learning model to predict MCI on the I-CONECT dataset.
2.2 Facial Video Analysis Using Deep Neural Models
Automated analysis of facial videos using deep machine learning and computer vision has been studied in the last decades. The applications vary from facial expression recognition (FER) (Jin et al., 2020; Liu et al., 2021a; Khan et al., 2017), surveillance (Patrikar & Parate, 2022; Ling et al., 2021; Song et al., 2022), pose estimation (Liu et al., 2022c; Sümer et al., 2021), head gesture recognition (Khan et al., 2022; Gashi et al., 2021; Li et al., 2022; Xia et al., 2022), medical applications (Sonawane & Sharma, 2021; Sibley et al., 2021; Villa et al., 2021), among others. This section presents related works that used deep neural network-based algorithms for facial video analysis.
When it comes to FER, some works used the traditional technique of converting videos into frames. For example, Liu et al. (2021b) compressed videos into an apex frame by the encoding algorithm. Jin et al. (2020) simply cut videos into images, but it enriched features by using facial landmark points. Loading videos directly is another method. FER-GCN (Liu et al., 2021a), TimeSformer (Mohan & Popa, 2021), and three-stream network (Kim et al., 2022) simulated to analyze the video directly by taking multi frames as input. They stated that a sequence-based model helps extract temporal features. Based on multi frames, some researchers implemented a multi-frame optical flow method to get the difference between two frames (Pan et al., 2020; Liang et al., 2021). They claimed that multi-frame optical flow enriched temporal features. The aforementioned studies defended their idea with good experimental results. Furthermore, Jin et al. (2020) focused on diagnosing Parkinson’s Disease (PD), which inspires us to believe that Deep Learning-based models are able to detect MCI.
Using more deep neural methods, Transformer-based models utilize modules to help capture spatio-temporal features in one stream, such as Convolutional Spatiotemporal Encoding layer from TimeConvNets (Hou Lee & Wong, 2020) and Temporal Shift Module (TSM) from TimeSformer (Mohan & Popa, 2021) and ViViT-B/16×2 FE (Arnab et al., 2021) (A ViT-Base backbone with a tubelet size of , FE represents factorized encoder). Other works utilized spatial-only attention and temporal-only attention consecutively to extract spatio-temporal features in one branch (Mohan & Popa, 2021; Bulat et al., 2021; Liu et al., 2022d).
On the other hand, CNN-based models usually take multi-stream structure to extract spatio-temporal features separately, such as deep temporal–spatial networks (Pan et al., 2020), TMSAU-Net (Liang et al., 2021), and three-stream network (Kim et al., 2022). These models take optical flow, frame difference, and motion vector methods to help create temporal information instead of learning from the raw images through the model. Models with 3D Convolutional operation can extract spatio-temporal information in one stream, but their large hyperparameter scale improves computational complexity.
Comprehensively, to avoid the extra operation and implement the model thoroughly and efficiently, this research selected ViViT FE as the backbone of the proposed model.
2.3 Feature Enrichment using MLP Head
Inception Net (Szegedy et al., 2015) is a classic CNN model. It consists of repeated Inception Modules, which apply various scaled filters to extract features on the same layer and broaden the network. The advantage of the Inception Module is to enrich the features. Multi-models also help augment representation and improve accuracy. Moreover, some researchers have shown the effect of multi-models on MCI detection (Zhang et al., 2019; Lee et al., 2019; Liu et al., 2020; Kang et al., 2021; Naz et al., 2022). In addition, a good Fully Connected layer benefits the model performance, such as XnODR and XnIDR (Sun et al., 2021). The Inception Net and multi-models inspired the design of the Multi-branch Classifier (MC) (see Section 3.3).
2.4 Inter-class and Intra-class Imbalanced Problems
Inter-class and intra-class imbalanced problems usually prevent ML models from predicting well. In (He et al., 2019) the authors explained that the inter-class imbalanced problem occurs when the number of samples in some classes is much larger than those in other classes, which causes the misclassification of rare class examples. The intra-class imbalanced dataset means that a class consists of several sub-concepts or sub-clusters. Moreover, at least one of the concepts or clusters is represented by a significantly less number of samples than the others (He et al., 2019). The number of features from each sub-concept are unequal, which weakens the performance of classifier (Sampath et al., 2021).
Focal Loss is powerful to equalize inter-class imbalanced datasets (Lin et al., 2017). Moreover, classes with more features are easier to detect than those with less features. This is also called the Hard-Easy sample problem. To address the intra-class imbalanced issue, researchers have proposed methods such as feature selection (He et al., 2019), resampling (He et al., 2019; Liu et al., 2021c), and designing loss function (Farzaneh & Qi, 2020; Ngo & Yoon, 2020; Farzaneh & Qi, 2021; Fard & Mahoor, 2022). For example, EPIMTS (early prediction on the imbalanced multivariate time series) fused feature selection and resampling, which calls MUDSG to resample based on the extracted core shapelets (He et al., 2019). Liu et al. (2021c) utilized Soft Hard Example Mining (SHEM) to re-balance the error density distribution. To achieve intra-class balancing, they assigned instance-wise sampling probabilities according to the prediction of the current ensemble model (Liu et al., 2021c). Other works focus on upgrading loss function. They proposed Discriminant Distribution-Agnostic loss (DDA loss) (Farzaneh & Qi, 2020), Weighted Center Loss (WCL) (Ngo & Yoon, 2020), Deep Attentive Center Loss (DACL) (Farzaneh & Qi, 2021), and Quadruplet loss (Tian et al., 2021). These loss functions are tightly related to center loss. The goal of these methods is to achieve intra-class compactness and inter-class separation. The AD-CORRE loss presented in (Fard & Mahoor, 2022) aims to handle inter- and intra-class imbalanced issues, but it focuses on addressing the problem by digging the correlation between embeddings in the mini-batch level. Then, it embeds the influence of whole training samples into batches incrementally instead of directly (Fard & Mahoor, 2022). This has less computational cost.
In the I-CONECT dataset, the number of samples with MCI is apparently more than that with NC. Thus, subjects labeled in MCI are easy samples, while those labeled in NC are hard ones. To emphasize and increase the weight of NC, we apply Focal Loss to address the Hard-Easy sample problem.
Within each class, the number of frames from each video is unequal. This is particularly important as interviewees with MCI may behave cognitively normal sometimes or show the symptoms of MCI in other parts of the video. The proportion of normal and symptom parts is imbalanced and skewed too. This can affect the accuracy of the final classification as we use majority voting to assign a video to MCI or NC based on the number of classified clips.
In general, the I-CONECT dataset has one inter-class imbalanced problem and two intra-class imbalanced problems. Based on the above discussion, we aim to achieve both inter- and intra-class separation, which is different from the target of the aforementioned loss functions such as DDA (Farzaneh & Qi, 2020), WCL (Ngo & Yoon, 2020), and DACL (Farzaneh & Qi, 2021). To avoid suboptimal performance, after comprehensive thought, we are inclined to use the Adaptive Correlation (AD-CORRE) loss (Fard & Mahoor, 2022) to solve the Positive-Negative sample problem.
3 Multi-branch Classifier-ViViT (MC-ViViT)
The proposed Multi-branch Classifier-ViViT (MC-ViViT) is an end-to-end model, which predicts whether a video segment in the I-CONECT dataset belongs to the MCI group or normal cognition (NC). The backbone of the network is ViViT FE (Arnab et al., 2021) as its Factorised Encoder structure can extract Spatio-Temporal features efficiently. To enrich the features and improve performance, MC-ViViT utilizes multi branches for classification. Specifically, MC-ViViT splits each video into several video cubes by Tubelet Embedding. Then, it embeds the video cubes into tokens and prepares the input tokens by concatenating class tokens and positional embedding. Subsequently, MC-ViViT applies the Transformer Encoder with Factorised Encoder to extract Spatio-Temporal features from the input tokens. Finally, the model computes the prediction score of each class using multi-branch classifiers. The rest of this section explains the model components in detail.
3.1 Tubelet Embedding Review
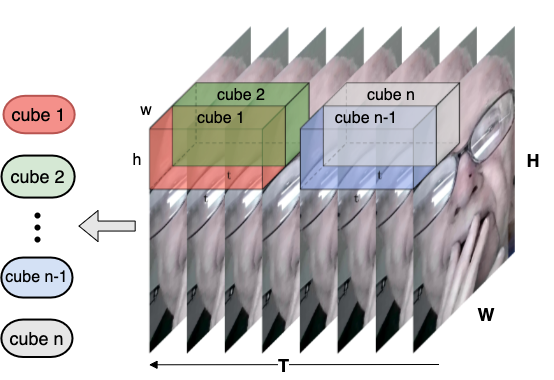
Following the pattern of ViViT (Arnab et al., 2021), the cubic patch is non-overlapping too. Suppose that the tensor shape of one video clip is , where is the frame numbers, and are the height and the width of each frame, and represents the RGB channels. Then, the tensor size of each cubic patch is . , , and are the size of the corresponding temporal, height, and width dimensions. 222 means to get the largest integer not greater than ., , and denote the token number of respective temporal, height, and width dimensions. The Tubelet Embedding changes the input unit from a 2D patch to a 3D cube, which contains temporal information (see Fig. 2). Therefore, it is the foundation of offering Spatio-Temporal information in MC-ViViT.
3.2 Factorised Encoder (FE) Review
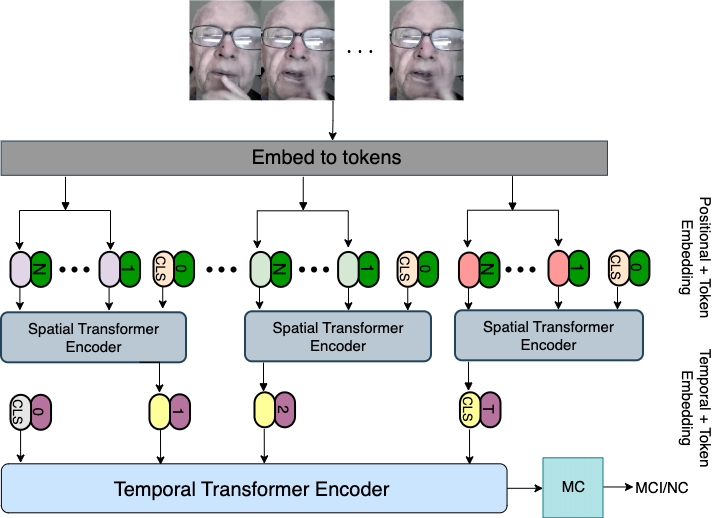
Fig. 1 shows that in ViViT (Arnab et al., 2021), the Transformer Encoder takes the combined positional and embedded cubic tokens as input, and it contains the Self-Attention module followed by the FeedForward module. Eq. (1) presents the details of the input tokens.
| (1) |
where is a learnable class token, is the tensor of cubic patches, is the number of cubic patches. is the linear projection to embed cubic patches. In addition, represents a learnable positional embedding. is the dimension of the embedded token.
Given the layer , the Self-Attention module consists of Layer Normalization (LN) and Multi-Head Dot-Product Attention, while the FeedForward (FF) module includes LN and MLP. Both modules use skip-connection to enrich features and prevent gradient vanishing. Moreover, Arnab et al. (2021) proposed four Multi-Head Self-Attention (MHSA) modules. This work selected FE because Arnab et al. (2021) showed that ViViT FE performed the best of all four versions. Fig. 3 shows that FE has two parts, Spatial Transformer Encoder () and Temporal Transformer Encoder (). Spatial Transformer Encoder extracts latent representations on the different tokens with the same temporal index. Therefore, these latent representations are spatial features. Then, these latent representations with different temporal indexes come to the Temporal Transformer Encoder, which studies the interactions between tokens from different time steps. Thus, the Temporal Transformer Encoder can mine temporal features. Assuming that the and repeats and times, respectively. FF processes the output of FE and returns the Sequence-Level Spatio-Temporal feature. The above explanation can be summarized as Eqs. 2-5.
| (2) | ||||
| (3) | ||||
| (4) | ||||
| (5) |
3.3 Multi-branch Classifier (MC)
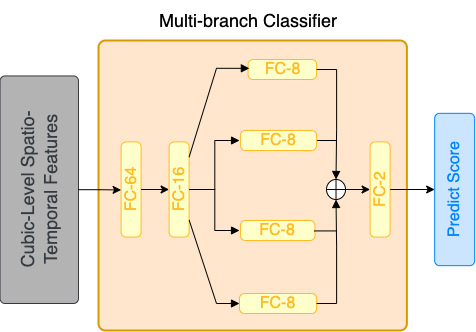
Inspired by Inception Module (Szegedy et al., 2015) and multi-models (Zhang et al., 2019; Lee et al., 2019; Liu et al., 2020; Kang et al., 2021; Naz et al., 2022), MC takes multi-branch structure to provide different views and enrich representation as well. Different from Inception Module and multi-models, MC only does linear projection at each branch instead of convolutional operation or the neural network. In detail, MC consists of four FC layers. The dimension change is concatenate to , where represents the number of class. In our experiment, is 2. When we convert the dimension from 16 to 32, Fig. 4 shows that we apply a multi-branch structure to convert the dimension to 8 and repeat 4 times. Then, we concatenate them as a 32-dimensional tensor. With this structure, MC can provide more features and view the object from different angles.
3.4 Loss function for Hard-Easy and Positive-Negative Samples (HP Loss)
HP Loss has two components, Focal Loss (Lin et al., 2017) and AD-CORRE(FD) (Fard & Mahoor, 2022). AD-CORRE(FD) is the FD (Feature Discriminator) component of AD-CORRE Loss.
3.4.1 Focal Loss Review
Focal Loss addresses the imbalance aspect of Hard-Easy samples by generating the weight based on sample numbers. It derives from -balanced Cross Entropy loss. Then, adding a modulating factor defined in Eq. (7) to the cross entropy loss, with tunable focusing parameter , makes the final Focal Loss. The above can be summarized as Eq. (6).
| (6) |
where is a weighting factor. for class MCI and for class NC. represents the probability of the frame sequence attributing to MCI.
| (7) |
where is the model’s predict score, is the predicted label.
3.4.2 AD-CORRE(FD) Review
AD-CORRE(FD) focuses on the correlation between the samples within a mini-batch. This prevents the imbalanced dataset from affecting the prediction. Therefore, the model pays attention to the class with less samples too. AD-CORRE(FD) comprises four key components of AD-CORRE(FD), Variance Eraser (Beta Matrix ), Attention Map Matrix (), Harmony Matrix (), and Correlation Matrix (CORM). In short, AD-CORRE(FD) is a weighted mean absolute error and is shown in Eq. (8).
| (8) |
where is the class number, is the size of mini-batch. The difference between and CORMn×n is the core of the AD-CORRE(FD) loss.
In general, AD-CORRE(FD) focuses on the correlation between samples within the mini-batch. This prevents the imbalanced dataset from affecting the prediction.
AD-CORRE(FD) Analysis
Intuitively, there are two ways to address the intra-class imbalance. Given a class, we assign trainable weight to each subject based on frame numbers. Or, we attribute different weights to positive and negative sequences within the same video. Either way, however, will stimulate more dispute and drive the problem complexity going exacerbation.
On this condition, AD-CORRE(FD)’s intention is to ignore the frames-imbalanced issue and the positive and negative sample problem and to only focus on the classification task at the mini-batch level. The intervention of AD-CORRE(FD) avoids the deeper conflict. In addition, AD-CORRE(FD) substantially decreases the computation complexity because it only analyzes the similarity between embeddings within the mini-batch. It accumulatively collects class distribution information from previous batches to improve its adaptive weight. Calculating within the mini-batch is also the reason that AD-CORRE(FD) benefits from detecting minority samples.
3.4.3 Combine Two Loss Functions
Finally, Eq. (9) shows the HP Loss is the sum of Focal Loss and AD-CORRE (FD). We follow the pattern of AD-CORRE Loss and set as as well.
| (9) |
4 Experiments
In this section, we first introduce the I-CONECT dataset, evaluation metrics, and implementation details. Then, we explain our experiments, present the results, report the ablation study, and evaluate the results.
4.1 Dataset
The Internet-Based Conversational Engagement Clinical Trial (I-CONECT) is to explore how social conversation can help improve memory and may prevent dementia or Alzheimer’s disease in older adults. The study followed research participants aged 75 and older recruited from Portland, Oregon, or Detroit, Michigan in the USA. The study randomized 186 participants. The participants had a 30-minute long chat per session with standardized interviewers (conversational staff) 4 times a week over a period of 6 months. The control group received only weekly 10-minute phone check-ins. All participants connected with the conversational staff using study-provided user-friendly devices. Conversations were semi-structured with some standard prompts and daily topics, but once the conversation started, it flowed naturally for fun and engaging conversations. Out of 186 randomized participants, 86 participants are diagnosed as NC, while 100 people are diagnosed as MCI. In each 30 minutes-session, participants discussed one of the 161 selected themes, such as Summer Time, Health Care, Military Service, Television Technology, etc. The conversational interactions were recorded as videoes. In the current study, we selected the following 4 themes: Crafts Hobbies, Day Time TV Shows, Movie Genres, and School Subjects. The interviewees talked about their crafts hobbies. They listed their favorite daytime TV shows, discussed preferred movie genres, and showed examples. Then, they also recalled their campus lives in School Subjects. Table 1 shows data exploration.
We used sequence-based approaches rather than frame-based approaches to process the dataset and extracted facial features via a dynamic approach.
| Crafts Hobbies | Day Time TV Shows | Movie Genres | School Subjects | |
| Subject Number | 32 | 41 | 35 | 39 |
| Male/Female | 11/21 | 11/30 | 10/25 | 11/28 |
| MCI/NC | 20/12 | 20/21 | 21/14 | 22/17 |
| Frame Number | 691872 | 859872 | 770656 | 797968 |
4.2 Data Processing


The facial features of interviewees are valuable to our research. Usually, the subject talks like NC at the start and the end, which prevents the model from predicting accurately. Furthermore, Fig. 5 shows that every video has a complex background and interviewers’ faces, which has a negative influence on predicting results. To address this problem, we decide to drop the first 3 minutes and the last 2.5 minutes of each video. Then, EasyOCR helps detect whether or not the upper half frame contains the subject ID in the given frame. For frames with the subject ID on the top, we implemented RetineFace (Deng et al., 2020) to crop the participants’ facial images and dropped all irrelevant and interfering information. In detail, we calculate the area of detected faces and the Intersection over Union (IoU) of them. If IoU , we kept the bigger face like Fig. 5a. Otherwise, we continue to process the next frame and drop the frame like Fig. 5b. Finally, we browse the kept images and manually delete the wrongly saved ones. We used this method to process different themes. The four themes that are studied in this paper may have videos from 40 participants or less. For the sake of taking advantage of videos thoroughly and predicting better, we select K-fold Cross Validation and use Eq. (10) to calculate for each theme.
| (10) |
where and are the video number of the selected theme and that of each fold. We set in our study. Moreover, videos in each fold belong to different participants.
K-fold Cross Validation sets one fold as the test set and the resting folds as the training sets every time. It does not choose any fold as the validation set. Here, we use the test set as the validation one during the training process. This is to avoid overfitting the model (Ashtiani et al., 2021). In fact, attributing some of the subjects to a third subset inevitably shrinks the size of the training set. Thus, the model may face monotonous facial features and perform weakly in recognizing different samples (Ashtiani et al., 2021). Furthermore, the model may also take valuable representations as noise or outliers due to insufficient data samples, which adversely affects the prediction. Hence, we do not use a validation set in our experiments.
Simultaneously, inspired by Hou Lee & Wong (2020); Liu et al. (2021a); Mohan & Popa (2021); Kim et al. (2022), this study used multi frames as the input. Thus, we cut each video into a certain number of fixed-length segments as inputs. Let 333 and from Section 3.1 are identical. be the number of consecutive frames in a divided segment, represents the number of total frames. is the number of segments for each video.
4.3 Evaluation Metrics
Prediction accuracy, F1 score, AUC (Area Under the Receiver Operating Characteristic Curve), Sensitivity, and Specificity are the evaluation metrics in the experiment. McNamara and Martin stated that sensitivity and specificity are intrinsic measures of a case definition or diagnostic test, whereas predictive values vary with the prevalence of a condition within a population (McNamara & Martin, 2023). Eq. (11) presents the statistical definition of sensitivity, which is similar to recall. Eq. (12) is the equation of specificity.
| Sensitivity | (11) | |||
| Specificity | (12) |
4.4 Implementation Details
We performed data augmentation to each segment, which contains the random horizontal and vertical flip, random rotation, and center crop. All frames within one set do exactly same augmentation. The batch size is 80. Following the pattern of (Hou Lee & Wong, 2020; Liu et al., 2021a; Mohan & Popa, 2021; Kim et al., 2022), is 16. The initialized learning rate is 1e-6. We used Adam optimizer and Cyclic scheduler with the mode of triangular2. The loss function is HP loss. The epoch number is 30. We coded the network by PyTorch 1.12.0+cu116 and ran experiments on the NVIDIA GTX 1080Ti GPU.
4.5 Experiment: K-fold Validation
This experiment is to test the capability of MC-ViViT on predicting MCI in each theme. The inputs are all the corresponding videos.
| Test Theme | Crafts Hobbies | Day Time TV Shows | Movie Genres | School Subjects |
| Fold Num | 11 | 14 | 11 | 13 |
| Accuracy | 29/32 | 36/41 | 30/35 | 35/39 |
| 90.63% | 85.37% | 85.71% | 89.74% | |
| F1 | 93.03% | 85.00% | 88.37% | 90.47% |
| AUC | 0.6042 | 0.4952 | 0.6122 | 0.5294 |
| MCI/NC | 20/12 | 20/21 | 21/14 | 22/17 |
| Sensitivity/ | 100%/ | 85%/ | 90.48%/ | 86.36%/ |
| Specificity | 75% | 85.71% | 78.57% | 94.12% |
We report the results in Table 2. MC-ViViT achieves over 85% accuracy on all four themes. For example, MC-ViViT predicts 29 out of 32 subjects correctly on the theme Crafts Hobbies, which reaches the highest accuracy, 90.63%. The accuracy of School Subjects is 89.74%, which is close to 90%. Three of the F1 Scores are more than 88%, and only the F1 score of Day Time TV Shows is 85%. The accuracy and F1 Score solidly support that MC-ViViT has robust performance. The other evidence comes from AUC Score. The average AUC of all four themes is 0.56. Given that not all the clips have MCI features in the video, even for subjects with MCI, it is reasonable to predict parts of their video sequences as NC. Due to this reason, some subjects will be correctly predicted as MCI with low scores. Thus, the average AUC value is around 0.6.
Table 2 also shows that, on all four themes, MCI/NC has a related balanced prediction distribution. Their Sensitivity and Specificity are high as well. For instance, the sample of Day Time TV Shows comprises 20 MCI subjects and 21 NC ones. The Sensitivity over Specificity is 85%/85.71%.
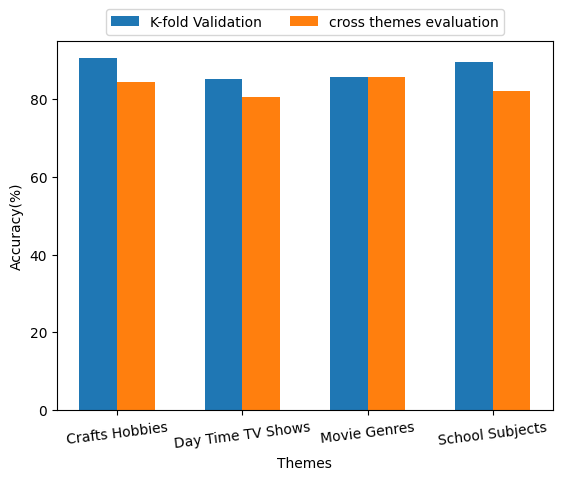
4.6 Experiment: cross themes evaluation
This experiment is to test if MC-ViViT can integrate and learn complex features from a given set of training themes and detect MCI from different test themes correctly. We train the video on three themes and predict the rest. This time, we resize all the frames as to train faster. There are no overlapped subjects between the training sets and the test sets.
| Test Theme | Crafts Hobbies | Day Time TV Shows | Movie Genres | School Subjects |
| Fold Num | 11 | 14 | 11 | 10 |
| Accuracy | 27/32 | 33/41 | 30/35 | 32/39 |
| 84.38% | 80.49% | 85.71% | 82.05% | |
| F1 | 87.80% | 82.61% | 88.89% | 89.36% |
| AUC | 0.7 | 0.7452 | 0.6701 | 0.4773 |
| MCI/NC | 20/12 | 20/21 | 21/14 | 22/17 |
| Sensitivity/ | 90%/ | 95%/ | 95.24%/ | 95.45%/ |
| Specificity | 75% | 66.67% | 71.43% | 76.47% |
Table 3 shows all the results. MC-ViViT still provides stable performance. It achieves over 82% accuracy and over 87% F1 Score on the three themes. The highest accuracy is 85.71% (predict 30 out of 35 samples correctly) on the Movie Genres, while the highest F1 Score is 89.36% on the School Subject. The accuracy and F1 Score of this experiment are still robust to show that MC-ViViT can predict well. The average AUC Score of this experiment is 0.648, which is higher than 0.56 from Section 4.5. This value also accords with the analysis from Section 4.5. It supports that MC-ViViT can make objective decisions. In the meanwhile, MC-ViViT only reaches 80.49% accuracy and 82.61% F1 Score on the Day Time TV Shows. This is due to the smaller frame size.
Subsequently, Fig. 6a presents that, the smaller frame size affects the Sensitivity over Specificity of MCI/NC. Specifically, it weakens the capability of detecting negative samples, which is NC in our experiment. Thereby, the results of Sensitivity/Specificity are less balance than those from Section 4.5. For example, the Sensitivity/Specificity of movie genres increases from 90.48%/78.57% (Table 2) to 95.24%/71.43%. Smaller frame size decreasing the important features of NC makes the NC harder to detect. Therefore, Specificity in this experiment is lower than Section 4.5.
4.7 Ablation Study
This section discusses the effect of temporal dimension , MC, and HP Loss on the performance of MC-ViViT (Sections 4.7.1-4.7.3).
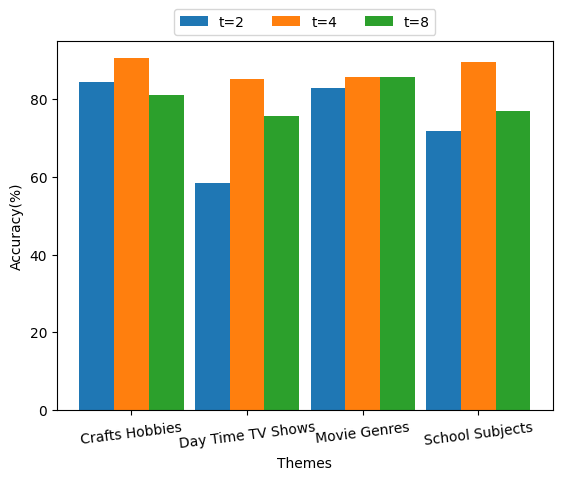
4.7.1 Study the most proper temporal dimension
In MC-ViViT, the frame number, , is 16, which can be divided by . To keep Tubelet Embedding and reduce the burden of computation, we set the temporal dimension as alternatively to study the best value for this research.
| Test Theme | Crafts Hobbies | Day Time TV Shows | Movie Genres | School Subjects |
| t = 2 | 84.38% | 58.54% | 82.86% | 71.79% |
| t = 4 | 90.63% | 85.37% | 85.71% | 89.74% |
| t = 8 | 81.25% | 75.61% | 85.71% | 76.92% |
Table 4 and Fig. 6b show that setting gives the best performance under the current configuration on four themes. When , the tubelet lacks adequate temporal features for making good predictions. When , the tubelet, as a long sequence or long memory, includes many useful temporal representations for sure. But it also requires tubelet embedding to have a larger fixed dimension length. However, increasing this fixed length will boost the model’s total parameters, which makes the MC-ViViT computationally expensive.
In addition, other Transformer-based models also set while analyzing facial videos such as MTV (Yan et al., 2022) and MSVT (Yu et al., 2023). Using helps Transformer-based models capture local-consecutive inconsistency efficiently and reach sufficient performance (Yu et al., 2023). It is also to get the best trade-off between performance and efficiency (Yan et al., 2022). Thereby, we choose .
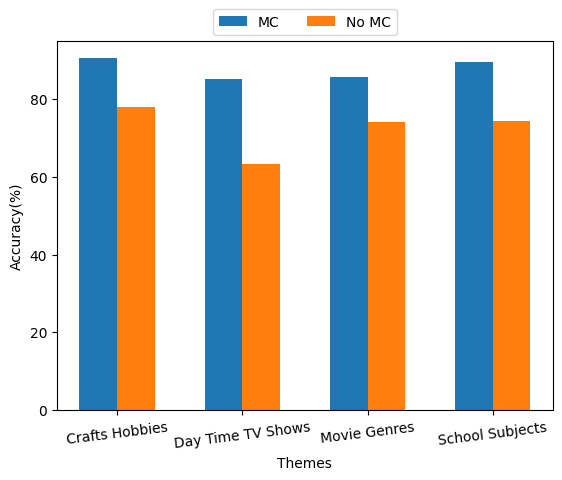
4.7.2 Study the effect of MC
This study is to evaluate the effect of MC structure. In the experiment, we dropped the multi-branch structure and changed the dimension from 16 to directly. The dimension changes will be . We collected the related experimental results in Table 5. It shows that, for each theme, the accuracy of ViViT with MC is at least 10% higher than that without MC. Fig. 6c bolsters this view. Therefore, the MC module provides more features and benefits the ViViT in predicting better.
| Test Theme | Crafts Hobbies | Day Time TV Shows | Movie Genres | School Subjects |
| MC | 90.63% | 85.37% | 85.71% | 89.74% |
| No MC | 78.13% | 63.41% | 74.29% | 74.36% |
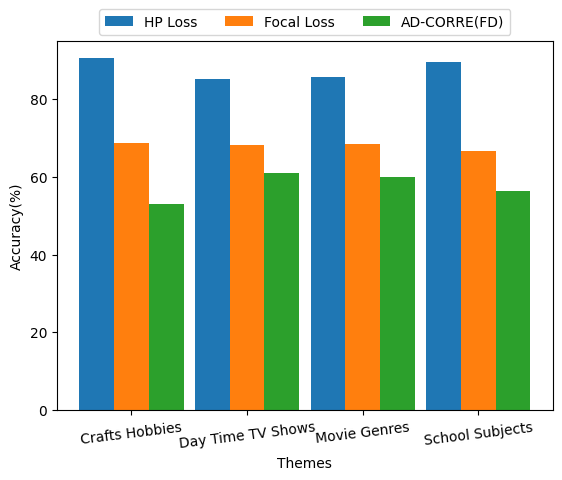
4.7.3 Study the effect of HP Loss
This study is to test the influence of each component of HP Loss on the prediction. We first did experiments with Focal Loss only. Then, we did experiments with AD-CORRE(FD) Loss only. Table 6 contains all the results and shows that MC-ViViT using Focal loss performs better than that using AD-CORRE(FD). In the meanwhile, the accuracy of MC-ViViT using HP loss surpasses at least 14% than that using either Focal loss or AD-CORRE(FD). Fig. 6d clearly displays this huge disparity. Thereby, Table 6 and Fig. 6d uphold that HP Loss helps the MC-ViViT perform better than each individual component does.
| Test Theme | Crafts Hobbies | Day Time TV Shows | Movie Genres | School Subjects |
| HP Loss | 90.63% | 85.37% | 85.71% | 89.74% |
| Focal Loss | 68.75% | 68.29% | 68.57% | 66.67% |
| AD-CORRE(FD) | 53.13% | 60.98% | 60.00% | 56.41% |
5 Discussion
The experiments presented in Sections 4.5 and 4.6 and the comparison in Table 7 indicate that MC-ViViT can detect MCI with promising accuracy. For a selected theme, MC-ViViT can predict subjects not included in the model training very well. It can also infer the representations learned from many themes to correctly predict the subjects from unseen themes. The MC-ViViT’s robust performance convinces us that analyzing semi-structured interview videos is useful to detect MCI.
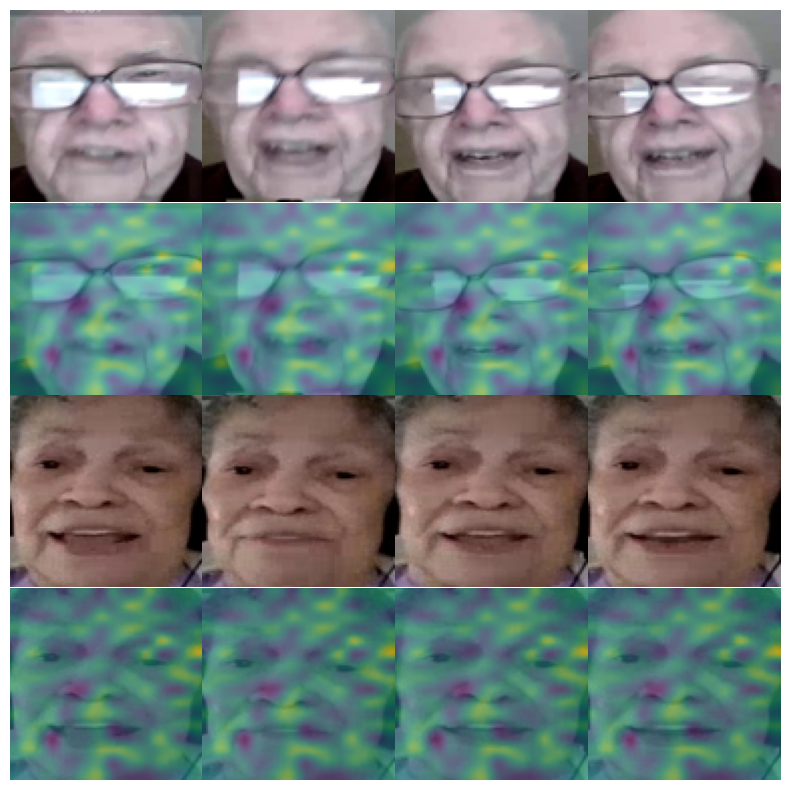
In the meanwhile, ViViT, as the backbone, mainly provides good representations to the final prediction. These good representations include spatial features and temporal ones. Different from manually described and learned patterns such as head pose, eye gaze, eye-tracking, and lip activities, Fig. 7 shows that MC-ViViT pays attention to the different areas of the face. For example, it focuses on regions of the forehead, eyelids, nose, cheek, and jaw. This correlates with the statement that ViViT is capable to monitor the motion of all facial muscles and discover many slight changes and features. Furthermore, Sections 4.5 and 4.6 indicate that these features are very important to decide if the subject has MCI or not. In short, ViViT takes video clips as the input and extracts spatio-temporal features in one stream, which enables the model to make a comprehensive decision. Subsequently, the ablation study from Section 4.7 suggests that both MC and HP Loss improve the accuracy. MC broadens the network through the multi-branch structure, which provides different perspectives to analyze the subject’s features. MC strengthens the features’ richness, which benefits in making correct decisions. HP Loss, then, concentrates on prediction equality. The I-CONECT dataset is a very imbalanced dataset. Table 1 indicates that every theme has more MCI subjects than NC ones. The focal Loss part of HP loss assigns more weight to the class with less subjects and aims to solve the inter-class imbalanced issues. Within each class, the different video length causes the inequivalence of extracted frames from each subject. The AD-CORRE(FD) part of HP Loss changes the background of the problem from the intra-class level to the mini-batch level. Within the mini-batch, AD-CORRE(FD) tackles the classification task by measuring the similarity between embedding features, which wisely resolves the imbalance crisis and reduces the computational complexity. Thereby, HP loss is essential to the MC-ViViT. The experimental results from Tables 5 and 6 uphold the above discussion. In addition, Table 2 indicates that MC-ViViT can learn features well under one particular theme, while Table 3 convinces us that features from other themes can help detect MCI from NC on the left one. Subjects perform similar features on different themes.
In general, there are two key findings. The first one is that Transformer-based models are capable to detect MCI in the early stage only by analyzing facial features; the second one is that semi-structured interview videos can provide plenty of features to help the model make quality predictions while merely requiring the tablet computer or mobile phone to collect. This costs much less than collecting conventional medical images like MRI. These two findings reveal that MC-ViViT has the potential to detect other diseases, such as dementia and Parkinson’s Disease (PD), in the early stage. Moreover, the corresponding data collection becomes convenient and easy to access. Even a cell phone can help film facial videos.
On the other side, due to the lack of a consistent video recording environment, the videos’ qualities vary a lot. From what we observed in this research, the video quality significantly affects the prediction. We notice that MC-ViViT usually predicts high-clarity videos rightly with high prediction scores. Conversely, MC-ViViT is easy to give unclear videos with low prediction scores. Or even MC-ViViT classifies those videos with the wrong labels. This explains the reason that Sensitivity versus Specificity is far from equivalence. Future work will focus on establishing a mechanism to evaluate the video quality score. The future model will implement this score to design a new loss function that helps tune the training process.
6 Conclusion
This paper presented MC-ViViT to detect MCI from NC via facial videos of the semi-structured interviews (I-CONECT dataset). The experiments show that MC-ViViT can predict well with the help of MC and HP Loss. Simultaneously, it shows that the Transformer-based model can tell whether or not people have MCI merely by analyzing facial features from the semi-structured interview videos. Compared to the other datasets mentioned in Section 1, the I-CONECT dataset is easy to access, low cost, time-saving, flexible, and less restricted. It is very valuable to spread and propagate.
Acknowledgement
This research was partially funded by a grant to the University of Denver by Colorado Office of Economic Development and International Trade and two grants from National Institutes of Health (NIH) (R01AG051628 and R01AG056102).
We would like to thank Miss. Jisu Lee for proofreading this paper.
Author Contributions
Jian Sun: Conceptualization, Methodology, Software, Validation, Formal analysis, Investigation, Data Curation, Writing - Original Draft, Writing - Review & Editing, Visualization.
Hiroko H. Dodge: Investigation, Resources, Data Curation, Writing—Review and Editing.
Mohammad H. Mahoor: Resources, Writing—Review and Editing, Supervision, Project Administration.
References
- Alzheimer’s_Association (2021) Alzheimer’s_Association (2021). 2021 alzheimer’s disease facts and figures. Alzheimer’s & Dementia, 17, 327–406.
- Arnab et al. (2021) Arnab, A., Dehghani, M., Heigold, G., Sun, C., Lučić, M., & Schmid, C. (2021). Vivit: A video vision transformer. In Proceedings of the IEEE/CVF International Conference on Computer Vision (pp. 6836–6846).
- Ashtiani et al. (2021) Ashtiani, S.-H. M., Javanmardi, S., Jahanbanifard, M., Martynenko, A., & Verbeek, F. J. (2021). Detection of mulberry ripeness stages using deep learning models. IEEE Access, 9, 100380–100394.
- Asim et al. (2018) Asim, Y., Raza, B., Malik, A. K., Rathore, S., Hussain, L., & Iftikhar, M. A. (2018). A multi-modal, multi-atlas-based approach for alzheimer detection via machine learning. International Journal of Imaging Systems and Technology, 28, 113–123.
- Bulat et al. (2021) Bulat, A., Perez Rua, J. M., Sudhakaran, S., Martinez, B., & Tzimiropoulos, G. (2021). Space-time mixing attention for video transformer. In M. Ranzato, A. Beygelzimer, Y. Dauphin, P. Liang, & J. W. Vaughan (Eds.), Advances in Neural Information Processing Systems (pp. 19594–19607). Curran Associates, Inc. volume 34.
- Carr (2019) Carr, D. (2019). How to successfully navigate a revise-and-resubmit decision and handle rejections. Innovation in Aging, 3, S224.
- Cavedoni et al. (2020) Cavedoni, S., Chirico, A., Pedroli, E., Cipresso, P., & Riva, G. (2020). Digital biomarkers for the early detection of mild cognitive impairment: artificial intelligence meets virtual reality. Frontiers in Human Neuroscience, 14, 245.
- Chen et al. (2020) Chen, L., Dodge, H. H., & Asgari, M. (2020). Topic-based measures of conversation for detecting mild cognitive impairment. In Proceedings of the conference. Association for Computational Linguistics. Meeting (p. 63). NIH Public Access volume 2020.
- Davuluri1 & Rengaswamy (2020) Davuluri1, R., & Rengaswamy, R. (2020). A survey of different machine learning models for alzheimer disease prediction. International Journal of Emerging Trends in Engineering Research, 8.
- De & Chowdhury (2021) De, A., & Chowdhury, A. S. (2021). Dti based alzheimer’s disease classification with rank modulated fusion of cnns and random forest. Expert Systems with Applications, 169, 114338.
- Deng et al. (2020) Deng, J., Guo, J., Ververas, E., Kotsia, I., & Zafeiriou, S. (2020). Retinaface: Single-shot multi-level face localisation in the wild. In Proceedings of the IEEE/CVF conference on computer vision and pattern recognition (pp. 5203–5212).
- Ding et al. (2019) Ding, Y., Sohn, J. H., Kawczynski, M. G., Trivedi, H., Harnish, R., Jenkins, N. W., Lituiev, D., Copeland, T. P., Aboian, M. S., Mari Aparici, C., Behr, S. C., Flavell, R. R., Huang, S.-Y., Zalocusky, K. A., Nardo, L., Seo, Y., Hawkins, R. A., Hernandez Pampaloni, M., Hadley, D., & Franc, B. L. (2019). A deep learning model to predict a diagnosis of alzheimer disease by using 18f-fdg pet of the brain. Radiology, 290, 456–464. PMID: 30398430.
- Dosovitskiy et al. (2020) Dosovitskiy, A., Beyer, L., Kolesnikov, A., Weissenborn, D., Zhai, X., Unterthiner, T., Dehghani, M., Minderer, M., Heigold, G., Gelly, S. et al. (2020). An image is worth 16x16 words: Transformers for image recognition at scale. arXiv preprint arXiv:2010.11929, abs/2010.11929.
- Dourado et al. (2019) Dourado, M., Fdel, B., Neto, J., Alves, G., & Alves, C. (2019). Facial expression recognition patterns in mild and moderate alzheimer’s disease. Journal of Alzheimer’s Disease, 69, 1–11.
- Eikelboom et al. (2019) Eikelboom, W. S., Singleton, E., Van Den Berg, E., Coesmans, M., Mattace Raso, F., Van Bruchem, R. L., Goudzwaard, J. A., De Jong, F. J., Koopmanschap, M., Den Heijer, T. et al. (2019). Early recognition and treatment of neuropsychiatric symptoms to improve quality of life in early alzheimer’s disease: protocol of the beat-it study. Alzheimer’s research & therapy, 11, 1–12.
- Fard & Mahoor (2022) Fard, A. P., & Mahoor, M. H. (2022). Ad-corre: Adaptive correlation-based loss for facial expression recognition in the wild. IEEE Access, 10, 26756–26768.
- Farzaneh & Qi (2020) Farzaneh, A. H., & Qi, X. (2020). Discriminant distribution-agnostic loss for facial expression recognition in the wild. In 2020 IEEE/CVF Conference on Computer Vision and Pattern Recognition Workshops (CVPRW) (pp. 1631–1639).
- Farzaneh & Qi (2021) Farzaneh, A. H., & Qi, X. (2021). Facial expression recognition in the wild via deep attentive center loss. In Proceedings of the IEEE/CVF Winter Conference on Applications of Computer Vision (WACV) (pp. 2402–2411).
- Fei et al. (2019) Fei, Z., Yang, E., Li, D. D.-U., Butler, S., Ijomah, W., & Zhou, H. (2019). A survey on computer vision techniques for detecting facial features towards the early diagnosis of mild cognitive impairment in the elderly. Systems Science & Control Engineering, 7, 252–263.
- Gashi et al. (2021) Gashi, S., Saeed, A., Vicini, A., Di Lascio, E., & Santini, S. (2021). Hierarchical classification and transfer learning to recognize head gestures and facial expressions using earbuds. In Proceedings of the 2021 International Conference on Multimodal Interaction (pp. 168–176).
- Gil & Arroyo-Anlló (2021) Gil, R., & Arroyo-Anlló, E. M. (2021). Alzheimer’s disease and face masks in times of covid-19. Journal of Alzheimer’s disease : JAD, 79, 9–14.
- Hammoudeh et al. (2022) Hammoudeh, M., Nagavelli, U., Samanta, D., & Chakraborty, P. (2022). Machine learning technology-based heart disease detection models. Journal of Healthcare Engineering, 2022.
- He et al. (2019) He, G., Zhao, W., Xia, X., Peng, R., & Wu, X. (2019). An ensemble of shapelet-based classifiers on inter-class and intra-class imbalanced multivariate time series at the early stage. Soft Computing, 23, 6097–6114.
- Hou Lee & Wong (2020) Hou Lee, J. R., & Wong, A. (2020). Timeconvnets: A deep time windowed convolution neural network design for real-time video facial expression recognition. In 2020 17th Conference on Computer and Robot Vision (CRV) (pp. 9–16).
- Huang et al. (2021) Huang, Z., Qing, Z., Wang, X., Feng, Y., Zhang, S., Jiang, J., Xia, Z., Tang, M., Sang, N., & Ang Jr, M. H. (2021). Towards training stronger video vision transformers for epic-kitchens-100 action recognition. arXiv preprint arXiv:2106.05058, .
- Islam & Zhang (2018) Islam, J., & Zhang, Y. (2018). Early diagnosis of alzheimer’s disease: A neuroimaging study with deep learning architectures. In 2018 IEEE/CVF Conference on Computer Vision and Pattern Recognition Workshops (CVPRW) (pp. 1962–19622).
- Jiang et al. (2022) Jiang, Z., Seyedi, S., Haque, R. U., Pongos, A. L., Vickers, K. L., Manzanares, C. M., Lah, J. J., Levey, A. I., & Clifford, G. D. (2022). Automated analysis of facial emotions in subjects with cognitive impairment. PLOS ONE, 17, 1–19.
- Jin et al. (2020) Jin, B., Qu, Y., Zhang, L., & Gao, Z. (2020). Diagnosing parkinson disease through facial expression recognition: video analysis. Journal of medical Internet research, 22, e18697.
- Kang et al. (2021) Kang, W., Lin, L., Zhang, B., Shen, X., Wu, S., Initiative, A. D. N. et al. (2021). Multi-model and multi-slice ensemble learning architecture based on 2d convolutional neural networks for alzheimer’s disease diagnosis. Computers in Biology and Medicine, 136, 104678.
- Khan et al. (2022) Khan, A. R., Saba, T., Khan, M. Z., Fati, S. M., & Khan, M. U. G. (2022). Classification of human’s activities from gesture recognition in live videos using deep learning. Concurrency and Computation: Practice and Experience, 34, e6825.
- Khan et al. (2017) Khan, S., Xu, G., Chan, R., & Yan, H. (2017). An online spatio-temporal tensor learning model for visual tracking and its applications to facial expression recognition. Expert Systems with Applications, 90, 427–438.
- Kim et al. (2022) Kim, J.-H., Kim, N., & Won, C. S. (2022). Facial expression recognition with swin transformer. arXiv preprint arXiv:2203.13472, .
- Lee et al. (2019) Lee, G., Nho, K., Kang, B., Sohn, K.-A., & Kim, D. (2019). Predicting alzheimer’s disease progression using multi-modal deep learning approach. Scientific reports, 9, 1952.
- Li et al. (2022) Li, J., Xu, S., & Qin, X. (2022). A hierarchical model for learning to understand head gesture videos. Pattern Recognition, 121, 108256.
- Liang et al. (2021) Liang, L., Lang, C., Li, Y., Feng, S., & Zhao, J. (2021). Fine-grained facial expression recognition in the wild. IEEE Transactions on Information Forensics and Security, 16, 482–494.
- Lin et al. (2017) Lin, T.-Y., Goyal, P., Girshick, R., He, K., & Dollár, P. (2017). Focal loss for dense object detection. In Proceedings of the IEEE international conference on computer vision (pp. 2980–2988).
- Ling et al. (2021) Ling, X., Liang, J., Wang, D., & Yang, J. (2021). A facial expression recognition system for smart learning based on yolo and vision transformer. In 2021 7th International Conference on Computing and Artificial Intelligence ICCAI 2021 (pp. 178–182). New York, NY, USA: Association for Computing Machinery.
- Liu et al. (2021a) Liu, D., Zhang, H., & Zhou, P. (2021a). Video-based facial expression recognition using graph convolutional networks. In 2020 25th International Conference on Pattern Recognition (ICPR) (pp. 607–614). IEEE.
- Liu et al. (2022a) Liu, G., Xue, Z., Zhan, L., Dodge, H. H., & Zhou, J. (2022a). Detection of mild cognitive impairment from language markers with crossmodal augmentation. In PACIFIC SYMPOSIUM ON BIOCOMPUTING 2023: Kohala Coast, Hawaii, USA, 3–7 January 2023 (pp. 7–18). World Scientific.
- Liu et al. (2022b) Liu, G., Xue, Z., Zhan, L., Dodge, H. H., & Zhou, J. (2022b). Detection of mild cognitive impairment from language markers with crossmodal augmentation. In PACIFIC SYMPOSIUM ON BIOCOMPUTING 2023: Kohala Coast, Hawaii, USA, 3–7 January 2023 (pp. 7–18). World Scientific.
- Liu et al. (2022c) Liu, H., Fang, S., Zhang, Z., Li, D., Lin, K., & Wang, J. (2022c). Mfdnet: Collaborative poses perception and matrix fisher distribution for head pose estimation. IEEE Transactions on Multimedia, 24, 2449–2460.
- Liu et al. (2020) Liu, M., Li, F., Yan, H., Wang, K., Ma, Y., Shen, L., Xu, M., Initiative, A. D. N. et al. (2020). A multi-model deep convolutional neural network for automatic hippocampus segmentation and classification in alzheimer’s disease. Neuroimage, 208, 116459.
- Liu et al. (2021b) Liu, X., Jin, L., Han, X., & You, J. (2021b). Mutual information regularized identity-aware facial expression recognition in compressed video. Pattern Recognition, 119, 108105.
- Liu et al. (2022d) Liu, Z., Ning, J., Cao, Y., Wei, Y., Zhang, Z., Lin, S., & Hu, H. (2022d). Video swin transformer. In Proceedings of the IEEE/CVF Conference on Computer Vision and Pattern Recognition (CVPR) (pp. 3202–3211).
- Liu et al. (2021c) Liu, Z., Wei, P., Wei, Z., Yu, B., Jiang, J., Cao, W., Bian, J., & Chang, Y. (2021c). Handling inter-class and intra-class imbalance in class-imbalanced learning. arXiv preprint arXiv:2111.12791, .
- Lu et al. (2021) Lu, B., Li, H.-X., Chang, Z.-K., Li, L., Chen, N.-X., Zhu, Z.-C., Zhou, H.-X., Li, X.-Y., Wang, Y.-W., Cui, S.-X., Deng, Z.-Y., Fan, Z., Yang, H., Chen, X., Thompson, P. M., Castellanos, F. X., Yan, C.-G., & for the Alzheimer’s Disease Neuroimaging Initiative (2021). A practical alzheimer disease classifier via brain imaging-based deep learning on 85,721 samples. bioRxiv, .
- Martinez et al. (2018) Martinez, M., Multani, N., Anor, C. J., Misquitta, K., Tang-Wai, D. F., Keren, R., Fox, S., Lang, A. E., Marras, C., & Tartaglia, M. C. (2018). Emotion detection deficits and decreased empathy in patients with alzheimer’s disease and parkinson’s disease affect caregiver mood and burden. Frontiers in Aging Neuroscience, 10.
- Mazzi et al. (2020) Mazzi, C., Massironi, G., Sanchez-Lopez, J., De Togni, L., & Savazzi, S. (2020). Face recognition deficits in a patient with alzheimer’s disease: Amnesia or agnosia? the importance of electrophysiological markers for differential diagnosis. Frontiers in Aging Neuroscience, 12.
- McNamara & Martin (2023) McNamara, L. A., & Martin, S. W. (2023). 1 - principles of epidemiology and public health. In S. S. Long (Ed.), Principles and Practice of Pediatric Infectious Diseases (Sixth Edition) (pp. 1–9.e1). Philadelphia: Elsevier. (Sixth edition ed.).
- Meléndez et al. (2020) Meléndez, J. C., Satorres, E., & Oliva, I. (2020). Comparing the effect of interference on an emotional stroop task in older adults with and without alzheimer’s disease. Journal of Alzheimer’s disease, 73, 1445–1453.
- de Mendonça et al. (2023) de Mendonça, L. J. C., Ferrari, R. J., Initiative, A. D. N. et al. (2023). Alzheimer’s disease classification based on graph kernel svms constructed with 3d texture features extracted from mr images. Expert Systems with Applications, 211, 118633.
- Mercioni & Stavarache (2022) Mercioni, M.-A., & Stavarache, L. L. (2022). Disease diagnosis with medical imaging using deep learning. In Future of Information and Communication Conference (pp. 198–208). Springer Springer International Publishing.
- Mohan & Popa (2021) Mohan, B., & Popa, M. (2021). Temporal based emotion recognition inspired by activity recognition models. In 2021 9th International Conference on Affective Computing and Intelligent Interaction Workshops and Demos (ACIIW) (pp. 01–08).
- Nam et al. (2020) Nam, U., Lee, K., Ko, H., Lee, J.-Y., & Lee, E. C. (2020). Analyzing facial and eye movements to screen for alzheimer’s disease. Sensors, 20.
- National_Institute_on_Aging (2021) National_Institute_on_Aging (2021). What is mild cognitive impairment?
- Naz et al. (2022) Naz, S., Ashraf, A., & Zaib, A. (2022). Transfer learning using freeze features for alzheimer neurological disorder detection using adni dataset. Multimedia Systems, 28, 85–94.
- Neelaveni & Devasana (2020) Neelaveni, J., & Devasana, M. (2020). Alzheimer disease prediction using machine learning algorithms. In 2020 6th International Conference on Advanced Computing and Communication Systems (ICACCS) (pp. 101–104).
- Ngo & Yoon (2020) Ngo, Q. T., & Yoon, S. (2020). Weighted-center loss for facial expressions recognition. In 2020 International Conference on Information and Communication Technology Convergence (ICTC) (pp. 54–56).
- Pan et al. (2020) Pan, X., Zhang, S., Guo, W., Zhao, X., Chuang, Y., Chen, Y., & Zhang, H. (2020). Video-based facial expression recognition using deep temporal-spatial networks. IETE Technical Review, 37, 402–409.
- Pang et al. (2023) Pang, Y., Kukull, W., Sano, M., Albin, R., Shen, C., Zhou, J., & Dodge, H. H. (2023). Predicting progression from normal to mci and from mci to ad using clinical variables in the national alzheimer’s coordinating center uniform data set version 3: Application of machine learning models and a probability calculator. The journal of prevention of Alzheimer’s disease, 10, 301–313.
- Patrikar & Parate (2022) Patrikar, D. R., & Parate, M. R. (2022). Anomaly detection using edge computing in video surveillance system. International Journal of Multimedia Information Retrieval, 11, 85–110.
- Poloni et al. (2022) Poloni, K. M., Ferrari, R. J., Initiative, A. D. N. et al. (2022). A deep ensemble hippocampal cnn model for brain age estimation applied to alzheimer’s diagnosis. Expert Systems with Applications, 195, 116622.
- Qiu et al. (2020) Qiu, S., Joshi, P. S., Miller, M. I., Xue, C., Zhou, X., Karjadi, C., Chang, G. H., Joshi, A. S., Dwyer, B., Zhu, S. et al. (2020). Development and validation of an interpretable deep learning framework for alzheimer’s disease classification. Brain, 143, 1920–1933.
- Rehouma et al. (2021) Rehouma, R., Buchert, M., & Chen, Y.-P. P. (2021). Machine learning for medical imaging-based covid-19 detection and diagnosis. International Journal of Intelligent Systems, 36, 5085–5115.
- Salehi et al. (2020) Salehi, A. W., Baglat, P., Sharma, B. B., Gupta, G., & Upadhya, A. (2020). A cnn model: Earlier diagnosis and classification of alzheimer disease using mri. In 2020 International Conference on Smart Electronics and Communication (ICOSEC) (pp. 156–161).
- Sampath et al. (2021) Sampath, V., Maurtua, I., Aguilar Martín, J. J., & Gutierrez, A. (2021). A survey on generative adversarial networks for imbalance problems in computer vision tasks. Journal of big Data, 8, 1–59.
- Sapey-Triomphe et al. (2015) Sapey-Triomphe, L.-A., Heckemann, R. A., Boublay, N., Dorey, J.-M., Hénaff, M.-A., Rouch, I., Padovan, C., Hammers, A., Krolak-Salmon, P., & Initiative, A. D. N. (2015). Neuroanatomical correlates of recognizing face expressions in mild stages of alzheimer’s disease. PLoS ONE, 10, e0143586.
- Sibley et al. (2021) Sibley, K. G., Girges, C., Hoque, E., & Foltynie, T. (2021). Video-based analyses of parkinson’s disease severity: A brief review. Journal of Parkinson’s disease, 11, S83–S93.
- Singh et al. (2022) Singh, S., Dewangan, S., Krishna, G. S., Tyagi, V., & Reddy, S. (2022). Video vision transformers for violence detection. arXiv preprint arXiv:2209.03561, .
- Sonawane & Sharma (2021) Sonawane, B., & Sharma, P. (2021). Review of automated emotion-based quantification of facial expression in parkinson’s patients. The Visual Computer, 37, 1151–1167.
- Song et al. (2022) Song, Y., Tang, H., Meng, F., Wang, C., Wu, M., Shu, Z., & Tong, G. (2022). A transformer-based low-resolution face recognition method via on-and-offline knowledge distillation. Neurocomputing, 509, 193–205.
- Sümer et al. (2021) Sümer, O., Goldberg, P., D’Mello, S., Gerjets, P., Trautwein, U., & Kasneci, E. (2021). Multimodal engagement analysis from facial videos in the classroom. IEEE Transactions on Affective Computing, (pp. 1–1).
- Sun et al. (2021) Sun, J., Fard, A. P., & Mahoor, M. H. (2021). Xnodr and xnidr: Two accurate and fast fully connected layers for convolutional neural networks. arXiv preprint arXiv:2111.10854, .
- Szegedy et al. (2015) Szegedy, C., Liu, W., Jia, Y., Sermanet, P., Reed, S., Anguelov, D., Erhan, D., Vanhoucke, V., & Rabinovich, A. (2015). Going deeper with convolutions. In 2015 IEEE Conference on Computer Vision and Pattern Recognition (CVPR) (pp. 1–9).
- Tanaka et al. (2019) Tanaka, H., Adachi, H., Kazui, H., Ikeda, M., Kudo, T., & Nakamura, S. (2019). Detecting dementia from face in human-agent interaction. Adjunct of the 2019 International Conference on Multimodal Interaction, (pp. 1–6).
- Tang et al. (2020) Tang, F., Uchendu, I., Wang, F., Dodge, H. H., & Zhou, J. (2020). Scalable diagnostic screening of mild cognitive impairment using ai dialogue agent. Alzheimer’s & Dementia, 16.
- Tian et al. (2021) Tian, Y., Li, M., & Wang, D. (2021). Dfer-net: Recognizing facial expression in the wild. In 2021 IEEE International Conference on Image Processing (ICIP) (pp. 2334–2338).
- Torres Mendonça De Melo Fádel et al. (2019) Torres Mendonça De Melo Fádel, B., Santos De Carvalho, R. L., Belfort Almeida Dos Santos, T. T., & Dourado, M. C. N. (2019). Facial expression recognition in alzheimer’s disease: A systematic review. Journal of clinical and experimental neuropsychology, 41, 192–203.
- Umeda-Kameyama et al. (2021) Umeda-Kameyama, Y., Kameyama, M., Tanaka, T., Son, B.-K., Kojima, T., Fukasawa, M., Iizuka, T., Ogawa, S., Iijima, K., & Akishita, M. (2021). Screening of alzheimer’s disease by facial complexion using artificial intelligence. Aging, 13, 1765–1772.
- Villa et al. (2021) Villa, A., Sankar, V., & Shiboski, C. (2021). Tele (oral) medicine: A new approach during the covid-19 crisis. Oral Diseases, 27, 744.
- Wu et al. (2022) Wu, C.-Y., Mattek, N., Wild, K., Miller, L. M., Kaye, J. A., Silbert, L. C., & Dodge, H. H. (2022). Can changes in social contact (frequency and mode) mitigate low mood before and during the covid-19 pandemic? the i-conect project. Journal of the American Geriatrics Society, 70, 669–676.
- Xia et al. (2022) Xia, J., Zhang, H., Wen, S., Yang, S., & Xu, M. (2022). An efficient multitask neural network for face alignment, head pose estimation and face tracking. Expert Systems with Applications, 205, 117368.
- Yan et al. (2022) Yan, S., Xiong, X., Arnab, A., Lu, Z., Zhang, M., Sun, C., & Schmid, C. (2022). Multiview transformers for video recognition. In Proceedings of the IEEE/CVF Conference on Computer Vision and Pattern Recognition (CVPR) (pp. 3333–3343).
- Yu et al. (2021) Yu, K., Wild, K., Potempa, K., Hampstead, B. M., Lichtenberg, P. A., Struble, L. M., Pruitt, P., Alfaro, E. L., Lindsley, J., MacDonald, M. et al. (2021). The internet-based conversational engagement clinical trial (i-conect) in socially isolated adults 75+ years old: randomized controlled trial protocol and covid-19 related study modifications. Frontiers in digital health, 3, 714813.
- Yu et al. (2023) Yu, Y., Ni, R., Zhao, Y., Yang, S., Xia, F., Jiang, N., & Zhao, G. (2023). Msvt: Multiple spatiotemporal views transformer for deepfake video detection. IEEE Transactions on Circuits and Systems for Video Technology, (pp. 1–1).
- Zhang et al. (2019) Zhang, F., Li, Z., Zhang, B., Du, H., Wang, B., & Zhang, X. (2019). Multi-modal deep learning model for auxiliary diagnosis of alzheimer’s disease. Neurocomputing, 361, 185–195.