2022 December 27 \Accepted2023 March 14 \Published2023 April 8
light pollution — methods:observational — techniques: photometric
Multicolor and multi-spot observations of Starlink’s Visorsat
Abstract
This study provides the results of simultaneous multicolor observations for the first Visorsat (STARLINK-1436) and the ordinary Starlink satellite, STARLINK-1113 in the , , , , , , , , , , , and bands to quantitatively investigate the extent to which Visorsat reduces its reflected light. Our results are as follows: (1) in most cases, Virorsat is fainter than STARLINK-1113, and the sunshade on Visorsat, therefore, contributes to the reduction of the reflected sunlight; (2) the magnitude at 550 km altitude (normalized magnitude) of both satellites often reaches the naked-eye limiting magnitude ( 6.0); (3) from a blackbody radiation model of the reflected flux, the peak of the reflected components of both satellites is around the band; and (4) the albedo of the near infrared range is larger than that of the optical range. Under the assumption that Visorsat and STARLINK-1113 have the same reflectivity, we estimate the covering factor, , of the sunshade on Visorsat, using the blackbody radiation model: the covering factor ranges from . From the multivariable analysis of the solar phase angle (Sun-target-observer), the normalized magnitude, and the covering factor, the phase angle versus covering factor distribution presents a moderate anti-correlation between them, suggesting that the magnitudes of Visorsat depend not only on the phase angle but also on the orientation of the sunshade along our line of sight. However, the impact on astronomical observations from Visorsat-designed satellites remains serious. Thus, new countermeasures are necessary for the Starlink satellites to further reduce reflected sunlight.
1 Introduction
Several satellite operators have developed or are developing so-called mega-constellation projects to enhance the satellite internet access. On 2019 May 24, the first 60 Starlink satellites were launched to a low Earth orbit (LEO) by the US satellite operator SpaceX (United States US). SpaceX planned to have launched 42,000 Starlink LEO communication satellites by the mid-2020s. The International Astronomical Union (IAU) declared its concern that the extremely bright sunlight reflected from the Starlink satellites would affect the pristine appearance of the dark sky and astronomical observations111https://www.iau.org/news/pressreleases/detail/iau2001/. SpaceX has attempted to reduce the reflectivity of Starlink satellites and has asked astronomers to evaluate satellite brightness in response to the concerns of the IAU. The magnitudes of Starlink satellites and their impact on astronomical observations have been reported since the launch of the satellites ([Hainaut & Williams (2020)]; [Mallama (2020)]; [McDowell (2020)]; [Tregloan-Reed et al. (2020)], 2021). Namely, it has been suggested that (1) in the optical and IR wavelength ranges on telescopes, wide-field imaging surveys would be significantly affected by saturation produced by the mega-constellations of LEO satellites and ghosting from a satellite, and (2) those satellites will have a negative impact on observations with a long exposure and/or a wide field of view (FoV) in the twilight. According to the estimation by Kocifaj et al. (2021), the additional light pollution from mega-constellations and/or other large sets of orbiting bodies increases the luminance of a natural night sky by approximately 10.
On 2020 January 7, SpaceX launched the third batch of 60 LEO satellites. Among the 60 satellites, one satellite, STARLINK-1130 (nicknamed Darksat), is a prototype with a darkening treatment on its communication antenna to reduce the sunlight reflected to the Earth. The magnitudes of Darksat and STARLINK-1113 (i.e., one of the normal Starlink satellites) have been evaluated. Consequently, Darksat is 0.77 (for the Sloan band; Tregloan-Reed et al. (2020)) and has a 0.42 0.35 magnitude dimmer (for and band; see Table 3 of Tregloan-Reed et al. (2021)) than STARLINK-1113 did. Horiuchi, Hanayama, and Ohishi (2020) estimated the SDSS , the Cousins , and (hereafter, , , and , respectively) using simultaneous observations from the Murikabushi telescope/MITSuME system; they concluded that the coating on Darksat reduces its reflectivity by approximately half that of STARLINK-1113. However, the apparent magnitude of Darksat is 6.5 mag in the optical range, and its impact on astronomical observations is serious because the darkening treatment on Darksat alone is insufficient to abate reflected sunlight.
In addition to Darksat, SpaceX developed Starlink Visorsat with a sun visor to reduce the sunlight reflection. The first Visorsat, STARLINK-1436, was launched on 2020 June 3. All of the Starlink satellites launched in August were Visorsat-designed satellites. Mallama (2021) summarized the magnitudes of Visorsats in the visual band, and concluded that the mean visual magnitudes of Visorsats is 5.92 0.04 mag at an orbital height of 550 km. According to the measurements with the Dominion Astrophysical Observatory’s Plaskett 1.8 m telescope via the bandpass, the median magnitudes equivalent to the 550 km altitude of Visorsat and the ordinary Starlink satellites were 5.7 mag and 5.1 mag, respectively (Boley et al., 2022). However, multi-wavelength magnitudes of Visorsat have not yet been reported.
In this study, we verify the effectiveness of the sun visor of STARLINK-1436 (hereafter, Visorsat) is, thorough the UV/optical-to-NIR observations of Visorsat and STARLINK-1113 with the observation collaboration of optical and infrared synergetic telescopes for education and research (OISTER; M. Yamanaka in preparation), a collaboration project among Japanese universities. In section 2, we present the observations and data analysis of Visorsat and STARLINK-1113. In section 3, we describe the apparent and orbital altitude-scaled magnitudes of the satellites. In section 4, we discuss the albedo of Visorsat in each band and the shading effect of the sun visor.
2 Observations with the OISTER collaboration and Analysis
2.1 Observations
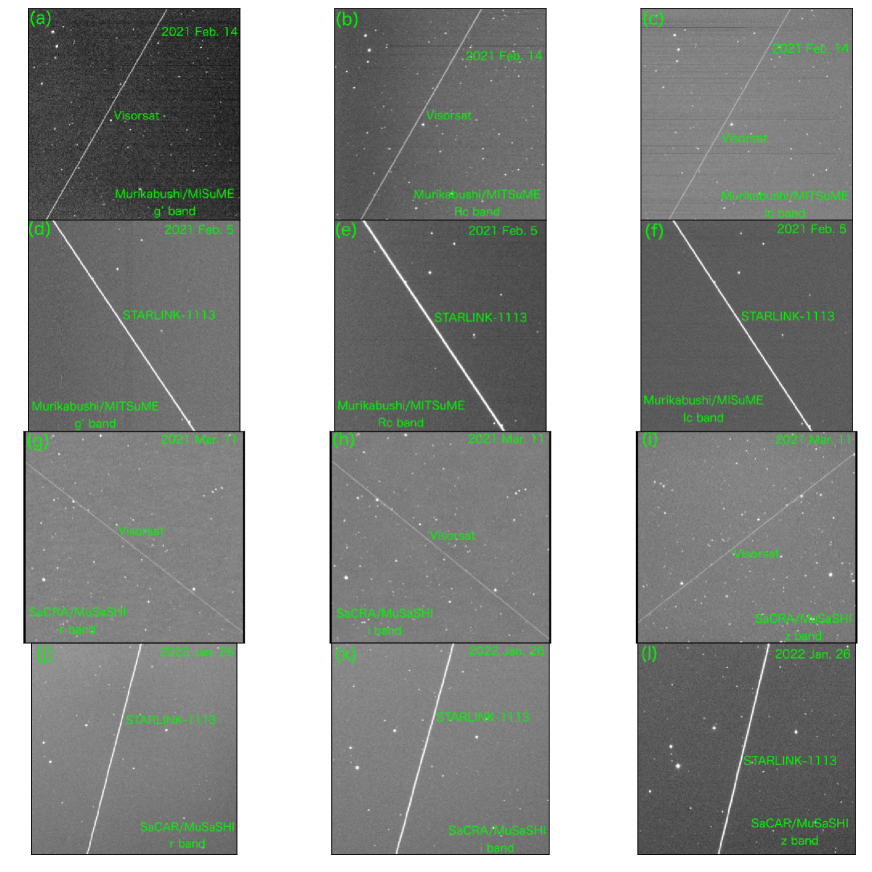
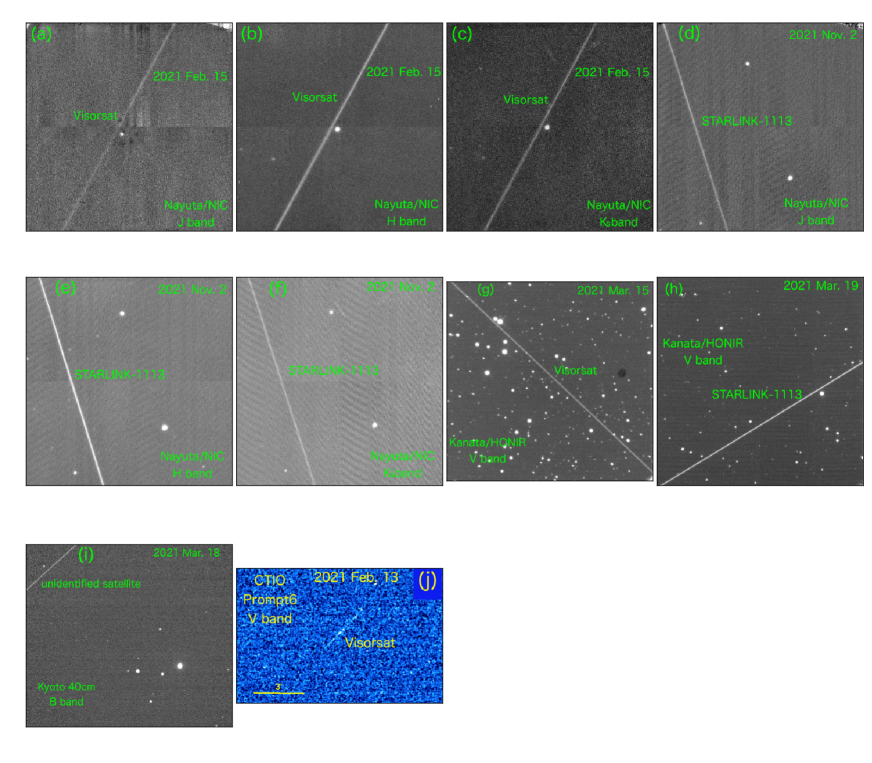
We conducted UV/optical-to-NIR imaging observations of Visorsat and STARLINK-1113. Table 1 lists the telescopes, instruments, color filters, and FoVs used in this study via the OISTER collaboration. Among the instruments in table 1, four conduct simultaneous multicolor observations: MITSuME (, , and bands), HONIR (one optical and one NIR bands), NIC (, , and bands), and MuSaSHI (, , and bands). The equatorial coordinates of the satellites were forecasted by 222http://www.sat.belastro.net/heavensat.ru/english/index.html using the two-line element (TLE) data from the Celestrak website333https://celestrak.com/satcat/search.php. Tracking the Starlink satellites with the telescopes listed in table 1 is difficult because these satellites move at high speeds (e.g., over 1000 arcsec s-1). Instead, we observed satellite trails and bright reference stars using star tracking. Figures 1 and 2 show examples of the trail images of Visorsat and STARLINK-1113 captured with the OISTER collaboration. The star images were elongated by stopping the telescopes to unify the photometric method of the satellite trails and comparison stars. However, not all of the telescopes in this study were able to elongate object images. Therefore, we measured the satellite magnitudes of the two methods as shown in the next section.
Table 2 summarizes the observation logs used in this study for the measurement of the satellite magnitudes and various analyses. We used orbital information (e.g., the coordinates at exposure times, phase angles, and distance between the satellite and observer) from the HORIZONS Web-Interface444https://ssd.jpl.nasa.gov/horizons.cgi. The exposure times were set to 5 s (or 3 s) to increase the success rate of observations and to improve the signal-to-noise ratio of reference stars, referring to Horiuchi, Hanayama, and Ohishi (2020). The exception is the UV/optical bands of the Kanata telescope/HONIR, which has a 20 s exposure owing to the constraint of the observation system (see also subsection 3.2).
2.2 Data Analysis
We conducted dome flat corrections and subtraction of dark, sky, and bad pixels and performed aperture photometry on the data using the Image Reduction and Analysis Facility package. Star images or bad pixels in the satellite trails were subtracted using images of the same target fields without these trails. We did not use the data taken with the 40 cm telescope and 0.41 m PROMPT-6 from our analysis, owing to their data having low signal-to-noise ratios ).
2.2.1 With Elongated Star Images
In this sub-subsection, we explain the method for measuring the satellite flux and magnitudes, referring to that described in Horiuchi, Hanayama, and Ohishi (2020). Because the satellite flux, , is diluted by the angular velocity of the satellites, (i.e., ), the magnitude of the satellite must consider the angular velocity as follows:
| (1) |
where ( arcsec s-1, decl.), , and are the angular velocities along celestial sphere, magnitude, and observed flux of the reference stars, respectively. In this case, is the reference star flux of the elongated images. In this manner, when both satellites and stars are elongated images, the scaling by the velocity ratio, , is necessary because either of those images is not the beginning and/or the end within the FoV. The angular velocity of the satellites is expressed as the transverse speed at the great-circular distance, :
| (2) |
where and are the right ascension, declination at the initial time and that at a certain time of observations, respectively. The magnitude uncertainties, , of the satellite trails can be estimated by the law of error propagation:
| (3) |
where , , and are the flux errors for the satellite trails, comparison stars, and the angular-velocity error of satellites, respectively. The flux error of the satellite trails or that of comparison stars can be estimated by the standard deviation of sky flux, , around the streaks: (or ) is the pixel width of the satellite (or elongated-star) trails. The angular-velocity error of a satellite is the mean value of the velocity difference between the central to the start exposure time, , and that of the central to the end time, .
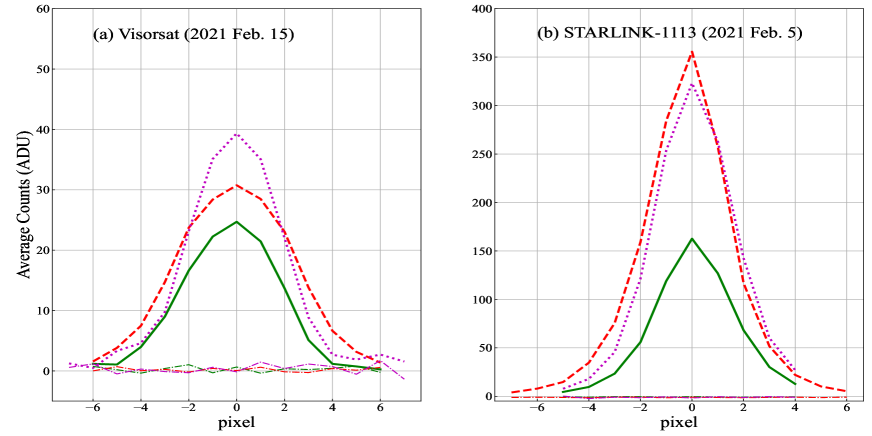
Figure 3 presents the pixel-wide average cross-sectional profiles of the Visorsat and STARLINK-1113 streaks captured by the Murikabushi telescope/MITSuME. These profiles were measured by of SAOimage DS9555https://sites.google.com/cfa.harvard.edu/saoimageds9, which allowed us to evaluate the average count of the cross-section sums of satellite trails along a rectangular region. We applied the following procedure to display the cross section of the satellite flux using : (1) make a vertical incision into the satellite trail with the width of the trail; (2) extend the incised area parallel to the thickness of the satellite trail, and create a rectangular area. Therefore, the average cross-sectional profile of the trail appears. We evaluated the satellite flux, , using , where is the count of the cross-section profile at the -th pixel, and its pixel width is . We applied the same rectangular shape as that used for the estimation of or to the sky region used to evaluate .
We elongated star images around target fields by tracking-off observations, so as to compare the flux counts of the Starlink satellites with those of reference stars in the same manner as that of the satellite trails (i.e., to apply equation 1). The elongated star images were obtained with the Murikabushi telescope, Akeno 50 cm telescope/MITSuME, and the Kanata telescope/HONIR. We selected the first and/or second brightest stars in the FoV as reference stars, which did not merged with nearby stars. Because both edges of the elongated-star images are rounded, they are not used when measuring the flux by . For details on the methods using elongated stars, refer to Horiuchi, Hanayama, and Ohishi (2020).
2.2.2 Without Elongated Star Images
For the cases in which elongated star images could not be obtained, the photometry of the satellites was performed by comparing the flux of satellite streaks with that of point sources (i.e., comparison stars). The total flux of a satellite trail is represented by , where is the length of the trail in the FoV. The definition of is the same as that described in the previous sub-subsection. Using the flux of comparison stars, , at the exposure time, , the flux at the effective satellite exposure time, , is described as . In other words, the satellite magnitude,
| (4) | |||||
does not depend on the trail length, . In this case, the magnitude error of the satellites is expressed as follows:
| (5) |
where is the flux error of the comparison stars measured using aperture photometry. Notably, the photometric method using equation (1) would not be more advantageous or disadvantageous than the methods described in this sub-subsection.
2.2.3 Magnitude conversion
To evaluate the multicolor magnitude of Visorsat and STARLINK-1113, we adopt the UCAC4 catalog, which is able to refer to the SDSS , , Johnson’s , , , and band magnitudes. The , , , and band magnitudes can be converted to the , , (for MITSuME), and band magnitudes (for MuSaSHI) by using the color terms and zeropoints in table 3 of Jordi et al. (2006):
| (6) | |||||
| (7) | |||||
| (8) | |||||
| (9) |
Because the band magnitudes are not listed in the UCAC4 catalog, we referred to them in the 2MASS data. We confirmed that the and band magnitudes in the UCAC4 catalog were the same values as those in 2MASS.
The list of telescopes/Instrument, filters, and references for this observation collaboration.
Institution
Telescope
Instrument
Filter(s)∗
FoV
Ref.
IAO/NAOJ
105 cm Murikabushi telescope
MITSuME
\timeform12’.3 \timeform12’.3
(1), (2), (3)
Hiroshima University
1.5 m Kanata telescope
HONIR
\timeform10’ \timeform10’
(4)
University of Hyogo
2.0 m Nayuta telescope
NIC
\timeform2’.7 \timeform2’.7
(5)
Kyoto University
40 cm Schmidt-Cassegrain telescope
Visual CCD
\timeform11’.5 \timeform11’.5
—
Akeno Observatory
50 cm telescope Akeno
MITSuME
\timeform28’ \timeform28’
(1), (2), (3)
Saitama University
0.55 m SaCRA telescope
MuSaSHI
\timeform12’.8 \timeform12’.4
(6)
Hokkoido University
1.6 m Pirka telescope
MSI
\timeform3’.3 \timeform3’.3
(7)
Skynet/CTIO
0.41 m PROMPT-6
FLI PL23042
\timeform15’.1 \timeform15’.1
(8)
{tabnote}
∗*∗*footnotemark: Filters used in this study.
References (1) Kotani et al. (2005), (2) Yatsu et al. (2007), (3) Shimokawabe et al. (2008),
(4) Akitaya et al. (2014), (5) Takahashi et al. (2014), (6) Oasa et al. (2020),
(7) Watanabe et al. (2012), and (8) Dutton et al. (2022)
Observation log of Visorsat and STARLINK-1113 for usable data.
Target
Visorsat
Visorsat
Visorsat
STARLINK-1113
Observation Date
2021 Feb 14
2021 Feb 15
2021 Mar 14
2021 Feb 5
Telescope
Murikabushi
Murikabushi
Murikabushi
Murikabushi
Instrument
MITSuME
MITSuME
MITSuME
MITSuME
Filter(s)
Start Time of Observation (UTC)
21:40:57
21:33:27
12:03:17
11:10:27
Central Time of Observation (UTC)
21:41:00
21:33:30
12:03:20
11:10:30
End Time of Observation (UTC)
21:41:02
21:33:32
12:03:22
11:10:32
Exposure Time (s)
5.0
5.0
5.0
5.0
RA
\timeform17h53m52.5s
\timeform14h13m33.94s
\timeform02h35m05.7s
\timeform02h45m14.2s
Dec
+\timeform02D04’06.8”
+\timeform21D39’01.7”
+\timeform34D23’55.4”
\timeform16D09’41.9”
Azimuth (∘)
61.6
265.3
299.0
214.7
Elevation (∘)
50.3
71.4
22.8
42.2
Airmass
1.30
1.05
2.55
1.48
(km)
694.54
575.51
1189.77
781.42
Solar Phase Angle (∘)
118.7
61.4
124.4
101.5
Observer Phase Angle (∘)
61.3
118.6
55.6
78.4
Angular Velocity (arcsec s-1)
1826.78 49.04
2587.01 26.01
812.41 16.89
1417.02 41.15
Target
STARLINK-1113
STARLINK-1113
STARLINK-1113
Visorsat
Observation Date
2021 Mar 17
2021 Mar 18
2021 Mar 22
2021 Nov 11
Telescope
Akeno 50 cm
Akeno 50 cm
Akeno 50 cm
Akeno 50 cm
Instrument
MITSuME
MITSuME
MITSuME
MITSuME
Filter(s)
Start Time of Observation (UTC)
19:53:58
19:48:28
19:26:58
09:12:28
Central Time of Observation (UTC)
19:54:00
19:48:30
19:27:00
09:12:30
End Time of Observation (UTC)
19:54:03
19:48:33
19:27:03
09:12:33
Exposure Time (s)
5.0
5.0
5.0
5.0
RA
\timeform18h26m36.3s
\timeform17h27m46.3s
\timeform10h41m52.5s
\timeform23h37m43.5s
Dec
\timeform-02D11’27.6”
+\timeform14D02’19.3”
+\timeform66D20’40.9”
\timeform-18D41’37.5”
Azimuth (∘)
143.8
155.1
331.5
149.9
Elevation (∘)
45.8
66.5
32.4
29.8
Airmass
1.40
1.09
1.86
2.08
(km)
781.42
595.91
944.37
993.21
Solar Phase Angle (∘)
99.3
83.7
68.9
62.6
Observer Phase Angle (∘)
80.7
96.3
111.1
117.4
Angular Velocity (arcsec s-1)
2021.02 13.43
2510.70 19.97
1582.80 5.74
1461.82 14.7
{tabnote}
∗*∗*footnotemark: Distance between Satellite and Observer.
(Continued)
Target
Visorsat
Visorsat
Visorsat
Visorsat
Observation Date
2022 Jan 17
2021 Mar 15
2021 Mar 15
2022 Jan 17
Telescope
Akeno 50 cm
Kanata
Kanata
Kanata
Instrument
MITSuME
HONIR
HONIR
HONIR
Filter(s)
Start Time of Observation (UTC)
9:27:58
10:19:52
10:19:52
9:26:54
Central Time of Observation (UTC)
9:28:00
10:20:02
10:19:55
9:27:04
End Time of Observation (UTC)
9:28:03
10:20:12
10:19:57
9:27:14
Exposure Time (s)
5.0
20.0
5.0
20.0
RA
\timeform00h06m52.27s
\timeform07h00m34.15s
\timeform06h49m6.8s
\timeform01h12m24.5s
Dec
\timeform-10D22’29.6”
\timeform-04D07’00.6”
\timeform-01D26’45.7”
\timeform-19D19’29.9”
Azimuth (∘)
222.4
173.0
177.4
195.0
Elevation (∘)
34.0
51.3
54.1
35.0
Airmass
1.63
1.26
1.26
1.79
(km)
906.24
685.40
662.76
937.95
Solar Phase Angle (∘)
118.2
70.3
73.0
106.6
Observer Phase Angle (∘)
61.8
109.7
107.0
73.3
Angular Velocity (arcsec s-1)
1080.83 29.46
1963.23 182.15
2080.71 44.71
1259.71 128.12
Target
Visorsat
Visorsat
Visorsat
STARLINK-1113
Observation Date
2022 Jan 17
2022 Jan 19
2022 Jan 19
2021 Mar 19
Telescope
Kanata
Kanata
Kanata
Kanata
Instrument
HONIR
HONIR
HONIR
HONIR
Filter(s)
Start Time of Observation (UTC)
09:26:54
09:14:53
09:14:53
19:42:21
Central Time of Observation (UTC)
09:26:57
09:15:03
09:14:56
19:42:31
End Time of Observation (UTC)
09:26:59
09:15:13
09:14:58
19:42:41
Exposure Time (s)
5.0
20.0
5.0
20.0
RA
\timeform01h04m2.8s
\timeform23h20m55.1s
\timeform23h14m51.3s
\timeform18h50m00.1s
Dec
\timeform-20D55’37”
+\timeform17D10’26.7”
+\timeform13D42’20”
+\timeform29D50’25.0”
Azimuth (∘)
196.8
254.5
251.5
88.0
Elevation (∘)
33.0
50.7
47.5
58.7
Airmass
1.79
1.31
1.32
1.16
(km)
925.08
690.72
720.08
635.29
Solar Phase Angle (∘)
108.8
118.9
122.1
101.3
Observer Phase Angle (∘)
71.2
61.1
57.9
78.7
Angular Velocity (arcsec s-1)
1167.52 29.5
1872.82 189.03
1731.73 46.05
2244.87 167.29
{tabnote}
∗*∗*footnotemark: Note 1 RA, Dec, azimuth, elevation, airmass, , solar phase angle,
and observer phase angle are values at the central exposure time.
Note 2 the difference of the imaging system between
the HONIR or and passbands makes the differences of
exposure times, RA and decl. at a central exposure time, and so on.
(Continued) Target STARLINK-1113 STARLINK-1113 STARLINK-1113 STARLINK-1113 Observation Date 2021 Mar 19 2021 Mar 22 2022 Jan 24 2022 Jan 24 Telescope Kanata Kanata Kanata Kanata Instrument HONIR HONIR HONIR HONIR Filter(s) Start Time of Observation (UTC) 19:42:21 19:26:42 10:34:55 10:34:55 Central Time of Observation (UTC) 19:42:24 19:26:52 10:35:05 10:34:58 End Time of Observation (UTC) 19:42:26 19:27:02 10:35:15 10:35:00 Exposure Time (s) 5.0 20.0 20.0 5.0 RA \timeform18h31m29.2s \timeform00h17m23.4s \timeform23h24m30.6s \timeform23h09m23.1s Dec +\timeform27D18’09.7” +\timeform83D41’59.3” +\timeform42D57’26.5” +\timeform43D22’14” Azimuth (∘) 95.6 6.28 300.2 301.6 Elevation (∘) 61.6 31.2 40.6 38.0 Airmass 1.16 1.90 1.59 1.59 (km) 618.8 970.8 805.8 843.3 Solar Phase Angle (∘) 97.5 97.1 105.5 107.0 Observer Phase Angle (∘) 82.5 82.9 74.5 73.0 Angular Velocity (arcsec s-1) 2359.22 40.87 1281.29 100.82 1391.29 155.07 1279.96 35.33 Target Visorsat STARLINK-1113 Visorsat Visorsat Observation Date 2021 Feb 15 2021 Nov 2 2021 Mar 11 2021 Mar 15 Telescope Nayuta Nayuta SaCRA SaCRA Instrument NIC NIC MuSaSHI MuSaSHI Filter(s) Start Time of Observation (UTC) 19:54:57 09:07:02 10:43:28 10:19:59 Central Time of Observation (UTC) 19:55:00 09:07:05 10:43:31 10:20:00 End Time of Observation (UTC) 19:55:02 09:07:07 10:43:33 10:20:02 Exposure Time (s) 5.0 5.0 5.0 3.0 RA \timeform17h03m32.3s \timeform17h13m31.0s \timeform01h31m13.5s \timeform04h22m21.9s Dec +\timeform03D58’59.4” +\timeform02D21’12.2” +\timeform62D03’51.9” \timeform-10D10’59.8” Azimuth (∘) 123.7 249.6 326.4 229.1 Elevation (∘) 43.78 30.1 32.7 29.3 Airmass 1.44 1.99 1.85 2.03 (km) 761.3 992.20 940.74 1005.99 Solar Phase Angle (∘) 105.3 136.0 110.4 109.7 Observer Phase Angle (∘) 74.7 44.0 69.6 70.3 Angular Velocity (arcsec s-1) 1509.96 43.58 1027.67 24.91 1065.11 27.85 1506.41 0.98 Target Visorsat Visorsat STARLINK-1113 Visorsat Observation Date 2021 Nov 15 2021 Nov 17 2022 Jan 26 2021 Mar 9 Telescope SaCRA SaCRA SaCRA Pirka Instrument MuSaSHI MuSaSHI MuSaSHI MSI Filter(s) Start Time of Observation (UTC) 08:46:59 08:35:00 08:47:59 09:16:57 Central Time of Observation (UTC) 08:47:00 08:35:01 08:48:00 09:17:00 End Time of Observation (UTC) 08:47:02 08:35:03 08:48:02 09:17:02 Exposure Time (s) 3.0 3.0 3.0 5.0 RA \timeform18h21m04.2s \timeform16h22m13.1s \timeform06h02m53.1s \timeform14h05m12.9s Dec +\timeform18D37”06.0’ +\timeform45D36’51.6” +\timeform15D13’28.8” +\timeform75D09’53.8” Azimuth (∘) 262.7 306.1 98.8 15.5 Elevation (∘) 42.5 32.0 38.0 35.2 Airmass 1.48 1.90 1.62 1.73 (km) 777.46 957.08 844.00 889.91 Solar Phase Angle (∘) 122.5 114.3 36.2 74.6 Observer Phase Angle (∘) 57.5 65.7 143.8 105.4 Angular Velocity (arcsec s-1) 1603.68 23.59 1524.99 7.85 1417.83 20.80 1683.70 3.95 {tabnote}
(Continued) Target Visorsat STARLINK-1113 Visorsat Observation Date 2021 Mar 9 2021 Mar 19 2021 Feb 13 Telescope Pirka Pirka PROMPT-6 Instrument MSI MSI FLI PL23042 Filter(s) Start Time of Observation (UTC) 10:55:07 19:45:17 00:20:00 Central Time of Observation (UTC) 10:55:10 19:45:20 — End Time of Observation (UTC) 10:55:12 19:45:22 — Exposure Time (s) 5.0 5.0 0.2 RA \timeform02h34m12.2s \timeform18h41m12.2s \timeform02h50m33.6s Dec +\timeform32D39’18.9” +\timeform19D16’29.6” +\timeform41D34’36.3” Azimuth (∘) 286.0 142.3 334.4 Elevation (∘) 32.4 49.1 11.4 Airmass 1.86 1.32 4.89 (km) 942.26 709.73 1719.79 Solar Phase Angle (∘) 120.7 100.6 91.16 Observer Phase Angle (∘) 59.3 79.4 88.83 Angular Velocity (arcsec s-1) 1120.81 28.12 2132.09 3.19 784.88 {tabnote}
3 Results
In this section, we will present the multicolor magnitudes and colors of Visorsat and STARLINK-1113.
3.1 Apparent and normalized magnitude
We measured not only the apparent magnitudes but also the magnitudes at the satellite orbital altitude of 550 km (hereafter, normalized magnitude; see Horiuchi, Hanayama, and Ohishi (2020), Tregloan-Reed et al. (2020), and Boley et al. (2022)), because the apparent magnitude dims as the distance, , between an observer and a satellite increases. The normalized magnitude was calculated by adding a factor of to equations (1) and (4). We determined the distance error, : an averaged value of the distance difference between the start and central exposure time, , and that of the central to end time, .
Table 3 presents the apparent and normalized magnitudes of Visorsat and STARLINK-1113, and whether equation (1) or (4) was used to measure the magnitudes. We confirmed the following trends: (1) the magnitude of Visorsat is generally dimmer than that of STARLINK-1113; (2) the normalized magnitudes of both satellites are often brighter ( 6.0 mag) than the naked-eye limiting magnitude; (3) the shorter the observed wavelength is, the larger the satellite magnitudes tend to be. The band observations with the 1.6 m Pirka telescope/MSI did not detect the satellite trails of Visorsat nor STARLINK-1113.
3.2 Phase angle dependence of the satellite magnitudes and colors
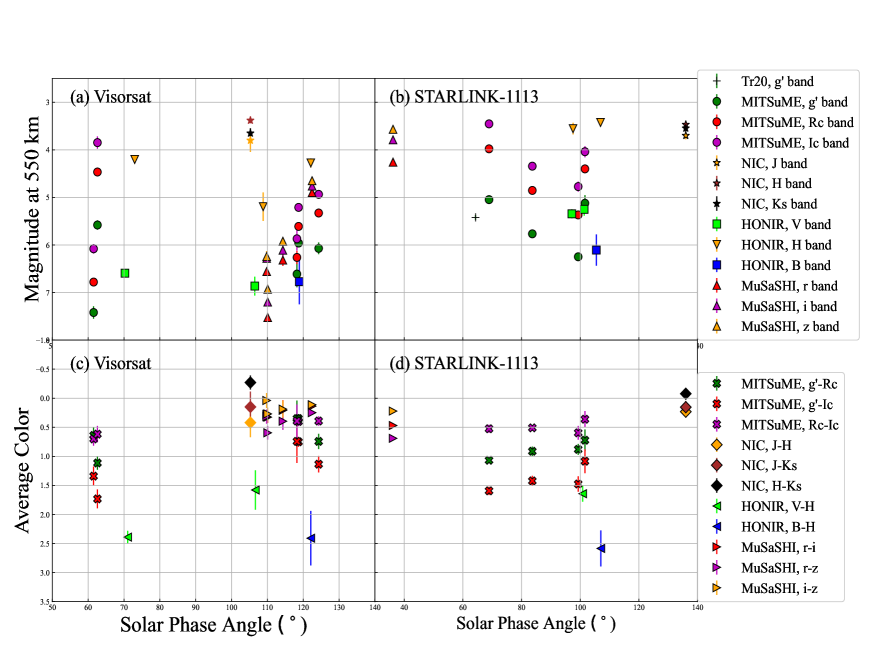
Mallama (2021) and other study666https://amostech.com/TechnicalPapers/2021/Non-Resolved-Object-Characterization/Johnson.pdf showed a negative (or positive) correlation between the satellite magnitude and phase angle for many normal Starlink satellites, Visorsats and Darksat in the solar phase angles of (or ) in the visual magnitude, . This section describes the phase angle dependence of the normalized magnitudes estimated in the previous sections. Figure 4 shows the phase angle dependence of the normalized magnitudes and colors of Visorsat and STARLINK-1113. The normalized magnitudes, especially for the MITSuME data (also the MuSaSHI data for Visorsat), tended to increase with phase angles over 100∘. We confirmed that this trend is consistent with the results of aforementioned report even with multicolor observations. Because the number of data points in is too small, we cannot strictly verify the trend in this range. However, the phase angle versus magnitude diagrams (figures 4a and 4b) presented considerable scatters except for the phase angle dependence of the magnitude. For instance in figure 4a, the -, -, and -band magnitude differences between the datapoints at 61.4∘ and 62.6∘ are 2 mag despite their small phase angle difference with each other. The possible causes of such magnitude scattering are discussed in section 4. Overall, STARLINK-1113 tended to be 1 mag brighter than Visorsat.
To demonstrate trend (3) in the previous subsection, we derived the colors of the two satellites. The colors obtained from simultaneous multicolor observations can be defined as follows: , , (MITSuME), , , (MuSaSHI), , (HONIR), , , and (NIC). Table 4 summarizes the averaged colors of Visorsat and STARLINK-1113, where, the word, “averaged” means the difference in average magnitudes (table 3) between two bands. From the system difference of optical and near infrared imaging, the HONIR data yields a 15 s time lag between two bands; the central or end exposure time, the coordinates, phase angles, angular velocity, and so forth are different between the (or ) and band (table 2). In this study, the colors, and , are therefore pseudo colors. Moreover most of the colors are positive, and the and (or ) combinations present small (or negative) values compared with the other positive colors. This result indicates that the peak of the reflection flux lies in the wavelength range from the to band. No notable color differences between Visorsat and STARLINK-1113 and no clear phase angle dependence of the colors were observed (figures 4c and 4d). This result is naturally understood because the surface materials of the Visorsat and STARLINK-1113 would be the same.
Magnitudes of Visorsat, STARLINK-1113, and reference stars. Date Reference Star Vega Magnitude Vega Magnitude Normalized Magnitude∗ (Reference Star) (Satellite) (Satellite) Target: Visorsat, Telescope/Instrument: 105 cm Murikabushi telescope/MITSuME† 2021 Feb 14 HD 163080 : 10.96 6.51 0.05 6.00 0.06 : 9.58 6.15 0.04 5.64 0.05 : 8.91 5.70 0.05 5.20 0.05 TYC 421-1373-1 : 10.91 6.41 0.05 5.91 0.06 : 10.06 6.10 0.04 5.59 0.05 : 9.62 5.73 0.05 5.22 0.06 Average (): 6.46 0.05 5.96 0.06 Average (): 6.12 0.04 5.62 0.05 Average (): 5.72 0.05 5.21 0.06 2021 Feb 15 TYC 1475-739-1 : 10.74 7.61 0.06 7.51 0.06 : 9.93 6.92 0.03 6.82 0.03 : 9.43 6.15 0.07 6.05 0.07 UCAC4 558-053934 : 13.46 7.43 0.17 7.33 0.17 : 12.11 6.83 0.08 6.74 0.08 : 11.49 6.20 0.12 6.10 0.12 Average (): 7.52 0.13 7.42 0.13 Average (): 6.88 0.06 6.78 0.06 Average (): 6.18 0.10 6.08 0.10 2021 Mar 14 UCAC4 623-007922 : 11.90 7.77 0.15 6.09 0.15 : 10.93 7.16 0.04 5.48 0.04 : 10.40 6.69 0.06 5.01 0.07 TYC 2332-522-1 : 11.36 7.72 0.09 6.05 0.09 : 10.77 6.85 0.03 5.17 0.04 : 10.38 6.53 0.06 4.86 0.07 Average (): 7.74 0.12 6.07 0.12 Average (): 7.00 0.03 5.33 0.04 Average (): 6.61 0.06 4.94 0.07 Target: STARLINK-1113, Telescope/Instrument: 105 cm Murikabushi telescope/MITSuME† 2021 Feb 5 UCAC4 370-003115 : 12.76 5.77 0.11 5.00 0.11 : 12.01 5.23 0.04 4.47 0.05 : 11.60 4.82 0.09 4.06 0.10 UCAC4 370-003114 : 13.91 6.00 0.20 5.24 0.21 : 13.07 5.09 0.09 4.33 0.10 : 12.59 4.78 0.13 4.02 0.13 Average (): 5.89 0.17 5.12 0.17 Average (): 5.16 0.07 4.40 0.08 Average (): 4.80 0.11 4.04 0.12 Target: Visorsat, Telescope/Instrument: Akeno 50 cm/MITSuME† 2021 Nov 11 BD-20 6624 : 11.22 6.89 0.09 5.61 0.09 : 10.69 5.79 0.05 4.51 0.05 : 10.37 5.21 0.12 3.93 0.12 BD-20 6621 : 11.14 6.83 0.11 5.55 0.11 : 10.67 5.71 0.06 4.43 0.06 : 10.33 5.05 0.14 3.77 0.14 Average () 6.86 0.10 5.58 0.10 Average () 5.75 0.06 4.46 0.06 Average () 5.13 0.13 3.85 0.12 {tabnote} ∗ Magnitudes at a height of 550 km.
† Magnitudes estimated by equation (1).
‡ Magnitudes estimated by equation (4).
(Continued) Date Reference Star Vega Magnitude Vega Magnitude Normalized Magnitude∗ (Reference Star) (Satellite) (Satellite) Target: Visorsat, Telescope/Instrument: Akeno 50 cm/MITSuME† 2022 Jan 17 UCAC4 399-000139 : 12.73 7.69 0.34 6.61 0.34 : 12.16 7.35 0.15 6.27 0.15 : 11.80 6.96 0.28 5.88 0.28 UCAC4 399-000135 : 12.38 7.70 0.19 6.61 0.19 : 11.89 7.34 0.13 6.25 0.14 : 11.72 6.94 0.21 5.86 0.21 Average () 7.69 0.28 6.61 0.28 Average () 7.35 0.14 6.26 0.15 Average () 6.95 0.24 5.87 0.25 Target: STARLINK-1113, Telescope/Instrument: Akeno 50 cm/MITSuME† 2021 Mar 17 BD-02 4622 : 11.66 6.93 0.08 6.28 0.08 : 10.65 6.02 0.04 5.37 0.04 : 9.97 5.41 0.09 4.77 0.09 BD-02 4617 : 11.28 6.86 0.07 6.21 0.08 : 10.58 6.01 0.06 5.37 0.06 : 10.11 5.43 0.12 4.78 0.12 Average () 6.90 0.08 6.25 0.08 Average () 6.02 0.05 5.37 0.05 Average () 5.42 0.11 4.77 0.10 2021 Mar 18 IRAS 17251+1347 : 11.52 6.01 0.10 5.83 0.10 : 9.45 4.95 0.02 4.78 0.02 : 7.72 4.45 0.04 4.27 0.04 BD+13 3376 : 10.00 5.87 0.04 5.70 0.04 : 9.45 5.10 0.03 4.93 0.03 : 8.95 4.59 0.04 4.41 0.04 Average () 5.94 0.08 5.77 0.08 Average () 5.03 0.02 4.85 0.03 Average () 4.52 0.04 4.34 0.04 2021 Mar 22 TYC 4151-615-1 : 10.57 6.23 0.01 5.06 0.02 : 9.91 5.15 0.01 3.97 0.01 : 9.56 4.64 0.04 3.49 0.04 TYC 4151-677-1 : 11.71 6.21 0.03 5.03 0.03 : 10.80 5.15 0.02 3.98 0.02 : 10.31 4.61 0.09 3.44 0.09 Average () 6.22 0.03 5.05 0.03 Average () 5.15 0.02 3.98 0.02 Average () 4.63 0.07 3.45 0.07 Median magnitude of Visorsat and STARLINK-1113 in , , and bands Visorsat () 7.52 0.10 6.07 0.10 Visorsat () 6.84 0.04 5.61 0.05 Visorsat () 6.18 0.09 5.21 0.09 STARLINK-1113 () 6.11 0.07 5.47 0.08 STARLINK-1113 () 5.15 0.03 4.63 0.04 STARLINK-1113 () 4.71 0.09 4.17 0.09 {tabnote}
(Continued) Date Reference Star Vega Magnitude Vega Magnitude Normalized Magnitude∗ (Reference Star) (Satellite) (Satellite) Target: Visorsat, Telescope/Instrument: Kanata/HONIR† 2021 Mar 15 TYC 4805-96-1 : 10.64 7.06 0.12 6.61 0.13 : 9.86 4.66 0.06 4.21 0.07 HD 295837 : 11.15 7.06 0.12 6.61 0.12 : 10.65 4.56 0.10 4.10 0.10 Average () 7.06 0.12 6.61 0.12 Average () 4.61 0.08 4.15 0.09 2022 Jan 17 TYC 5853-116-1 : 11.76 7.86 0.16 6.82 0.20 : 10.40 6.40 0.10 5.27 0.10 UCAC4 350-001273 : 11.01 7.95 0.15 6.91 0.20 2MASS 01080945-2008310 : 12.22 6.25 0.41 5.12 0.41 Average () 7.90 0.16 6.86 0.20 Average () 6.32 0.30 5.20 0.30 2022 Jan 19 UCAC4 529-148682 : 12.82 7.10 0.31 6.60 0.34 : 9.56 4.94 0.08 4.35 0.09 UCAC4 529-148667 : 13.91 7.44 0.57 6.94 0.58 : 10.58 4.78 0.10 4.20 0.11 Average () 7.27 0.46 6.77 0.48 Average () 4.86 0.09 4.27 0.10 Target: STARLINK-1113, Telescope/Instrument: Kanata/HONIR† 2021 Mar 19 BD+29 3349 : 10.06 5.46 0.09 5.16 0.12 : 7.97 3.78 0.03 3.48 0.09 TYC 2120-535-1 : 11.86 5.64 0.12 5.34 0.15 : 10.09 3.93 0.07 3.63 0.11 Average () 5.56 0.11 5.25 0.13 Average () 3.85 0.05 3.55 0.10 2021 Mar 22 TYC 4619-103-1 : 10.49 6.56 0.09 5.32 0.10 TYC 4619-147-1 : 11.23 6.60 0.09 5.37 0.10 Average () 6.58 0.09 5.34 0.10 2022 Jan 24 BD+42 4606 : 11.15 7.10 0.13 6.27 0.19 : 5.97 4.35 0.04 3.42 0.06 TYC 3229-1917-1 : 12.62 6.78 0.40 5.95 0.43 : 10.75 4.36 0.09 3.43 0.10 Average () 6.94 0.30 6.11 0.33 Average () 4.35 0.07 3.43 0.08 Median magnitude of Visorsat and STARLINK-1113 in and bands Visorsat () 7.46 0.14 6.72 0.16 Visorsat () 4.86 0.10 4.28 0.10 STARLINK-1113 () 6.10 0.09 5.33 0.11 STARLINK-1113 () 4.14 0.06 3.45 0.09 Target: Visorsat, Telescope/Instrument: Nayuta/NIC‡ 2021 Feb 15 UCAC4 471-058903 11.31 4.50 0.24 3.80 0.24 10.71 4.08 0.05 3.38 0.06 10.41 4.36 0.10 3.65 0.11 {tabnote}
(Continued) Date Reference Star Vega Magnitude Vega Magnitude Normalized Magnitude∗ (Reference Star) (Satellite) (Satellite) Target: STARLINK-1113, Telescope/Instrument: Nayuta/NIC‡ 2021 Nov 2 UCAC4 462-062055 11.45 5.16 0.08 3.88 0.09 10.89 4.80 0.04 3.52 0.05 10.80 4.84 0.07 3.56 0.07 UCAC4 462-062051 10.55 4.80 0.06 3.52 0.07 9.78 4.70 0.03 3.42 0.04 9.60 4.81 0.07 3.53 0.07 Average () 4.98 0.07 3.70 0.08 Average () 4.75 0.03 3.47 0.05 Average () 4.83 0.07 3.55 0.07 Target: Visorsat, Telescope/Instrument: 0.55 m SaCRA telescope/MuSaSHI‡ 2021 Mar 11 BD+61 273 : 9.60 8.18 0.07 7.03 0.08 : 9.39 7.79 0.05 6.64 0.06 : 9.28 7.47 0.08 6.32 0.09 TYC 4031-453-1 : 10.22 8.07 0.07 6.91 0.08 : 10.30 7.80 0.05 6.65 0.06 : 10.35 7.59 0.08 6.44 0.09 Average () 8.12 0.07 6.97 0.08 Average () 7.80 0.05 6.64 0.06 Average () 7.53 0.08 6.38 0.09 2021 Mar 15 TYC 5316-793-1 : 11.27 7.87 0.04 6.56 0.04 : 11.08 7.63 0.06 6.32 0.06 : 10.98 7.57 0.11 6.26 0.11 TYC 5316-685-1 : 11.71 7.87 0.04 6.56 0.04 : 11.53 7.55 0.06 6.24 0.06 : 11.44 7.54 0.11 6.23 0.11 Average () 7.87 0.04 6.56 0.04 Average () 7.59 0.06 6.28 0.06 Average () 7.55 0.11 6.24 0.11 2021 Nov 15 HD 348402 : 9.58 5.64 0.02 4.89 0.02 : 9.27 5.50 0.02 4.75 0.02 : 9.10 5.39 0.02 4.64 0.02 HD 348403 : 10.10 5.66 0.02 4.91 0.02 : 9.74 5.52 0.02 4.77 0.02 : 9.55 5.41 0.02 4.66 0.02 Average () 5.65 0.02 4.90 0.02 Average () 5.51 0.02 4.76 0.02 Average () 5.40 0.02 4.65 0.02 2021 Nov 17 TYC 3492-1641-1 : 10.56 7.51 0.12 6.31 0.12 : 10.47 7.28 0.12 6.08 0.12 : 10.42 7.09 0.08 5.89 0.08 UCAC4 678-059331 : 12.74 7.53 0.13 6.33 0.13 : 12.61 7.35 0.12 6.14 0.12 : 12.54 7.16 0.08 5.96 0.08 Average () 7.52 0.12 6.32 0.12 Average () 7.31 0.12 6.11 0.12 Average () 7.13 0.08 5.92 0.08 Median magnitude of Visorsat in , , and bands Visorsat () 7.70 0.06 6.44 0.06 Visorsat () 7.44 0.06 6.19 0.06 Visorsat () 7.31 0.08 6.09 0.09 {tabnote}
(Continued) Date Reference Star Vega Magnitude Vega Magnitude Normalized Magnitude∗ (Reference Star) (Satellite) (Satellite) Target: STARLINK-1113, Telescope/Instrument: 0.55 m SaCRA telescope/MuSaSHI‡ 2022 Jan 26 BD+15 1039 : 10.00 5.18 0.02 4.25 0.03 : 9.61 4.71 0.02 3.78 0.03 : 9.39 4.47 0.02 3.54 0.02 TYC 1313-716-1 : 10.03 5.19 0.02 4.26 0.03 : 9.68 4.73 0.02 3.80 0.03 : 9.49 4.52 0.02 3.59 0.02 Average () 5.19 0.02 4.26 0.03 Average () 4.72 0.02 3.79 0.03 Average () 4.50 0.02 3.57 0.02 {tabnote}
Averaged Colors of Visorsat and STARLINK-1113. Telescope/Instrument: 105cm Murikabushi telescope/MITSuME Satellite Date Visorsat 2021 Feb 14 0.34 0.06 0.74 0.07 0.41 0.06 Visorsat 2021 Feb 15 0.64 0.14 1.34 0.16 0.70 0.11 Visorsat 2021 Mar 14 0.74 0.13 1.13 0.14 0.39 0.07 STARLINK-1113 2021 Feb 5 0.72 0.18 1.08 0.20 0.36 0.13 Telescope/Instrument: Akeno 50 cm/MITSuME Satellite Date Visorsat 2021 Nov 11 1.11 0.11 1.73 0.16 0.62 0.14 Visorsat 2022 Jan 17 0.35 0.31 0.74 0.37 0.39 0.28 STARLINK-1113 2021 Mar 17 0.88 0.09 1.48 0.13 0.60 0.12 STARLINK-1113 2021 Mar 18 0.91 0.08 1.42 0.09 0.51 0.05 STARLINK-1113 2021 Mar 22 1.07 0.03 1.59 0.07 0.53 0.07 Target: Visorsat, Telescope/Instrument: Nayuta/NIC Satellite Date Visorsat 2021 Feb 15 0.42 0.24 0.15 0.26 0.27 0.11 STARLINK-1113 2021 Nov 2 0.23 0.08 0.15 0.10 0.07 Target: Visorsat, Telescope/Instrument: Kanata/HONIR Satellite Date Visorsat 2021 Mar 15 2.39 0.11 — Visorsat 2022 Jan 17 1.58 0.34 — Visorsat 2022 Jan 19 — 2.41 0.47 STARLINK-1113 2021 Mar 19 1.64 0.14 — STARLINK-1113 2022 Jan 24 — 2.58 0.31 Telescope/Instrument: 0.55 m SaCRA telescope/MuSaSHI Satellite Date Visorsat 2021 Mar 11 0.33 0.09 0.59 0.11 0.27 0.10 Visorsat 2021 Mar 15 0.28 0.07 0.32 0.12 0.04 0.13 Visorsat 2021 Nov 15 0.14 0.02 0.25 0.02 0.11 0.02 Visorsat 2021 Nov 17 0.21 0.17 0.40 0.15 0.19 0.15 STARLINK-1113 2022 Jan 26 0.47 0.03 0.69 0.02 0.22 0.03 {tabnote}
4 Discussion
This section discusses the following contents: the reflectivity of Visorsat and STARLINK-1113 based on a blackbody model and a brightness comparison with Visorsat and Darksat.
4.1 The reflectivity of Visorsat and STARLINK-1113
4.1.1 Construction of the reflected flux model
Horiuchi, Hanayama, and Ohishi (2020) modeled the , , and band flux of Darksat and STARLINK-1113 streaks, together with their blackbody radiation:
| (10) |
where , , , and are the Planck constant, wavelength, the speed of light, and the Boltzmann constant, respectively. This study evaluated the Vega magnitudes of Visorsat and STARLINK-1113. In this section, we convert these magnitudes to AB flux with the zero-point correction by Blanton & Roweis (2007) and then fit it to the blackbody model.
We define the covering factor, , as the fraction of the sun visor of a Visorsat that reduces the amount of sunlight reflected from the satellite surface. The covering factor of the Visorsat depends on the positional relation between the observer, sun, and the satellite. To derive the albedo and the covering factor of the Visorsat, we formulated the reflection of sunlight, , the earthshine, , the thermal radiation of the satellite, , and the reflection of Earth’s thermal radiation, (see also Sekiguchi et al. (2003)) in the blackbody model:
| (11) | |||||
| (12) | |||||
| (13) | |||||
| (14) |
where , is the temperature of the Sun, is the temperature of Earth’s surface, cf. Horiuchi, Hanayama, and Ohishi (2020)) is the temperature of the surface of the Starlink satellites, (and ) is the radius of the Sun (and the Earth), is the orbital height of the satellites, (and ) is the modeled albedo with the blackbody (and albedo of the Earth), is infrared emissivity (; Lebofsky et al. (1986)), and and are the solar (Sun-target-observer), and observer (Sun-observer-target) phase angle, respectively. The phase integral, , as a first-approximation function is expressed by:
| (15) |
We adapted a satellite radius, , of 1.69 m, based on the surface area of the Starlink satellites of 3 3 m2. The derivation of equations (11) – (14) is explained in the Appendix of Horiuchi, Hanayama, and Ohishi (2020). To restrict the aforementioned blackbody model, we set the following rules: (i) Visorsats and normal Starlink satellites have the same albedo, , because the base of Visorsat uses the same surface material as normal Starlink satellites; (ii) the covering factor, , is zero for the ordinary Starlink satellites (i.e., STARLINK-1113 in this study); (iii) if the albedo of STARLINK-1113 differs among several observations, the average of them is adopted as the albedo of Visorsat; and (iv) for simplicity, this analysis does not consider the attitude of these satellites.
The albedo error, , of STARLINK-1113 was calculated by applying the law of error propagation to the albedo as a function of , where is the sum of the left-hand sides of equations (11) – (14) and the satellite flux obtained from our observations:
| (16) |
We computed the AB flux, , and its error, , in Jy. In the cases of observations with the Murikabushi telescope/MITSuME , , and bands, for example, we defined the final albedo error, , as follows:
| (17) |
In this study the errors for each band were comparable. The covering factor errors of Visorsat are similarly determined by the law of error propagation for a function, , where is the averaged albedo for each epoch of STARLINK-1113.
4.1.2 Model fitting to AB flux
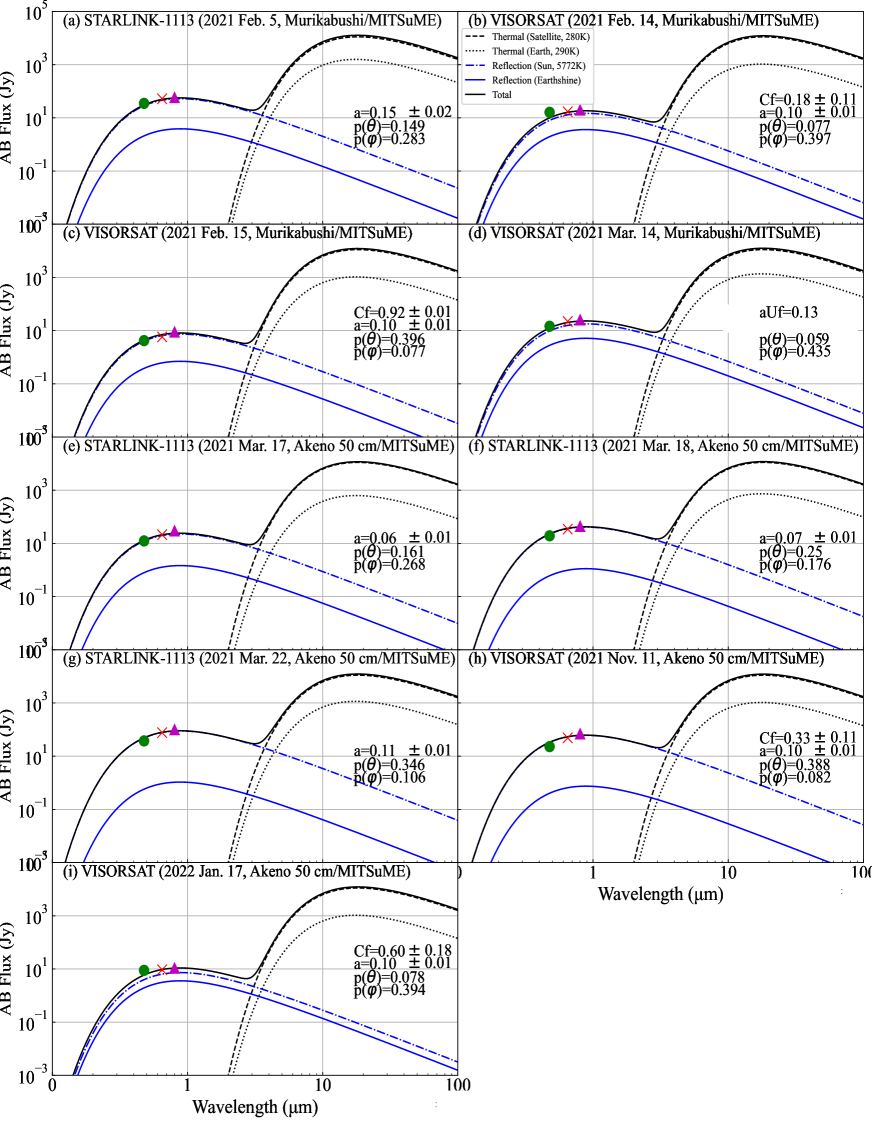
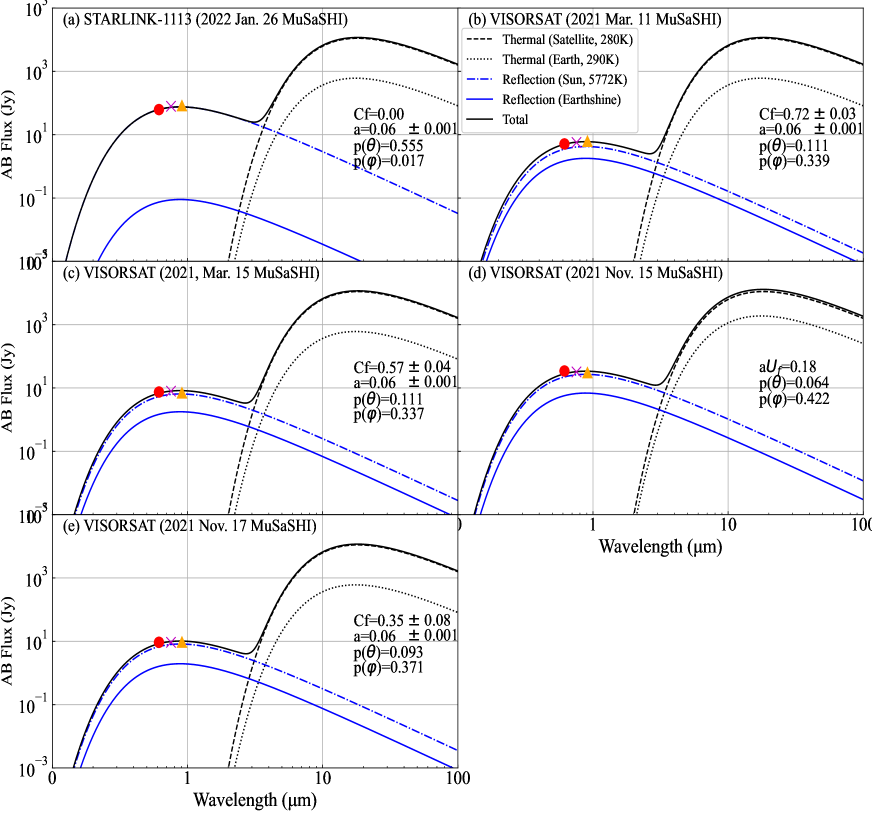
Figures 5 – 8 present the fitting results of the blackbody model to the AB flux at the height of 550 km for Visorsat and STARLINK-1113, and their albedo and covering factor are also shown. While the range of the covering factor of is so wide that its average value over figures 5 – 8 () is consistent with that of the design of Visorsat (Cole, 2021). We confirmed that the systematic darkness of Visorsat compared with that of STARLINK-1113 (e.g., figure 4) can be interpreted by the covering factor (i.e., the effect of the visor on Visorsat).
Exceptionally on 2021 March 14 (or November 15), the Visorsat trail captured with the Murikabushi telescope (or SaCRA telescope) showed an outstandingly high flux, to which we can not fit by the blackbody model with 0.10 (or 0.06) for the albedo of STARLINK-1113 (see figures 5d and figure 6d). The product of albedo and covering factor, , of 0.13 (or 0.18) for Visorsat taken with the Murikabushi telescope (or SaCRA telescope) is the largest among the values in figure 5 (or in figure 6). We considered the effect of moonlight reflection from Visorsat: the elevation of the nearly full moon on 2021 November 15 was 37∘ at the observation site. However, the model flux of the moonlight reflection (see Appendix C in Horiuchi, Hanayama, and Ohishi (2020)) was found to be negligible 10-5 Jy at most. We probably observed Visorsat located in the azimuth and elevation regions, where the reflection became highly effective (Lawler et al., 2022). The diffuse reflection from the front surface of the solar panel probably contributed to the high flux of the Visorsat trail captured by the SaCRA telescope, owing to the brightness from the back surface of the panel being approximately 6.0 mag even in the lower orbit, according to observations by Cole (2021). Other possible scenarios of unexpected outliers include differences in the satellite attitude; the attitude difference between satellites produces extremely bright or dark trails. As shown in figures 4a and 4b, there are cases where the scattering of magnitudes is noticeable even between datapoints with close phase angles: the covering-factor difference of Visorsat between the phase angles at 61.4∘ and 62.6∘ (figure 4a) is 0.6 (figures 5c and 5h). This scattering and the extremely large reflection flux aforementioned may be explained by the difference in satellite attitude. However, incorporating the satellite attitude into the blackbody model is difficult because TLEs do not contain such information. Hence, a quantitative discussion on this topic will be presented in our future work.
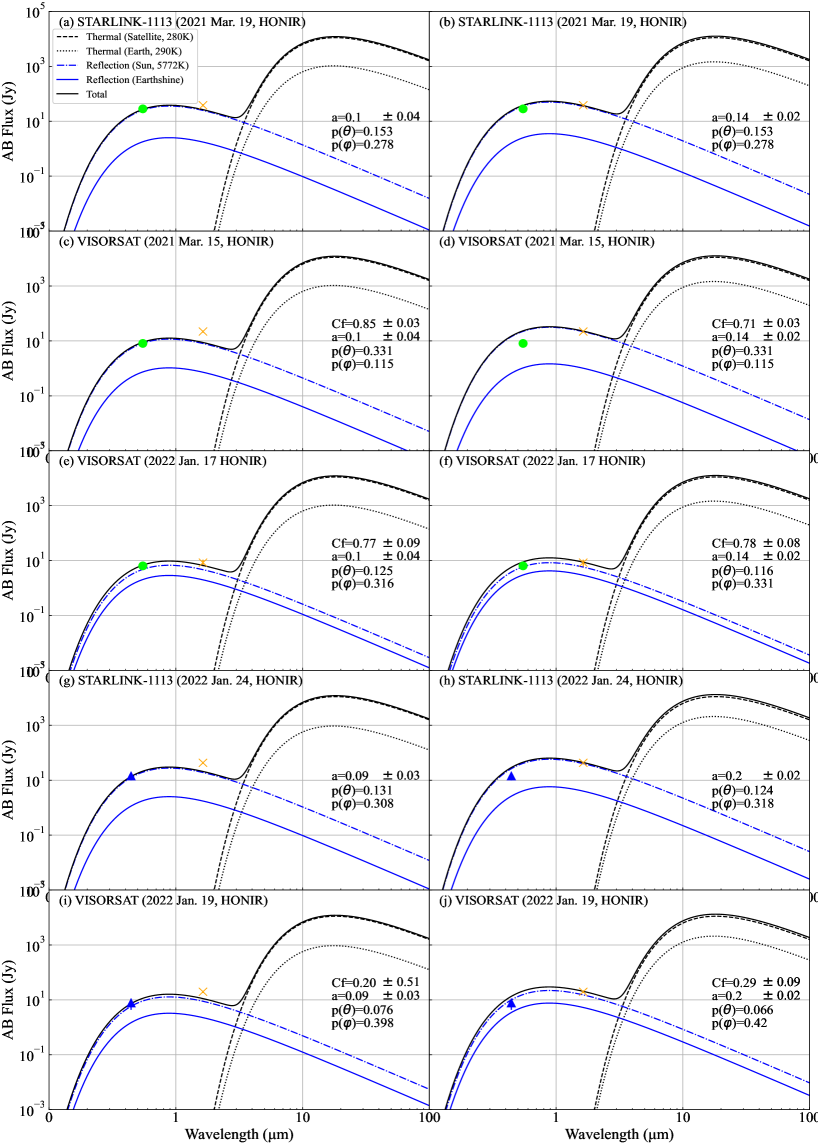
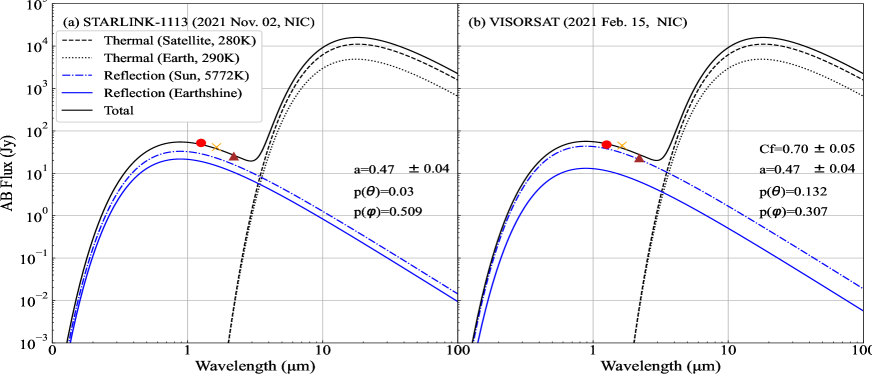
In both satellites, the wavelength at which the reflected components (i.e., ) peak is approximately in the band range, which is consistent with the results of the color estimation in subsection 3.1 (see table 4 and figure 6). The estimated albedo, , in the and bands (= 0.47 for the Nayuta/NIC data, figure 8) tended to be larger than that in the optical range. This trend also appeared in the Kanata/HONIR data: the (or and ) band flux was well fitted by the blackbody models with albedo larger (or smaller) than the and (or ) band flux (figure 7). Although it is difficult to explain the higher albedo () than that in the band obtained with the Kanata/HONIR data () with the simple blackbody model, the albedo can be estimated to be much smaller by considering the reflection from the solar panels for both satellites (Cole, 2021). Hence the longer the wavelength separation among different bands, the more difficult it is to fit the blackbody model with a unique albedo for the satellite flux. For example, the absolute reflectivities of SOLBLACK, PHOSBLACKIII777https://www.akg.jp/puresijyone/products/solbk.htm, and aluminum rapidly increased above a wavelength of 1 m. This result likely indicates the wavelength dependence of the reflectivity on satellite-surface materials.
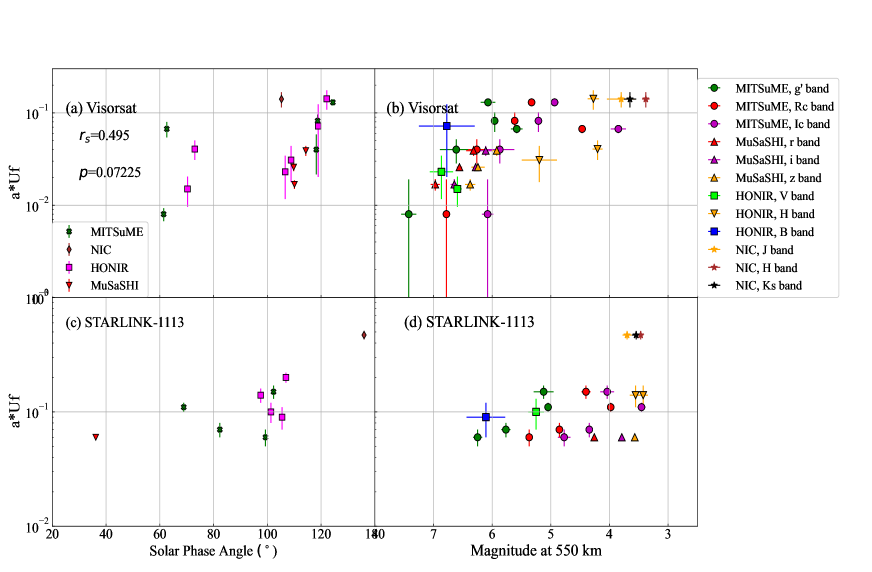
4.2 Relations among magnitude, phase angle and covering factor
Another study (Mallama, 2021) claimed that the visual magnitudes of Visorsat had a minimum value around a phase angle of 90∘. However, to discuss the detailed effect of the sun visor of Visorsat, we had to investigate the relations between normalized magnitude (), phase angle (), and covering factor (). As shown in figure 9, we confirmed these relations by comparing the difference between Visorsat and STARLINK-1113, using - and - distributions. We estimated the Spearman’s rank correlation coefficient for the - distribution of Visorsat as follows:
| (18) |
where and are the number of data points of the two variables and the difference in the ranks of the -th element, respectively. The magnitude scattering of the MITSuME data is likely caused by the phase angle or albedo dependence of their magnitudes (figure 9d). Moreover, the albedo of STARLINK-1113 is almost independent of the phase angle in the same wavelength range (figure 9c). Therefore, the upward-sloping distributions for Visorsat (figures 9a and 9b) indicate that (i) the covering factor is moderately anti-correlated with respect to the phase angle ( with = 0.072); and (ii) the smaller the covering factor is, the brighter the magnitudes of Visorsat tend to become. The same trend was observed when we considered the satellite radius, as a parameter ( m with , i.e., including the solar panels) based on figure 21 in Cole (2021). Thus, we quantitatively demonstrated the the shading effect of the visor on Visorsat and also verified the phase angle dependence of this effect under conditions far from Earth’s shadow. In figure 9a, two outliers, on the left side (one of the MITSuME data) and the NIC data, suggest that factors other than the phase angle reduce how effective the shading effect of the sun visor is (e.g., orientation of the visor along our line of sight). Nevertheless, the normalized magnitudes tended to decrease as the covering factor increased (figure 9b). Because the , , and band magnitudes of Visorsat were relatively bright (table 3), those data points were plotted in the upper right of figure 9b.
4.3 Comparison of Visorsat and Darksat magnitudes
Although we demonstrated the shading effect of Visorsat, its impact on astronomical observations remains serious. Regarding the normalized -band magnitude of Visorsat, the median value of 6.07 0.10 mag (table 3) is comparable to or slightly dimmer than that of 5.7 mag estimated by Boley et al. (2022). In addition, these magnitudes are slightly brighter than those of Darksat in the band (e.g., Tregloan-Reed et al. (2020), 6.1 mag; Horiuchi, Hanayama, and Ohishi (2020), 6.3 mag). The measurement by Tregloan-Reed et al. (2021) demonstrated that the normalized magnitudes of Darksat in the , , , and bands were 5.63 0.07 mag, 5.00 0.03 mag, 4.21 0.01 mag, and 3.97 0.02 mag, respectively. In table 3, the median magnitudes of Visorsat are significantly dimmer (or slightly brighter) than those of Darksat in the and bands (or in the and bands): 6.44 0.06 mag (for the band), 6.19 0.06 mag (for band), 3.80 0.24 mag (for band), and 3.65 0.11 mag (for the band). On the basis of the aforementioned, concluding that Visorsat is darker than Darksat is difficult. Visorsat-designed satellites should to implement new countermeasures to reduce reflected sunlight.
5 Conclusion
We measured the multicolor magnitudes of Virorsat and STARLINK-1113 with simultaneous multicolor observations by the OISTER collaboration and investigated the effects of the sun visor of Virorsat. The results of this study can be summarized as follows:
-
(1)
In most cases, Virorsat is dimmer than STARLINK-1113, and the sunshade on Visorsat therefore contribute to the reduction of reflected sunlight (subsections 3.1, 4.1, and 4.2; );
-
(2)
The normalized magnitudes of both satellites often reach the naked-eye limiting magnitude ( 6.0);
-
(3)
From the color estimation (subsection 3.1 and table 4) and the blackbody radiation model analysis (subsection 4.1), the peak of the reflected components of both satellites are around the band range (figure 6);
-
(4)
The albedo in the near infrared range is larger than that in the optical (figures 7 and 8);
-
(5)
For considering the shading effect of Visorsat, the multivariable analysis between the phase angle, the magnitude at 550 km altitude, and the covering factor show that two parameters are necessary: the phase angle and the orientation of the visor along our line of sight (figure 9).
Thus, the simultaneous multicolor observations facilitated our detailed investigation of a shading treatment for Visorsat. However, the observational impact from Visorsat remains profound. Visorsat-designed satellites are required to further reduce the reflected sunlight with new countermeasures. For example, if Visorsat is equipped with visors on both sides, the sunlight reflection will be reduced further.
Acknowledgment
We thank to the staff at the Ishigakijima Astronomical Observatory and Yaeyama Star Club for the supporting the authors (T.H. and H.H). M.O. is also grateful to all the staff at the Public Relations Center, NAOJ. This research is supported by the Optical and Infrared Synergetic Telescopes for Education and Research (OISTER) program funded by the MEXT of Japan. We are indebted to Takahiro Nagayama, Kouji Ohta, Kazuhiro Sekiguchi and Mamoru Doi for their helpful comments. The anonymous referee provided very useful comments for improving this study. The fourth U.S. Naval Observatory CCD Astrograph Catalog (UCAC4) was provided by Zacharias N., Finch C.T., Girard T.M., Henden A., Bartlet J.L., Monet D.G., and Zacharias M.I. This publication uses data products from the Two Micron All Sky Survey, which is a joint project of the University of Massachusetts and the Infrared Processing and Analysis Center/California Institute of Technology, funded by the National Aeronautics and Space Administration and the National Science Foundation. The MITSuME system was supported by a Grant-in-Aid for Scientific Research on Priority Areas (grant number 19047003).
list of authors ††affiliationtext: the authors’ affiliation \KeyWords
References
- Akitaya et al. (2014) Akitaya, H., et al. 2014, Proc. SPIE, 9147, 91474O
- Blanton & Roweis (2007) Blanton, M. R., & Roweis, S. 2007, AJ, 133, 734
- Boley et al. (2022) Boley, A. C., Wright, E., Lawler, S., Hickson, P., & Balam, D. 2022, AJ, 163, 199
- Cole (2021) Cole, R. E. 2021, arXiv:2107.06026
- Dutton et al. (2022) Dutton, D. A., Reichart, D. E., Haislip, J. B., Kouprianov, V. V., Shaban, O. H., & Vasquez S. A. 2022, PASP, 134, 015001
- Hainaut & Williams (2020) Hainaut, O. R., & Williams, A. P. 2020, A&A, 636, A121
- Horiuchi, Hanayama, and Ohishi (2020) Horiuchi, T., Hanayama, H., & Ohishi, M. 2020, ApJ, 905, 3
- Jordi et al. (2006) Jordi, K., Grebel, E. K., & Ammon, K. 2006, A&A, 460, 339
- Kocifaj et al. (2021) Kocifaj, M., Kundracik, F., Barentine, J. C., & Bará, S. 2021, MNRAS, 504, L40
- Kotani et al. (2005) Kotani, T., et al. 2005, Nuovo Cimento C Geophysics Space Physics C, 28, 755
- Lawler et al. (2022) Lawler, S. M., Boley, A. C., & Rein, H. 2022, AJ, 163, 21
- Lebofsky et al. (1986) Lebofsky, L. A., et al. 1986, Icar, 68, 239
- Mallama (2020) Mallama, A. 2020, arXiv:2003.07805
- Mallama (2021) Mallama, A. 2021, arXiv:2101.00374
- McDowell (2020) McDowell, J. C. 2020, ApJ, 892, L36
- Oasa et al. (2020) Oasa, Y., Ushioda, K., Shibata, Y., Seino, G., Kino, M., & Akitaya, H. 2020, Proc. SPIE, 11447, 114475Z
- Sekiguchi et al. (2003) Sekiguchi T., Abe M., Boehnhardt H., Dermawan, B., Hainaut, O., R., & Hasegawa, S. 2003, A&A397, 325
- Shimokawabe et al. (2008) Shimokawabe, T., et al. 2008, Gamma-ray Bursts 2007, 1000, 543
- Takahashi et al. (2014) Takahashi, J., et al. 2014, PASJ, 66, 53
- Tregloan-Reed et al. (2020) Tregloan-Reed, J., Otarola, A., Ortiz, E., Molina, V., Anais, J., González, R., Colque, J., P., & Unda-Sanzana, E. 2020, A&A, 637, L1
- Tregloan-Reed et al. (2021) Tregloan-Reed, J., et al. 2021, A&A, 647, A54
- Watanabe et al. (2012) Watanabe, M., Takahashi, Y., Sato, M., Watanabe, S., Fukuhara, T., Hamamoto, K., & Ozaki, A. 2012, Proc. SPIE, 8446, 84462O
- Yatsu et al. (2007) Yatsu, Y., et al. 2007, Physica E Low-Dimensional Systems and Nanostructures, 40, 434