Bounding Box Annotation with Visible Status
Abstract
Training deep-learning-based vision systems requires the manual annotation of a significant amount of data to optimize several parameters of the deep convolutional neural networks. Such manual annotation is highly time-consuming and labor-intensive. To reduce this burden, a previous study presented a fully automated annotation approach that does not require any manual intervention. The proposed method associates a visual marker with an object and captures it in the same image. However, because the previous method relied on moving the object within the capturing range using a fixed-point camera, the collected image dataset was limited in terms of capturing viewpoints. To overcome this limitation, this study presents a mobile application-based free-viewpoint image-capturing method. With the proposed application, users can collect multi-view image datasets automatically that are annotated with bounding boxes by moving the camera. However, capturing images through human involvement is laborious and monotonous. Therefore, we propose gamified application features to track the progress of the collection status. Our experiments demonstrated that using the gamified mobile application for bounding box annotation, with visible collection progress status, can motivate users to collect multi-view object image datasets with less mental workload and time pressure in an enjoyable manner, leading to increased engagement.
Index Terms:
Automatic Annotation, Computer Vision, Deep Learning, Object Detection, Object RecognitionI Introduction
In recent years, highly accurate object detection systems with deep learning (DL) have garnered attention in the fields of logistics [1], waste treatment [2], manufacturing [3], and retailing [4]. Their industries, where new target objects arrive quickly one after another, require the prompt collection of a new training dataset and retraining of an object detection model. However, because it takes considerable time and effort to collect the training dataset, it is extremely difficult to complete the process from the introduction of new objects to the execution of object detection. This problem is urgent not only for camera-only applications such as product detection, waste detection, defective mechanical part detection, and automatic cash registers but also for automatic operations with vision-based robot systems in their fields [5, 6, 7, 8].
In collecting training datasets, normally with an annotation tool, we must manually draw bounding boxes around objects in the images and carefully label each object enclosed by each bounding box. This annotation process is time-consuming and labor-intensive. Noisy annotations degrade the performance of the trained models [9]. Manual annotation of existing datasets has been considered problematic due to its low quality (e.g., low consistency) [10], and there have been attempts to address this issue through more laborious re-annotation with guidelines [11]. The manual annotation process presents certain subjectiveness (particularly when occlusions are present), and the quality of annotation might get degraded as annotators become fatigued.
Crowdsourcing is an efficient and cost-effective method of collecting annotated image datasets. To control the quality of crowdsourced annotations, human-in-the-loop verification techniques [12], web-based image annotation interfaces [13, 14], and web-based video annotation platforms [15, 16] have been proposed. However, there is always a possibility of human error, and as a result, the trained DL model did not achieve the best performance.
To address this issue, Kiyokawa et al. proposed a method that uses visual markers as tools to automatically obtain annotations from images [5, 7]. They attached markers to each object and placed the marker-attached objects in different poses in the real world. This method enables automatic annotation of each object using visual marker detection and pose estimation. Visual-marker-based automatic annotation allows for consistent annotation even in the presence of occlusions. In addition to the annotation process, Kiyokawa et al. developed a system that automatically changes object poses [17]. Using a hand-eye robot and a rotating stage, the camera fixed on the arm tip can capture objects in various poses by moving the camera and object.
The previous dataset collection framework [17] required a reduction in the difference between dataset collection and system deployment environments. Even when we apply domain adaptation methods, the object detection accuracy does not exceed 79% [17]. Even more surprisingly, small datasets collected semi-automatically in the real world significantly improved the detection accuracy compared to datasets generated by domain adaptations. However, the collection system developed is large-scale; thus, cannot be scaled up to a technology that can be used in various situations.
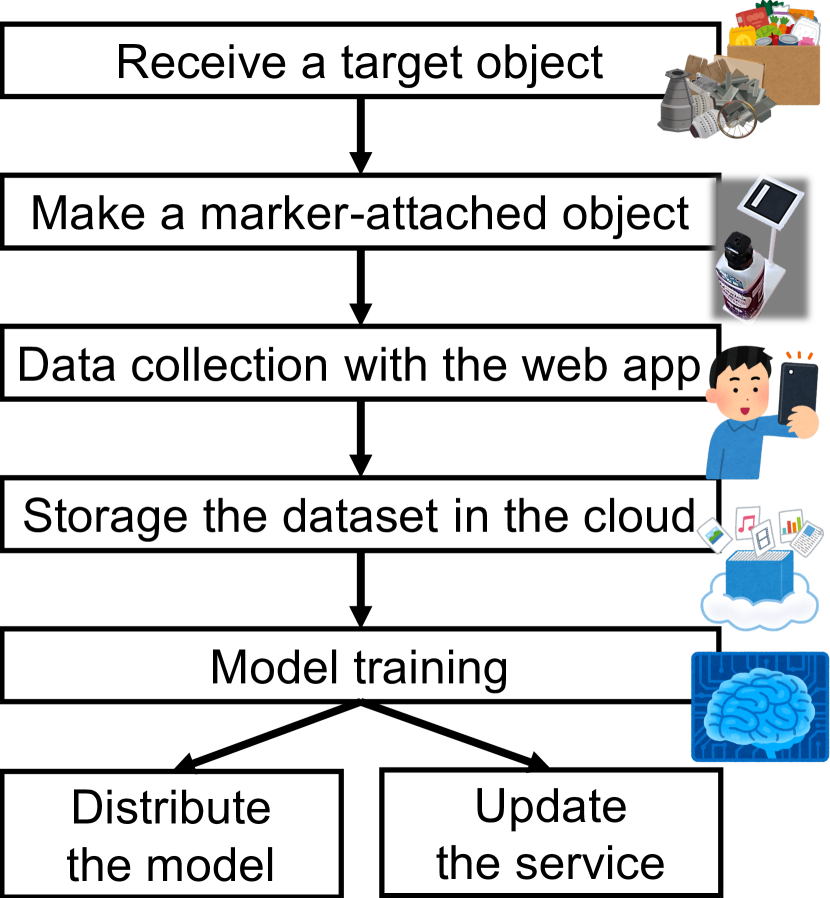
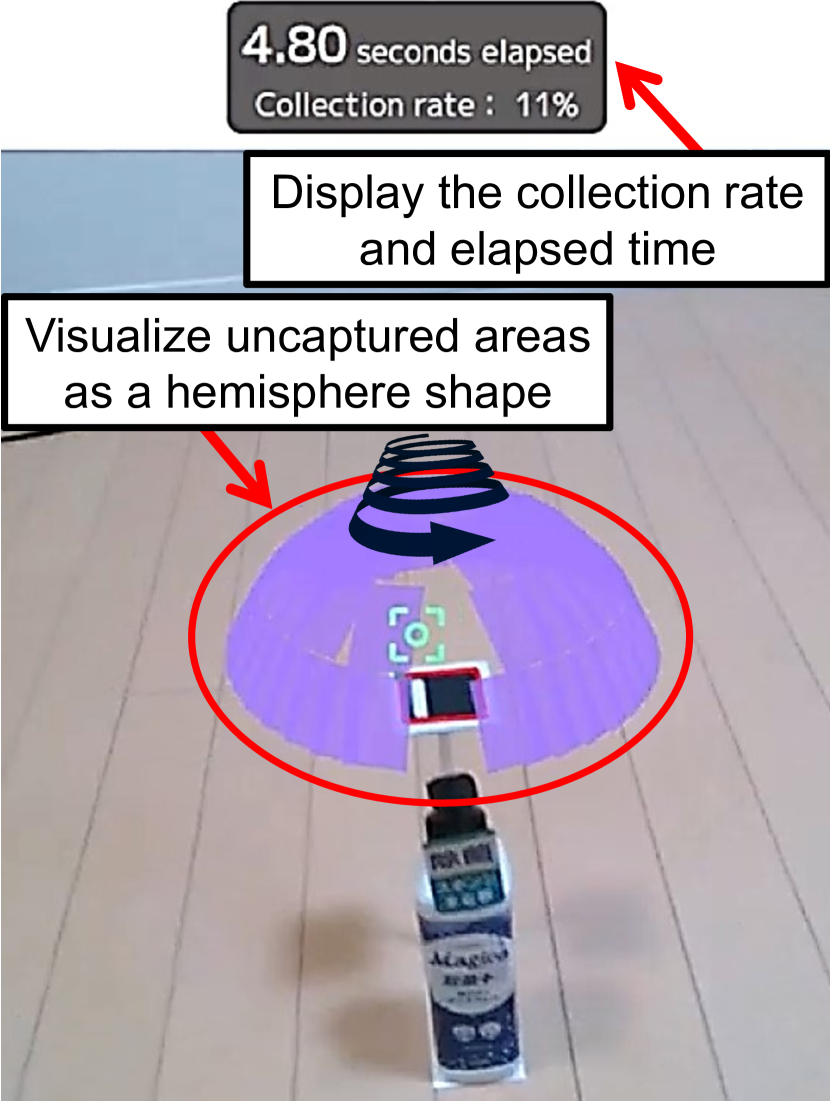
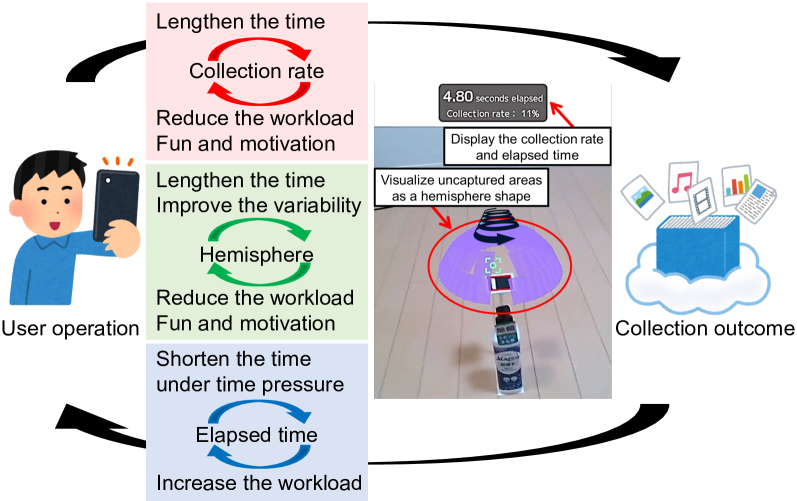
This study aims to develop a method for compactly collecting multi-view object image datasets, which is a web application that allows users to easily capture free-viewpoint images in the real world. Users can follow the steps shown in Fig. 1(a) to collect images of the target object by moving a camera device around the target object, which will be automatically annotated later. Fig. 1(b) shows an example of the application display showing the collection rate that increases to 100% (defined as the target number that the user specifies), uncollected viewpoints with a hemisphere-shaped object, and elapsed time from the collection started.
To encourage users to work on this human-in-the-loop dataset collection, user enjoyment and engagement (motivation) in using the application are crucial. Therefore, we implemented the following three simple yet effective application features to show dataset collection statuses. For the DL-based object detector dataset, it is necessary to acquire images from various directions. By displaying both types of positions (already captured and must be captured) in the hemisphere and gamifying the process, where users quickly erase all the surfaces of this hemisphere, the quality of the dataset can be improved simultaneously. Furthermore, by providing a collection time ranking feature at the end of the application execution, users may perceive the application as a game where they aim to quickly erase the hemisphere.
-
ET
Elapsed time: Displaying the elapsed time encourages users to quickly collect datasets under time pressure.
-
CR
Collection rate: Displaying the collection rate gives users feedback on the collection’s success, leading to motivation and enjoyment of the task.
-
Hm
A hemisphere: Representing uncollected areas as a hemisphere shape allows users to find where to move the camera, resulting in the collection of multi-view image datasets in an engaging and enjoyable manner.
| Collection performance | ||||||||
| Method | Collection time | Variability | ||||||
| ET |
|
|
||||||
| CR |
|
|
||||||
| Hm |
|
|
||||||
| Operation quality | ||||||||
| Method | Workload | Enjoyement | Engagement | Time pressure | ||||
| ET |
|
|
|
|
||||
| CR |
|
|
|
|
||||
| Hm |
|
|
|
|
||||
Table I organizes expectations on collection performance and operation quality benefitted from the proposals.
Our experiments conducted an ablation study on these expectations. To measure the effect of each function (e.g., ET, CR, and Hm), we conducted experiments by comparing the proposed method (where all three functions were included) with three other methods (where each function was removed). Our experiments focused on evaluating the mental workload, usability, and efficiency of users during dataset collection trials using the proposed mobile application-based method. The proposed application is equipped with three functions (ET+CR+Hm) for web applications. In our experiments, we prepared comparative methods without each application function and performed a thorough evaluation of several aspects. First, seven participants answered NASA Task Load Index (NASA-TLX) [18] questionnaire on mental workload, System Usability Scale (SUS) [19] questionnaire on usability, custom questionnaire on enjoyment, and engagement (motivation) immediately after using the application. Second, we measured the time taken for the collection trials and calculated the variability of collected datasets. This study contributes to the literature in two ways:
-
1.
To scale up the applicability of automatically annotating object images, we presented a cloud-sourcing-based mobile application for collecting multi-view image datasets.
-
2.
Comprehensive evaluations demonstrated that incorporating the three application functions (ET, CR, and Hm) can lead to dataset collection with less mental workload and time pressure in an engaging and enjoyable manner.
II Related Works
This section describes related studies on gamification techniques for effective training dataset collection and the benefits of cloud-based dataset collection.
II-A Gamification in Collecting Dataset
In the field of computer vision, to annotate proper labels for images on the web toward more accurate image search, Ahn et al. [20] introduced an interactive system: a game that is fun and can be used to provide meaningful labels for images on the web. Deng et al. [21] presented a game known as bubbles that reveals discriminative image features used by humans. The player’s goal is to identify the category of heavily blurred images. They further proposed an image recognition algorithm, Bubble Bank, which uses human-selected bubbles to improve the recognition performance.
Similar to our purpose, Kavasidis et al. [22] presented a flash game that aims to easily generate the ground truth for testing fish detectors. They developed an online game known as Flash the Fish in which the user is shown videos from underwater environments and has to take photos of the fish by clicking on them. This method relies on manually clicking on fish in images. Comparing the results obtained to a hand-drawn ground truth confirmed that a game that implicitly controls user quality can easily create reliable images and video annotations. However, this game is limited to fish detection, and the game creator must invest significant efforts in designing game scenarios for each domain-specific detection model.
In another study addressing dataset creation for object detection, Fusiello et al. [23] proposed an approach to detect and label objects within images. They described a two-player web-based guessing game called Ask’nSeek, which supports these tasks in a fun and interactive manner. Ask’nSeek requires users to guess the location of a hidden region within an image using semantic and topological clues; thus, this is a semi-automatic annotation method unlike ours. The information collected from game logs was combined with the results of image content analysis algorithms and used to feed a machine-learning algorithm that outputs the outline of the most relevant regions within the image and their names.
II-B Cloud-based Data Sharing
Several researchers have studied the potential benefits of cloud robotics technologies such as big data, cloud computing, collective robot learning, and human computation, as discussed and surveyed in [24, 25, 26].
In the field of robotic manipulation, grasping [27] and vision systems [28, 29] that utilize cloud computing and Internet services have been proposed thus far. Previous studies demonstrated the feasibility of practical cloud-based robotic applications. One remaining important issue is the construction of an effective dataset collection method for training systems with a particular affinity for the cloud robotics framework. Without a dataset collection method that can be easily and quickly uploaded to the Internet, we cannot assume that a large number of databases are available on the Internet; thus, responding promptly when various new objects appear is highly difficult. Among these dataset collection problems, our study focuses on object image dataset collection, assuming a cloud-based robot vision system.
III Mobile Application-based Dataset Collection
III-A System Implementation
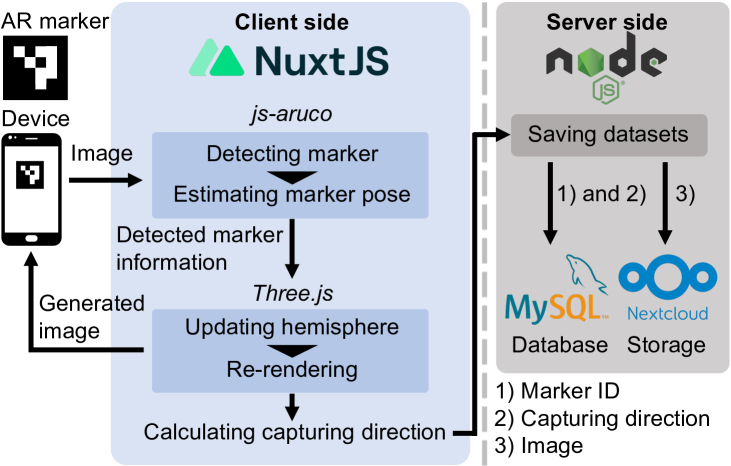
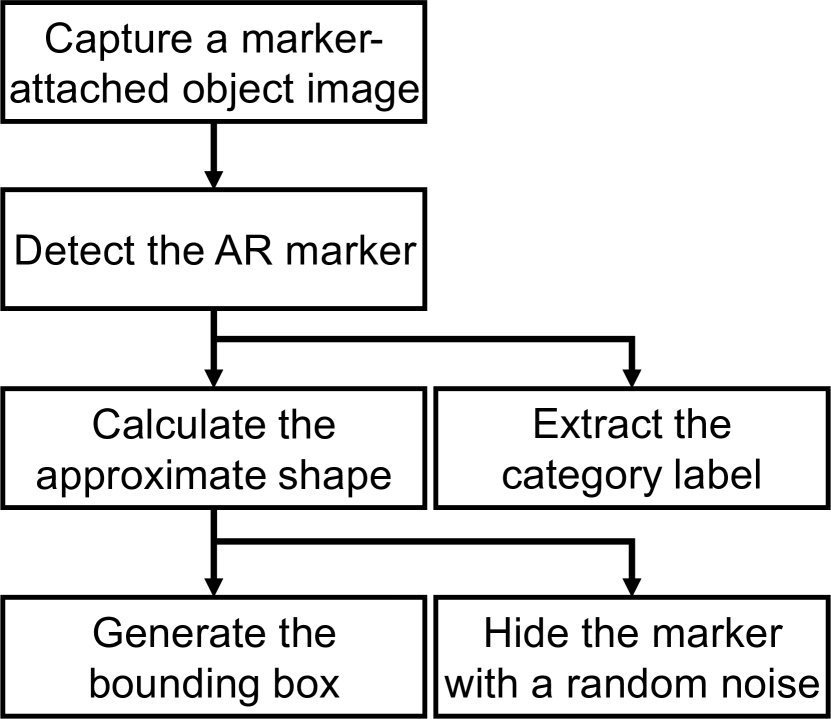
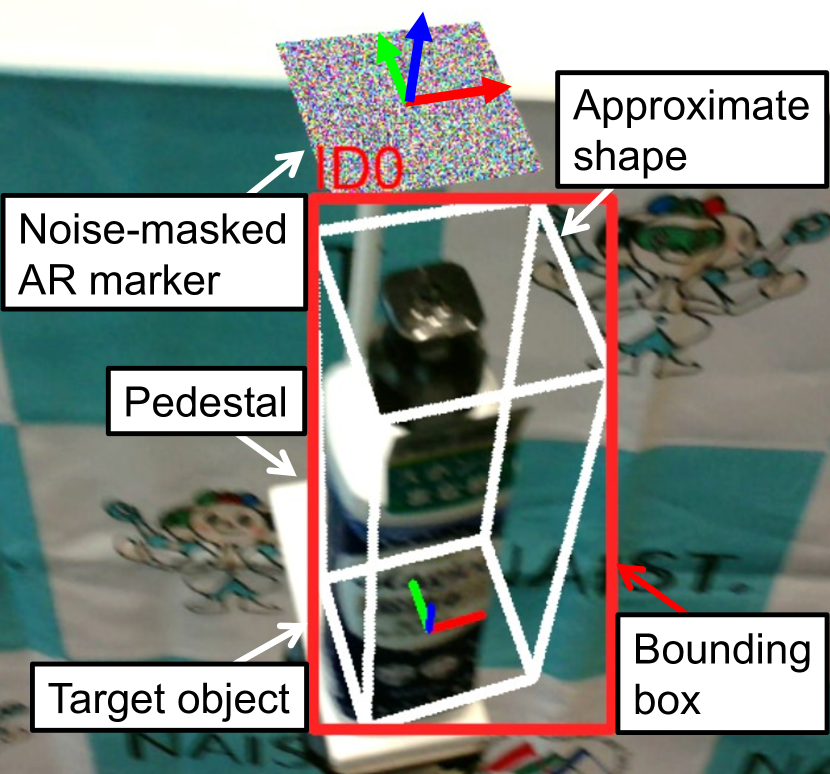
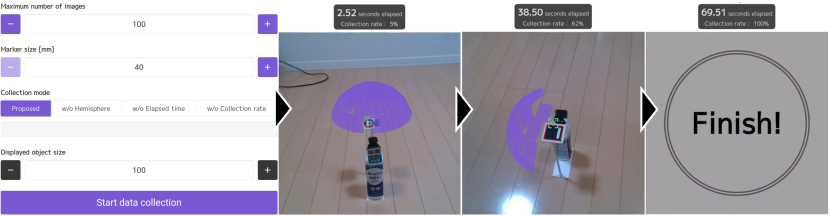
Fig. 2 shows the system configuration of the mobile application. We implemented a web application consisting of a client-side component for collecting and annotating images and visualizing the collection status and a server-side component for storing the resulting datasets. In general, web applications are device-independent, including mobile devices such as Windows tablets and Android smartphones. These mobile devices often come with an additional camera, and the web application installed on the device allows for easy capture of multi-view images from free viewpoints by moving the device’s camera. The computational resources of the mobile device are used to perform computations for image acquisition, marker detection, marker pose estimation, and various drawings on the display.
To automate the bounding box annotation for object images, we employed an AR marker-based annotation method [5]. Fig. 3(a) shows the process flow. Before starting the application, the user places the marker-attached jig by fixing the target object at the location where it can be captured by the camera from around the object. The user prepares the camera and performs camera calibration. Because a known relative pose between the object and marker on the jig, and marker identification numbers (IDs) associated with the object category are assumed, an automatic annotation process can be performed during the execution of the web application.
We use Nuxt.js111https://nuxtjs.org/ with several JavaScript libraries to fulfill various functions, including augmented reality (AR) library, js-aruco222https://github.com/jcmellado/js-aruco, and 3D library, Three.js333https://threejs.org/. The js-aruco detects AR markers in captured images and estimates the poses of the markers. The three.js is a user-friendly library that can render 3D content on a web page, which in turn provides support for updating the appearance of the hemisphere in captured images by updating the pose, removing the rectangle on the hemisphere just captured, and applying rendering again. Finally, the rendered image was shown on the display of the mobile device. During one loop on the client side, the server saves the image dataset on cloud storage structured by the MySQL444https://www.mysql.com/ database and NextCloud555https://nextcloud.com/ online storage services.
Fig. 4 shows an example of display transitions. On the initial display, users set four parameters: the target number of images, the size of the visual marker attached to the object, the collection mode to be executed, and the size of the hemispherical object to be displayed. Once these parameters have been set, users can begin the collection process. As soon as the selected mode starts, the user can view the captured image by displaying various types of status indicators, including the collection progress as a hemisphere, collection rate, and elapsed time. Once the user-specified number of images has been collected, image capture automatically ends.
III-B Gamification by Visualizing Collection Status
Fig. 4 shows an example of display transitions. The display at the starting point shows the descriptions of the selected mode and the parameters required to activate the mode. When clicking the button labeled as start data collection shown at the bottom of the leftmost picture of Fig. 4, count down until image capture begins. After counting from five seconds to zero, the image capture and marker detection began simultaneously. During image capture, mode-specific visualizations, which include the ET, CR, and Hm showing the collection progress, appear on the display. When the collection rate reached 100%, image capture and marker detection ended, and the message Finish! are displayed on the display. After finishing image capture, users can observe the collection time ranking in the top window of the web application.
The following sections provide more details on the three application feastures of displaying the elapsed time, showing the collection rate, and representing the uncollected areas as a hemisphere.
III-B1 Drawing a Collection Progress as Hemisphere
To implicitly show collection progress to the user during the collection trial, the application window shows a hemisphere, that has missing parts, indicating uncaptured areas. The hemisphere is divided into a certain number of rectangular shapes (the number can be set in the form of the displayed object size shown in the leftmost image of Fig. 4), and the divided rectangular objects are displayed first. To arrange the rectangles such that they do not overlap with each other, the placement of the rectangular objects forms a spiral on the hemisphere surface, as shown in Fig. 1(b). The rectangles on the hemisphere were placed as described in [30].
Using setFromSphericalCoords in Vector3 class666https://threejs.org/docs/#api/en/math/Vector3 of the three.js, we can easily calculate an object position in the Cartesian coordinate system as follows.
| (1) |
where denotes the hemispherical radius. To set planar normals of the rectangular objects to be parallel to , we use a function lookAt of Object3D class777https://threejs.org/docs/#api/en/core/Object3D of the three.js.
Once one of the rectangular objects exists in the center of the captured image, the corresponding displayed rectangle disappears indicating the capturing is finished. The hemisphere hides as little of the object’s appearance as possible. A semi-transparent hemispherical object is superimposed on the image displayed in rendering. These semi-transparent objects allow the user to easily observe the actual target object’s pose. Users can monitor the progress of the collection not only through the collection rate but also by observing the updating hemisphere, which provides information about the remaining uncaptured areas and helps the user move the camera effectively. With this feature, the camera viewpoints (i.e., the object pose observed from the camera) do not overlap with existing datasets.
III-B2 Displaying Elapsed Time for Time Pressure
The elapsed time displayed during mode execution encourages users to collect the dataset more quickly under time pressure. Furthermore, the proposed web application aggregated and displayed a ranking of the final elapsed times. Shorter collection times are considered higher in the rankings. In the ranking table, we can observe the rank of the previous trial in all trials, mode name, performance (capture time [s] / number of images), capture time [s], and a number of images.
III-B3 Displaying Collection Rate
Fig. 1(b) shows the appearance of the displayed collection rate during the execution. The calculated collection rate is shown at the top of the display above the image capture window. Because displaying the collection rate gives users feedback on the collection rate, the application can facilitate efficient multi-view image dataset collection. Displaying this further leads to a feeling of collection, similar to a game. Users can enjoy collecting images while considering methods to increase their collection rate. Such game-like functions, in the end, encourage users to collect multi-view image datasets.
The collection rate was calculated based on six-dimensional (6D) object pose (with respect to the camera viewpoint) data included in the previously collected datasets. In reality, once the rectangle shown on the hemisphere surface is located at the center of the image captured by the camera, the target rectangle disappears and the obtained image dataset is saved. Therefore, the collection rate increases by 1%. This method can reduce the duplication of datasets from the camera viewpoint. By enabling users to avoid this dataset duplication on their own, this feature creates comfort and playability. Certain thresholds were empirically set such that they could be collected over a wide range.
The drawing of the hemisphere shows this progress in more detail and intuitively. In contrast to the hemisphere drawing, this collection rate can be a quantitative measure of how much has now been collected against the final target value (100%).
IV Experiments
IV-A Experimental Protocol
Our user experiments evaluate the mental workload, usability, enjoyment, engagement, and efficiency of the dataset collection trials using the proposed application. The proposed application is equipped with three functions (i.e., ET, CR, and Hm), which was implemented in a single application mode. We developed three comparative application modes, each lacking one of the three functions: a mode without Hm, a mode without CR, and a mode without ET. The typical procedure for all implemented modes to collect datasets for a target object is as follows:
-
1.
Attach a visual marker at a location near the target object where the object is easily detectable
-
2.
Launch the web application on a small handheld laptop (Microsoft, Surface PRO)
-
3.
Choose one mode of the four modes (We randomly generated the order for each participant beforehand)
-
4.
Start the mode that captures multi-view images while checking the visualizations on the display
-
5.
After that the mode ends (if the collection rate reached 100%), and the participant checks the ranking together with other collection results
-
6.
The participant takes questionnaires including NASA-TLX, SUS, and custom questionnaires
-
7.
The series of processes from 3) to 6) repeats until the participant finished three trials of four modes
We surveyed seven male adults from the Nara Institute of Science and Technology, Japan. Once 100 images are collected after starting the mode, the collection rate reaches 100%, and the executed mode ends. The thresholds required to calculate the collection rate were empirically set so that they could be collected over a wide range.
IV-B Evaluation Metrics
First, we analyzed the results of the questionnaires to evaluate mental workload and usability from a subjective perspective. Referring to [31], we asked the participants several questions regarding their usage during the trials to compare the effects of each feature implemented in each mode. To evaluate mental workload and usability, seven participants took the NASA-TLX and SUS respectively. To clarify the contributions of the implemented functions to the enjoyment and engagement (motivation) of users, the participants answered the custom questionnaires listed in Table II. Second, we evaluated the efficiency of the proposed web application in terms of collection time together with the variability existing in the collected dataset. The following sections present the results. Section V discusses the results in several aspects of these results.
V Results
V-A Mental Workload
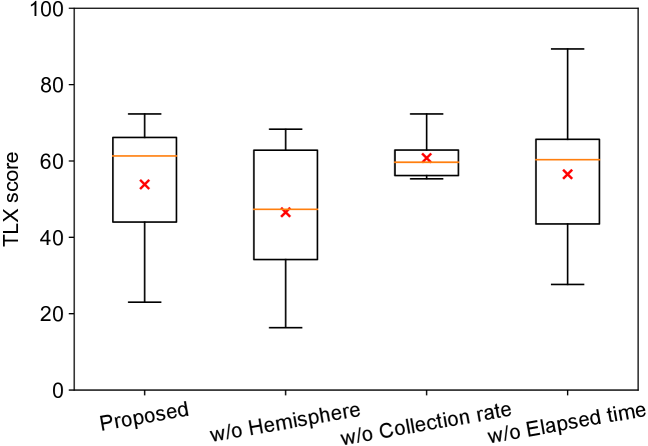
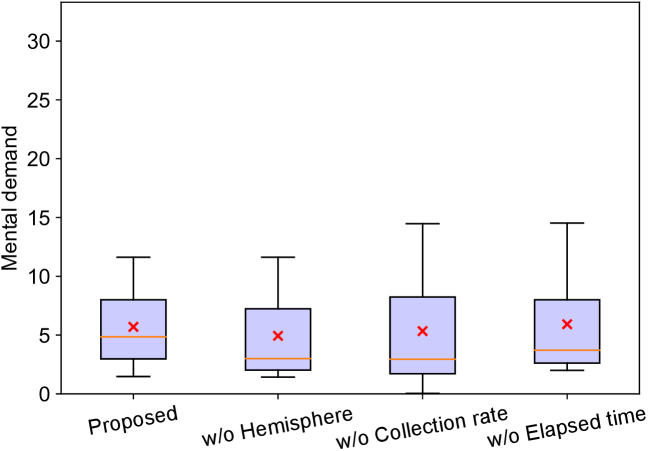
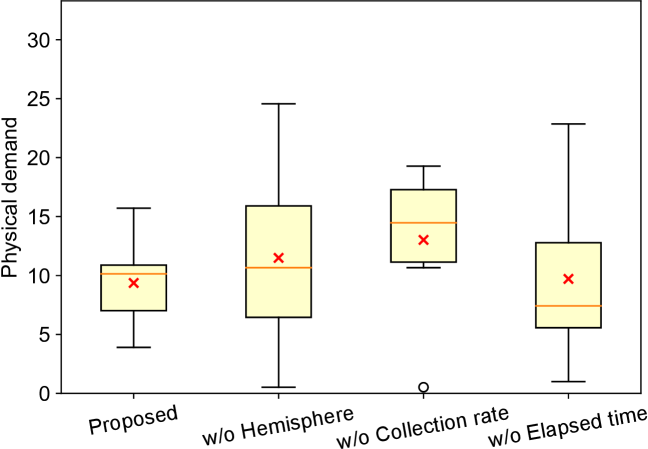
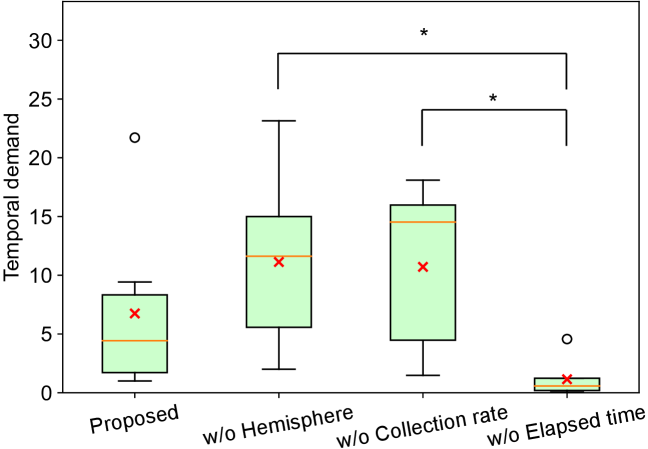
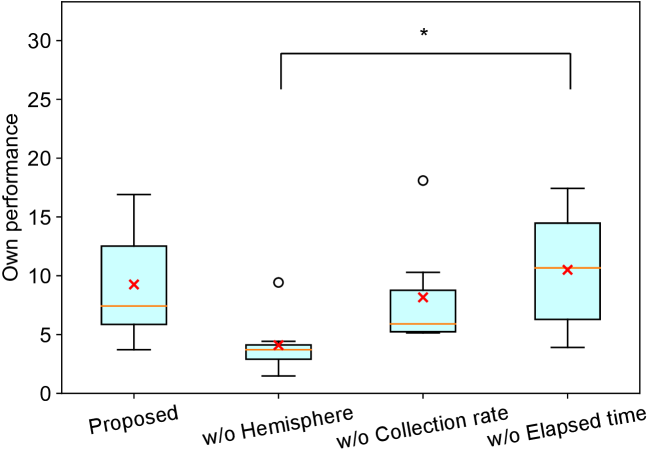
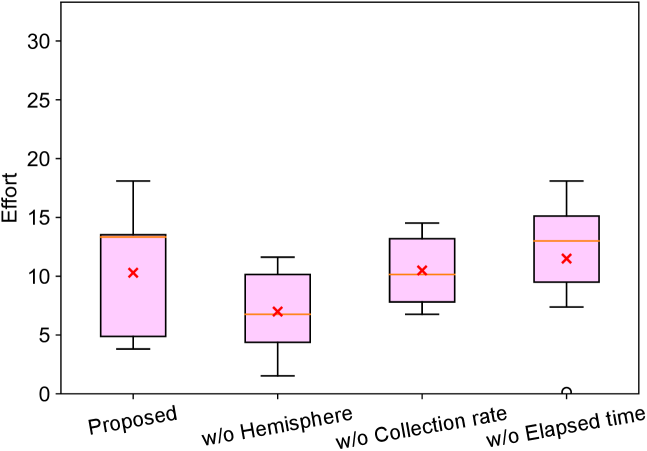
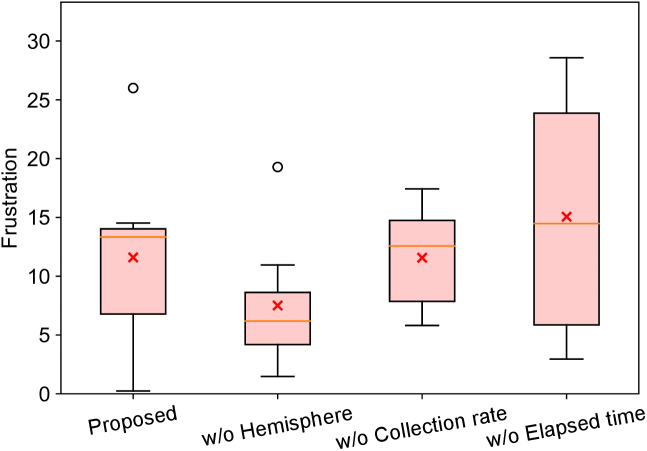
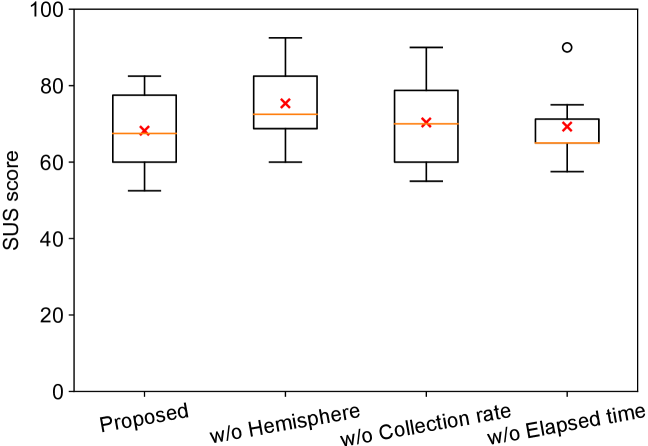
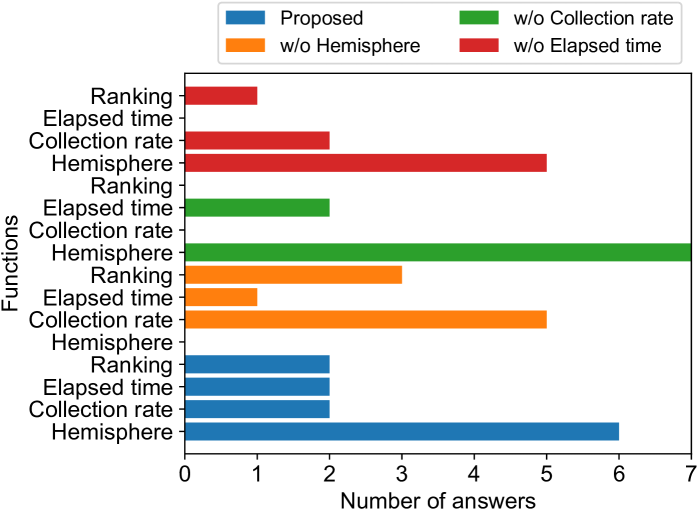
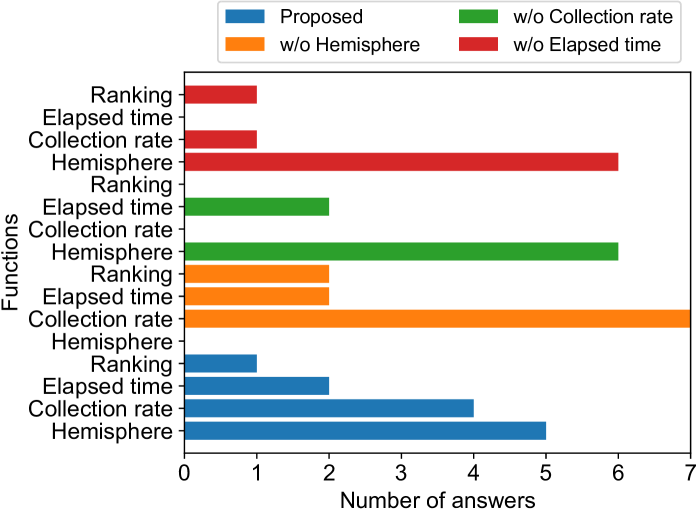
Fig. 5 shows the results of the NASA-TLX questionnaire. The TLX score expresses the users’ mental workload as a value ranging from 0 to 100, with a larger value indicating a higher workload. A lower value indicates better performance. Fig. 6 - Fig. 11 show scores of six different subscales of NASA-TLX, which include Mental demand, Physical demand, Temporal demand, Performance, Effort, and Frustration.
The red-colored “x” mark indicates the average value, and the upper and lower limits of the error bars indicate the maximum and minimum values, respectively. The top line of the box represents the 75th percentile, the horizontal line represents the median, and the bottom line represents the 25th percentile. Samples greater than the 75th percentile the interquartile range (IQR 75th percentile 25th percentile) or less than the 25th percentile IQR are regarded as outliers (white circles).
Moreover, multiple comparison tests were conducted to compare the questionnaire results. Table III shows the result of multiple comparisons on NASA-TLX subscales. To conduct multiple comparisons, the Dunn-Bonferroni test[32] is used in the statistical software SPSS888https://www.ibm.com/spss. The p-values shown in Table III are values corrected by Bonferroni correction with an upper limit of . The asterisked p-values indicate a significant difference between methods 1 and 2 at a significance level of , which is also shown in Fig. 6 - Fig. 11
We found several differences in the scores of subscales of NASA-TLX, particularly for temporal demand and performance. The method without Hm and the method without ET were rated higher scores of subscale temporal demand than the method without ET, as the p-values were and , suggesting that in the two methods, users felt that the temporal demand was high; thus, one of the factors related to the mental workload was relatively high in the method with elapsed time. The score for the method without ET was the lowest. Although no significant difference could be confirmed, as the p-value was between the proposed method and the other methods, it was confirmed that five participants felt a higher temporal demand than the methods without Hm and without CR. This result shows the possibility of suppressing the temporal demand by combining gamified functions such as the display of the hemisphere and the collection rate in the proposed method. Both functions served the purpose of displaying the progress of the collection operation. As Myers [33] demonstrated, progress indicators are generally preferred by users, as they provide novices with confidence that a task has been accepted and is progressing successfully, while expert users can obtain sufficient information to predict the approximate completion time of the task. It is possible that the user’s sense of relief, resulting from the progress indicators, also worked to reduce temporal demand during the mobile application-based data set collection.
The method without Hm showed a significantly lower score on the subscale performance than the method without ET, with a p-value of . The subscale performance shows the degree of users’ self-evaluation of their collection trials. A higher score indicates a poorer self-evaluation. Therefore, the results indicate that the self-evaluation of performance tended to be better without Hm, compared with the method without ET. This improvement in self-evaluation was likely due to the explicit visual feedback of the collection outcomes provided by the real-time erasure of the hemisphere.
V-B Usability
Fig. 12 shows the results of SUS questionnaire. The SUS score expresses the usability evaluation by users as a value from 0 to 100, with a larger value indicating higher usability. The format of the graph shown in Fig. 12 is the same as other figures (Fig. 5 - Fig. 11). Table III also shows the results of multiple comparisons on SUS scores and NASA-TLX subscales. There were no significant differences in the scores of the NASA-TLX and SUS.
V-C Enjoyment and Engagement
Fig. 13 and Fig. 14 illustrate the results of the custom-made questionnaires about enjoyment and engagement (motivation). Fig. 13 shows the count of responses to custom questions “Did you enjoy it like a game?” and “Which features did you find enjoyable?”. Fig. 14 shows the count of responses to custom questions “Did you try hard to collect the dataset?” and “Which features motivated you?”. Functions that were enjoyable and engaged (easily motivated) and displayed the updating hemisphere were the most selected. In the two types of questions, the notification of collection rates to users was the second most selected among the four methods. The other custom-made questions listed in Table II were unremarkable, but the ranking and elapsed time also made the users fun and engaged (motivated).
As expected, these results suggest that the display of the updating hemisphere and collection rate might be effective in the gamification of the dataset collection in terms of enjoyment and engagement (motivation).
[tb] Question Type Option Gender Multiple-choice Male or Female Age Open-ended Positive integer Have you ever experienced any AR technologies? Closed No or Yes How much do you know about training dataset collection? Multiple-choice Nothing, Know a little, Know well, or Your major Did you enjoy it like a game? Which functions did you find enjoyable? Multiple-choice Not enjoy it, Hemisphere, Collection rate, Elapsed time, or Ranking Did you try hard to collect the dataset? Which functions motivated you? Multiple-choice Don’t think so, Hemisphere, Collection rate, Elapsed time, or Ranking Would you like to use this app as a volunteer for environmental preservation activities? Closed No or Yes Do you think there are any other use cases? Open-ended Please feel free to write the experience of using this mode Open-ended
[tb] p-value Method 1 Method 2 NASA-TLX MD∗a PD∗b TD∗c OP∗d EF∗e FR∗f SUS Proposed w/o Collection rate 1.0 1.0 0.72 1.0 1.0 1.0 1.0 1.0 Proposed w/o Elapsed time 1.0 1.0 1.0 0.14 1.0 1.0 1.0 1.0 Proposed w/o Hemisphere 1.0 1.0 1.0 1.0 0.14 1.0 1.0 0.38 w/o Collection rate w/o Elapsed time 1.0 1.0 0.47 1.0 1.0 1.0 1.0 w/o Collection rate w/o Hemisphere 1.0 1.0 1.0 1.0 0.30 0.10 1.0 1.0 w/o Elapsed time w/o Hemisphere 1.0 1.0 1.0 0.47 0.38 0.72
-
*a
is the abbreviation of “Mental demand”, which is one of NASA TLX subscales.
-
*b
is the abbreviation of “Physical demand”, which is one of NASA TLX subscales.
-
*c
is the abbreviation of “Temporal demand”, which is one of NASA TLX subscales.
-
*d
is the abbreviation of “Performance”, which is one of NASA TLX subscales.
-
*e
is the abbreviation of “Effort”, which is one of NASA TLX subscales.
-
*f
is the abbreviation of “Frustration”, which is one of NASA TLX subscales.
-
*
The asterisked p-values indicate that there is a significant difference between the two methods at the significance level of .
V-D Efficiency
To validate the efficiency of the proposed method, the following sections compare the collection times together with the variability existing in the collected datasets.
V-D1 Collection Time
[tb] Collection time for each trial [s] Method 1st 2nd 3rd ID rate∗a Proposed 15947.4 17651.7 21371.9 0.4000.516 w/o Hemisphere 78.023.4 74.014.6 76.120.3 -0.01170.133 w/o Collection rate 14642.2 15549.8 19261.7 0.3990.606 w/o Elapsed time 17327.5 16739.9 264114 0.4870.406
-
*a
shows the increase-decrease rate calculated by dividing the collection time for the final trial by the collection time for the first trial.
Table IV shows mean and standard deviation values of the time taken to collect 100 images in each of three trials for all seven participants. In addition, we calculated the increase-decrease rate (ID rate) obtained by dividing the collection time for the final trial by the collection time for the first trial. Table IV further shows the mean and standard deviation values of the ID rate for all participants. This value is related to the degree of familiarity of users with the collection operation and the cumulative workload as the number of trials increases. A negative value indicates a presence of familiarity, whereas a positive value indicates a presence of fatigue.
In the case of the proposed mode, it took less than 10 min for data collection in the three trials, indicating that only 10 min was necessary to collect 300 images (100 images 3 trials). Compared with other methods, the mean value of the collection time by the proposed method was longer than that of the method without Hm, shorter than that by the method without ET, and almost the same as that of the method without CR. In the case of the method of drawing the hemisphere, because users tend to carefully check whether the target rectangle disappears during mode execution, the time was relatively long compared to that obtained by the method without Hm. In the method without Hm, the collection rate was improved based on an empirically determined threshold for the pose of the camera view; thus, the collection rate tended to increase more easily. Meanwhile, the time and ID rates for the three methods other than those without Hm were almost the same. The maximum difference in each trial was 37.5% (72 s) for the shortest time. In the case without ET, the time was longer in the 1st and 3rd trials compared to the corresponding times of the proposed method, and the ID rate was slightly higher. The ID rate results showed the same tendency as the collection time results.
V-D2 Variability
[tb] Distance for each trial [m] Method 1st 2nd 3rd Proposed 0.6780.133 0.6910.132 0.7290.134 w/o Hemisphere 0.7620.0759 0.7330.0729 0.7380.0866 Volume [] Method 1st 2nd 3rd Proposed 0.631 0.611 0.542 w/o Hemisphere 0.595 0.534 0.747 Angular distance for each trial [∘] Method 1st 2nd 3rd Proposed 15816.5 15517.6 15520.4 w/o Hemisphere 15216.8 15619.7 15714.7
To reduce uncaptured areas around the target object, collecting multi-view image datasets is important. To validate the effect of Hm on data-collection variability, we compared datasets generated by the proposed method with those generated by the method without Hm. Note that, in the method without Hm, the collection rate increased based on an empirically determined threshold for the pose of the camera view.
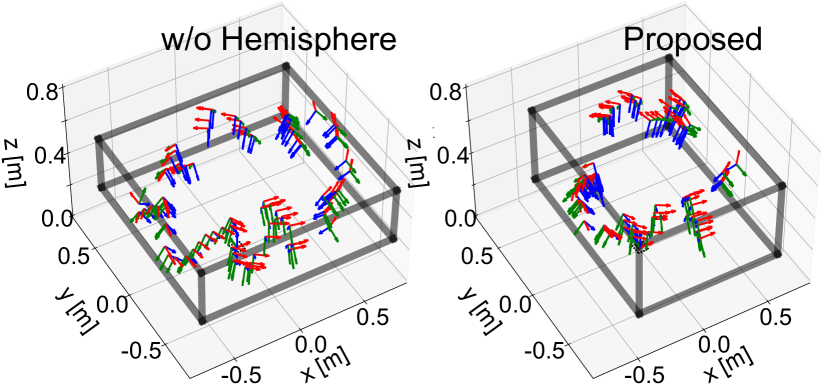
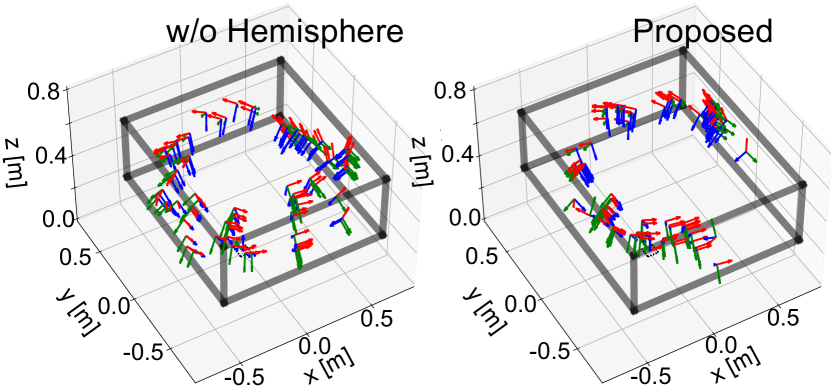
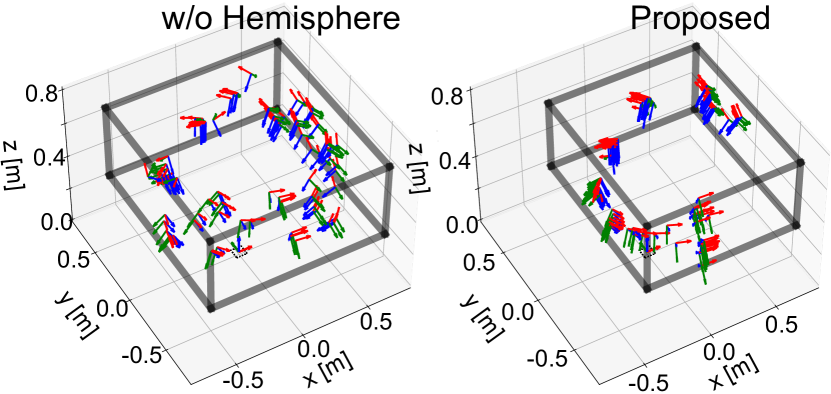
Fig. 15 shows scatter plots of the camera’s 6D poses used to capture the 100 images collected with the proposed method and the method without Hm. The figure also illustrates a bounding box representing the smallest rectangular parallelepiped containing all camera viewpoint positions (plotted points). The wide distribution of the plotted points in the figure indicates that the variability of the dataset was large.
Therefore, it appears that the variability in the dataset collected without Hm was also large. Nevertheless, if we observe the calculated distance [m], the proposed method showed larger differences in the distance for all trials compared with the method without Hm. The two calculated volumes [] of the bounding boxes containing each camera viewpoint position shown in Table V are similar because the mean distance in the method without Hm is larger. In the proposed method, the coordinate systems showing the viewpoints appear to be relatively densely gathered. These results are likely because the user carefully moved the camera incrementally to capture all the visualized rectangles. Conversely, when the hemisphere is hidden, the camera was moved randomly. The angular distance was calculated as . and represent the calculated quaternion, indicating the camera posture, and the unit quaternion, indicating the marker posture, respectively. The calculated angular distance was comparable between the proposed method and the method without Hm.
Therefore, the effect of hemisphere visualization allowed users to collect varied multi-view image datasets based on the distance between the camera positions and object positions. However, regardless of whether Hm is visible or not, the variability does not change significantly because all surfaces disappear in both cases at the end of the collection process.
VI Discussion
VI-A Relationship among Enjoyment, Engagement, Motivation, Efficiency, and Variability in Dataset Collection
As indicated by the results described in Section IV-B, the proposed method and the method without ET showed low scores (better outcome) for temporal demand. In addition, the method without Hm had the lowest self-rating of performance by the user, indicating that displaying a hemisphere tends to rate the quality of the trials higher. Furthermore, as shown in Fig. 13 and Fig. 14, displaying the hemisphere might have an effect of giving enjoyment and engagement (motivation) in their dataset collection trials.
In terms of efficiency, as explained in Section IV-C, the method without Hm had the shortest collection time; however, its self-rating of performance was low, indicating that it might tend to estimate its performance as higher if it took the appropriate amount of time to collect the datasets. Moreover, even for the dataset variability mentioned in Section IV-C, it is preferable to show the hemispheres.
Considering these results as a whole, displaying the collection status such as hemisphere-shaped collection progress and collection rate might result in a time-consuming collection trial. Nevertheless, combining the visualizing hemisphere, collection time, and collection rate, as in the proposed method, makes the user feel enjoyment and engagement and allows them to concentrate more on their trials rather than feeling excessive time pressure; thus, the users evaluated the quality of their trials as more high-quality. Because variability was better in the case of the method with the hemisphere, the quality of their trials was higher, and they might have performed the collection trials with an awareness of the progress as positive feedback on the collection status.
In summary, although the collection time could not be reduced considerably compared with other methods, our proposed application can motivate users in an enjoyable manner, and users can collect high-quality datasets in terms of accuracy and variability with a moderate workload such as time pressure to boost the collection. Fig. 16 shows the discovered relationship among the application features that compensate for the disadvantages of each other.
VI-B Toward More Highly Varied Multi-view Dataset Collection
There is room for improvement in terms of the variability of the datasets collected. In the experiments, since the number of images to be collected (can be set in Maximum number of images shown in Fig. 4) was set to 100, the user captured the target object in different directions to change the camera view as much as possible instead of changing capturing distances. No specific instructions were given to users. In the future, if it is desired to collect datasets that vary more, although we can set a larger number appropriately, the collection time will be longer, and the workload will increase accordingly. To address this issue, it might be effective to implement another modality function, such as a voice announcement function to report the elapsed time and a sound effect function to report the collection progress. In future studies, including the collection of a larger number of datasets, we will clarify whether such multi-modal gamification techniques can further improve enjoyment and engagement.
VII Conclusions
This study presented a gamified web application-based dataset collection system to avoid the laborious and monotonous process of annotation. We proposed to display several dataset collection statuses on the display of the application, including the uncaptured area as a hemisphere, collection rate, and elapsed time, to collect multi-view image datasets with less mental workload and time pressure in an enjoyable manner to boost engagement.
In summary, as illustrated in Fig. 16, although displaying the hemisphere and collection rate tends to lengthen the collection time, it reduces the mental workload and makes the user enjoy it. By displaying the elapsed time, the collection time can be shortened by realizing dataset collection under time pressure. However, we found that the increase in the mental workload due to collection time could be reduced by providing users with enjoyable and motivated operations with a display of the hemisphere and the collection rate. Furthermore, we discovered that the hemisphere display increased the variability of the dataset and provided a sense of satisfaction by estimating their performance as higher.
Our future studies will promote the development of a simple yet effective multi-modal gamified application capable of efficiently collecting highly varied multi-view image datasets for several types of target objects.
Acknowledgements
This work was supported in part by project JPNP20012 subsidized by the New Energy and Industrial Technology Development Organization (NEDO).
References
- [1] M. Fujita, Y. Domae, A. Noda, G. A. G. Ricardez, T. Nagatani, A. Zeng, S. Song, A. Rodriguez, A. Causo, I. M. Chen, and T. Ogasawara, “What are the important technologies for bin picking? technology analysis of robots in competitions based on a set of performance metrics,” Adv. Robot., vol. 34, no. 7–8, pp. 560–574, 2020.
- [2] T. Kiyokawa, J. Takamatsu, and S. Koyanaka, “Challenges for future robotic sorters of mixed industrial waste: A survey,” IEEE Trans. Autom. Sci. Eng., 2022.
- [3] H. Zhang, L. Z. Liu, H. Xie, Y. Jiang, J. Zhou, and Y. Wang, “Deep learning-based robot vision: High-end tools for smart manufacturing,” IEEE Instrum. Meas. Mag., vol. 25, no. 2, pp. 27–35, 2022.
- [4] M. Naphade, S. Wang, D. C. Anastasiu, Z. Tang, M. Chang, Y. Yao, L. Zheng, M. S. Rahman, A. Venkatachalapathy, A. Sharma, Q. Feng, V. Ablavsky, S. Sclaroff, P. Chakraborty, A. Li, S. Li, and R. Chellappa, “The 6th AI city challenge,” in IEEE/CVF Conf. Comput. Vis. Pattern Recognit. (CVPR) Workshops, 2022, pp. 3346–3355.
- [5] T. Kiyokawa, K. Tomochika, J. Takamatsu, and T. Ogasawara, “Fully automated annotation with noise-masked visual markers for deep-learning-based object detection,” IEEE RA-L, vol. 4, no. 2, pp. 1972–1977, 2019.
- [6] M. Suchi, T. Patten, D. Fischinger, and M. Vincze, “EasyLabel: A semi-automatic pixel-wise object annotation tool for creating robotic RGB-D datasets,” in IEEE Int. Conf. Robot. Autom. (ICRA), 2019, pp. 6678–6684.
- [7] T. Kiyokawa, K. Tomochika, J. Takamatsu, and T. Ogasawara, “Efficient collection and automatic annotation of real-world object images by taking advantage of post-diminished multiple visual markers,” Adv. Robot., vol. 33, no. 24, pp. 1264–1280, 2019.
- [8] D. De Gregorio, A. Tonioni, G. Palli, and L. Di Stefano, “Semiautomatic labeling for deep learning in robotics,” IEEE Trans. Autom. Sci. Eng., vol. 17, no. 2, pp. 611–620, 2020.
- [9] C. Agnew, C. Eising, P. Denny, A. Scanlan, P. Van De Ven, and E. M. Grua, “Quantifying the effects of ground truth annotation quality on object detection and instance segmentation performance,” IEEE Access, vol. 11, pp. 25 174–25 188, 2023.
- [10] J. Murrugarra-Llerena, L. N. Kirsten, and C. R. Jung, “Can we trust bounding box annotations for object detection?” in IEEE/CVF Conf. Comput. Vis. Pattern Recognit. (CVPR) Workshops, 2022, pp. 4813–4822.
- [11] J. Ma, Y. Ushiku, and M. Sagara, “The effect of improving annotation quality on object detection datasets: A preliminary study,” in IEEE/CVF Conf. Comput. Vis. Pattern Recognit. (CVPR) Workshops, 2022, pp. 4850–4859.
- [12] H. Su, J. Deng, and L. Fei-Fei, “Crowdsourcing annotations for visual object detection,” in AAAI Hum. Comput. Workshop, 2012.
- [13] B. Russell, A. Torralba, K. Murphy, and W. Freeman, “LabelMe: A database and web-based tool for image annotation,” Int. J. Comput. Vis. (IJCV), vol. 77, pp. 157–173, 2008.
- [14] R. Benenson, S. Popov, and V. Ferrari, “Large-scale interactive object segmentation with human annotators,” in IEEE/CVF Conf. Comput. Vis. Pattern Recognit. (CVPR), 2019, pp. 11 700–11 709.
- [15] C. Vondrick, D. Patterson, and D. Ramanan, “Efficiently scaling up crowdsourced video annotation,” Int. J. Comput. Vision, vol. 101, no. 1, pp. 184–204, 2013.
- [16] A. Dutta and A. Zisserman, “The via annotation software for images, audio and video,” in ACM Int. Conf. Multimedia, 2019, pp. 2276–2279.
- [17] T. Kiyokawa, H. Katayama, Y. Tatsuta, J. Takamatsu, and T. Ogasawara, “Robotic waste sorter with agile manipulation and quickly trainable detector,” IEEE Access, vol. 9, pp. 124 616–124 631, 2021.
- [18] S. G. Hart and L. E. Staveland, “Development of NASA-TLX (Task Load Index): Results of empirical and theoretical research,” Advances in psychology, vol. 52, pp. 139–183, 1988.
- [19] J. Brooke, “SUS: a “quick and dirty’usability,” Usability evaluation in industry, p. 189, 1996.
- [20] L. von Ahn and L. Dabbish, “Labeling images with a computer game,” in SIGCHI Conf. Hum. Factor. Comput. Syst., 2004, pp. 319–326.
- [21] J. Deng, J. Krause, and L. Fei-Fei, “Fine-grained crowdsourcing for fine-grained recognition,” in IEEE Conf. Comput. Vis. Pattern Recognit. (CVPR), 2013, pp. 580–587.
- [22] I. Kavasidis, C. Spampinato, and D. Giordano, “Generation of ground truth for object detection while playing an online game: Productive gaming or recreational working?” in IEEE Conf. Comput. Vis. Pattern Recognit. (CVPR) Workshops, 2013.
- [23] A. Carlier, O. Marques, and V. Charvillat, “Ask’nSeek: A new game for object detection and labeling,” in Euro. Conf. Comput. Vis. (ECCV) Workshop, 2012.
- [24] G. Hu, W. P. Tay, and Y. Wen, “Cloud robotics: architecture, challenges and applications,” IEEE Network, vol. 26, no. 3, pp. 21–28, 2012.
- [25] B. Kehoe, S. Patil, P. Abbeel, and K. Goldberg, “A survey of research on cloud robotics and automation,” IEEE Trans. Autom. Sci. Eng., vol. 12, no. 2, pp. 398–409, 2015.
- [26] W. Chen, Y. Yaguchi, K. Naruse, Y. Watanobe, K. Nakamura, and J. Ogawa, “A study of robotic cooperation in cloud robotics: Architecture and challenges,” IEEE Access, vol. 6, pp. 36 662–36 682, 2018.
- [27] P. Li, B. DeRose, J. Mahler, J. A. Ojea, A. K. Tanwani, and K. Goldberg, “Dex-Net as a Service (DNaaS): A cloud-based robust robot grasp planning system,” in IEEE Int. Conf. Autom. Sci. Eng. (CASE), 2018, pp. 1420–1427.
- [28] U. Klank, M. Z. Zia, and M. Beetz, “3D model selection from an internet database for robotic vision,” in IEEE Int. Conf. Robot. Autom. (ICRA), 2009, pp. 2406–2411.
- [29] H. Bistry and J. Zhang, “A cloud computing approach to complex robot vision tasks using smart camera systems,” in IEEE/RSJ Int. Conf. Intell. Robot. Sys. (IROS), 2010, pp. 3195–3200.
- [30] E. B. Saff and A. B. J. Kuijlaars, “Distributing many points on a sphere,” The Mathematical Intelligencer, vol. 19, pp. 5–11, 1997.
- [31] N. Shirakura, T. Kiyokawa, H. Kumamoto, J. Takamatsu, and T. Ogasawara, “Collection of marine debris by jointly using UAV-UUV with GUI for simple operation,” IEEE Access, vol. 9, pp. 67 432–67 443, 2021.
- [32] O. J. Dunn, “Multiple comparisons using rank sums,” Technometrics, vol. 6, pp. 241–252, 1964.
- [33] B. A. Myers, “The importance of percent-done progress indicators for computer-human interfaces,” in SIGCHI Conf. Hum. Factor. Comput. Syst., 1985, pp. 11–17.