The Physical Drivers and Observational Tracers of CO-to- Conversion Factor Variations in Nearby Barred Galaxy Centers
Abstract
The CO-to-H2 conversion factor () is central to measuring the amount and properties of molecular gas. It is known to vary with environmental conditions, and previous studies have revealed lower in the centers of some barred galaxies on kpc scales. To unveil the physical drivers of such variations, we obtained ALMA Band 3, 6, and 7 observations toward the inner 2 kpc of NGC 3627 and NGC 4321 tracing 12CO, 13CO, and C18O lines on 100 pc scales. Our multi-line modeling and Bayesian likelihood analysis of these datasets reveal variations of molecular gas density, temperature, optical depth, and velocity dispersion, which are among the key drivers of . The central 300 pc nuclei in both galaxies show strong enhancement of temperature K and density . Assuming a CO-to-H2 abundance of , we derive 4–15 times lower than the Galactic value across our maps, which agrees well with previous kpc-scale measurements. Combining the results with our previous work on NGC 3351, we find a strong correlation of with low- 12CO optical depths (), as well as an anti-correlation with . The correlation explains most of the variation in the three galaxy centers, whereas changes in influence to second order. Overall, the observed line width and 12CO/13CO 2–1 line ratio correlate with variation in these centers, and thus they are useful observational indicators for variation. We also test current simulation-based prescriptions and find a systematic overprediction, which likely originates from the mismatch of gas conditions between our data and the simulations.
1 Introduction
The cold and dense molecular gas in the interstellar medium (ISM) is the direct fuel for current and future star formation. Measuring the amount and properties of molecular gas is crucial for understanding star formation, the ISM, and their relations with galaxy evolution. While molecular hydrogen (H2) is the primary constituent of molecular gas, it is difficult to be directly observed in the cold ( K) phase where stars are formed (Tielens, 2010; Draine, 2011). Instead, molecular gas mass is often measured with the low- rotational lines of carbon monoxide (12C16O, hereafter CO) by applying a CO-to-H2 conversion factor (Solomon et al., 1987; Bolatto et al., 2013). This conversion factor () is often defined for the =1–0 line as the ratio of total molecular gas mass ( in ) to the CO =1–0 luminosity ( in K km s-1 pc2), or equivalently, the ratio of molecular gas surface density ( in pc-2) to the CO 1–0 intensity ( in K km s-1):
| (1) |
Another common way to express the conversion factor is to quote the ratio between H2 column density and CO intensity, , which is related to via , where the factor includes the mass contribution from Helium to .
can be measured by estimating using virial methods, -ray emission, or optically-thin tracers like dust or CO isotopologues (e.g., Bolatto et al., 2008; Leroy et al., 2011; Ackermann et al., 2012a, b; Sandstrom et al., 2013; Remy et al., 2017; Israel, 2020; Teng et al., 2022). Previous measurements toward molecular clouds in the disks of the Milky Way or other nearby spiral galaxies have reported relatively consistent values around 4.4 (or in ) within a factor of 2 (see the review by Bolatto et al., 2013, and references therein). This also includes studies across various Galactic disk GMCs using CO and 13CO observations together with radiative transfer modeling (Goldsmith et al., 2008; Liu et al., 2013; Nishimura et al., 2015), which is similar to the methodology we use in this paper. Therefore, many studies assume a constant, Galactic-like value when inferring molecular gas mass from CO observations. However, recent theoretical studies have shown that can vary by up to one or two orders of magnitude in different environments, and it is known to depend on gas properties including metallicity, temperature, column and volume densities, velocity dispersion, as well as the nature of excitation (e.g., Wolfire et al., 2010; Feldmann et al., 2012a; Glover & Clark, 2012; Narayanan et al., 2012; Kazandjian et al., 2012, 2015; Bolatto et al., 2013; Renaud et al., 2019; Gong et al., 2020). Such environmental dependence can explain why has been found in observations to deviate from the Galactic disk value in various galaxy centers (Israel, 2009a, b, 2020; Sandstrom et al., 2013; Teng et al., 2022), (ultra-)luminous infrared galaxies (U/LIRGs; Downes & Solomon, 1998; Kamenetzky et al., 2014, 2017; Sliwa et al., 2014, 2017; Herrero-Illana et al., 2019), or low-metallicity galaxies (Israel, 1997, 2000; Papadopoulos et al., 2018; Madden et al., 2020).
The variation of within and among galaxies has a direct impact on many important quantities and relations that are widely used in current studies, because of their dependence on molecular gas mass estimation. This includes the molecular gas depletion time (which depends on and star formation rate), the cloud free-fall time (which depends on and cloud size), the virial parameter and turbulent pressure (both of which depend on , cloud size, and velocity dispersion), and the gas inflow rates in barred galaxy centers, to name only a few. For instance, Leroy et al. (2013) and den Brok et al. (2023) showed that the molecular cloud depletion time in galaxy centers will become significantly shorter if depression is considered. Sun et al. (2020a, 2022) demonstrated how cloud virial parameter, turbulent pressure, and ISM dynamical equilibrium pressure would vary with different choices of . is also the dominant source of uncertainty in estimating the bar-driven mass inflow rates in the Central Molecular Zone (Sormani & Barnes, 2019). Furthermore, variation can change the slopes of star formation scaling relations (e.g., Feldmann et al., 2012b; Narayanan et al., 2012; Pessa et al., 2021; den Brok et al., 2023; Sun et al., 2023), such as the Kennicutt–Schmidt (Kennicutt, 1998; Schruba et al., 2011) and molecular gas main sequence relations (Lin et al., 2019). Therefore, it is critical to understand the physical drivers of and establish how behaves in different environmental regimes.
Recent years have seen progress on the development of a metallicity-dependent prescription (Schruba et al., 2012; Amorín et al., 2016; Accurso et al., 2017b), which has been applied in several recent works (e.g., Sun et al., 2020a, b; Pessa et al., 2021). In terms of the emissivity dependence, many studies adopt a bimodal with 0.8 in (U)LIRGs or starburst regions (Downes & Solomon, 1998) and the Galactic-like 4.4 elsewhere. However, recent theoretical studies and simulations suggest that is not simply bimodal or metallicity dependent. Instead, it is likely to vary continuously with local environmental conditions in addition to metallicity (Narayanan et al., 2012; Bolatto et al., 2013). Theoretical and observational works have also shown that emissivity-related terms such as temperature, density, and opacity are important drivers of variation, especially in actively star-forming galaxies including mergers and galaxy centers (Narayanan et al., 2011, 2012; Papadopoulos et al., 2012; Cicone et al., 2018; Gong et al., 2020; Teng et al., 2022). Therefore, a crucial next step would be to identify observational tracers and establish a robust prescription that can predict the effects of emissivity-related terms on .
Compared to observational studies, simulations can give direct predictions from sophisticated modeling of gas dynamics, chemistry, and radiative transfer, allowing the development of prescriptions useful for observations. Thus, significant efforts have been made to investigate variations using numerical simulations (Shetty et al., 2011a, b; Narayanan et al., 2011, 2012; Feldmann et al., 2012a; Bournaud et al., 2015; Duarte-Cabral et al., 2015; Peñaloza et al., 2018; Gong et al., 2018, 2020; Renaud et al., 2019; Seifried et al., 2020; Bisbas et al., 2021; Hu et al., 2022). In particular, Narayanan et al. (2012) proposed a functional prediction of from metallicity and based on low-redshift mergers and high-redshift disks in their simulation. Some studies focusing on starburst mergers also found correlations between and star formation rate or molecular gas depletion time (Bournaud et al., 2015; Renaud et al., 2019). More recently, (magneto-)hydrodynamical simulations resolving down to pc scales further explored how may vary with observational beam size (Gong et al., 2020; Hu et al., 2022). Both studies have suggested dependence on , and Gong et al. (2020) also found correlations with the CO 2–1/1–0 line ratio () and CO line peak temperature. While these simulations are limited to Galactic disk-like environments with much lower CO intensity ( K km s-1) and surface density ( pc-2) than in galaxy centers, it is important to test the simulation-based predictions and understand if and where they can accurately predict .
In this work, we study the spatial variations of molecular gas properties and in nearby galaxy centers at 100 pc scales, using observations of multiple CO, 13CO, and C18O rotational transitions with the Atacama Large Millimeter/submillimeter Array (ALMA). We target nearby barred galaxies that were found by previous kpc-scale observations to have depression in their central few kpc, including NGC 3351, NGC 3627, and NGC 4321 (Sandstrom et al., 2013; Morokuma-Matsui et al., 2015; Israel, 2020; Jiao et al., 2021). These galaxies were also found to have a near-solar gas-phase metallicity (Kreckel et al., 2019, 2020; Santoro et al., 2022; Williams et al., 2022). Following our previous work on the central kpc of NGC 3351 (Teng et al., 2022), here we present an extension towards the centers of NGC 3627 and NGC 4321. In this paper, we discuss the implications of the combined results for all three galaxy centers. The basic information for these galaxies is provided in Table 1.
This paper is structured as follows. Section 2 describes the observations and data reduction. Section 3 presents the results of integrated intensity, line ratios, and the regional statistics. Our multi-line modeling setup and results are presented in Section 4. In Section 5, we discuss implications from our modeling and solutions and compare with results from the literature. The conclusions are summarized in Section 6.
| Property | NGC 3627 | NGC 4321 | NGC 3351 |
|---|---|---|---|
| R.A. (J2000) | |||
| Decl. (J2000) | |||
| Hubble Type | SABb | SABbc | SBb |
| Nuclear Type | LINER/AGN | H II/LINER | H II |
| Distance (Mpc) | |||
| Linear Scale (pc/) | 54.9 | 73.7 | 48.3 |
| Matched Beam () | 2.0 | 1.7 | 2.1 |
| Inclination (∘) | |||
| Position Angle (∘) | |||
| (M⊙) | 10.84 | 10.75 | 10.37 |
| SFR (M⊙/yr) | 3.89 | 3.55 | 1.32 |
2 Observations and Data
We obtained ALMA observations of six low- CO, 13CO, and C18O lines in Band 3, 6, and 7, covering at least the central (1.5–2 kpc) area in NGC 3627 and NGC 4321. The achieved angular resolutions of 1–2 (or pc in physical scale) allow us to probe molecular gas conditions approaching typical giant molecular cloud (GMC) scales of a few tens of pc (e.g., Scoville et al., 1987). These observations were planned together with and set up similarly to those described in Teng et al. (2022, which cover the central of NGC 3351). We briefly summarize the data characteristics below, and refer interested readers to Teng et al. (2022) for more details.
Our Band 3 observations (projects 2015.1.00978.S and 2016.1.00972.S) captured the =1–0 line of CO with the 12-m array in the C36-2/3 and C40-4 configurations for NGC 3627 and NGC 4321, respectively. The native beam sizes are accordingly and . We use a three-pointing mosaic to cover the central area in each galaxy. The rms noise level is 0.16 K (for NGC 3627) and 0.09 K (for NGC 4321) per 2.5 km s-1 velocity channel.
The Band 6 observations come from two separate projects and cover the =2–1 transitions of CO, 13CO, and C18O in two distinct spectral tunings. Observations of the 13CO and C18O 2–1 (project 2015.1.00978.S) were carried out in the C36-1 and C36-2/3 configurations for NGC 3627 and NGC 4321, respectively. We use a seven-pointing mosaic to cover the central area for each target. The native beam size is () and the rms noise level is 15 mK (9 mK) per 2.5 km s-1 velocity channel for NGC 3627 (NGC 4321). The CO 2–1 data were instead obtained from the PHANGS–ALMA survey (project 2015.1.00956.S) and reach an angular resolution of and an rms level of K (for more details, see Leroy et al. 2021a, b).
The Band 7 observations cover the =3–2 lines of 13CO and C18O (project 2016.1.00972.S) with a mixture of C40-1, C43-1, and C43-2 configurations for either target. The central area in each galaxy is covered by a 14-pointing mosaic, and the achieved native beam sizes are for NGC 3627 and for NGC 4321. The rms noise level is 10 mK (7 mK) per 2.5 km s-1 velocity channel for NGC 3627 (NGC 4321).
We follow the same calibration and imaging process as described in full detail in Teng et al. (2022). In short, we calibrated the raw data with scripts provided by the observatory and imaged all the lines in a similar way adapting the PHANGS–ALMA pipeline (Leroy et al., 2021b). We then convolved all the data cubes to a matched round beam of 2.0 (110 pc) for NGC 3627 and 1.7 (125 pc) for NGC 4321, and produced a set of moment maps and effective line width () maps111The effective line width is defined as , which is identical to moment 2 for a Gaussian line profile. See Heyer et al. (2001) and Sun et al. (2018, 2020a) for more details. for all six lines at the common resolution. The map creation scheme is also similar to that implemented in the PHANGS–ALMA pipeline, except that we start from a high confidence mask including at least two consecutive channels above 5, and then expand into a more inclusive mask with at least two consecutive channels above 2. Finally, we regridded all data products such that the pixel scale matches 1/2 the beam size (i.e., Nyquist sampling). These beam-matched, Nyquist-sampled data products include a set of moment maps and uncertainty maps for all the lines, where the uncertainty maps were derived from the noise measured in the data cubes propagated through the steps of creating the moment maps. The data products are used throughout this work, and many of the maps are presented in Section 3 and Appendix C.1.
We note that most of the observations presented here only used the 12-m array, except for the CO 2–1 observations from PHANGS–ALMA (which combines ALMA 12-m, 7-m, and total-power observations to ensure flux recovery on all scales; see Leroy et al., 2021a). To minimize impacts from the lack of short-spacing data, we adopt the same method introduced in Teng et al. (2022). Namely, we estimate the flux recovery ratio by creating a new CO 2–1 image from only the PHANGS 12-m observations and measuring the (pixel-by-pixel) ratio of the moment 0 maps made from the 12-m only image and the combined 12-m+7-m+TP image. Then, we mask out all pixels with that ratio lower than throughout our analysis. For NGC 3627 and NGC 4321, this results in and of the number of pixels being masked, respectively, after applying the signal-to-noise (S/N) cuts described in Section 3. Thus, we expect individual line intensity errors due to incomplete – sampling to be less than 30%, assuming that CO 1–0 and 2–1 emission shows the same distribution. With the above procedure, we make sure that our analysis avoids regions where there can be significant missing flux due to the lack of short-spacing information.
3 Results
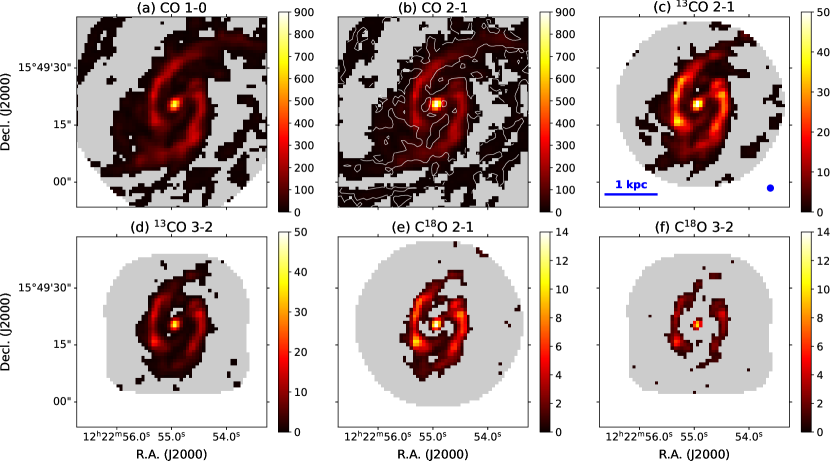
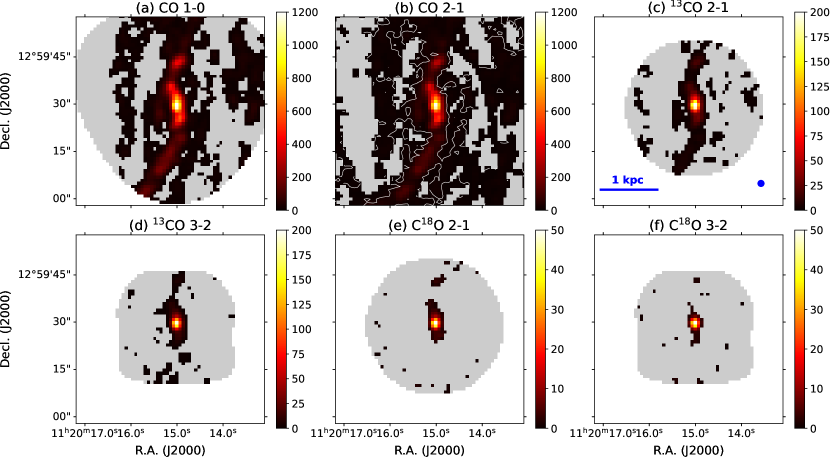
Figures 1 and 2 show the integrated intensity (moment 0) maps of the six observed lines for NGC 4321 and NGC 3627, respectively. In these figures, we mask out regions with S/N for the line integrated intensity based on the ratio of moment 0 map and its associated uncertainty map (Section 2). This masking is applied to the 2D moment maps and is distinct from the masking done on the 3D data cubes when creating the moment maps as described in Section 2.
In NGC 4321, the observations of all six lines capture a bright and compact ( pc) nucleus surrounded by two inner spiral arms or bar lanes at kpc galactocentric diameter. We note that the regions between the nucleus and the arms generally have flux recovery rate (based on CO 2–1), and thus they will be excluded from our analysis. The moment 0 images of NGC 3627 also reveal a pc nucleus as well as bar lanes connected to the center. The nucleus of NGC 3627 is over two times brighter than that of NGC 4321 and is detected in all six lines, while the outer lanes in NGC 3627 are not bright enough to be detected in C18O. We note that the bar-ends of NGC 3627, which are known to have high star formation rate likely due to interactions between the spiral arms and the bar (Watanabe et al., 2011; Murphy et al., 2015; Beuther et al., 2017; Chevance et al., 2020; Bešlić et al., 2021), are just outside our common field of view but can be slightly seen near the south-east edge of Figure 2(b).
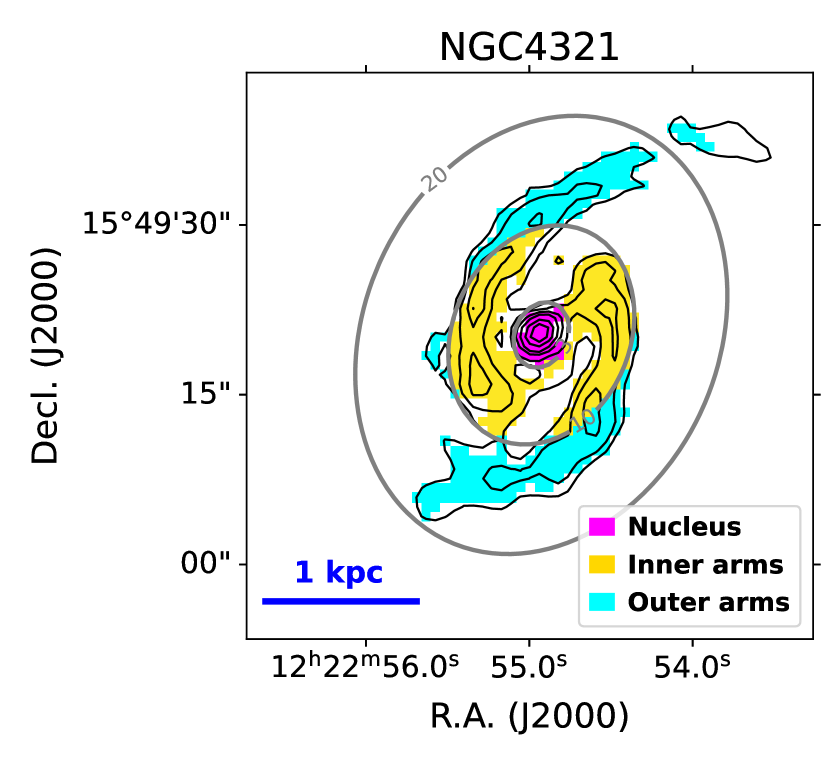
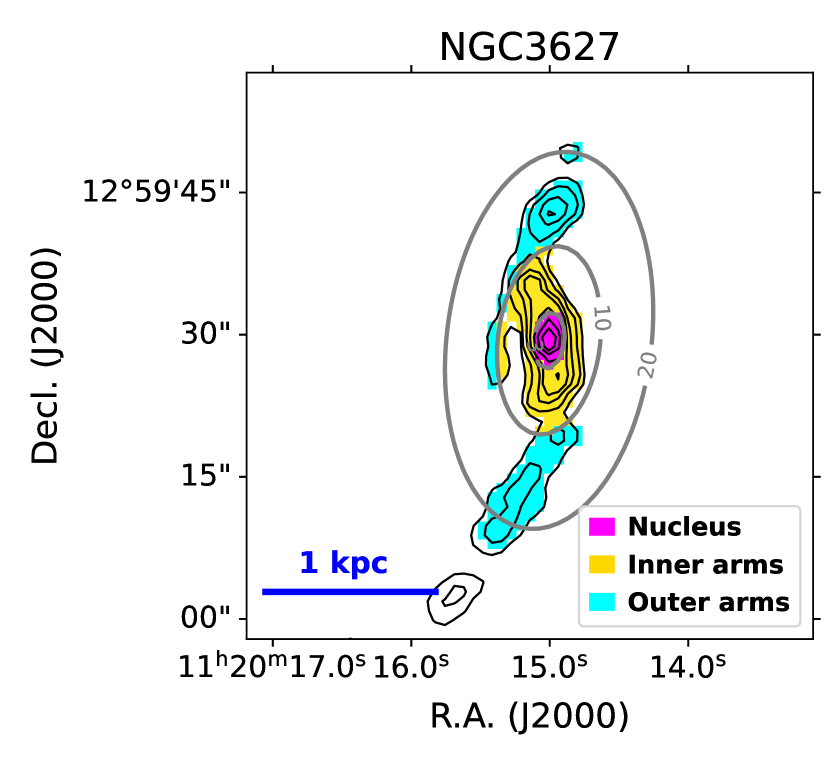
As shown in Figure 3, we define three different regions in both galaxies for further analysis. The “nucleus” is defined as the central (300–450 pc in diameter) region. The “inner arms” cover the inner region in galactocentric diameter but excludes the nucleus region, and the “outer arms” refer to pixels outside a diameter of that are connected to the inner arms222The nomenclature of “arms” in this paper is simply based on gas morphology and has no implications on the dynamical driver of this feature. These regions are bar lanes or inner spiral arms within the main galactic bar, which are different from spiral arms seen in the outer disks.. All the pixels included in our analysis have S/N in 13CO and a flux recovery rate of . To further ensure a reasonable uncertainty range for the parameters estimated from our modeling (Section 4), we only consider pixels with S/N 5 and 50 in 13CO and CO lines, respectively, which corresponds to K km . This intensity cutoff ensures a dex uncertainty in our estimates for every included pixel, and it is applied in addition to the S/N criterion for 13CO.


| Region | CO | 2–1 | 2–1 | 2–1 | 3–2 | ||||
|---|---|---|---|---|---|---|---|---|---|
| [km s-1] | |||||||||
| Whole | Mean | 0.92 | 0.38 | 0.46 | 16.97 | 62.53 | 5.46 | 5.00 | 17.7 |
| Std. Dev. | 0.22 | 0.12 | 0.16 | 11.02 | 34.89 | 1.57 | 1.44 | 6.2 | |
| Integrated Mean | 0.92 | 0.43 | 0.46 | 11.51 | 49.93 | 4.80 | 4.69 | — | |
| Nucleus | Mean | 1.22 | 0.51 | 0.58 | 18.97 | 101.86 | 5.43 | 5.25 | 34.4 |
| Std. Dev. | 0.14 | 0.15 | 0.12 | 2.58 | 43.60 | 1.61 | 1.18 | 9.1 | |
| Integrated Mean | 1.22 | 0.61 | 0.61 | 17.95 | 81.38 | 4.58 | 4.68 | — | |
| Inner arms | Mean | 0.99 | 0.44 | 0.44 | 9.16 | 43.67 | 4.82 | 5.17 | 17.2 |
| Std. Dev. | 0.13 | 0.08 | 0.12 | 2.50 | 17.61 | 0.94 | 1.33 | 5.2 | |
| Integrated Mean | 0.96 | 0.46 | 0.44 | 8.51 | 37.72 | 4.47 | 4.77 | — | |
| Outer arms | Mean | 0.82 | 0.29 | — | 18.56 | 92.01 | 6.68 | — | 16.2 |
| Std. Dev. | 0.14 | 0.09 | — | 9.89 | 33.60 | 1.58 | — | 3.2 | |
| Integrated Mean | 0.81 | 0.31 | — | 14.60 | 80.39 | 6.18 | — | — |
| Region | CO | 2–1 | 2–1 | 2–1 | 3–2 | ||||
|---|---|---|---|---|---|---|---|---|---|
| [km s-1] | |||||||||
| Whole | Mean | 0.75 | 0.46 | 0.73 | 19.88 | 87.84 | 6.13 | 5.16 | 34.1 |
| Std. Dev. | 0.18 | 0.19 | 0.19 | 9.57 | 46.56 | 2.28 | 1.78 | 12.3 | |
| Integrated Mean | 0.81 | 0.63 | 0.85 | 12.55 | 55.51 | 5.67 | 4.60 | — | |
| Nucleus | Mean | 0.93 | 0.74 | 0.86 | 7.51 | 44.75 | 5.69 | 4.94 | 60.9 |
| Std. Dev. | 0.03 | 0.08 | 0.12 | 2.22 | 21.41 | 0.97 | 0.94 | 8.2 | |
| Integrated Mean | 0.93 | 0.78 | 0.91 | 6.65 | 34.29 | 5.16 | 4.40 | — | |
| Inner arms | Mean | 0.85 | 0.43 | 0.65 | 21.06 | 109.64 | 7.29 | 5.86 | 38.9 |
| Std. Dev. | 0.18 | 0.13 | 0.19 | 8.63 | 37.60 | 1.52 | 1.82 | 10.4 | |
| Integrated Mean | 0.84 | 0.49 | 0.64 | 15.78 | 98.93 | 7.12 | 5.89 | — | |
| Outer arms | Mean | 0.72 | 0.35 | — | 27.20 | — | — | — | 26.2 |
| Std. Dev. | 0.09 | 0.15 | — | 8.43 | — | — | — | 4.5 | |
| Integrated Mean | 0.70 | 0.32 | — | 23.15 | — | — | — | — |
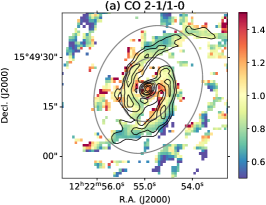
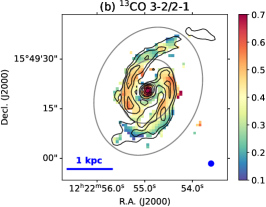
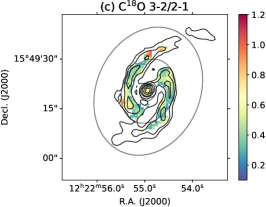
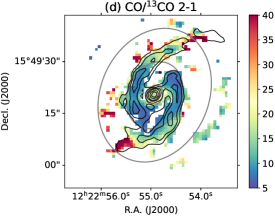
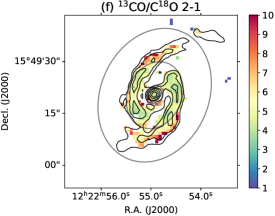
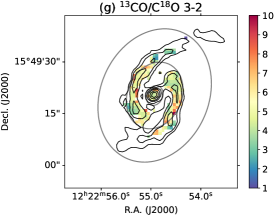
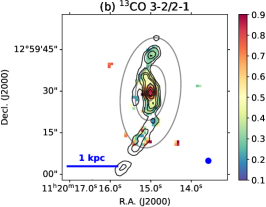
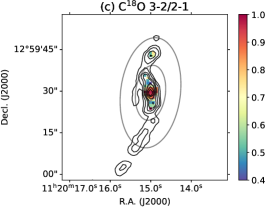
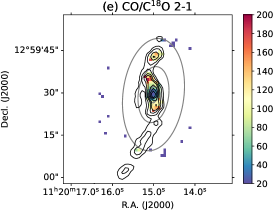
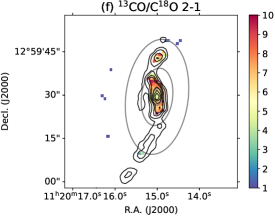
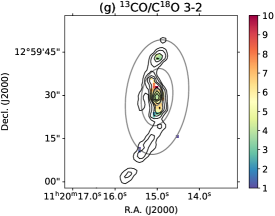
Figure 4 and 5 show the line ratio maps of CO 2–1/1–0, 13CO 3–2/2–1, C18O 3–2/2–1, CO/13CO 2–1, CO/C18O 2–1, 13CO/C18O 2–1, and 13CO/C18O 3–2, which are generated from the moment 0 maps in units of K km . These line ratio maps reveal clear variation among our defined regions. All the same-species ratios, which are primarily sensitive to temperature (panels (a)–(c) in Figures 4 and 5), show clear enhancement in the nucleus of NGC 4321 and 3627, suggesting warmer and/or denser gas toward both galactic nuclei. However, the two galaxies show different trends in the same-transition ratios which are mostly sensitive to abundance/opacity. In NGC 4321, the CO/13CO and CO/C18O ratios in the inner arms are times lower than in the nucleus, while the 13CO/C18O line ratios are similar between the arms and the nucleus. On the other hand, NGC 3627 shows that all four abundance/opacity sensitive ratios are lower in the nucleus than in the rest of the regions. This likely indicates different variations in optical depths and/or CO isotopologue abundances in these galaxy centers, which will be addressed via our modeling (Section 4).
The regional statistics of the observed line ratios are listed in Table 2 and 3. The means and standard deviations are calculated from the ensemble of pixel-by-pixel measurements in the relevant region, while the integrated means are determined by dividing between the regionally integrated intensities. Since the C18O line(s) are not commonly detected in the outer arms, the relevant line ratios for those regions are not listed. The CO 2–1/1–0 ratio averaged over the whole field of view is 0.9 for NGC 4321 and 0.8 for NGC 3627, and it is even higher in their inner 300 pc nuclei. This is consistent with recent line ratio studies at kpc resolution (den Brok et al., 2021; Yajima et al., 2021; Leroy et al., 2022).
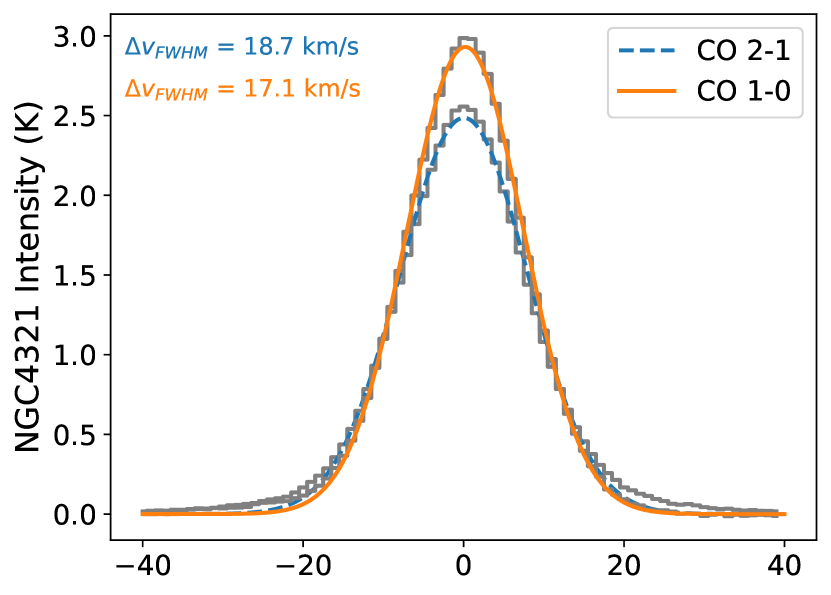
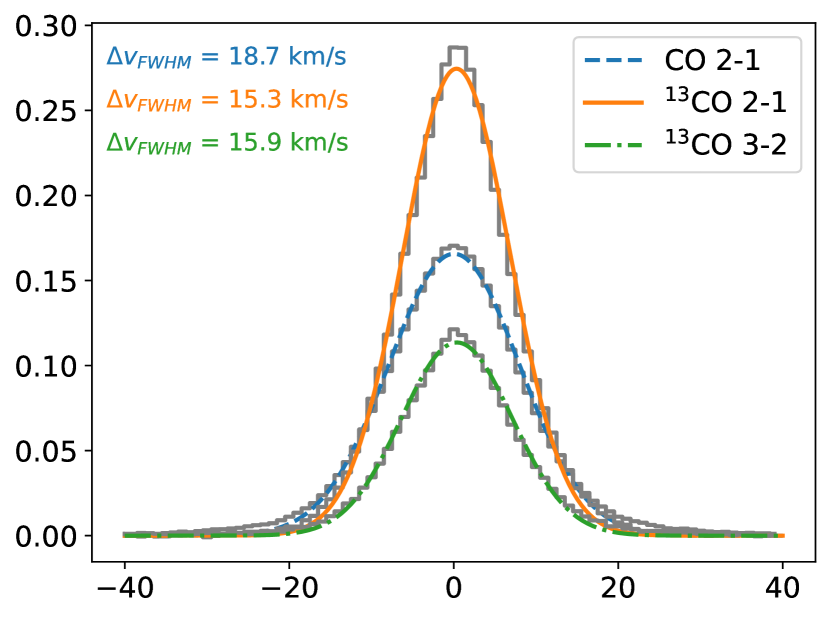
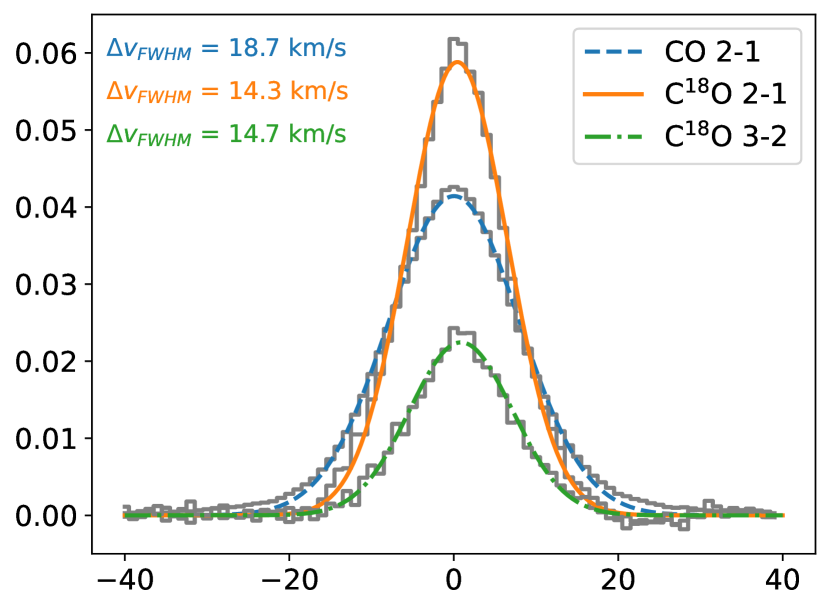
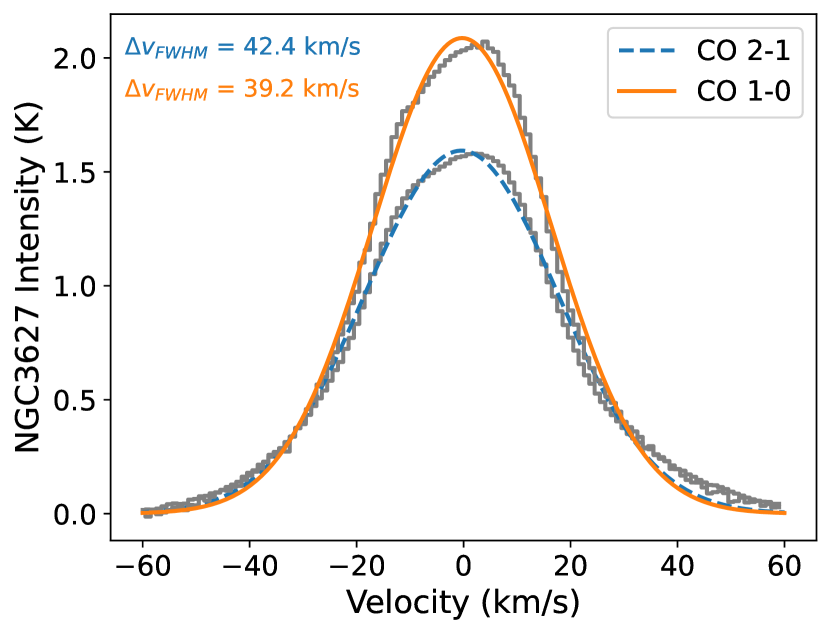
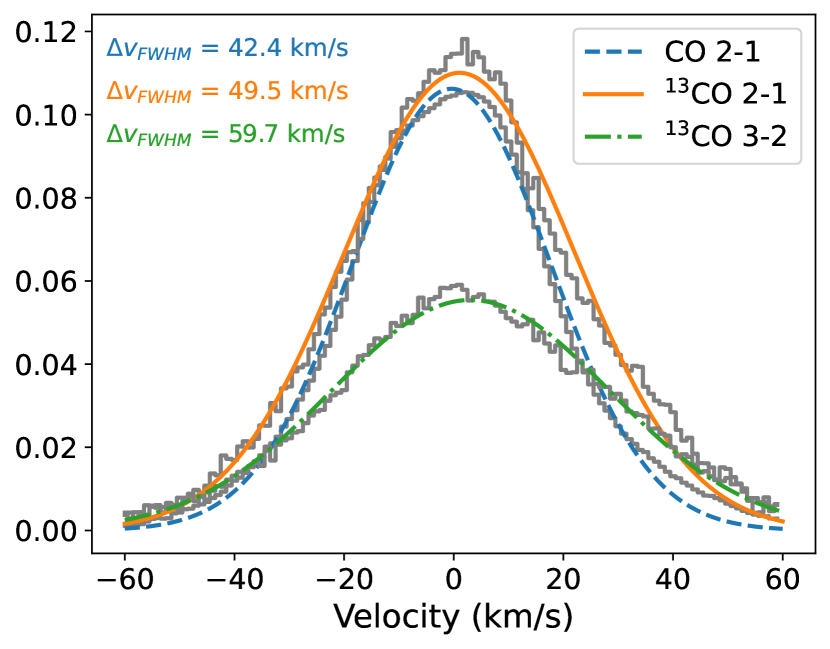
In Figure 6, we present the averaged spectra over the entire region defined in Figure 3 for all six lines. The spectra are obtained by applying the stacking technique (Schruba et al., 2011) and using the CO 2–1 moment 1 (see maps in Appendix C.1) as the fiducial velocity centroid. Except for the poorly detected C18O 3–2 line in NGC 3627, the averaged spectra of all the lines in each galaxy show similar line widths within 30–40%. This means that the velocity dispersion among different observed lines are overall in good agreement, and we also see agreement on pixel-by-pixel scales via a thorough check of each individual line of sight (e.g., Appendix A). Comparing to NGC 4321, we notice that the averaged spectra for NGC 3627 show some level of discrepancy with the best-fit Gaussian function. The discrepancy is possibly due to a larger fraction of area in NGC 3627 having multi-component gas along the same lines of sight, and this will be further discussed in Appendix A. The regional statistics of the CO 2–1 effective line widths are also listed in Table 2 and 3, and their maps can be found in Appendix C.1. The line widths in CO 1–0 are consistent with CO 2–1 within .
To investigate the physical implications of these line ratio and line width variations, we determine the gas physical conditions pixel by pixel in these galaxy centers in Section 4, using multi-line radiative transfer modeling without assuming local thermodynamic equilibrium (LTE).
4 Multi-line Bayesian Modeling
4.1 Modeling Setup
| Parameter | Range | Step Size |
|---|---|---|
| dex | ||
| dex | ||
| dex | ||
| dex | ||
| — |
To constrain the physical conditions and in different sub-regions of the galaxy centers, we run a non-LTE radiative transfer code, RADEX (van der Tak et al., 2007), to construct a one-component model and fit it with our observations at 100 pc scales. RADEX assumes a homogeneous medium and uses radiative transfer equations based on the escape probability formalism to find a converged solution for the excitation temperature and level population. On a pixel-by-pixel basis, we model the integrated intensities of the six CO, 13CO, and C18O lines under various combinations of volume density (), kinetic temperature (), CO column density per line width (), CO/13CO () and 13CO/C18O () abundance ratios, and the beam-filling factor ().
This model assumes the same beam-filling factor for all six observed lines. We note that earlier studies on some barred galaxy centers found high CO/13CO line ratios in bar regions, which may be explained by the existence of diffuse molecular components that lead to differences in the beam-filling factor of CO and 13CO lines (Hüttemeister et al., 2000; Watanabe et al., 2011). However, those studies worked at near-kpc resolutions, and the near-GMC resolution used in this work should reduce the possible beam-filling factor mismatch. While could still be lower for emission from higher transitions or less abundant isotopologues, investigating how much differs between the lines in each region requires more sophisticated modeling or simulation that includes as a variable. We briefly describe the modeling setup below and note that the modeling approach is the same as that adopted in Teng et al. (2022), where readers can find more details about our RADEX implementation and model construction. We also release all the source code and parameters in a GitHub repository333https://github.com/ElthaTeng/multiline-bayesian-modeling.
We build a six-dimensional RADEX model grid with varied from to in steps of dex, from to K in steps of dex, from to in steps of dex, from to in steps of , from to in steps of , and from to in steps of dex (see Table 4). While the and listed in Table 4 are input separately to RADEX444In RADEX calculation, the line width should be input in FWHM, and thus we converted our effective line width to FWHM by a factor of 2.35 in this step., it is important to note that the radiative transfer calculation in RADEX depends only on their ratio (van der Tak et al., 2007, see also Kamenetzky et al. 2012; Teng & Hirano 2020; Teng et al. 2022). This means that we are essentially fitting , and thus variation of across the observed regions would not affect our results as long as we ensure that is unchanged when we derive using the observed . We set the upper limit of to 500 K due to low reliability to distinguish a higher with =3–2 as the highest transition in our setting. The parameter ranges were determined by ensuring well-covered probability density functions (PDFs) in representative nucleus and arm regions. We note that RADEX fails to converge at several grid points where K and , and thus we exclude those solutions in our modeling. We will show that such conditions tend to result in unreasonably large line-of-sight path length which will also be excluded by our line-of-sight prior, so the lack of these models does not impact our analysis.
Following Teng et al. (2022), we study pixel by pixel the marginalized PDFs of each parameter using a Bayesian likelihood analysis. With the marginalized 1D PDFs, we will determine the peak parameter values as the “1DMax” solutions and the 50th percentile values as the “median” solutions. The “best-fit” solution which corresponds to the global minimum value of the full 6D grid is also derived. In contrast to a single best-fit solution representing the gas physical properties, the PDFs are descriptive of the local variations over the full parameter space, and the 1DMax/median solutions from the PDFs reflect a more complete characterization of the parameter distributions. Therefore, we will focus on the 1DMax/median solutions throughout our analysis, while we also show that 1DMax, median, and best-fit solutions agree well in many cases. In our calculation, we include the measurement uncertainty and an estimated flux calibration uncertainty of 10% for Band 3 and 20% for Band 6 or 7, respectively (Sliwa et al., 2017; Bonato et al., 2019). For regions with C18O detection (e.g., outer arms), we still include the C18O intensity with its (higher) associated uncertainty in our modeling. However, those lines are excluded from our fitting if the pixel has negative C18O integrated intensity below . Thus, the solutions for some pixels can be constrained by less than six lines, although this situation only occurs in the outer arms of NGC 3627.
To avoid solutions that result in unrealistically large line-of-sight path lengths (), we also set a prior by requiring
| (2) |
where is the CO/H2 abundance ratio that is normally found or adopted as in active star-forming regions (Lacy et al., 1994; Ward et al., 2003; Sliwa et al., 2014). This pc constraint considers the typical molecular gas scale height of pc for our Galaxy and nearby disk galaxies (Yim et al., 2014; Heyer & Dame, 2015), as well as a tolerance of a factor-of-two increase due to galaxy inclination. Since and are both our modeled parameters, and can be obtained by multiplying the modeled with the observed line width, this line-of-sight prior can be easily implemented by excluding all the grid points (i.e., parameter combinations) that give pc and setting their probability to zero. As shown by Equation 2, the prior tends to rule out solutions with high column densities of and low volume densities of . This also means that most of the conditions where RADEX fails to converge are excluded by the line-of-sight constraint due to high CO column densities.
4.2 Molecular Gas Physical Conditions
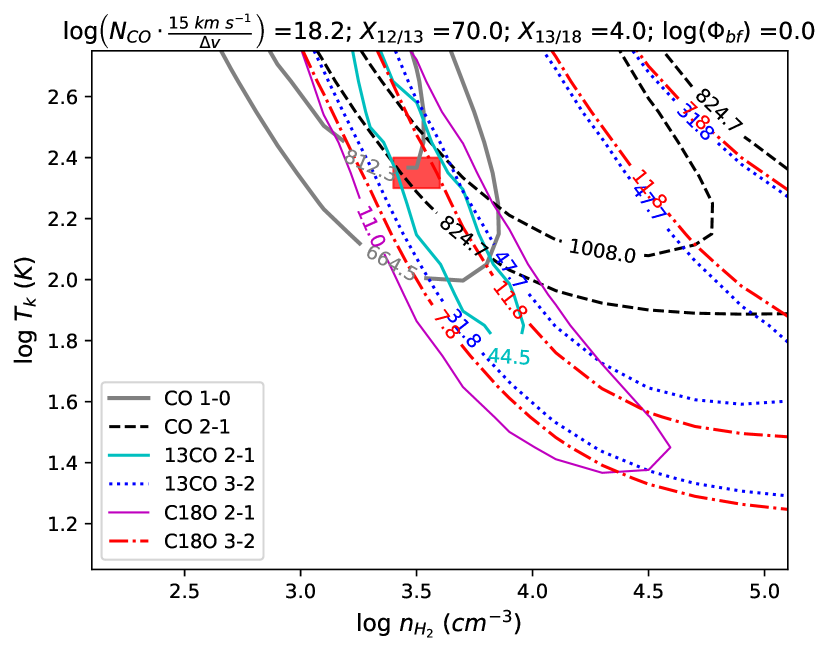
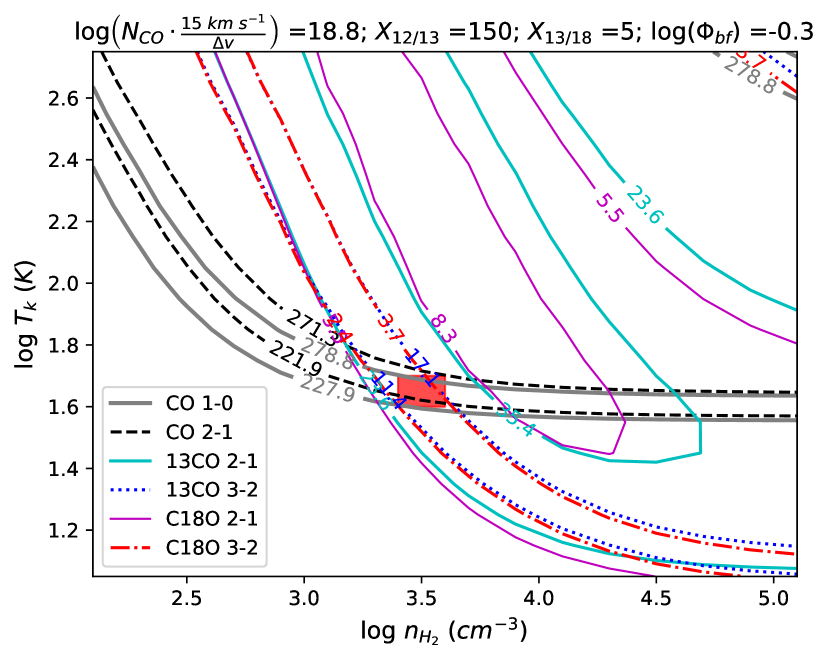
(a)
(b)
By fitting the line observations with the constructed RADEX models at each pixel, we obtain well-constrained solutions for most of the physical parameters. Figure 7 demonstrates how the best-fit solutions are constrained by the six observed line intensities (, including measurement and calibration uncertainties) at the central pixel and another pixel in the inner arm region of NGC 4321. In general, we find the best-fit solution of each pixel well within the constraints given by all the observed lines, although the number or species of lines that give crucial constraints varies from pixel to pixel (see Section 5.5 for further discussion).
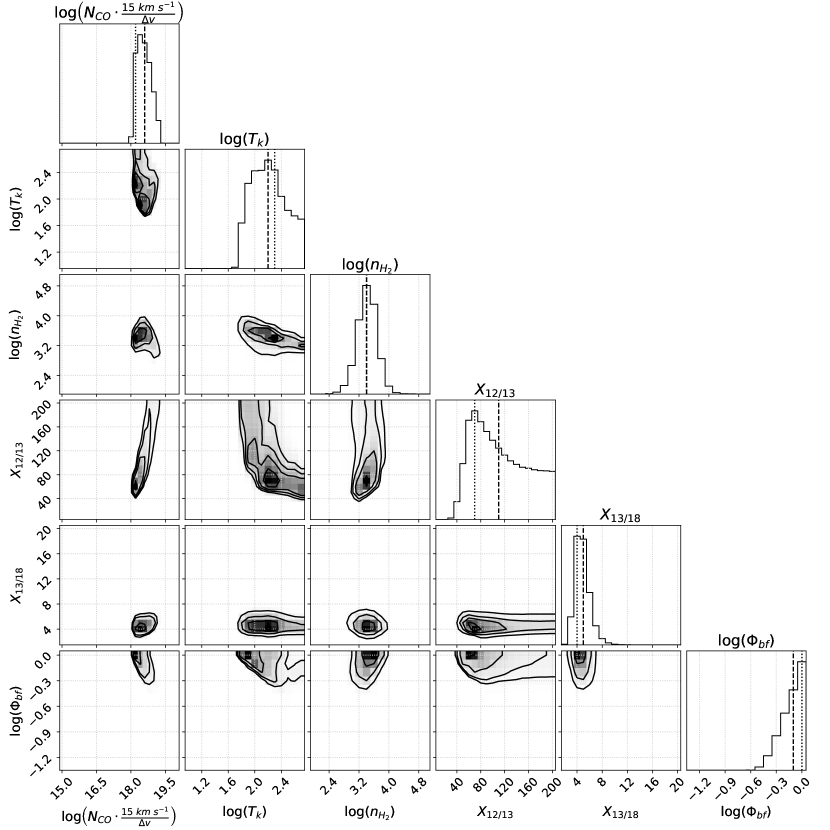
Overall, we find the marginalized PDFs for each parameter to be single-peaked and well-covered by the parameter space. However, we notice that the PDFs of tend to be broader than other parameters, implying that the abundance ratio is generally less constrained by the model based on the observed lines. This was also seen in similar modeling toward other galaxy centers or (U)LIRGs (Sliwa et al., 2014, 2017; Teng et al., 2022). In Figure 8, we show the marginalized 1D and 2D PDFs for the central pixel of NGC 4321. The vertical dashed lines on the 1D PDFs represent the 50th percentile values (median), which generally agree with the 1D PDF peaks (1DMax) as well as the best-fit solutions shown in Figure 7(a). In this pixel, the 1DMax solution of matches the best-fit solution, but it is inconsistent with the median due to the broader and asymmetric PDF of . More examples of the PDFs and/or best-fit solutions for other pixels in NGC 4321 and NGC 3627 are presented in Appendix C.2. Over the entire observed regions, we find that the best-fit and 1DMax solutions of , , , and are mostly consistent, while the 1DMax can deviate from the best-fit or median solutions in some regions due to less constrained PDFs.
| Region | |||||||
|---|---|---|---|---|---|---|---|
| () | (K) | () | |||||
| NGC 4321 | |||||||
| Whole | 1DMax | ||||||
| () | Median | ||||||
| Nucleus | 1DMax | ||||||
| () | Median | ||||||
| Inner arms | 1DMax | ||||||
| () | Median | ||||||
| Outer arms | 1DMax | ||||||
| () | Median | ||||||
| NGC 3627 | |||||||
| Whole | 1DMax | ||||||
| () | Median | ||||||
| Nucleus | 1DMax | ||||||
| () | Median | ||||||
| Inner arms | 1DMax | ||||||
| () | Median | ||||||
| Outer arms | 1DMax | ||||||
| () | Median |
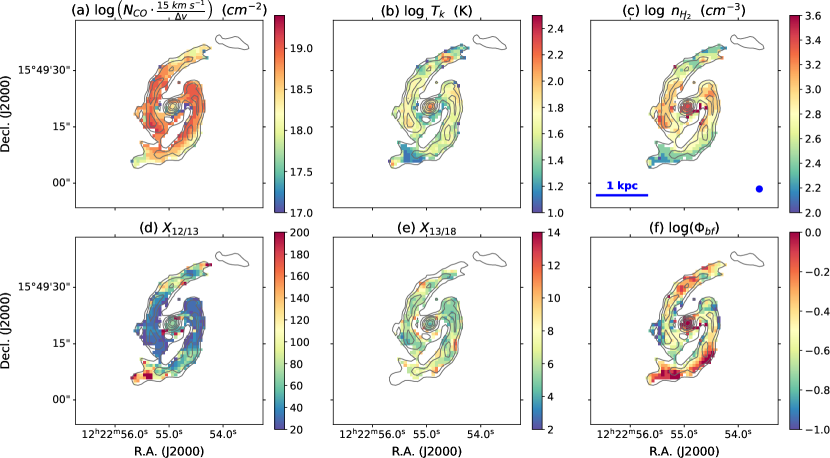
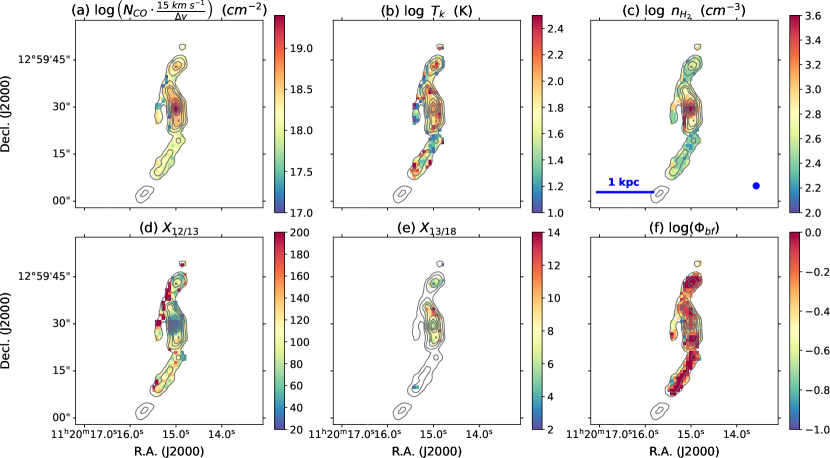
We present the 1DMax solution maps for each parameter in Figures 9 and 10. The regional statistics of the 1DMax and median solutions are listed in Table 5. Both NGC 4321 and NGC 3627 show clear trends of increasing and from the outer arms to the nucleus. , which reflects the optical depth, also increases toward the centers, except in the nucleus of NGC 4321. Despite having a 0.2–0.5 dex lower , the nucleus of NGC 4321 has similar as the arm regions. This is because the line width at the NGC 4321 nucleus is , which is larger than the line widths in the inner/outer arms by more than a factor of two (see Table 2). We note that the line width at the nucleus of NGC 3627 is also larger than that in its arm regions, and thus the central enhancement of is even more dramatic than that shown by the enhancement in Table 5. With a typical line width of , the mean in the NGC 3627 nucleus exceeds .
High temperature and volume density are also found in the nucleus of NGC 3627, with mean and reaching K and , respectively. The nucleus of NGC 4321 also shows 100 K and , higher than the average conditions of the arm regions in both galaxies. We note that the nuclear type of NGC 4321 is mostly classified as a low-ionization nuclear emission region (LINER) and NGC 3627 as either a LINER or a Seyfert 2 AGN (Ho et al., 1997; Filho et al., 2000; Moustakas et al., 2010; Belfiore et al., 2022). As the inner 300 pc regions may be impacted by nuclear activity, it is reasonable to find much more excited gas conditions in these regions.
From Figures 9 and 10, we find a consistent 1DMax solution of 40 across the inner arms of NGC 4321 and the nucleus of NGC 3627, though the median solutions imply higher of 80–90 (see Table 5 and Appendix C.2). On the other hand, the 1DMax and medians in the inner/outer arms of NGC 3627 agree well, suggesting 100. Both the 1DMax and median solutions in the nucleus and outer arms of NGC 4321 also imply higher of 80–100. Similar to the distribution, we also derive the lowest (6) in the inner arms of NGC 4321 and the nucleus of NGC 3627. The decrease of both and in those regions may indicate 13C and 18O enrichment from enhanced star formation. We note that the derived across both galaxy centers are well-constrained at a range of 6–8 which is similar to the Galactic Center value (Areal et al., 2018). On the other hand, our derived values are higher than 25 found in our Galactic Center (Wilson & Rood, 1994; Milam et al., 2005; Yan et al., 2023) as well as the central kpc of NGC 3351 (Teng et al., 2022). This is in line with the higher values varying from 40 to 100 that have been commonly found in other starburst galaxy centers or (U)LIRGs, likely due to higher inflow rates and/or stellar nucleosynthesis enrichment (Henkel et al., 2014; Sliwa et al., 2014, 2017; Tang et al., 2019).
4.3 CO-to-H2 Conversion Factors
(a)

(b)
(a)
(b)
The CO-to-H2 conversion factor (see Equation 1 for definition) can be expressed as a function of , , and the CO 1–0 intensity :
| (3) | ||||
where is the CO/H2 abundance ratio. In the second step of the above equation, the factor of is to include the mass contribution from helium, is the mass of a hydrogen molecule, and is the area relevant to the conversion between and . All of these factors are reduced to the constant in the final step of Equation 3. We note that galaxy inclinations do not affect the result of , because the inclination correction on and (which includes ) would cancel out in Equation 3.
Since our modeling directly constrains and and provides a prediction of the values that matches the observed one, we can derive the spatial distribution of from the modeling with an assumption of . While can be determined by multiplying with , we caution that the should be consistent with the line width of the observed . This is different from the calculation in Teng et al. (2022), where the line widths were not consistent. As we will compare their result on NGC 3351 with ours in Section 5, we list the updated values of NGC 3351 in Appendix B for self-consistency. We note that the key conclusions in Teng et al. (2022) are unchanged, but the updated values are overall lowered by a factor of two to three (see Appendix B for more details).
Throughout our analysis, we assume , which is supported by measurements of warm/dense star-forming clouds (e.g., Lacy et al., 1994; Sofia et al., 2004; Sheffer et al., 2008) and commonly adopted in various starburst regions (e.g., Kamenetzky et al., 2012, 2014; Sliwa et al., 2014, 2017). As this value assumes that most carbon is in the form of CO, which is not necessarily true in some galaxy centers (e.g., Liu et al., 2022, 2023), the uncertainty in our values could be at the factor of 2–3 level because of this assumption. In addition, while we do not expect that elemental abundance variations of C and O are large enough to drive variations on sub-kpc scales, there are other mechanisms which may destroy the CO molecule and lower the CO/H2 abundance, such as photodissociation by FUV radiation and cosmic rays in starburst or AGN environments (Gong et al., 2018; Bisbas et al., 2021; Liu et al., 2022). The effect of photodissociation is the strongest in optically thin and CO-faint regions where the shielding of FUV radiation is weak, such as interarm and outer galaxy regions. However, we emphasize that a better prediction of the value is not feasible with current dataset and analysis. Thus, it is important to note that our derived values depend inversely on , i.e., .
With Equation 3 and following the procedure described in Teng et al. (2022, Section 4.4), we create a grid of from -2.5 to 2.5 with a step size of 0.1 and obtain marginalized PDFs of for each pixel. Then, we extract the 1DMax/median solutions from the PDFs. With this method, the derived does not depend on the best-fit/1DMax/median solutions of and determined in Section 4.2, since those parameters are fit simultaneously within the full grid before marginalization. We refer readers to Teng et al. (2022) for more details.
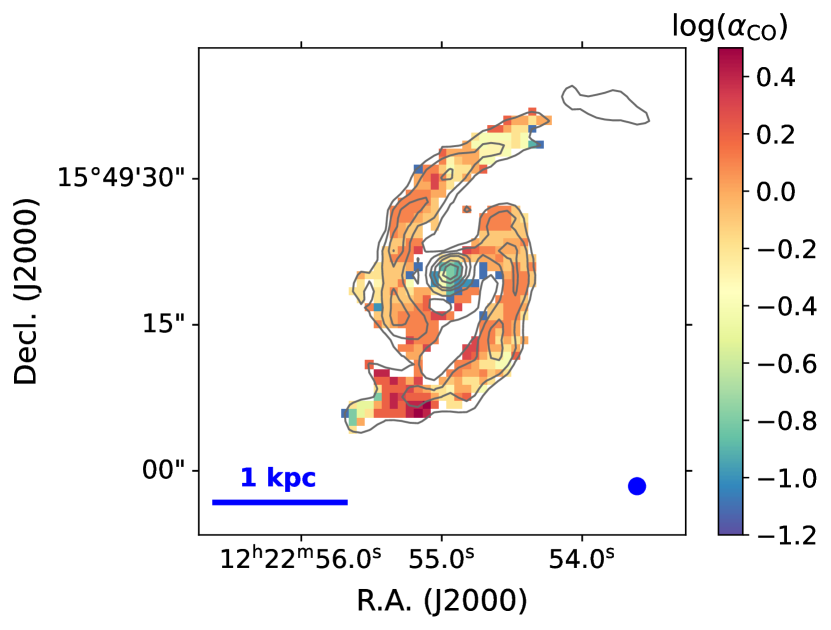
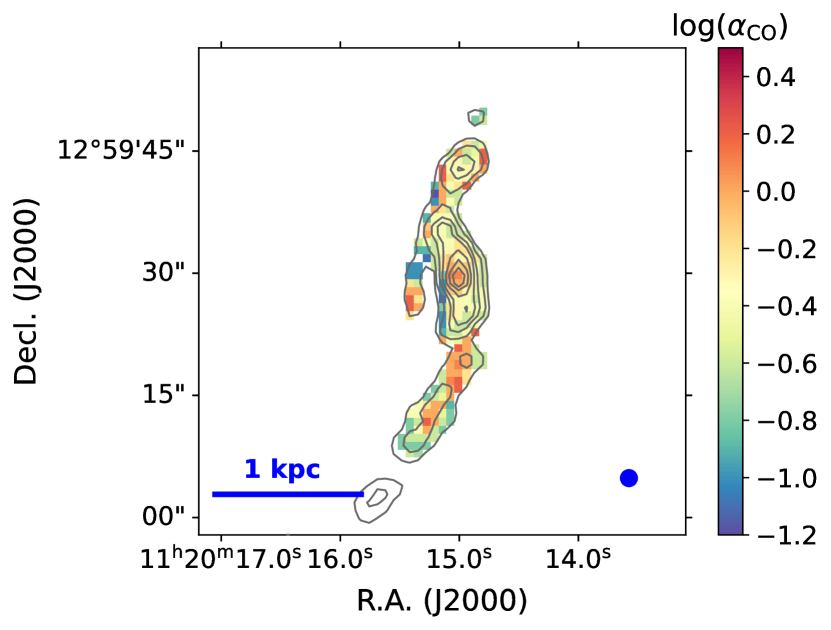
Figures 11 and 12 show the spatial variations of across the observed regions. The 1DMax and median solutions are similar and have consistent trends with the galactocentric radius. We will mainly present the median solutions hereafter due to their continuity across the parameter space resulting from interpolation. As shown in Figure 11(b), the arm regions of NGC 4321 have a roughly constant around -0.1 (i.e., ), and there is a decreasing trend toward the outer arms. On the other hand, the nucleus region shows (or ), which is a factor of 3–5 lower than in the arms. In NGC 3627, the general values are even a factor of 2–3 lower than in NGC 4321. Furthermore, Figure 12(b) shows that decreases sharply from the nucleus to the inner arms, while the outer arms show a large scatter of which likely results from the lower S/N of 13CO 3–2 and C18O data in this region.
We note that trends of decreasing with radius are seen in the inner/outer arm regions of both NGC 3627 and NGC 4321. We will discuss these trends seen in barred galaxy centers in Section 5.1. Moreover, our modeling results show that all pixels across the observed regions in both galaxy centers have that is 4–15 times below the Galactic disk average of . This range of lower is consistent with previous kpc-scale estimations toward galaxy centers using independent techniques (Strong et al., 2004; Sandstrom et al., 2013; Israel, 2020; den Brok et al., 2023). In Section 5.2, we will compare our kpc-averaged with those studies which included NGC 3627 and NGC 4321.
5 Discussion
5.1 Distribution and Environmental Dependence

(a)
(b)
(a)
(b)
(a)
(b)
To study the spatial variation of at 100 pc scales in barred, star-forming galaxy centers, we present a cross comparison among the results from Teng et al. (2022) on NGC 3351 and this work on NGC 3627 and NGC 4321. As the non-LTE radiative transfer modeling also predicts the optical depth for each line, we derive full PDFs of the CO optical depths (in both 1–0 and 2–1) as well as , using the same technique for determining the solutions in Section 4.3. It is interesting to compare our with CO optical depth () and gas temperature (), as they together determine the amount of escaped CO emission that can change (Papadopoulos et al., 2012; Teng et al., 2022). We also derive because is expected to be approximately proportional to this quantity for isolated and virialized clouds when CO lines are optically thick and thermalized (Bolatto et al., 2013; Gong et al., 2020). The grids for both and range from -2 to 2 with a step size of 0.1.
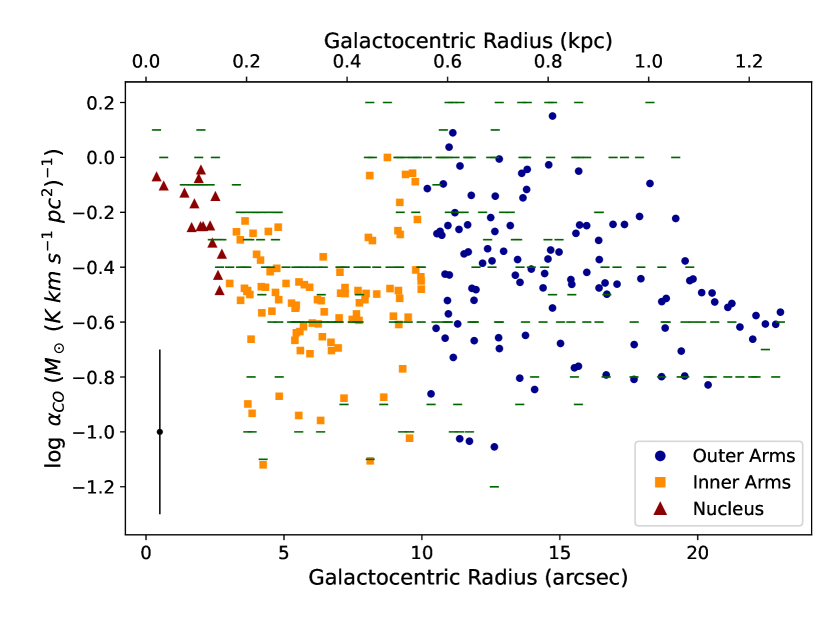
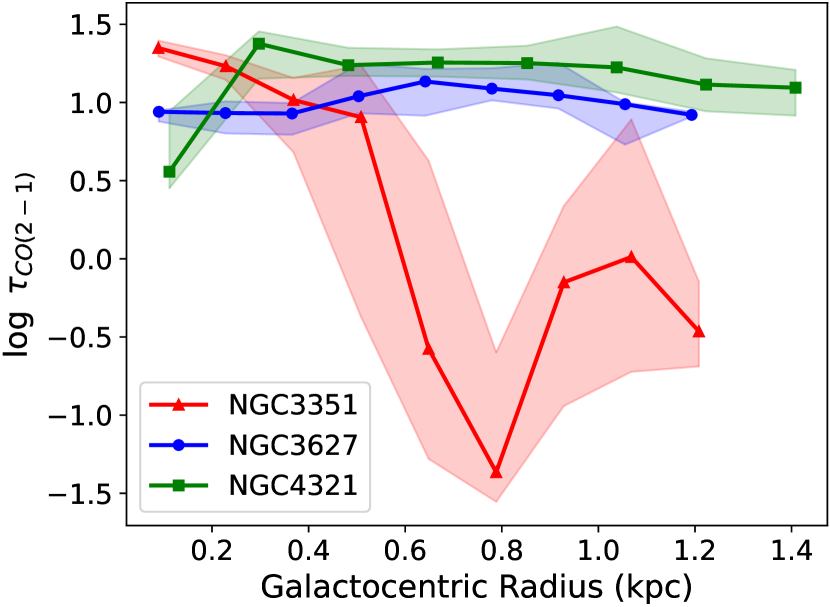
Figure 13(a) shows the radially-binned medians and the 25–75th percentile ranges of the median solutions presented in Figure 11(b) and 12(b), together with the NGC 3351 results (see Appendix B). The bin size is 150 pc in galactocentric radius. A similar plot showing the median solutions of is provided in Figure 13(b). It is clear that all regions in the three galaxy centers have at least four times lower than the Galactic value of 0.64. In addition, all three galaxies show a globally decreasing trend until a radius of 1.5 kpc, and in NGC 3351 inflow regions (i.e., beyond a radius of 0.5 kpc; Teng et al., 2022) drops substantially. Excluding the NGC 3351 inflow regions, in the three galaxy centers vary between 0.2–1.5 . By comparing between Figure 13(a) and (b), it is clear that for each galaxy the radial variation of and are overall similar. We note that the spatial variations are consistent between and , except that the values of are generally higher than . The higher than in our galaxy centers is likely caused by the higher density/temperature that efficiently excites CO to upper- and thus depopulates the lower- levels, and it is consistent with theoretical predictions for gas with cm-2 (e.g., Hu et al., 2022).
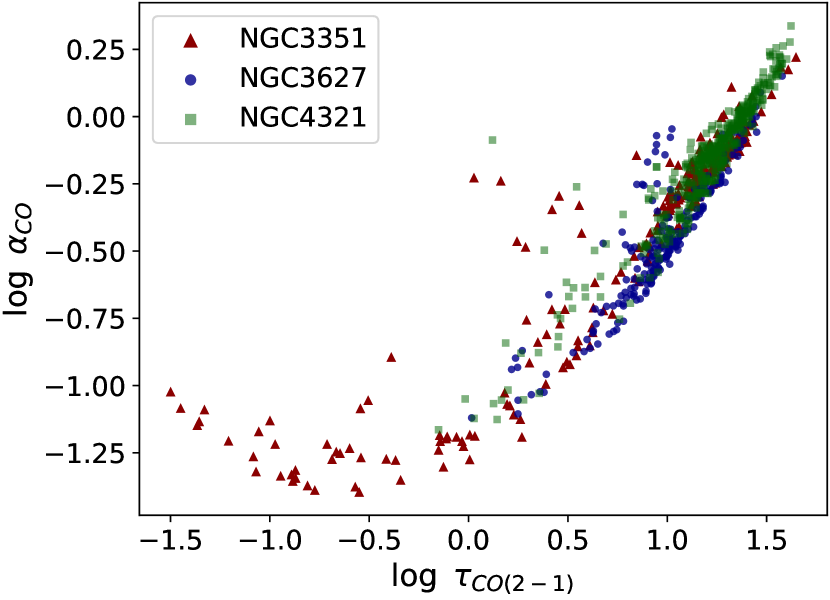
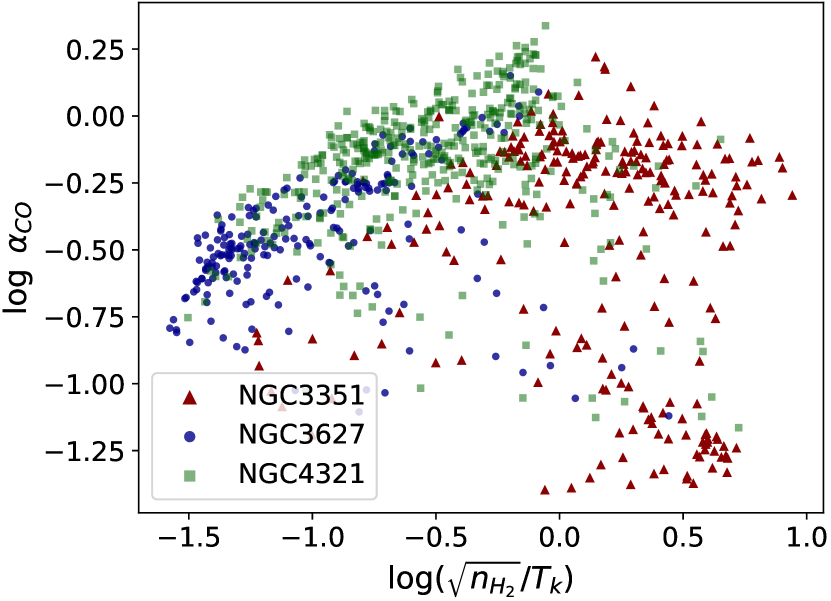
Motivated by the resemblance of Figure 13(a) and (b), we further investigate the correlation between and . Figure 14 presents the pixel-based median solutions of and from all three galaxies, where we can see a tight, positive trend between and in optically thick regions. On the other hand, the optically thin gas from the bar-driven inflows of NGC 3351 show substantially lower with little dependence on , which matches the expectation for relatively diffuse ( cm-2) gas in simulations (Gong et al., 2018, 2020). The positive correlation between and agrees well with theoretical predictions for thermalized emission, where is expected for optically thick emission with (Papadopoulos et al., 2012). Since is by definition proportional to and , this means that gas concentration toward galaxy centers (which increases ) and turbulence/shear effects (which changes ) play important roles in setting in the central kpc of these barred galaxies. It is thus possible that the overall higher velocity dispersion in galaxy centers can lower the optical depth and lead to systematically lower than the Galactic disk value across our maps (see Section 5.3.2 for further discussion).
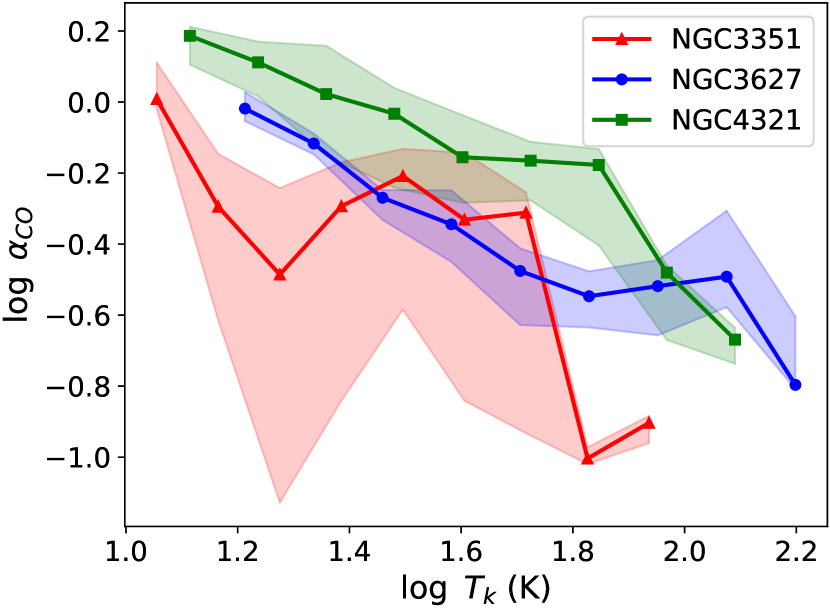
While there is a strong dependence on , we also notice diverging toward the nucleus ( pc) of NGC 3627, where is increasing while remains unchanged. This means that the variation cannot be solely explained by , and thus there must be additional factors at play. Theoretical studies have suggested that may decrease with temperature as the optically thick CO 1–0 intensity increases with temperature (Narayanan et al., 2012; Bolatto et al., 2013; Hu et al., 2022). We present the relation between our modeled and in Figure 15(a). While NGC 3351 does not show strong evidence for varying with (see also Teng et al., 2022), we find a clear decrease of with in NGC 3627 and NGC 4321. Notably, the local peak of for NGC 3627 (blue curve) near corresponds to the increase in NGC 3627’s nucleus, and continues to drop in regions with even higher temperature. Though the nucleus in NGC 3627 already has high K, the highest actually occurs in regions surrounding the nucleus (see Figure 10(b)). This temperature drop toward the nucleus could explain why rises while stays flat in Figure 13.
Based on NGC 3627 and NGC 4321, the 25th–75th percentile scatter of in the – relation is 0.4 dex, which is larger than the 0.1 dex scatter in the – relation shown in Figure 14. This suggests that optical depth and gas temperature effects contribute 80% and 20% of the change in the derived , respectively, assuming they are independent and no other factors are at play. In that case, is likely the main driver of variation in these galaxy centers, while plays a secondary role in changing . Using the results from all three galaxies but excluding the optically thin inflow regions of NGC 3351, we fit the , , and relation with a power law and obtain
| (4) | ||||
By performing bootstrapping and refitting 1000 times, we determine an uncertainty of for the slopes with respect to either or , and for the intercept.
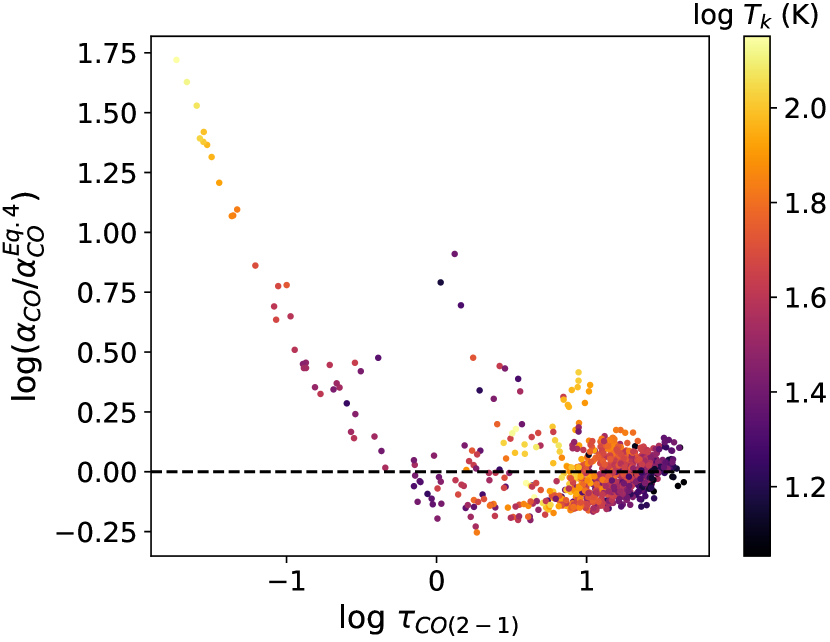
Figure 16 illustrates how the ratio of measured from our modeling and predicted by Equation 4 varies with and . In the optically thick regime, the 25–75th percentile scatter is 0.12 dex, which is similar to that seen in the – relation (see Figure 14). A rough inverse trend can be seen between and , which is expected as higher temperature can increase level population in high- transitions and decrease the optical depth of low- line emission. It is also clear that the power-law fit underestimates in the optically-thin inflow regions of NGC 3351. Therefore, we emphasize that Equation 4 should only be applied to optically thick regions.
We further remind readers that this paper focuses on disentangling the emissivity-related drivers of , and thus is assumed constant at a starburst value of over the entire region. This means that Equation 4 should either be limited to starburst-like environments with higher , or be adjusted by multiplying a factor of . For instance, molecular clouds in the Milky Way disk can have times higher values than that predicted by Equation 4, as they normally have (Frerking et al., 1982; Blake et al., 1987; Kulesa, 2002; Sheffer et al., 2008; Pitts et al., 2019).
The spatial variation of may also affect the derived variation. If in the arms is lower than in the nucleus, as expected from increasing CO-dark H2 fraction with galactocentric radius due to decreasing gas surface density (e.g., Smith et al., 2014), then in the arms of NGC 3627 would become similar to the nucleus having higher values. Alternatively, increasing in the NGC 3627 nucleus is also possible via the enrichment of 12C through stellar nucleosynthesis from intermediate or high-mass stars. While it is typically expected that stronger cosmic ray ionization would decrease in starburst or AGN-host galaxy centers (Gong et al., 2020; Bisbas et al., 2021; Liu et al., 2022), exceptions have been found in places reaching high gas temperature of 100 K due to the trigger of OH formation that further increases (Bisbas et al., 2017). Therefore, with the modeled K near the nucleus of NGC 3627, the potential rise of could also lead us to overestimate , implying that in the nucleus may not be distinctly higher than the arm regions. However, we emphasize again that our modeling cannot constrain the absolute values, and thus the net change of is still to be studied in more detail with the comprehensive effects mentioned above.
To investigate whether the theoretical expectation of / under the virial assumption also holds in the three galaxy centers, Figure 15(b) shows the relation between the modeled and /. It is clear that both NGC 3627 and NGC 4321 show a positive correlation of with , which may indicate that the molecular clouds are overall close to virial balance or have a similar virial parameter. However, a similarly high virial parameter should be more likely in our case, given that previous studies already reported high virial parameters of 2–10 for GMCs in both galaxy centers assuming a Galactic-like or metallicity-dependent (Pan & Kuno, 2017; Rosolowsky et al., 2021). The high virial parameter in these galaxy centers may indicate unbound molecular clouds that could suppress star formation (e.g., Sorai et al., 2012; Nimori et al., 2013). On the other hand, NGC 3351 shows the highest values due to generally lower and higher , and the NGC 3351 inflows (data points in the bottom-right corner) are strong dynamical feature with optically thin CO emission (Teng et al., 2022) and thus do not match the assumption for dependence (Bolatto et al., 2013; Gong et al., 2020). We do not see a clear correlation in the center of NGC 3351, which shows a roughly constant that is lower than the positive trend formed by the other two galaxies. This lower could be explained by the increased turbulence and shear near the NGC 3351 inflows, making the clouds there super-virial.
In summary, we find a strong, positive dependence on after combining the modeling results of the central kpc of NGC 3351, NGC 3627, and NGC 4321. This correlation is in line with theoretical expectations for thermalized and optically thick clouds, and it can explain most of the variations found in the three galaxy centers. Additionally, an anti-correlation between and is clearly seen in NGC 3627 and 4321, suggesting as a secondary driver of variation after . The in NGC 3627 and 4321 also shows a positive but weaker correlation with , which suggests that the molecular clouds in those regions have similar (likely high) virial parameters.
5.2 Comparison to Measurements in Literature
To compare our results with previous measurements on kpc scales (Sandstrom et al., 2013; Israel, 2020), we calculate the intensity-weighted mean over the observed regions. Based on Equation 3, we compute the average and standard deviation of 2000 likelihood-weighted random draws of , , and from the full model grid for each pixel. The procedure is described in Teng et al. (2022, Section 5.1) in greater detail. Since the values in Sandstrom et al. (2013) were derived from CO 2–1 intensities assuming a constant of 0.7, we will directly compare the values to avoid uncertainties originating from . This means that in Equation 3 will be replaced with when we derive the intensity-weighted for comparison to the dust-based results.
The intensity-weighted mean is and over the central kpc of NGC 4321 and NGC 3627 included in our analysis. Using dust modeling and CO 2–1 observations, Sandstrom et al. (2013) derived and in the central 2.6 kpc and 1.7 kpc region of NGC 4321 and NGC 3627, respectively. For NGC 4321, our value is consistent with their dust-based estimate, as well as the carbon budget-based estimate of 0.96 by Israel (2020) towards the central region after applying our integrated mean in Table 2. We note that Israel (2020) also reported K with for the center of NGC 4321 using a two-component model. Over the central kpc region of NGC 3351, the mean of 0.75 is also consistent with the Sandstrom et al. (2013) estimate of (see Appendix B).
For NGC 3627, our derived mean of 0.62 is slightly lower than 0.8 from Sandstrom et al. (2013), while it is higher than 0.43 determined by Israel (2020) applying our integrated mean of 0.81 in Table 3. With assumptions on dust-to-gas ratios and applying our , a recent work by Jiao et al. (2021) also suggests , which overlaps with the solutions from this work and Sandstrom et al. (2013). One potential explanation for the discrepancy between Sandstrom et al. (2013) and our result is a calibration issue of the HERACLES CO 2–1 data used by Sandstrom et al. (2013). As shown in den Brok et al. (2021, Appendix C), the HERACLES data of NGC 3627 has been found to have significant calibration uncertainties with up to a factor of two lower intensity than the PHANGS–ALMA data we use. This implies that the solution determined by Sandstrom et al. (2013) could be overestimated using the HERACLES data with fainter CO emission.
Moreover, it is also possible that our modeling overestimates in NGC 3627 due to the underestimation of . Figure 10(b) shows that many regions in NGC 3627 have high that exceed few hundreds K, potentially due to the AGN in its nucleus. Since our modeled lines only include transitions up to =3–2, such line combination may not be sufficient to reveal temperatures above a few hundred K. We have also tested regions with K using the two-component model constructed by Teng et al. (2022), and still find 100 K for the dominant component. Additionally, we have checked the spectral line energy distribution (SLED) of CO in all three galaxy centers using Herschel SPIRE/FTS data at 40 resolution covering up to CO =9–8 (A. Crocker, private communication). We find that the SLED of NGC 3627 is peaked in higher- lines than the other two galaxy centers, which also supports the scenario of higher in the center of NGC 3627. Thus, our modeling could have underestimated in NGC 3627, and higher- CO lines may be needed to accurately constrain such high . If the center of NGC 3627 in fact has higher than what we derived, this could lead to overestimation of as long as does not deviate much from our modeling result (Papadopoulos et al., 2012; Bolatto et al., 2013). The estimate from Israel (2020) also has the issue of lacking high- CO lines, and the author reported K in the center of NGC 3627 which is even lower than our results and inconsistent with the bright emission seen in high- transitions.
We conclude that the overall in the central kpc of NGC 3627 is likely a factor of 5–10 lower than the Galactic , while the actual value is still uncertain as seen from the inconsistency among Sandstrom et al. (2013), Israel (2020), Jiao et al. (2021), and this work. High-resolution observations toward high- CO transitions will be essential to securely measure the environmental conditions and in this region. On the other hand, the values in the center of NGC 4321 match perfectly well among these studies using independent methods, which increases the reliability of the NGC 4321 results.
5.3 Observational Tracers for Variations
(a)
(b)
5.3.1 The Line Ratios
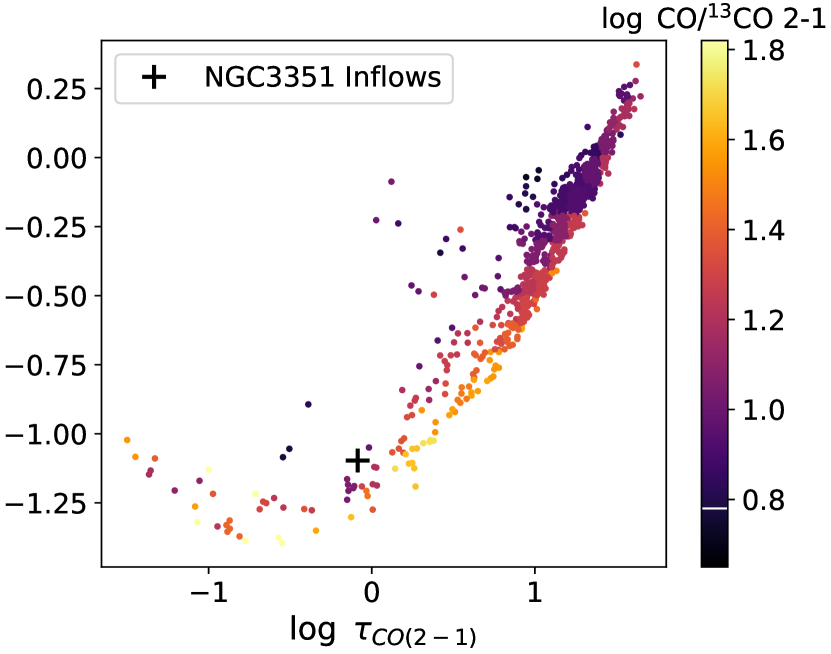
As shown in Figure 14, all three galaxy centers show a clear correlation between and . In Figure 14(b), the colors represent the median CO/13CO 2–1 ratios within each (two-dimensional) bin of and . The adopted bin size is 0.1 in both and dimensions, which is consistent with the bin size we adopted when deriving the PDFs and solutions for and . The median-filtered line ratios shown by the color gradient is a visualization choice to emphasize the overall trend of the line ratio with or . We find that the color-coded CO/13CO 2–1 ratios form a gradient across the parameter space when , suggesting an anti-correlation of the line ratio with or . It is also clear that the CO/13CO ratio in these galaxy centers is higher than the Galactic disk-like ratio of 6 (Aalto et al., 1995; Roman-Duval et al., 2016), which is consistent with the finding of elevated CO/13CO ratios in LIRGs or central starburst regions (Aalto et al., 1995, 2010; Sliwa et al., 2012, 2014, 2017).
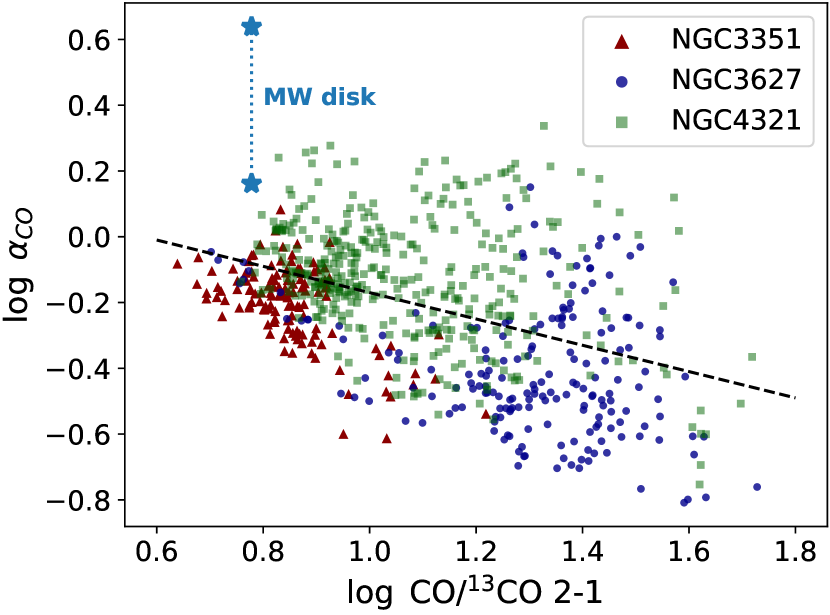
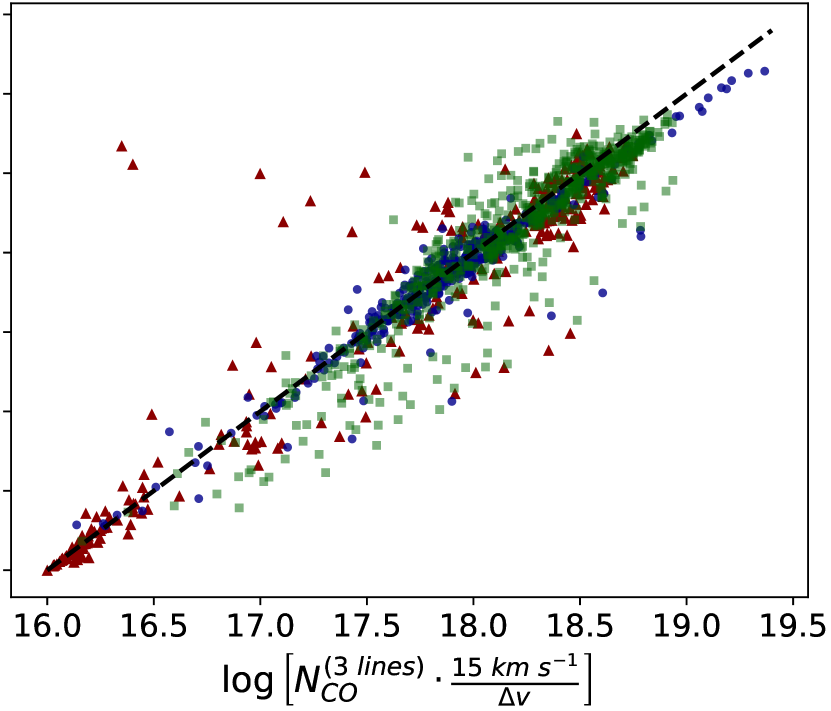
The inverse relation between and the CO/13CO 2–1 ratio is also clearly demonstrated by Figure 17(a). Here we only include optically thick regions with , where strongly depends on . With and across our measurements, we obtain 13CO optical depth that is solidly in the optically thin regime. Therefore, the correlations suggested by Figures 14(b) and 17(a) agree with the interpretation that the observed CO/13CO 2–1 ratio is generally tracing variations inversely in the three galaxy centers. This is because the decrease of can lead to more escaped CO emission and thus increasing the CO/13CO ratio when CO is optically thick and 13CO is optically thin. Since there is also a strong correlation between and , this implies that the CO/13CO ratio may be used as an observational tracer for variation. As indicated by the dashed line on Figure 17(a), we conduct a power law fit to the data points and find
| (5) |
where is the observed CO/13CO 2–1 line ratio, and both the fitted slope and intercept have an uncertainty of . Similar to Equation 4, this fitted relation is only appropriate for starburst-like regions with a higher CO abundance , unless the predicted value is further scaled by a factor of . This scaling of can explain the factor of 3–4 discrepancy between the fit (with ) and the typical Galactic disk value (with ) as shown in Figure 17(a). There is a dispersion of dex between the modeled and fitting-predicted , which likely originates from the uncertainty in variation as well as the exclusion of temperature effects.
The CO/13CO ratio should also vary with the molecular abundance , which is one of our directly modeled parameters. As presented in Section 4.2, most regions show 1DMax solutions consistent with the best-fit solutions at 80–100 (e.g., compare Figure 7(a) with Figure 8). Even in several regions with 1DMax , their median also show higher 80–100 that is similar to their best-fit solutions. Thus, even though the PDFs are generally not as well constrained as other parameters, it is likely that most regions have 80–100 based on the match between the 1DMax/median and best-fit solutions. Moreover, the abundances are roughly constant and well-constrained at 6–8 over both galaxies, which implies that significant spatial variations in is unlikely from a nucleosynthesis perspective as enrichment of both 12C and 18O would be expected from massive stars. Therefore, may not be the main driver of the CO/13CO line ratio variations. The roughly constant and varying CO optical depths in these galaxy centers can explain why the CO/13CO 2–1 line ratio is overall reflecting variations in Figures 14(b) and 17(a).
In Teng et al. (2022), the bar-driven inflows of NGC 3351 shows enhanced CO/13CO 2–1 ratio with nearly optically thin CO emission, which also suggests the inverse relation between and CO/13CO line ratio. Notably, their stacking result for the inflow regions revealed well-constrained PDFs showing 1DMax and median 30. Since the value is similar to that found in the central regions of NGC 3351, it provided evidence for being the main driver of the CO/13CO line ratio. Furthermore, Cormier et al. (2018) also reported anti-correlations of with CO/13CO 1–0 ratio across the disks of several galaxies, using dust-based (from Sandstrom et al. 2013) with single-dish CO observations at 1.5 kpc resolutions. Interestingly, such an anti-correlation was only seen in the three galaxies hosting starburst-dominated nuclei in their sample, but not in the other five normal star-forming galaxies. This can be explained by the increased optical depth variation in starburst environments. Similarly, barred galaxy centers tend to have variable gas dynamics and conditions due to higher excitation, turbulence, shear, and gas concentration, which altogether can lead to even more significant variations. Within the three barred galaxy centers presented in this work, we find that is positively correlated with , and that the CO/13CO 2–1 line ratio mainly traces the variation. These results suggest that the CO/13CO ratio can be a useful observational tracer for variation, particularly in galaxy centers where optical depth is generally high and spans a wide dynamic range.
5.3.2 Spectral Line Widths and Peak Temperatures
(a)
(b)
With spectroscopic observations, the line width () and brightness temperature at the line peak () provide two direct observables that may contain information about gas properties. For optically thick lines like CO, can be a probe of the excitation temperature () if the beam-filling factor is known or fixed. On the other hand, line width represents the one-dimensional velocity dispersion, which is indicative of turbulent motions. Since the line center optical depth is a function of surface density and velocity dispersion, variations in line widths may also provide hints for optical depth changes.
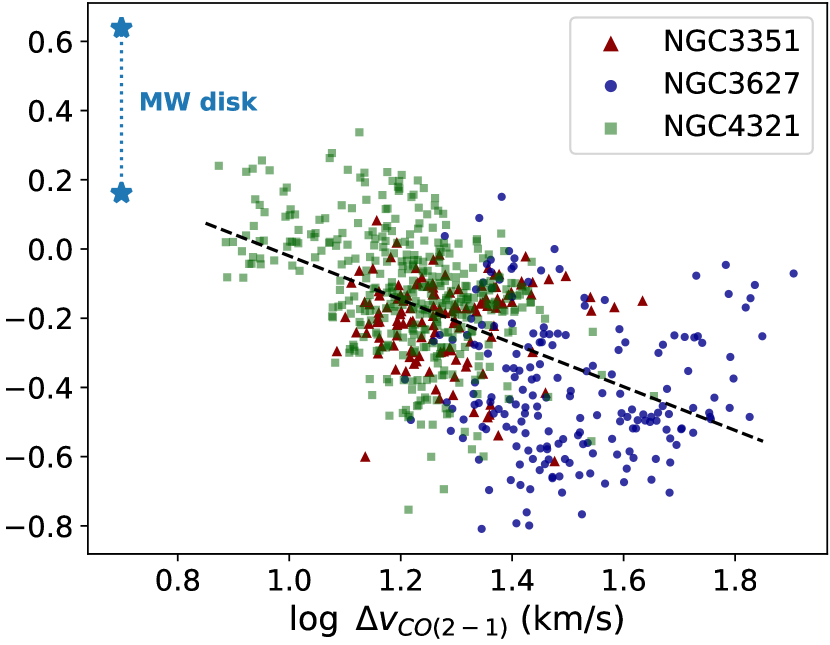
As we have already shown the strong dependence on , it is likely that the observed can also trace the variations. Figure 17(b) presents a scatter plot of the modeled versus the observed CO 2–1 line width for regions with . It is clear that decreases with , consistent with the expectation of increasing with . The power law fit is presented by the dashed line, indicating
| (6) |
where the uncertainty is and for the fitted slope and intercept, respectively. The dispersion with respect to this prediction is dex, which is reasonable as the surface density term in the optical depth and the temperature are also included as parameters in our modeled . The stars in Figure 17(b) indicate the Galactic values at , which is typical for Galactic disk clouds with size of 100 pc (e.g., Heyer & Dame, 2015). We emphasize that the line-of-sight is what relates directly to , and thus there is no need to correct for inclination effects among different galaxies.
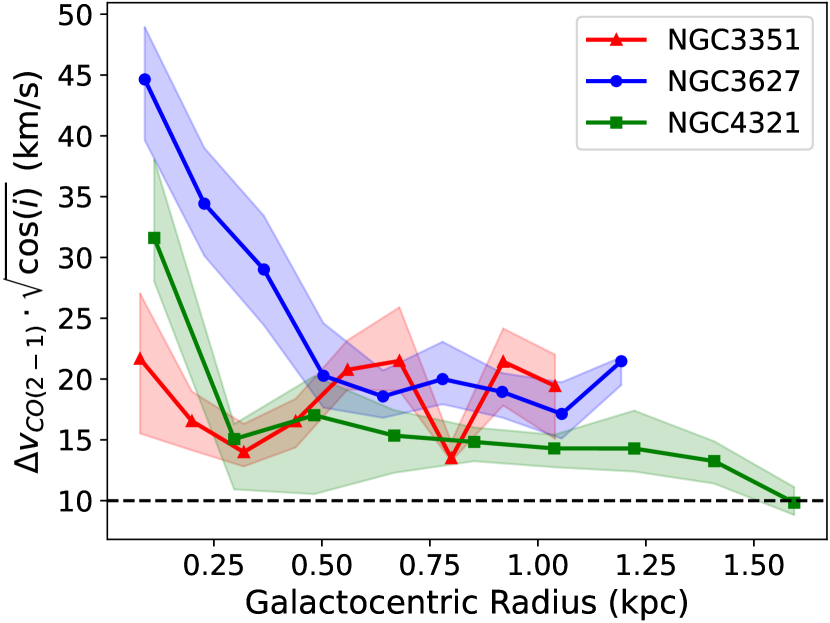
Figure 18 shows the radial profiles of the observed CO 2–1 line width and in NGC 3351, NGC 3627, and NGC 4321. Here we multiply the observed line width by a factor to eliminate the line width dependency on galaxy inclination, following the empirical correction found by Sun et al. (2022) based on data with similar resolution of pc. This correction is only applied here to bring out the line width effects from small-scale turbulence or large-scale dynamical processes, ensuring a fair comparison among different galaxies. With the inclination correction, in the three galaxies becomes roughly aligned at radii beyond 500 pc. We find a significant increase in line width toward the nuclei ( pc) of NGC 3627 and NGC 4321, which is consistent with increased velocity dispersion being the cause of lower optical depths seen in Figure 13(b). The increase of line width in the inflow regions of NGC 3351 ( pc) is also notable, reaching comparable values to its central nucleus and being higher than in the other two galaxies. Contrary to most situations where dominates the integrated intensity variation (e.g., Egusa et al., 2022), is consistently low in the NGC 3351 inflows, and thus the enhanced velocity dispersion plays a more important role in the observed CO emission of this region.
Interestingly, all the mentioned regions with enhanced velocity dispersion are places where abrupt changes in are found (see Figure 13(a)). Furthermore, Sun et al. (2020b) found that molecular gas in barred galaxy centers tends to have higher velocity dispersion than in galaxy disks or non-barred galaxy centers, and they can be distinguished by an approximate boundary of km/s (without inclination correction). As shown in Figure 18(a), almost all pixels in the three galaxy centers have km/s even after inclination correction. The average line width in our galaxy centers (see Tables 2 and 3) are also 3–5 times higher than that of the galaxy disk sample in Sun et al. (2020b). Such higher velocity dispersion can lead to lower optical depths in galaxy centers, and may explain the overall lower-than-disk across the whole central kpc regions (Sandstrom et al., 2013). Notably, this scenario of higher velocity dispersion lowering in galaxy centers is compatible with the kpc-scale dependence on stellar mass surface density found by Bolatto et al. (2013) and I-D. Chiang et al. (in preparation). This is because the stellar mass surface density can track additional external pressure from the ISM that sets the high velocity dispersion in galaxy centers. Therefore, in addition to the CO/13CO line ratio, the observed line width may also be useful in predicting changes due to its relation with optical depth.
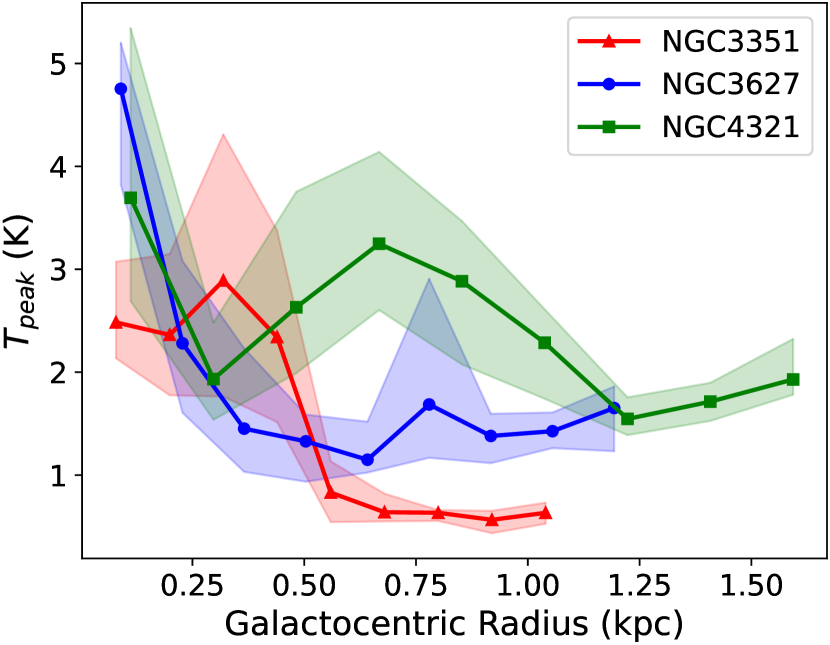
Another potential observational tracer for is , which can be indicative of the excitation temperature as well as the total integrated intensity when CO is optically thick. However, we do not find the observed tracking the modeled , even though is found to anti-correlate with (see Section 5.1). This means that is not a good indicator of in our case, which can be due to deviation from LTE in most regions as we generally find . As shown in Figure 18(b), the radial variation of the observed differs from that of in Figure 13(a). The relation between and the observed is presented in Figure 19(b) in Section 5.4.
In this work, we find that the sub-kpc scale variation in galaxy centers is dominated by variations, which can be reflected by the observed CO/13CO line ratio as well as the CO line width. While we also find a secondary effect of on , the observed do not trace the variation well given the non-LTE conditions as well as density or optical depth variations in barred galaxy centers. In Section 5.4, we will show that simulations also predict only a mild dependence on , and that dependence can be washed out if observed with a 100 pc beam size.
(a)

(b)
(c)
5.4 Comparison with Existing Prescriptions
Recent simulation studies have developed predictions for in terms of metallicity, CO line ratios, and/or CO integrated intensities (Narayanan et al., 2012; Accurso et al., 2017a, b; Gong et al., 2020; Hu et al., 2022). Such predictions have the potential to greatly improve the assessment of molecular gas content in galaxies, and therefore testing them is critical. However, most simulations focus on low-metallicity or Galactic disk-like environments, which do not capture the dense, turbulent conditions or gas inflows that are common in galaxy centers. To test if the current predictions can be applied to star-forming galaxy centers, we compare our results with the established prescriptions and discuss the consistency/discrepancy.
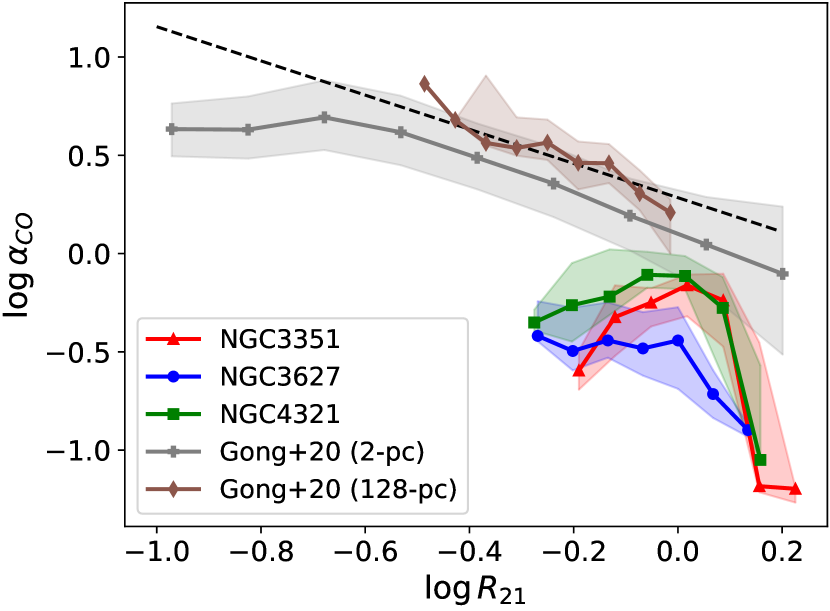
Based on magneto-hydrodynamic simulations of the ISM on kpc-sized chunks of galactic disks down to 2 pc resolution, Gong et al. (2020) proposed three different prescriptions as a function of metallicity, beam size, as well as CO line related properties: , , and CO integrated intensity , respectively. The prescriptions are cautioned to be only applicable to disk-like environment with K km s-1, which is the maximum intensity of their simulated data at 2 pc resolution. Their native 2 pc resolution data also span a range of and K. Figure 19 compares our modeled with the Gong et al. (2020) simulated data (brown curves) and prescriptions (black dashed lines) at solar metallicity and a 100 pc beam size. We also show their simulated data at 2 pc resolution (gray curves), which seems to extend to denser/hotter regions that are more consistent with the main sample of our observations. However, we note that their 2-pc data should be resolving individual molecular clouds, while our results at 100 pc resolutions are sampling beam-averaged, unresolved gas.
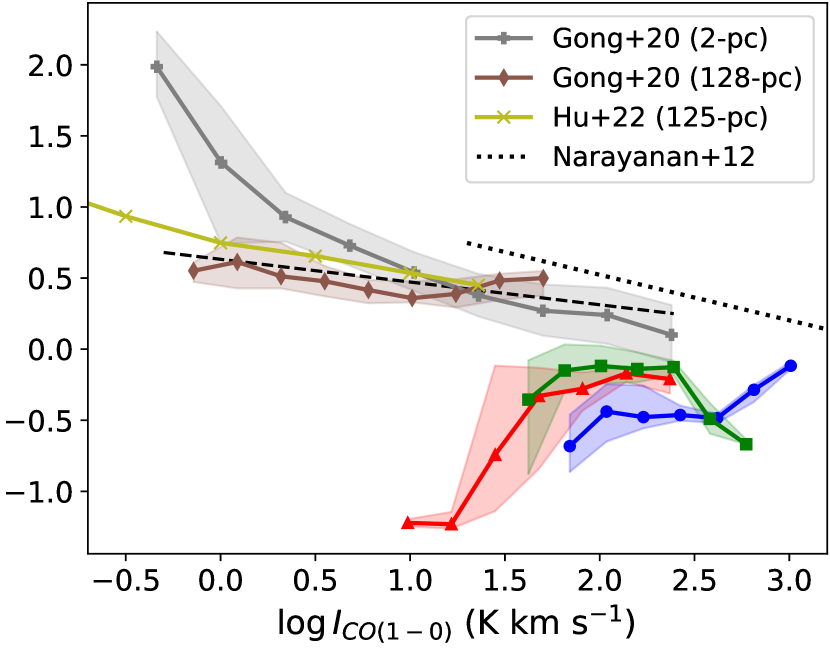
Overall, it is clear that our observational data have higher , , and than the simulated data at 100 pc scales, and that our results are systematically lower than the extrapolated predictions. The -dependent prediction has the most potential to match our data within a factor of three discrepancy, while the - and -dependent predictions show deviations with a factor of 3–10. This is in line with the suggestion by Gong et al. (2020) to adopt the prescription for larger ( pc) beam sizes, as can better reflect CO excitation and suffers less from beam dilution. As shown in Figure 19, the predicted correlations with and are fairly weak, likely due to significant beam-averaging over temperature and density at 100 pc resolutions.
In addition, we find that the 100 pc simulated data have some overlap with all three galaxies in the dynamic range of but almost no overlap in that of , implying that the line width is generally broader in our case (see also Section 5.3.2). This can be a vital reason for the discrepancy on between the simulations and observations, as the enhanced velocity dispersion due to strong dynamical effects in these galaxy centers cannot be captured by such simulations, where gas inflows and central starbursts were not taken into account. Another possible reason for the difference with simulations is our assumption of constant CO abundance, . This could be important in some regions with low and , where the optical depth is low and the photodissociation may lower , leading to possible underestimation of in our modeling. However, the difference in cannot explain the overall lower seen in the majority of our observed data with cm-3, since most of the simulated data from Gong et al. (2020) in this regime reaches their maximum of , which is similar to our assumption.
It is important to note that the simulation by Gong et al. (2020) represents a different regime of physical conditions than our measurements, as nearly half of the simulated data are optically thin and sub-thermally excited. However, they have also explored dependence in the optically thick and thermally excited regime, which is closer to the conditions of our data and may explain the correlation we observe. Compared to Gong et al. (2020), our three galaxy centers lie beyond the “high-density” regime ( cm-3) where they found saturated CO emission with growing due to increased optical depths. This saturated level corresponds to cm-2 or cm-2 (assuming consistent of ), the value of which agrees with our solutions. In the sub-thermal regime where CO intensity is not yet saturated, Gong et al. (2020) reported decreasing with , which can be explained by increasing excitation temperature and CO abundance. Meanwhile, they also found that starts to increase with when entering the thermal regime where CO becomes fully optically thick. This “turnover” trend of suggests that the impact from optical depth effects can take over in dense, optically thick regions like galaxy centers, which potentially explains why optical depth effects dominate the trend in our results (see Section 5.1 and 5.3.1).
In addition to Gong et al. (2020), other hydrodynamic simulations also suggested as a multivariate function of metallicity, CO integrated intensity, and/or beam size (Narayanan et al., 2012; Hu et al., 2022). As shown in Figure 19(c), the prediction by Narayanan et al. (2012) is within 0.2 dex higher than that by Gong et al. (2020) at K km s-1 and solar metallicity. We also overplot the simulated data at 125-pc resolution from a recent study by Hu et al. (2022), which predicts a similar trend to Gong et al. (2020) and reaches a maximum of . We find our modeled generally higher than the predicted relations between CO optical depth and column density at solar metallicity in Hu et al. (2022).
By assembling previous observations at kpc scales including nearby disks (Sandstrom et al., 2013) and (U)LIRGs (Downes & Solomon, 1998; Papadopoulos et al., 2012), Bolatto et al. (2013) also suggested a prescription of as a function of metallicity (, normalized to the solar value), characteristic giant molecular cloud surface density (), and the total (gas + star) surface density ():
| (7) |
, where if pc-2 or otherwise. To compare our results with this kpc-based prescription, we calculate the stellar mass surface densities using the PHANGS–MUSE data at a native resolution of (Emsellem et al., 2022). We weight the with our observed and then average over the entire region covered in our analysis. Similarly, we derive the average molecular gas mass surface density () by multiplying the maps with our modeled and then calculating the intensity-weighted mean across the maps.
The resulting () for the centers of NGC 3351, 3627, and 4321 are approximately 5000 (63), 4500 (115), and 2100 (94) . It is clear that is dominated by in all three galaxy centers, and the derived is similar to the adopted in Bolatto et al. (2013). Finally, we correct the derived surface densities with their galaxy inclinations by a cosine factor and then substitute into Equation 7, assuming at solar metallicity 555For the Bolatto et al. (2013) prescription, the solar metallicity condition is suggested to be paired with a fixed GMC surface density of 100 . This is because the exponential term (see Equation 7) can easily lead to unrealistic values even with small variations in the adopted GMC surface density (see also Sun et al., 2023). We therefore use the suggested value of 100 here to avoid such issues, and we also show that the intensity-weighted at kpc scales for our galaxy centers roughly agrees with that value..
With the corrected surface density, Equation 7 predicts of -0.22, -0.20, and -0.04 over the centers of NGC 3351, 3627, and 4321, respectively. Our modeled distributions show of , , and in the central of these galaxies. The intensity-weighted mean derived in Section 5.2 is equivalent to of -0.12, -0.30, and -0.07 if we convert the CO 2–1 intensity back to CO 1–0 via the integrated mean (see Tables 2, 3, and Table 2 of Teng et al., 2022). Both results overlap well with the predicted values from Equation 7, assuming a reasonable 0.2 dex uncertainty of the prediction. Notably, the range of our (dominated by ) is also similar to the (U)LIRG samples used in Bolatto et al. (2013) to develop the prescription.
We conclude that on kpc scales, our results are compatible with the Bolatto et al. (2013) prescription. On sub-kpc scales, the existing simulation-based prescriptions may overestimate when being applied to galaxy centers with higher surface density, CO intensity, and velocity dispersion. Future simulations capturing gas inflows and local turbulence will be needed to develop a better prescription appropriate for galaxy centers or other extreme environments.
5.5 Multi-line Constraints in the Modeling
Quantities determined by 4 lines:
CO 1–0, CO 2–1, 13CO 2–1, 13CO 3–2
Quantities determined by 3 lines:
CO 2–1, 13CO 2–1, 13CO 3–2
Quantities determined by 3 lines:
CO 1–0, CO 2–1, 13CO 2–1
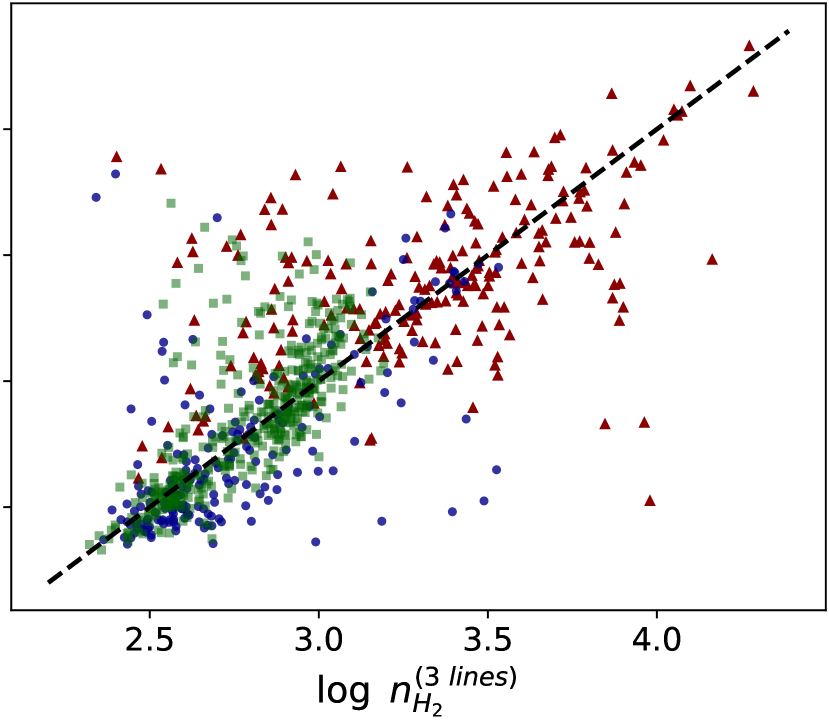
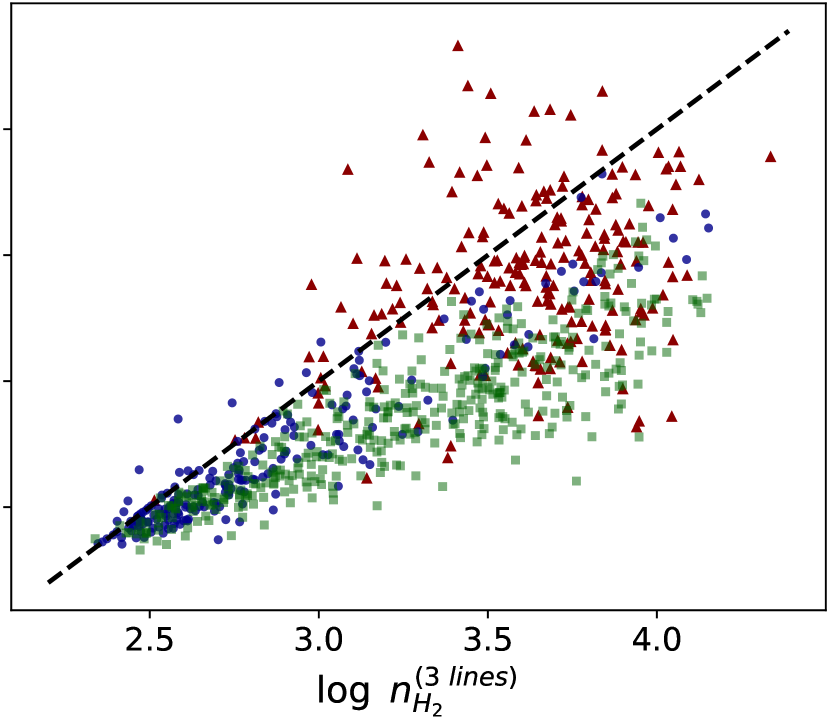
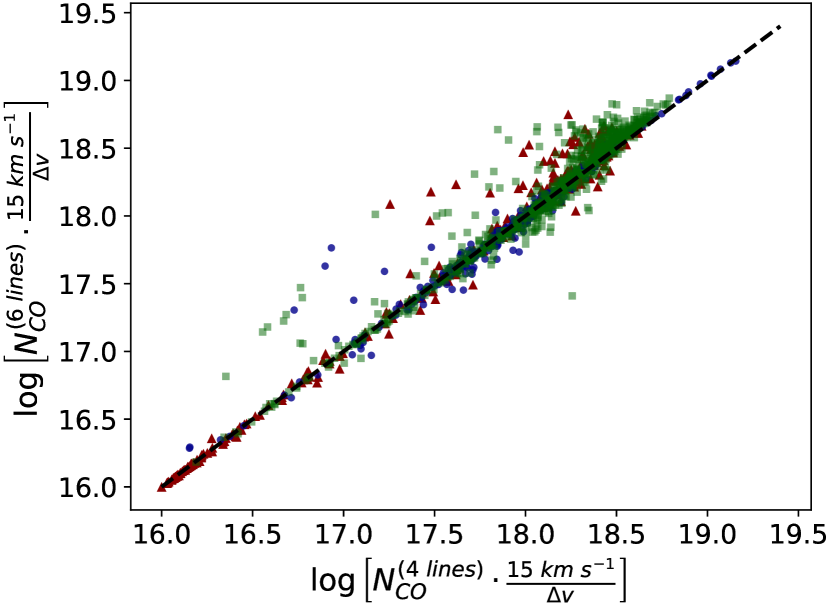
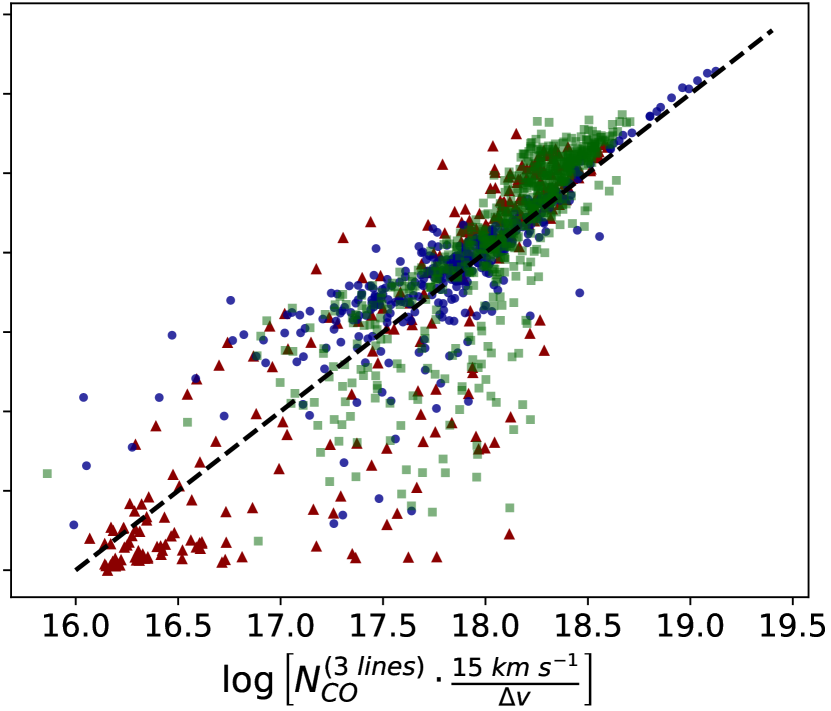
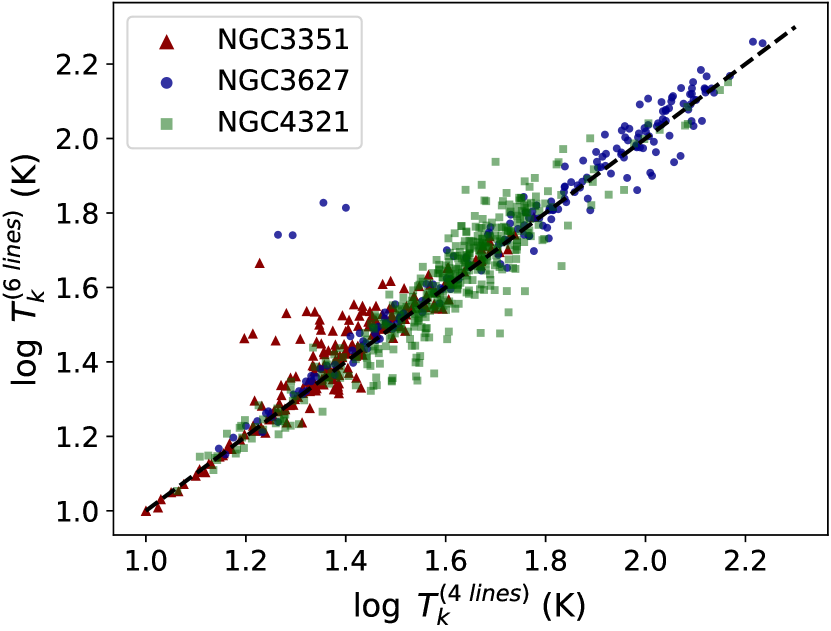
Our multi-line modeling jointly analyzes six low- transitions of CO, 13CO, and C18O. In this subsection, we discuss how modeling solutions would change if different subsets of lines were used. We will compare our solutions from the six-line modeling (Section 4.2) to those determined from various combinations of lines, and identify the most critical measurements that enable good constraints on the parameters. In addition to the modeling of NGC 3627 and NGC 4321, we will also include the modeling results of NGC 3351 from Teng et al. (2022) as the observed lines and modeling approach are the same.
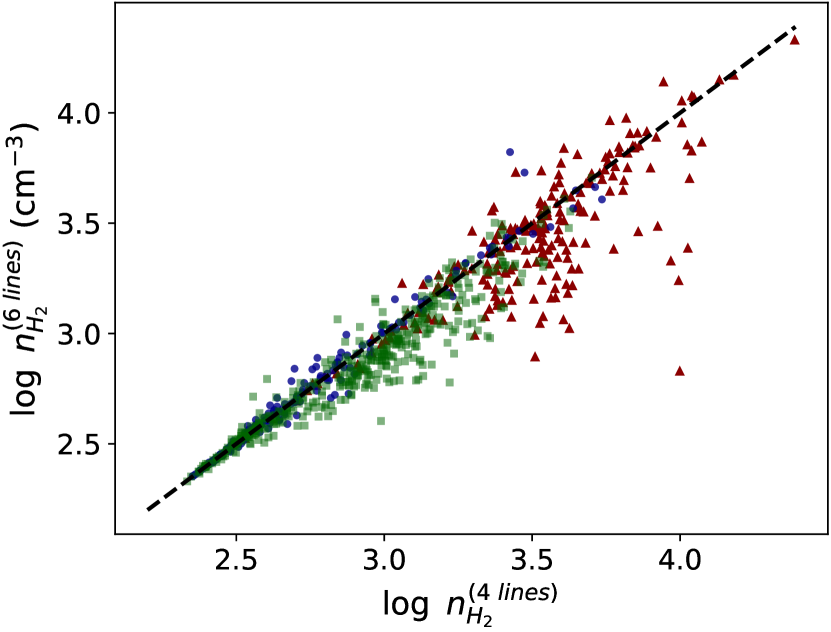
From Figure 7, we find that the constraints given by the 13CO 2–1 and C18O 2–1 are almost identical, and the same applies to 13CO 3–2 and C18O 3–2 (see also Figure 26 in the Appendix). This means that the best-fit solutions would remain the same even if we remove the constraints from both C18O lines. Teng et al. (2022) also reported that the C18O line constraints are not critical to the results for the inflow regions in NGC 3351, though they did not further examine other regions. To test how the removal of C18O would affect the modeling solutions, we present in the left column of Figure 20 the pixel-by-pixel solutions of , , and modeled with and without the two C18O lines on the y-axes and x-axes, respectively. It is clear that solutions obtained from both scenarios are consistent with only a dex scatter for all quantities. We note that C18O emission is weak in the arms of NGC 3627, but it is well detected in NGC 4321 and the central kpc of NGC 3351, so the low S/N of the C18O measurements is not the main reason for such consistency. We conclude that the combination of CO 1–0, CO 2–1, 13CO 2–1, and 13CO 3–2 can already provide strong constraints on the gas properties, while C18O 2–1 and 3–2 tend to give constraints similar to 13CO and thus do not provide much additional information.
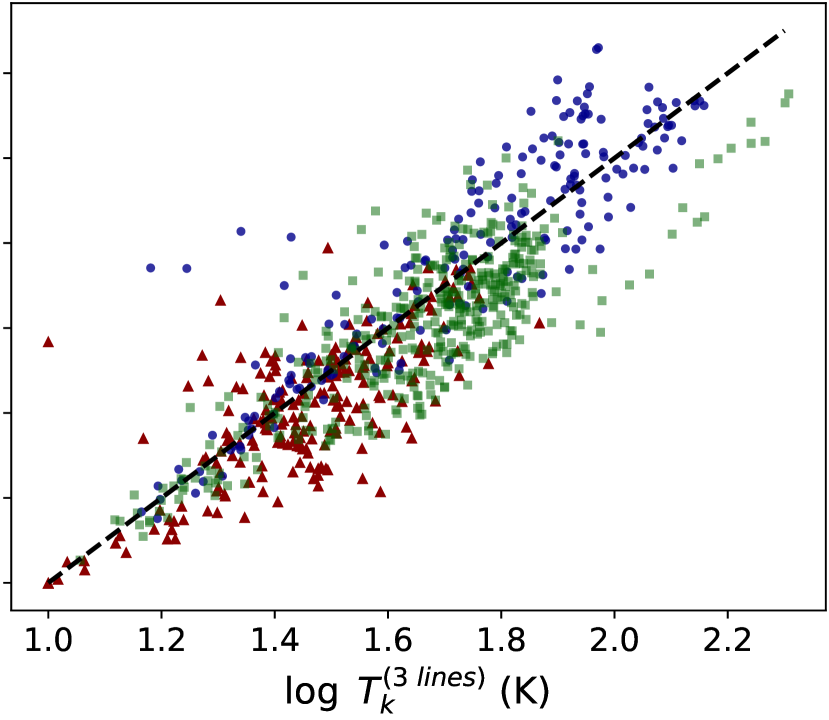
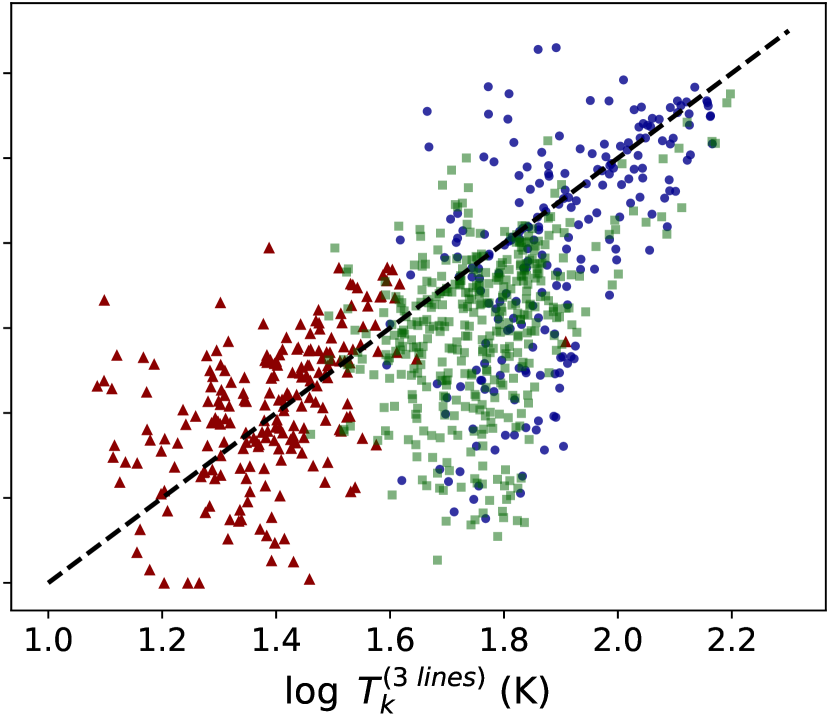
The middle and right columns of Figure 20 compare the six-line modeling solutions with the solutions determined by only three of the lines. In the middle column panels, we present the case with CO 2–1, 13CO 2–1, and 13CO 3–2, and the rightmost panels show the case with CO 1–0, CO 2–1, and 13CO 2–1. We include CO 2–1 and 13CO 2–1 in both cases because the detection of these lines were used to define our analyzed regions (i.e., CO 2–1 flux recovery and 13CO 2–1 S/N ). We find that the inclusion of 13CO 3–2 (middle panels) is critical to obtaining accurate solutions for and , as removing that line leads to much larger scatter and/or bias in the reconstructed and even with the inclusion of CO 1–0 (right panels). This is likely because 13CO 3–2 is the only high- transition in the set of lines, and thus it provides critical constraints on density and temperature in addition to the lower- 1–0 or 2–1 transitions. On the other hand, including both CO 1–0 and 2–1 can significantly reduce the scatter in since the 12CO emission is highly dependent on optical depth (see bottom panels of Figure 20).
In summary, CO 2–1, 13CO 2–1, and 13CO 3–2 can be an efficient combination to measure gas temperature and volume density via multi-line modeling, while the addition of CO 1–0 would be important to obtain more reliable and precise estimates for optical depth. Since 13CO has a slightly higher effective critical density and much lower optical depth than CO, the inclusion of a 13CO line ratio can better constrain regions with higher volume/surface density or optical depth such as galaxy centers. Notably, the C18O lines give degenerate but lower quality information to the 13CO lines. Since it is observationally expensive to securely detect the faint C18O lines, this result may help reduce observing time for similar studies in the future or over larger area. However, we emphasize that the conclusion is simply drawn from the modeling results toward the central kpc of NGC 3351, NGC 3627, and NGC 4321, which are all barred centers with starburst or AGN signatures. It is likely that different transitions or species are needed to constrain regions such as galaxy disks or unbarred galaxy centers.
6 Conclusions
We present ALMA observations of six low- CO, 13CO, and C18O lines toward the inner 2–3 kpc regions of NGC 3627 and NGC 4321 at pc resolution. Using non-LTE radiative transfer modeling with Bayesian likelihood analysis, we constrain molecular gas properties including density, temperature, and CO isotopologue abundances on a pixel-by-pixel basis. With the modeling, we further derive and correlate with parameters such as optical depth, temperature, velocity dispersion, and line ratios to discuss the physical drivers and observational tracers of variations in barred galaxy centers. The results on NGC 3351 from Teng et al. (2022) are incorporated in our discussion for a more comprehensive view. We also compare the results with existing estimates and predictions. Our main findings and conclusions are as follows:
-
1.
The moment 0 images of all six lines reveal a bright nucleus with size of 300 pc in diameter in both NGC 3627 and NGC 4321. The nuclei are connected with inner spiral arms or bar lanes, which are observed in all the lines for NGC 4321 but not securely detected in C18O for NGC 3627. The temperature sensitive line ratios are significantly higher in both nuclei with an integrated mean of 0.9 for NGC 3627 and 1.2 for NGC 4321, suggesting high excitation and thermalized gas. The integrated mean over the entire central region of NGC 3627 and 4321 is 0.8 and 0.9, respectively, which are consistent with previous observations on kpc scales.
-
2.
Our modeling results in well-constrained solutions for most physical parameters. Both galaxies show increasing kinetic temperature () and H2 volume density () trends toward the centers, with both nuclei reaching K and . We find that the 13CO/C18O abundance ratio () varies in the range 6–8, which is similar to the Galactic Center values. The 12CO/13CO abundance ratio () ranges from 80–100 for most regions, despite being less constrained than other parameters.
-
3.
Assuming the CO/H2 abundance ratio , all the pixels in both galaxy centers show lower CO conversion factor () than the standard Galactic value by a factor of 4 to 15. We find that most regions have ) , and it generally decreases with galactocentric radius till a radius of 1.5 kpc. This decreasing trend with similar values was also seen within the inner 1 kpc nuclear ring of NGC 3351 (Teng et al., 2022).
-
4.
We derive intensity-weighted mean of and over the central 2 kpc regions for NGC 3627 and NGC 4321, respectively. The result for NGC 4321 matches well with previous dust-based and carbon budget-based studies at lower resolutions (Sandstrom et al., 2013; Israel, 2020). However, our value for NGC 3627 is in between those studies with a 0.2 dex discrepancy. The disagreement may be related to calibration issues for NGC 3627 in previous CO mapping. Another possibility may be that the high temperatures in NGC 3627 are not well measured in our observations with lines only up to =3–2 .
-
5.
Based on the modeling results on three barred galaxy centers (including NGC 3351), we find a strong, positive dependence with CO optical depth () that is responsible for 80% of the changes in . The rest of the variation is driven by , which varies inversely with and can explain the variation in local regions where the and trends do not match. This suggests that emissivity-related terms are critical in driving in barred galaxy centers, and that optical depth is likely a more dominant driver of than gas temperature in this regime.
-
6.
The observed 12CO/13CO 2–1 ratio and line width generally trace the variation inversely in all three galaxy centers. With the tight correlation seen in and , this indicates that both the line ratio and line width can be good observational tracers for predicting variations in galaxy centers, where optical depth effects are dominant. We find the velocity dispersion in the centers of the barred galaxies studied here is higher than the typical values in galaxy disks or non-barred centers by a factor of 3–5, which may explain the overall lower-than-Galactic disk .
-
7.
We have tested current prescriptions based on observations and simulations. The Bolatto et al. (2013) prescription matches our average values across the three galaxy centers, given the high total surface density of gas and stars. On the other hand, current simulation-based prescriptions do not probe similar physical conditions to our galaxy centers, and their extrapolation into this regime tends to overpredict . Future simulations that capture gas inflows and local turbulence have the potential to provide better predictions for more extreme environments such as in galaxy centers or (U)LIRGs.
-
8.
We also test our multi-line modeling by varying input combinations of observed molecular lines and comparing the solutions with those from modeling all six lines (i.e., CO 1–0 and 2–1, 13CO 2–1 and 3–2, and C18O 2–1 and 3–2). Combining the results of three galaxy centers, we find that CO 2–1, 13CO 2–1, and 13CO 3–2 are the most essential constraints that lead to the six-line solutions, while CO 1–0 also plays a significant role in constraining the CO column density per line width (). The addition of both C18O lines is not crucial as they often duplicate the constraints provided by the 13CO lines. However, the well-determined abundances derived from the C18O lines can be useful information in particular when the solutions are uncertain.
In general, our results suggest that CO optical depth is the dominant driver for variations in the central kpc of barred galaxy centers, which can cover a compact nucleus and its surrounding bar lanes or inner spiral arms. To the second order, the increase/decrease of gas temperature in local regions can further lower/raise the values. The lower-than-Galactic disk in these barred centers can be explained by the overall enhanced velocity dispersion that lowers the opacity. As we find the CO/13CO 2–1 ratio and CO line width mainly reflecting the changes of CO optical depth, these observables may be useful in predicting variation in other galaxy centers or similar environments.
Appendix A Effects of Multiple Velocity Components
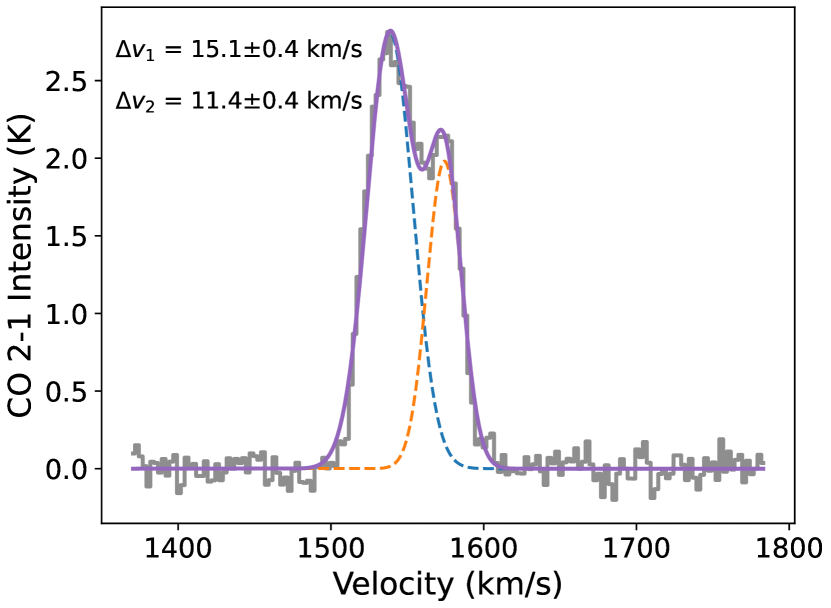
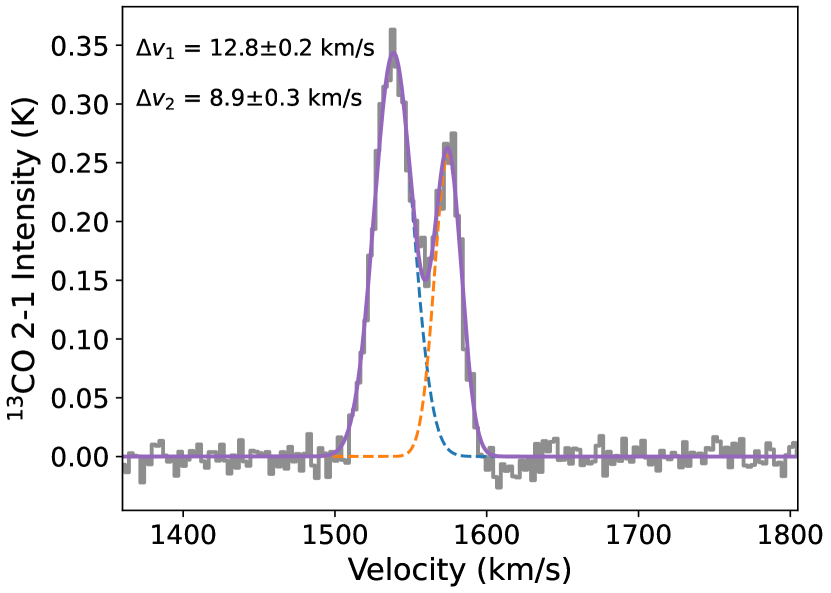
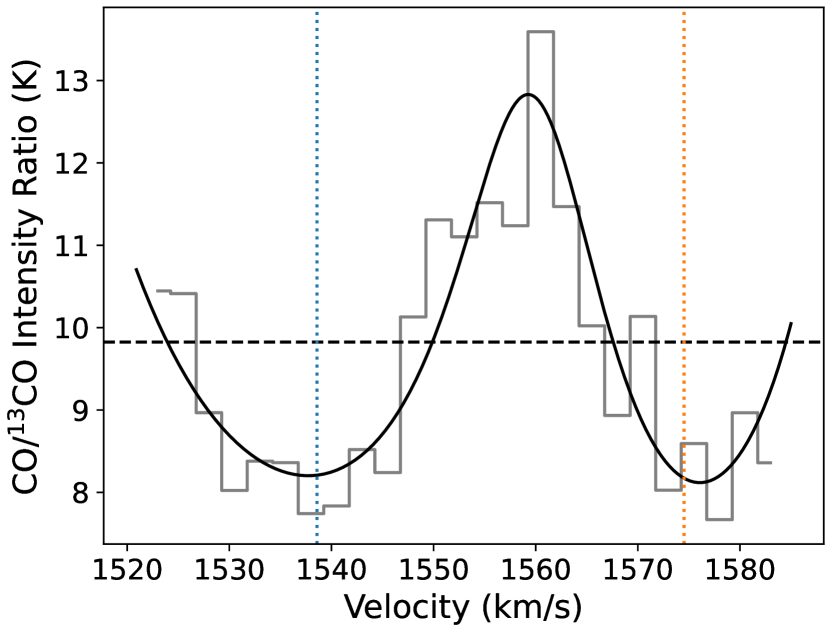

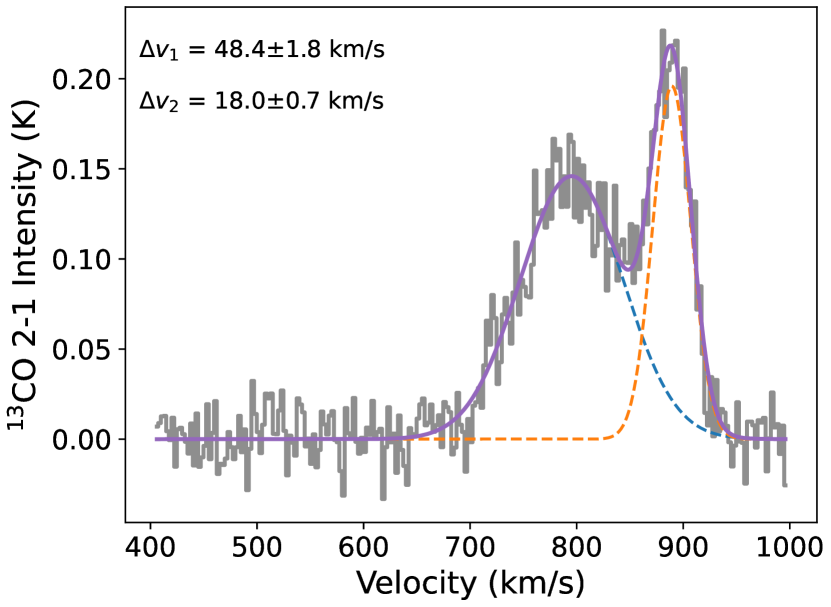
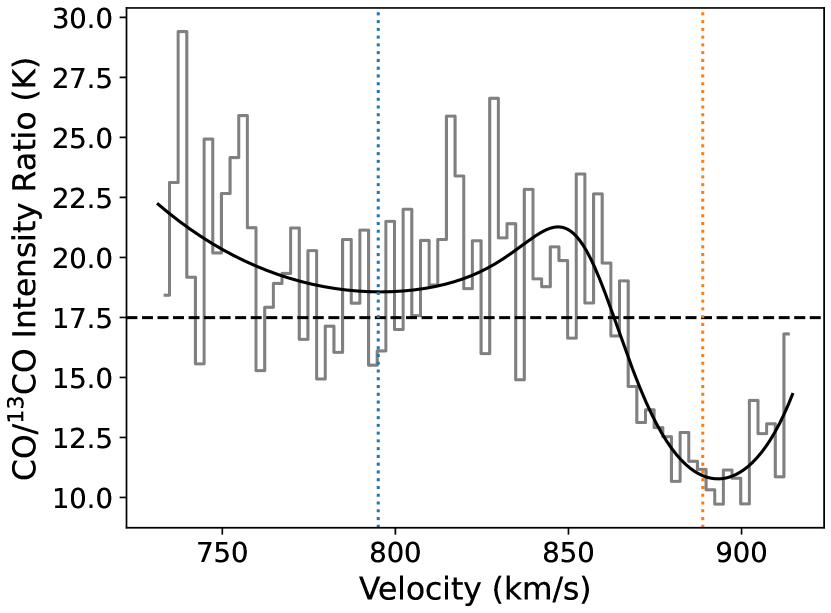
While our modeling and analysis assume one-component gas structure along each sightline, it is likely that a few regions have multi-component gas along the same sightlines. To investigate whether there is multi-component gas present, we check each individual spectrum in the cube.
By inspecting the spectra of all the pixels included in our analysis, we find that 8% (28%) of sightlines in NGC 4321 (NGC 3627) shows double-peaked line profiles. The higher fraction of multi-component sightlines in NGC 3627 may be partially due to the higher inclination of NGC 3627 compared to NGC 4321, and it is also consistent with previous studies which identified more overlapping giant molecular clouds/associations in the center of NGC 3627 than in NGC 4321 (Pan & Kuno, 2017; Rosolowsky et al., 2021). In Figure 21, we present an example of double-peaked spectra in CO 2–1 and 13CO 2–1 and show how their intensity ratio varies with velocity. The lower/upper limit of the velocity range in the right panels of Figure 21 corresponds to the FWHM line width of the lower/higher velocity component.
For NGC 4321, multi-component sightlines are mostly found around the middle along both inner arms at similar declinations to the nucleus. As shown by the top-right panel of Figure 21, we find that the double-peaked spectra in NGC 4321 generally have consistent CO/13CO ratios in both components, and the ratio is also similar to the integrated line ratio observed from the moment 0 map. In this case, the emissivity properties of both components would agree with what we derived using the single-component model, even if there were separate components along the sightline.
On the other hand, double/multi-peaked line profiles are scattered in both the inner and outer arms of NGC 3627, and the CO/13CO ratios can vary between components along the same sightlines. The bottom row of Figure 21 presents an extreme case found in NGC 3627 where the two spectral peaks clearly show opposite trends in their relative intensities. We find that the CO/13CO ratio in this case can differ by almost a factor of two between both components, and the integrated line ratio only agrees with the dominant component, which has a broader line width. This implies that the optical depth and values derived from our one-component modeling could be biased toward one of the components in such regions, and the observed line width of that component would also be overestimated (e.g., 50 km s-1 instead of 67 km s-1 for the showcased pixel in NGC 3627).
With the extreme case in NGC 3627, we have tested how the results would change by modeling the two components separately using the integrated intensity per Gaussian component for all six lines. We find that the component with a broader line width (which dominates the integrated intensity) has similar gas conditions ( dex difference in all the modeled parameters) and the same as what we obtained with the one-component modeling. On the contrary, the other component shows a different gas condition with higher temperature and lower density, optical depth, and abundance ratio, which altogether leads to the lower CO/13CO line ratio seen in the bottom-right panel of Figure 21. We note that the relations in Figure 19 and Equations 5 and 6 would remain the same even if the difference in CO/13CO line ratio (a factor of two at most) solely reflects optical depth changes, as the scatter in those correlations are larger than a factor of two. In addition, the scatter of the line width correlation could even be reduced, since many of the high points (from NGC 3627) seen in Figure 19(b) were overestimated due to the one-component assumption.
To summarize, our one-component assumption throughout this work should only impact our parameter estimation in a minority of regions. We find that the center of NGC 4321 is dominated by single velocity components, and the impact on radiative transfer calculation is likely small even in the few sightlines with evidence of multiple velocity components. For the center of NGC 3627, the majority of sightlines also show single-component spectra, while our one-component modeling could be biased toward one of the components in some multi-component sightlines. A more comprehensive modeling that covers different components along the same sightline would require a careful channel-by-channel analysis across all the regions. For NGC 3627, this can be done in future works with the support of SCOUSE (Henshaw et al., 2016) and existing GMC catalogues (e.g., Rosolowsky et al., 2021).
Appendix B Updates of the NGC 3351 Values
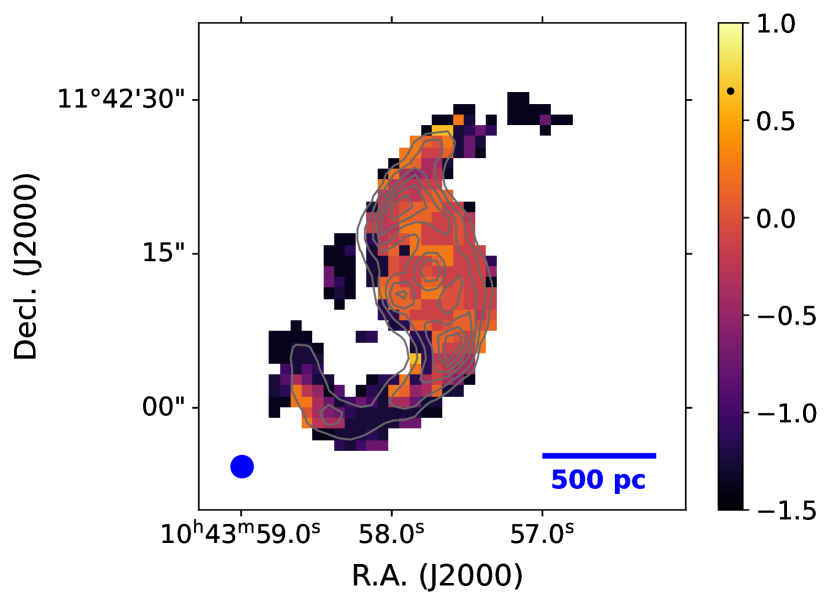
(a)
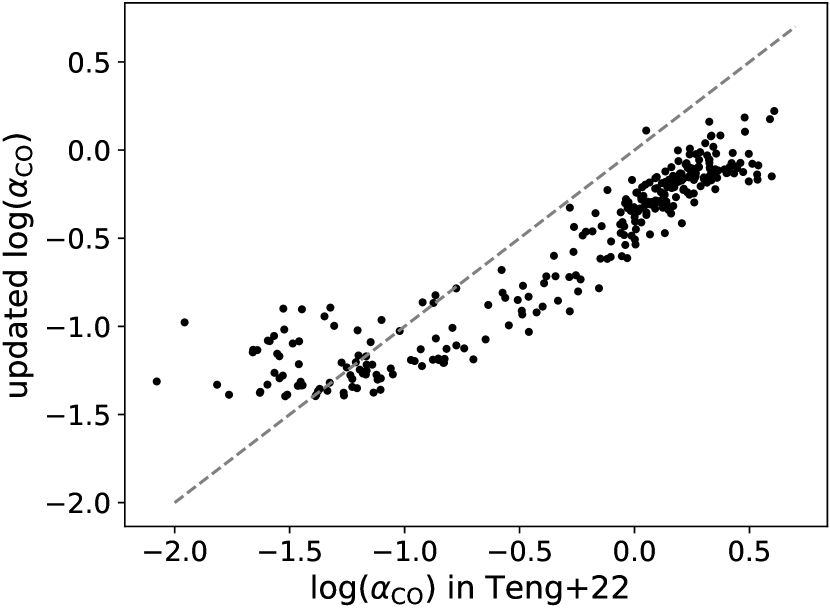
(b)
As mentioned in Section 4.3, the solutions for NGC 3351 in Teng et al. (2022) should be a factor of 2–3 lower if consistent line widths were adopted when computing the model grid. This factor of 2–3 overestimation comes from the observed line width in NGC 3351 being overall 2–3 times higher than the FWHM line width of 15 km s-1 assumed in RADEX. Here we recalculate and update the values for NGC 3351 which are used in this work for a self-consistent comparison. We emphasize that this does not change the qualitative results and main findings in Teng et al. (2022).
Figure 22(a) presents the updated 1DMax map of NGC 3351. The color bar and scale are set to be the same as Teng et al. (2022, Figure 10a) for easier comparison. We find no major change in in the inflow regions as their observed FWHM line width is close to the RADEX-assumed 15 km s-1. It is also clear that in the inflow regions remain substantially lower than the central nuclear ring, even though within the nuclear ring becomes 2–3 times lower. The pixel-by-pixel relation between the pre- and post-updated values is shown in Figure 22(a).
We also report changes in the intensity-weighted mean over the entire kpc region (), as well as the spectrally-stacked value of the inflow regions. After correction, , which is 2.4 times lower than in Teng et al. (2022). In addition, the spectrally-stacked over the inflow arms based on the best-fit solution becomes 0.08 , which is still within the range of 0.01–0.1 reported in Teng et al. (2022).
Appendix C Additional Figures on the Data and Modeling
C.1 Maps of Moment 1 and Effective Line Width
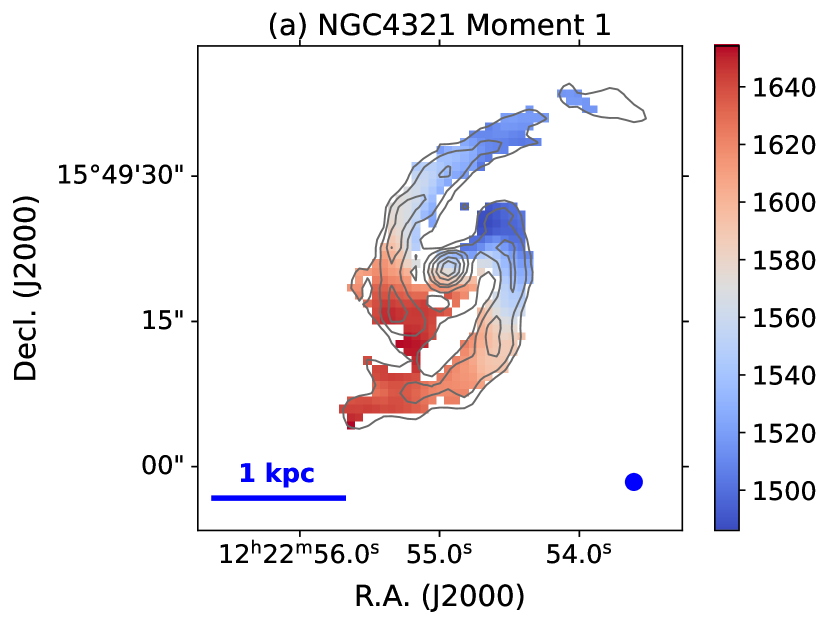
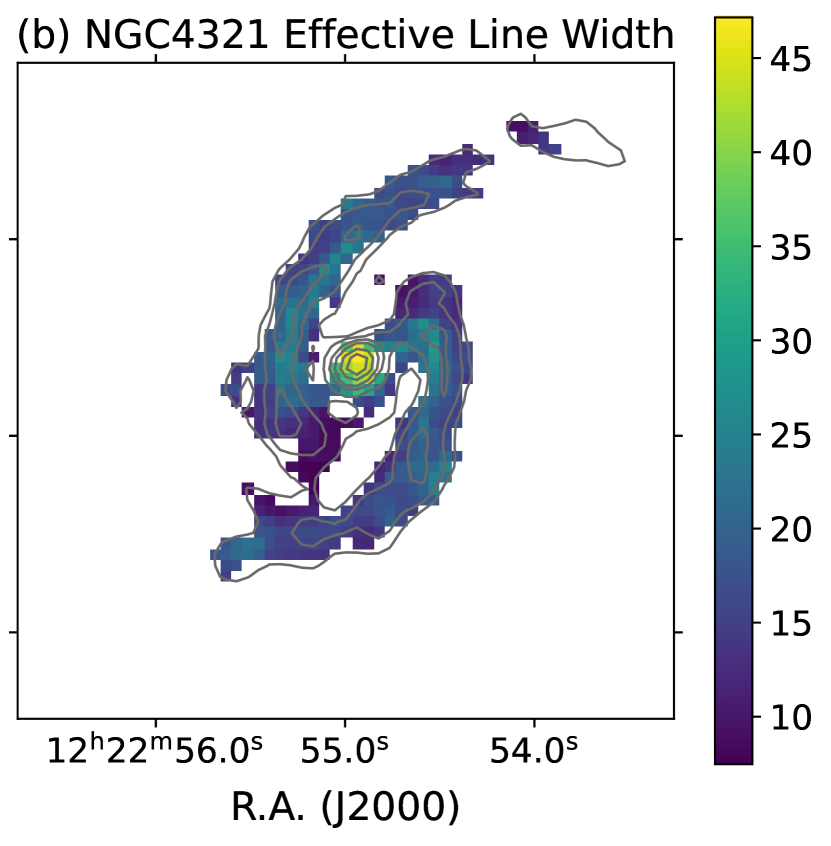
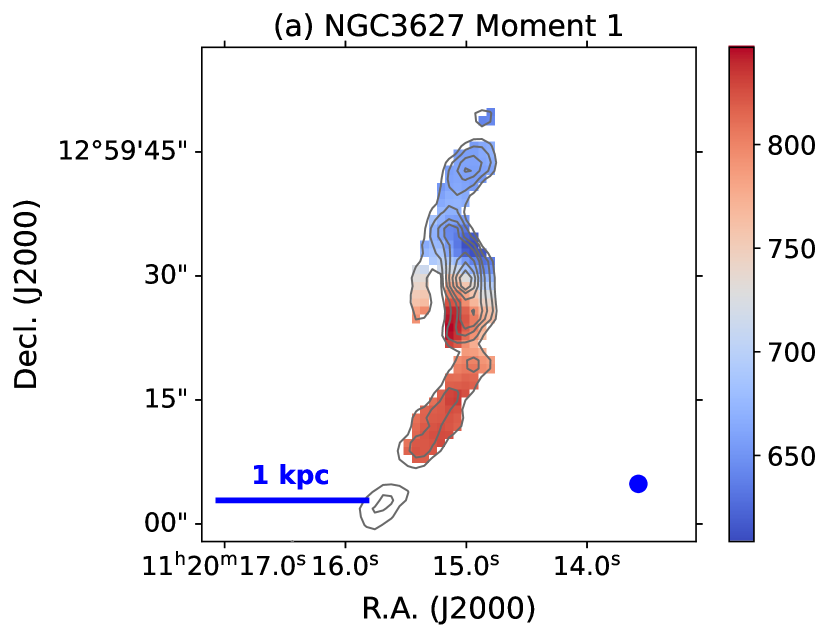
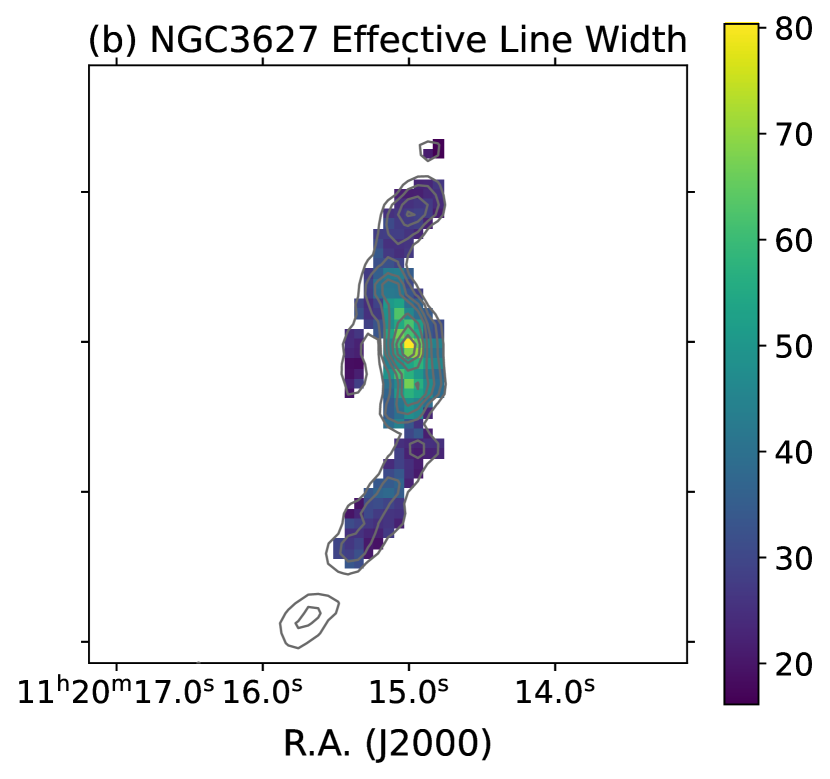
While this work do not focus on the molecular gas dynamics, we provide here the moment 1 and effective line width maps toward our targets as a reference for future studies. Figures 23 and 24 show the CO 2–1 maps for NGC 4321 and NGC 3627, respectively. The moment 1 maps for both galaxies reveal clear signature of counter-clockwise gas rotation, and the effective line widths are highest in the nuclei possibly due to unresolved gas motion within the central beam.
C.2 Line Constraints and Modeled Probability Distributions
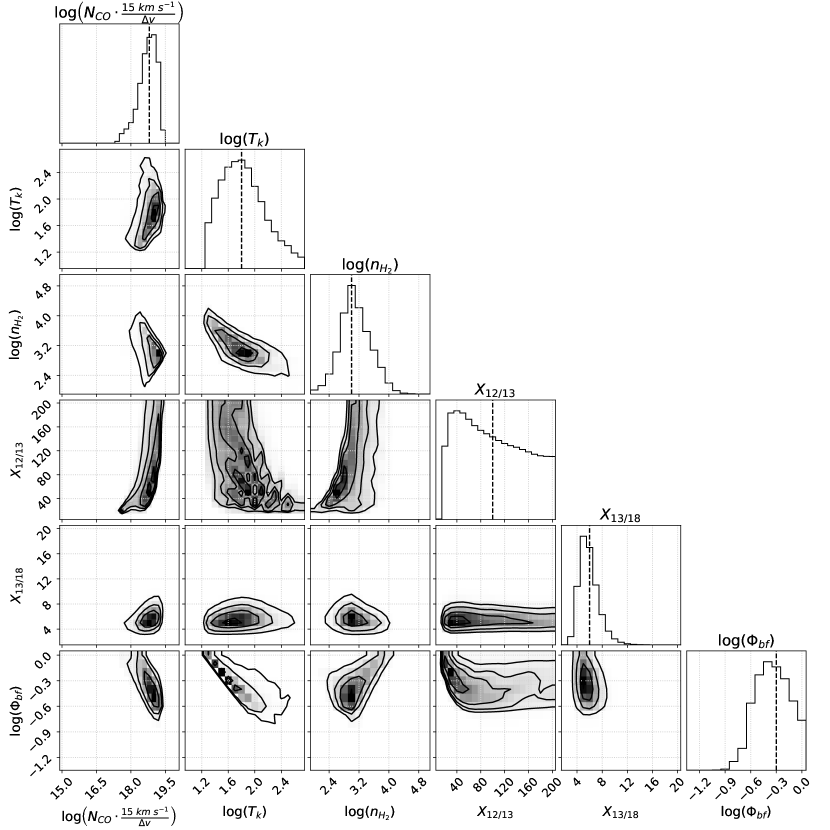
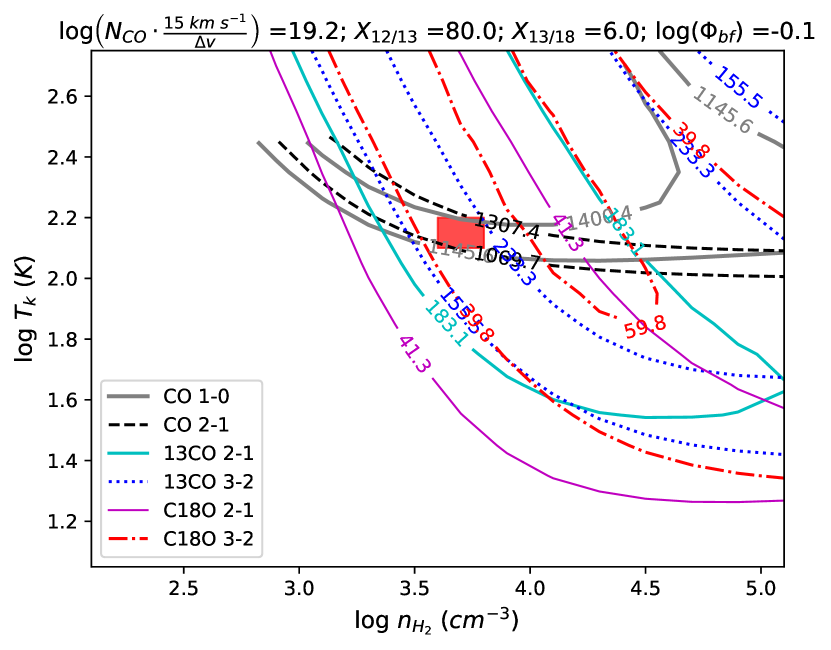
(a)
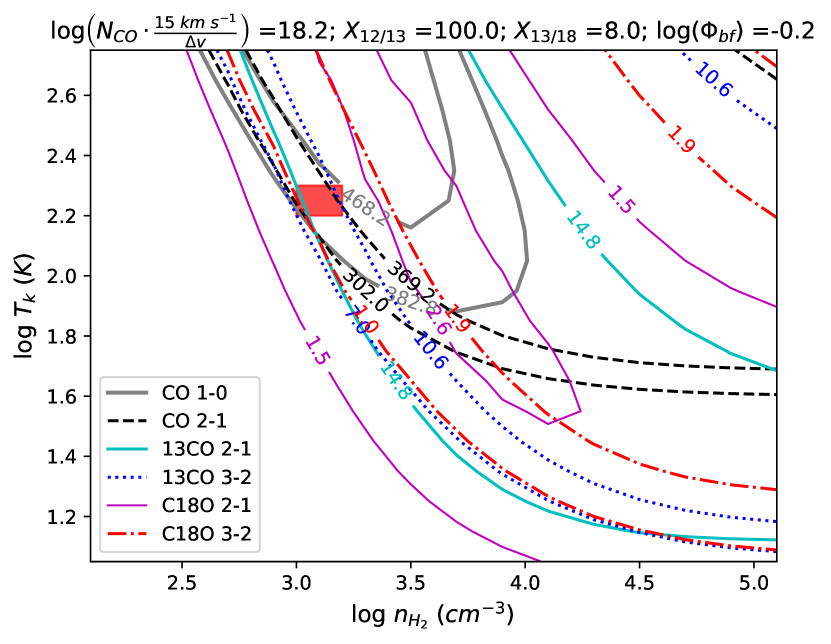
(b)
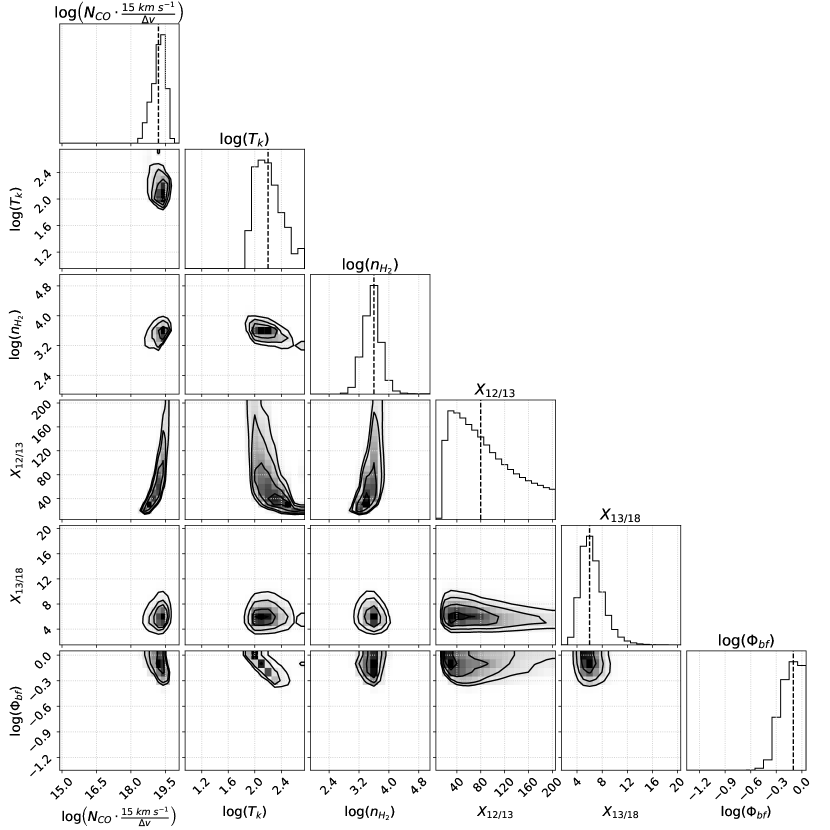
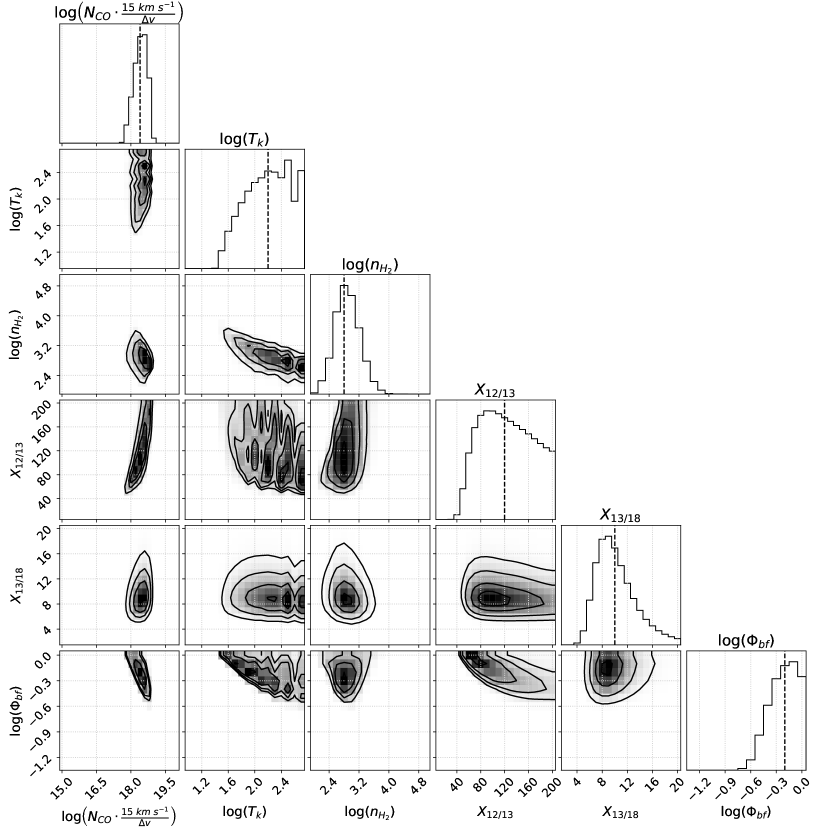
Besides the line constraints and modeled PDFs for the NGC 4321 nucleus presented in Figures 7 and 8, here we include additional figures for other representative regions. Figures 25, 27, and 28 demonstrate the PDFs for the inner arms of NGC 4321, the nucleus of NGC 3627, and the inner arms of NGC 3627, respectively. Figure 26 shows the line constraints and best-fit solutions for the nucleus and inner arms of NGC 3627.
References
- Aalto et al. (2010) Aalto, S., Beswick, R., & Jütte, E. 2010, A&A, 522, A59, doi: 10.1051/0004-6361/200913511
- Aalto et al. (1995) Aalto, S., Booth, R. S., Black, J. H., & Johansson, L. E. B. 1995, A&A, 300, 369
- Accurso et al. (2017a) Accurso, G., Saintonge, A., Bisbas, T. G., & Viti, S. 2017a, MNRAS, 464, 3315, doi: 10.1093/mnras/stw2580
- Accurso et al. (2017b) Accurso, G., Saintonge, A., Catinella, B., et al. 2017b, MNRAS, 470, 4750, doi: 10.1093/mnras/stx1556
- Ackermann et al. (2012a) Ackermann, M., Ajello, M., Allafort, A., et al. 2012a, A&A, 538, A71, doi: 10.1051/0004-6361/201117539
- Ackermann et al. (2012b) Ackermann, M., Ajello, M., Atwood, W. B., et al. 2012b, ApJ, 750, 3, doi: 10.1088/0004-637X/750/1/3
- Amorín et al. (2016) Amorín, R., Muñoz-Tuñón, C., Aguerri, J. A. L., & Planesas, P. 2016, A&A, 588, A23, doi: 10.1051/0004-6361/201526397
- Anand et al. (2021) Anand, G. S., Lee, J. C., Van Dyk, S. D., et al. 2021, MNRAS, 501, 3621, doi: 10.1093/mnras/staa3668
- Areal et al. (2018) Areal, M. B., Paron, S., Celis Peña, M., & Ortega, M. E. 2018, A&A, 612, A117, doi: 10.1051/0004-6361/201732067
- Astropy Collaboration et al. (2013) Astropy Collaboration, Robitaille, T. P., Tollerud, E. J., et al. 2013, A&A, 558, A33, doi: 10.1051/0004-6361/201322068
- Astropy Collaboration et al. (2018) Astropy Collaboration, Price-Whelan, A. M., Sipőcz, B. M., et al. 2018, AJ, 156, 123, doi: 10.3847/1538-3881/aabc4f
- Belfiore et al. (2022) Belfiore, F., Santoro, F., Groves, B., et al. 2022, A&A, 659, A26, doi: 10.1051/0004-6361/202141859
- Beuther et al. (2017) Beuther, H., Meidt, S., Schinnerer, E., Paladino, R., & Leroy, A. 2017, A&A, 597, A85, doi: 10.1051/0004-6361/201526749
- Bešlić et al. (2021) Bešlić, I., Barnes, A. T., Bigiel, F., et al. 2021, MNRAS, 506, 963, doi: 10.1093/mnras/stab1776
- Bisbas et al. (2021) Bisbas, T. G., Tan, J. C., & Tanaka, K. E. I. 2021, MNRAS, 502, 2701, doi: 10.1093/mnras/stab121
- Bisbas et al. (2017) Bisbas, T. G., van Dishoeck, E. F., Papadopoulos, P. P., et al. 2017, ApJ, 839, 90, doi: 10.3847/1538-4357/aa696d
- Blake et al. (1987) Blake, G. A., Sutton, E. C., Masson, C. R., & Phillips, T. G. 1987, ApJ, 315, 621, doi: 10.1086/165165
- Bolatto et al. (2008) Bolatto, A. D., Leroy, A. K., Rosolowsky, E., Walter, F., & Blitz, L. 2008, ApJ, 686, 948, doi: 10.1086/591513
- Bolatto et al. (2013) Bolatto, A. D., Wolfire, M., & Leroy, A. K. 2013, ARA&A, 51, 207, doi: 10.1146/annurev-astro-082812-140944
- Bonato et al. (2019) Bonato, M., Liuzzo, E., Herranz, D., et al. 2019, MNRAS, 485, 1188, doi: 10.1093/mnras/stz465
- Bournaud et al. (2015) Bournaud, F., Daddi, E., Weiß, A., et al. 2015, A&A, 575, A56, doi: 10.1051/0004-6361/201425078
- CASA Team et al. (2022) CASA Team, Bean, B., Bhatnagar, S., et al. 2022, PASP, 134, 114501, doi: 10.1088/1538-3873/ac9642
- Chevance et al. (2020) Chevance, M., Kruijssen, J. M. D., Hygate, A. P. S., et al. 2020, MNRAS, 493, 2872, doi: 10.1093/mnras/stz3525
- Cicone et al. (2018) Cicone, C., Severgnini, P., Papadopoulos, P. P., et al. 2018, ApJ, 863, 143, doi: 10.3847/1538-4357/aad32a
- Cormier et al. (2018) Cormier, D., Bigiel, F., Jiménez-Donaire, M. J., et al. 2018, MNRAS, 475, 3909, doi: 10.1093/mnras/sty059
- den Brok et al. (2021) den Brok, J. S., Chatzigiannakis, D., Bigiel, F., et al. 2021, MNRAS, 504, 3221, doi: 10.1093/mnras/stab859
- den Brok et al. (2023) den Brok, J. S., Bigiel, F., Chastenet, J., et al. 2023, arXiv e-prints, arXiv:2302.03044, doi: 10.48550/arXiv.2302.03044
- Downes & Solomon (1998) Downes, D., & Solomon, P. M. 1998, ApJ, 507, 615, doi: 10.1086/306339
- Draine (2011) Draine, B. T. 2011, Physics of the Interstellar and Intergalactic Medium
- Duarte-Cabral et al. (2015) Duarte-Cabral, A., Acreman, D. M., Dobbs, C. L., et al. 2015, MNRAS, 447, 2144, doi: 10.1093/mnras/stu2586
- Egusa et al. (2022) Egusa, F., Gao, Y., Morokuma-Matsui, K., Liu, G., & Maeda, F. 2022, ApJ, 935, 64, doi: 10.3847/1538-4357/ac8050
- Emsellem et al. (2022) Emsellem, E., Schinnerer, E., Santoro, F., et al. 2022, A&A, 659, A191, doi: 10.1051/0004-6361/202141727
- Feldmann et al. (2012a) Feldmann, R., Gnedin, N. Y., & Kravtsov, A. V. 2012a, ApJ, 747, 124, doi: 10.1088/0004-637X/747/2/124
- Feldmann et al. (2012b) —. 2012b, ApJ, 758, 127, doi: 10.1088/0004-637X/758/2/127
- Filho et al. (2000) Filho, M. E., Barthel, P. D., & Ho, L. C. 2000, ApJS, 129, 93, doi: 10.1086/313412
- Foreman-Mackey (2016) Foreman-Mackey, D. 2016, Journal of Open Source Software, 1, 24, doi: 10.21105/joss.00024
- Frerking et al. (1982) Frerking, M. A., Langer, W. D., & Wilson, R. W. 1982, ApJ, 262, 590, doi: 10.1086/160451
- Glover & Clark (2012) Glover, S. C. O., & Clark, P. C. 2012, MNRAS, 426, 377, doi: 10.1111/j.1365-2966.2012.21737.x
- Goldsmith et al. (2008) Goldsmith, P. F., Heyer, M., Narayanan, G., et al. 2008, ApJ, 680, 428, doi: 10.1086/587166
- Gong et al. (2018) Gong, M., Ostriker, E. C., & Kim, C.-G. 2018, ApJ, 858, 16, doi: 10.3847/1538-4357/aab9af
- Gong et al. (2020) Gong, M., Ostriker, E. C., Kim, C.-G., & Kim, J.-G. 2020, ApJ, 903, 142, doi: 10.3847/1538-4357/abbdab
- Harris et al. (2020) Harris, C. R., Millman, K. J., van der Walt, S. J., et al. 2020, Nature, 585, 357, doi: 10.1038/s41586-020-2649-2
- Henkel et al. (2014) Henkel, C., Asiri, H., Ao, Y., et al. 2014, A&A, 565, A3, doi: 10.1051/0004-6361/201322962
- Henshaw et al. (2016) Henshaw, J. D., Longmore, S. N., Kruijssen, J. M. D., et al. 2016, SCOUSE: Semi-automated multi-COmponent Universal Spectral-line fitting Engine, Astrophysics Source Code Library, record ascl:1601.003. http://ascl.net/1601.003
- Herrero-Illana et al. (2019) Herrero-Illana, R., Privon, G. C., Evans, A. S., et al. 2019, A&A, 628, A71, doi: 10.1051/0004-6361/201834088
- Heyer & Dame (2015) Heyer, M., & Dame, T. M. 2015, ARA&A, 53, 583, doi: 10.1146/annurev-astro-082214-122324
- Heyer et al. (2001) Heyer, M. H., Carpenter, J. M., & Snell, R. L. 2001, ApJ, 551, 852, doi: 10.1086/320218
- Ho et al. (1997) Ho, L. C., Filippenko, A. V., & Sargent, W. L. W. 1997, ApJS, 112, 315, doi: 10.1086/313041
- Hu et al. (2022) Hu, C.-Y., Schruba, A., Sternberg, A., & van Dishoeck, E. F. 2022, ApJ, 931, 28, doi: 10.3847/1538-4357/ac65fd
- Hunter (2007) Hunter, J. D. 2007, Computing In Science & Engineering, 9, 90
- Hüttemeister et al. (2000) Hüttemeister, S., Aalto, S., Das, M., & Wall, W. F. 2000, A&A, 363, 93
- Israel (2000) Israel, F. 2000, in Molecular Hydrogen in Space, ed. F. Combes & G. Pineau Des Forets, 293. https://arxiv.org/abs/astro-ph/0001250
- Israel (1997) Israel, F. P. 1997, A&A, 328, 471. https://arxiv.org/abs/astro-ph/9709194
- Israel (2009a) —. 2009a, A&A, 493, 525, doi: 10.1051/0004-6361:200810655
- Israel (2009b) —. 2009b, A&A, 506, 689, doi: 10.1051/0004-6361/200811586
- Israel (2020) —. 2020, A&A, 635, A131, doi: 10.1051/0004-6361/201834198
- Jiao et al. (2021) Jiao, Q., Gao, Y., & Zhao, Y. 2021, MNRAS, 504, 2360, doi: 10.1093/mnras/stab1035
- Joye & Mandel (2003) Joye, W. A., & Mandel, E. 2003, in Astronomical Society of the Pacific Conference Series, Vol. 295, Astronomical Data Analysis Software and Systems XII, ed. H. E. Payne, R. I. Jedrzejewski, & R. N. Hook, 489
- Kamenetzky et al. (2017) Kamenetzky, J., Rangwala, N., & Glenn, J. 2017, MNRAS, 471, 2917, doi: 10.1093/mnras/stx1595
- Kamenetzky et al. (2014) Kamenetzky, J., Rangwala, N., Glenn, J., Maloney, P. R., & Conley, A. 2014, ApJ, 795, 174, doi: 10.1088/0004-637X/795/2/174
- Kamenetzky et al. (2012) Kamenetzky, J., Glenn, J., Rangwala, N., et al. 2012, ApJ, 753, 70, doi: 10.1088/0004-637X/753/1/70
- Kazandjian et al. (2012) Kazandjian, M. V., Meijerink, R., Pelupessy, I., Israel, F. P., & Spaans, M. 2012, A&A, 542, A65, doi: 10.1051/0004-6361/201118641
- Kazandjian et al. (2015) —. 2015, A&A, 574, A127, doi: 10.1051/0004-6361/201322805
- Kennicutt (1998) Kennicutt, Robert C., J. 1998, ApJ, 498, 541, doi: 10.1086/305588
- Kreckel et al. (2019) Kreckel, K., Ho, I. T., Blanc, G. A., et al. 2019, ApJ, 887, 80, doi: 10.3847/1538-4357/ab5115
- Kreckel et al. (2020) —. 2020, MNRAS, 499, 193, doi: 10.1093/mnras/staa2743
- Kulesa (2002) Kulesa, C. A. 2002, PhD thesis, University of Arizona
- Lacy et al. (1994) Lacy, J. H., Knacke, R., Geballe, T. R., & Tokunaga, A. T. 1994, ApJ, 428, L69, doi: 10.1086/187395
- Lang et al. (2020) Lang, P., Meidt, S. E., Rosolowsky, E., et al. 2020, ApJ, 897, 122, doi: 10.3847/1538-4357/ab9953
- Leroy et al. (2011) Leroy, A. K., Bolatto, A., Gordon, K., et al. 2011, ApJ, 737, 12, doi: 10.1088/0004-637X/737/1/12
- Leroy et al. (2013) Leroy, A. K., Walter, F., Sandstrom, K., et al. 2013, AJ, 146, 19, doi: 10.1088/0004-6256/146/2/19
- Leroy et al. (2021a) Leroy, A. K., Schinnerer, E., Hughes, A., et al. 2021a, ApJS, 257, 43, doi: 10.3847/1538-4365/ac17f3
- Leroy et al. (2021b) Leroy, A. K., Hughes, A., Liu, D., et al. 2021b, ApJS, 255, 19, doi: 10.3847/1538-4365/abec80
- Leroy et al. (2022) Leroy, A. K., Rosolowsky, E., Usero, A., et al. 2022, ApJ, 927, 149, doi: 10.3847/1538-4357/ac3490
- Lin et al. (2019) Lin, L., Pan, H.-A., Ellison, S. L., et al. 2019, ApJ, 884, L33, doi: 10.3847/2041-8213/ab4815
- Liu et al. (2022) Liu, D., Schinnerer, E., Saito, T., et al. 2022, arXiv e-prints, arXiv:2212.09661. https://arxiv.org/abs/2212.09661
- Liu et al. (2023) Liu, D., Schinnerer, E., Cao, Y., et al. 2023, ApJ, 944, L19, doi: 10.3847/2041-8213/aca973
- Liu et al. (2013) Liu, T., Wu, Y., & Zhang, H. 2013, ApJ, 775, L2, doi: 10.1088/2041-8205/775/1/L2
- Madden et al. (2020) Madden, S. C., Cormier, D., Hony, S., et al. 2020, A&A, 643, A141, doi: 10.1051/0004-6361/202038860
- Milam et al. (2005) Milam, S. N., Savage, C., Brewster, M. A., Ziurys, L. M., & Wyckoff, S. 2005, ApJ, 634, 1126, doi: 10.1086/497123
- Morokuma-Matsui et al. (2015) Morokuma-Matsui, K., Sorai, K., Watanabe, Y., & Kuno, N. 2015, PASJ, 67, 2, doi: 10.1093/pasj/psu126
- Moustakas et al. (2010) Moustakas, J., Kennicutt, Robert C., J., Tremonti, C. A., et al. 2010, ApJS, 190, 233, doi: 10.1088/0067-0049/190/2/233
- Murphy et al. (2015) Murphy, E. J., Dong, D., Leroy, A. K., et al. 2015, ApJ, 813, 118, doi: 10.1088/0004-637X/813/2/118
- Narayanan et al. (2011) Narayanan, D., Krumholz, M., Ostriker, E. C., & Hernquist, L. 2011, MNRAS, 418, 664, doi: 10.1111/j.1365-2966.2011.19516.x
- Narayanan et al. (2012) Narayanan, D., Krumholz, M. R., Ostriker, E. C., & Hernquist, L. 2012, MNRAS, 421, 3127, doi: 10.1111/j.1365-2966.2012.20536.x
- Nimori et al. (2013) Nimori, M., Habe, A., Sorai, K., et al. 2013, MNRAS, 429, 2175, doi: 10.1093/mnras/sts487
- Nishimura et al. (2015) Nishimura, A., Tokuda, K., Kimura, K., et al. 2015, ApJS, 216, 18, doi: 10.1088/0067-0049/216/1/18
- Pan & Kuno (2017) Pan, H.-A., & Kuno, N. 2017, ApJ, 839, 133, doi: 10.3847/1538-4357/aa60c2
- Papadopoulos et al. (2018) Papadopoulos, P. P., Bisbas, T. G., & Zhang, Z.-Y. 2018, MNRAS, 478, 1716, doi: 10.1093/mnras/sty1077
- Papadopoulos et al. (2012) Papadopoulos, P. P., van der Werf, P., Xilouris, E., Isaak, K. G., & Gao, Y. 2012, ApJ, 751, 10, doi: 10.1088/0004-637X/751/1/10
- Peñaloza et al. (2018) Peñaloza, C. H., Clark, P. C., Glover, S. C. O., & Klessen, R. S. 2018, MNRAS, 475, 1508, doi: 10.1093/mnras/stx3263
- Pessa et al. (2021) Pessa, I., Schinnerer, E., Belfiore, F., et al. 2021, A&A, 650, A134, doi: 10.1051/0004-6361/202140733
- Pitts et al. (2019) Pitts, R. L., Barnes, P. J., & Varosi, F. 2019, MNRAS, 484, 305, doi: 10.1093/mnras/sty3360
- Remy et al. (2017) Remy, Q., Grenier, I. A., Marshall, D. J., & Casandjian, J. M. 2017, A&A, 601, A78, doi: 10.1051/0004-6361/201629632
- Renaud et al. (2019) Renaud, F., Bournaud, F., Daddi, E., & Weiß, A. 2019, A&A, 621, A104, doi: 10.1051/0004-6361/201834397
- Roman-Duval et al. (2016) Roman-Duval, J., Heyer, M., Brunt, C. M., et al. 2016, ApJ, 818, 144, doi: 10.3847/0004-637X/818/2/144
- Rosolowsky et al. (2021) Rosolowsky, E., Hughes, A., Leroy, A. K., et al. 2021, MNRAS, 502, 1218, doi: 10.1093/mnras/stab085
- Sandstrom et al. (2013) Sandstrom, K. M., Leroy, A. K., Walter, F., et al. 2013, ApJ, 777, 5, doi: 10.1088/0004-637X/777/1/5
- Santoro et al. (2022) Santoro, F., Kreckel, K., Belfiore, F., et al. 2022, A&A, 658, A188, doi: 10.1051/0004-6361/202141907
- Schruba et al. (2011) Schruba, A., Leroy, A. K., Walter, F., et al. 2011, AJ, 142, 37, doi: 10.1088/0004-6256/142/2/37
- Schruba et al. (2012) —. 2012, AJ, 143, 138, doi: 10.1088/0004-6256/143/6/138
- Scoville et al. (1987) Scoville, N. Z., Yun, M. S., Clemens, D. P., Sanders, D. B., & Waller, W. H. 1987, ApJS, 63, 821, doi: 10.1086/191185
- Seifried et al. (2020) Seifried, D., Haid, S., Walch, S., Borchert, E. M. A., & Bisbas, T. G. 2020, MNRAS, 492, 1465, doi: 10.1093/mnras/stz3563
- Sheffer et al. (2008) Sheffer, Y., Rogers, M., Federman, S. R., et al. 2008, ApJ, 687, 1075, doi: 10.1086/59148410.48550/arXiv.0807.0940
- Shetty et al. (2011a) Shetty, R., Glover, S. C., Dullemond, C. P., & Klessen, R. S. 2011a, MNRAS, 412, 1686, doi: 10.1111/j.1365-2966.2010.18005.x
- Shetty et al. (2011b) Shetty, R., Glover, S. C., Dullemond, C. P., et al. 2011b, MNRAS, 415, 3253, doi: 10.1111/j.1365-2966.2011.18937.x
- Sliwa et al. (2014) Sliwa, K., Wilson, C. D., Iono, D., Peck, A., & Matsushita, S. 2014, ApJ, 796, L15, doi: 10.1088/2041-8205/796/1/L15
- Sliwa et al. (2017) Sliwa, K., Wilson, C. D., Matsushita, S., et al. 2017, ApJ, 840, 8, doi: 10.3847/1538-4357/aa689b
- Sliwa et al. (2012) Sliwa, K., Wilson, C. D., Petitpas, G. R., et al. 2012, ApJ, 753, 46, doi: 10.1088/0004-637X/753/1/46
- Smith et al. (2014) Smith, R. J., Glover, S. C. O., Clark, P. C., Klessen, R. S., & Springel, V. 2014, MNRAS, 441, 1628, doi: 10.1093/mnras/stu616
- Smithsonian Astrophysical Observatory (2000) Smithsonian Astrophysical Observatory. 2000, SAOImage DS9: A utility for displaying astronomical images in the X11 window environment. http://ascl.net/0003.002
- Sofia et al. (2004) Sofia, U. J., Lauroesch, J. T., Meyer, D. M., & Cartledge, S. I. B. 2004, ApJ, 605, 272, doi: 10.1086/382592
- Solomon et al. (1987) Solomon, P. M., Rivolo, A. R., Barrett, J., & Yahil, A. 1987, ApJ, 319, 730, doi: 10.1086/165493
- Sorai et al. (2012) Sorai, K., Kuno, N., Nishiyama, K., et al. 2012, PASJ, 64, 51, doi: 10.1093/pasj/64.3.51
- Sormani & Barnes (2019) Sormani, M. C., & Barnes, A. T. 2019, MNRAS, 484, 1213, doi: 10.1093/mnras/stz046
- Strong et al. (2004) Strong, A. W., Moskalenko, I. V., Reimer, O., Digel, S., & Diehl, R. 2004, A&A, 422, L47, doi: 10.1051/0004-6361:2004017210.48550/arXiv.astro-ph/0405275
- Sun et al. (2018) Sun, J., Leroy, A. K., Schruba, A., et al. 2018, ApJ, 860, 172, doi: 10.3847/1538-4357/aac326
- Sun et al. (2020a) Sun, J., Leroy, A. K., Ostriker, E. C., et al. 2020a, ApJ, 892, 148, doi: 10.3847/1538-4357/ab781c
- Sun et al. (2020b) Sun, J., Leroy, A. K., Schinnerer, E., et al. 2020b, ApJ, 901, L8, doi: 10.3847/2041-8213/abb3be
- Sun et al. (2022) Sun, J., Leroy, A. K., Rosolowsky, E., et al. 2022, AJ, 164, 43, doi: 10.3847/1538-3881/ac74bd
- Sun et al. (2023) Sun, J., Leroy, A. K., Ostriker, E. C., et al. 2023, ApJ, 945, L19, doi: 10.3847/2041-8213/acbd9c
- Tang et al. (2019) Tang, X. D., Henkel, C., Menten, K. M., et al. 2019, A&A, 629, A6, doi: 10.1051/0004-6361/201935603
- Teng & Hirano (2020) Teng, Y.-H., & Hirano, N. 2020, ApJ, 893, 63, doi: 10.3847/1538-4357/ab7cca
- Teng et al. (2022) Teng, Y.-H., Sandstrom, K. M., Sun, J., et al. 2022, ApJ, 925, 72, doi: 10.3847/1538-4357/ac382f
- Tielens (2010) Tielens, A. G. G. M. 2010, The Physics and Chemistry of the Interstellar Medium
- van der Tak et al. (2007) van der Tak, F. F. S., Black, J. H., Schöier, F. L., Jansen, D. J., & van Dishoeck, E. F. 2007, A&A, 468, 627, doi: 10.1051/0004-6361:20066820
- Virtanen et al. (2020) Virtanen, P., Gommers, R., Oliphant, T. E., et al. 2020, Nature Methods, 17, 261, doi: https://doi.org/10.1038/s41592-019-0686-2
- Ward et al. (2003) Ward, J. S., Zmuidzinas, J., Harris, A. I., & Isaak, K. G. 2003, ApJ, 587, 171, doi: 10.1086/368175
- Watanabe et al. (2011) Watanabe, Y., Sorai, K., Kuno, N., & Habe, A. 2011, MNRAS, 411, 1409, doi: 10.1111/j.1365-2966.2010.17746.x
- Williams et al. (2022) Williams, T. G., Kreckel, K., Belfiore, F., et al. 2022, MNRAS, 509, 1303, doi: 10.1093/mnras/stab3082
- Wilson & Rood (1994) Wilson, T. L., & Rood, R. 1994, ARA&A, 32, 191, doi: 10.1146/annurev.aa.32.090194.001203
- Wolfire et al. (2010) Wolfire, M. G., Hollenbach, D., & McKee, C. F. 2010, ApJ, 716, 1191, doi: 10.1088/0004-637X/716/2/1191
- Yajima et al. (2021) Yajima, Y., Sorai, K., Miyamoto, Y., et al. 2021, PASJ, 73, 257, doi: 10.1093/pasj/psaa119
- Yan et al. (2023) Yan, Y. T., Henkel, C., Kobayashi, C., et al. 2023, A&A, 670, A98, doi: 10.1051/0004-6361/202244584
- Yim et al. (2014) Yim, K., Wong, T., Xue, R., et al. 2014, AJ, 148, 127, doi: 10.1088/0004-6256/148/6/127