Towards Cohort Intelligence: A Universal Cohort Representation
Learning Framework for Electronic Health Record Analysis
Abstract.
Electronic Health Records (EHR) are generated from clinical routine care recording valuable information of broad patient populations, which provide plentiful opportunities for improving patient management and intervention strategies in clinical practice. To exploit the enormous potential of EHR data, a popular EHR data analysis paradigm in machine learning is EHR representation learning, which first leverages the individual patient’s EHR data to learn informative representations by a backbone, and supports diverse health-care downstream tasks grounded on the representations. Unfortunately, such a paradigm fails to access the in-depth analysis of patients’ relevance, which is generally known as cohort studies in clinical practice. Specifically, patients in the same cohort tend to share similar characteristics, implying their resemblance in medical conditions such as symptoms or diseases. In this paper, we propose a universal COhort Representation lEarning (CORE) framework to augment EHR utilization by leveraging the fine-grained cohort information among patients. In particular, CORE first develops an explicit patient modeling task based on the prior knowledge of patients’ diagnosis codes, which measures the latent relevance among patients to adaptively divide the cohorts for each patient. Based on the constructed cohorts, CORE recodes the pre-extracted EHR data representation from intra- and inter-cohort perspectives, yielding augmented EHR data representation learning. CORE is readily applicable to diverse backbone models, serving as a universal plug-in framework to infuse cohort information into healthcare methods for boosted performance. We conduct an extensive experimental evaluation on two real-world datasets, and the experimental results demonstrate the effectiveness and generalizability of CORE.
1. Introduction
Electronic health records (EHR) data are electronically stored medical histories of patients in a healthcare system. EHR data typically consists of patients’ demographics (e.g., age, gender), and temporal medical variables (e.g., diagnoses, medications, laboratory tests, and clinical notes) (Johnson et al., 2016). Therefore, EHR data are beneficial to power data-driven approaches in the healthcare community and facilitate critical clinical decision-making (e.g., mortality prediction, patient subtyping, and diagnosis prediction) for more optimized patient management (Yan et al., 2020; Hou et al., 2020; Baytas et al., 2017; Wynants et al., 2020), including assisting doctors in analyzing patients’ health conditions, developing treatment plans, and preventing adverse outcomes in a more intelligent and effective way, among others.
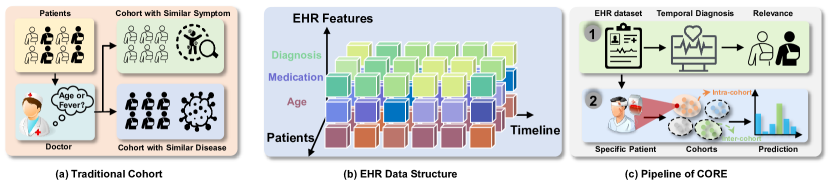
Contemporary approaches (Huang et al., 2019; Choi et al., 2017a; Shang et al., 2019) generally learn the generalizable representation by exploiting the potential information of EHR data and then using these learned representations to facilitate different downstream healthcare tasks. Unfortunately, one indispensable consideration to achieve effective EHR representation learning has been overlooked by most existing studies - Patient Cohorts. In healthcare research, a patient cohort defines groupings of individuals with common traits, such as demographics, and health conditions. For example, as shown in Figure 1, when COVID-19 ravages the world, if doctors select COVID-19 patients whose ages are between 60 and 90 to derive the cohort, doctors may find that these patients tend to exhibit similarly severe symptoms. In addition, if doctors select the cohort according to the symptoms of the patients, they may find the patients who have a fever tend to develop a similar disease, i.e., COVID-19. In practice, patient cohorts are integral to researching and developing effective medical interventions. Based on the aforementioned insights, a meaningful optimization goal of EHR representation learning is to explore an effective cohort construction approach that evolves from individual intelligence to cohort intelligence, thereby unleashing the potential of EHR data profoundly to facilitate EHR analysis further.
As illustrated in Figure 1, a straightforward approach to dividing cohorts is based solely on explicit features and uses the single derived cohort for different healthcare tasks. Despite being intuitive, applying this approach may not satisfactorily tackle EHR data in practice, as the following two desiderata are not attained: (1) Fine-grained Cohort Division. As in Figure 1(b), real-world EHR data record patients’ temporal visits to the hospital for different reasons, thus leading to different diagnoses, medications, etc. Consequently, the coarse-grained cohort division based on a single feature may assign two similar patients to different cohorts at different time points. In clinical practice, when attending to a patient, a doctor tends to refer to the health conditions and medical histories of similar patients that she/he treated before, to help assess this current patient. In other words, a fine-grained cohort division is highly desired, which takes into account the patient relevance in time dimension rather than based on merely a single feature. (2) Intra-cohort and Inter-cohort information Exploitation. As discussed, the relevance of similar patients within a cohort, i.e., intra-cohort information is valuable to medical decisions. Besides, a doctor may also consider the difference between the current patient and other patients with different symptoms, which serves as contrasting knowledge from other cohorts to consolidate the diagnosis. Therefore, effective EHR representation learning should exploit the intra-cohort and cross-cohort information comprehensively to utilize EHR data to the utmost. However, both the desiderata are not achieved in existing cohort learning work, such as GRASP (Zhang et al., 2021) only considers a simple clustering method to construct cohorts, which may fail to fully exploit the EHR’s potential.
To fulfill the desiderata above, we propose CORE, a universal COhort Representation lEarning framework for EHR Data Analysis. As illustrated in Figure 1(c), CORE consists of two key steps. Step 1, we propose the introduction of a pre-context task that measures the patient relevance to construct fine-grained cohorts. Specifically, we first model the patient-level features by leveraging a patient’s sequential visit-level features via the reverse-time attention mechanism. The underlying rationale of this step is that the latter visits in time tend to have higher weights to represent the patient’s health status in the implicit semantic space. Thereafter, we measure the Jaccard similarity (Niwattanakul et al., 2013) of any two patients’ diagnosis codes as the pseudo label, which serves as the relevance label to model the patient relevance. Step 2, after modeling the patient relevance backed by the pre-context task, given a patient’s embedding learned from an existing EHR data learning backbone, we distill the intra-cohort information according to her/his similar patients in the same cohort and further incorporate the inter-cohort information for this patient, respectively exploiting the internal and external information for boosted performance in downstream healthcare tasks. Finally, CORE exploits the intra-cohort and inter-cohort information as two graphs and encodes them as the augmented representation for prediction. Our contributions are summarized as follows.
-
•
We propose CORE, a universal cohort representation framework to support fine-grained cohort division and exploit intra-cohort and inter-cohort information simultaneously, which are overlooked in prior studies in EHR analysis.
-
•
CORE functions in two steps. Specifically, CORE first proposes a novel pre-context task to model the temporal EHR data for measuring the relevance of patients, thereby constructing the fine-grained cohorts. CORE then distills the cohort information from both intra-cohort and inter-cohort perspectives, and finally derives the overall cohort information to facilitate EHR data representation learning.
-
•
We evaluate the effectiveness of CORE on two real-world EHR datasets. The experimental results demonstrate that CORE on top of backbone models outperforms counterparts by a large margin, validating the efficacy of the comprehensive cohort information learned by CORE.
The remainder of this paper is organized as follows. We review existing work in Section 2, and present our proposed CORE framework which achieves fine-grained cohort division and exploits both the intra-cohort and the inter-cohort information in Section 3. Our extensive experimental results are demonstrated in Section 4. Finally, we summarize in Section 5.
2. Related work
In this section, we review the preliminaries of EHR data representation learning and the corresponding existing studies in this line of research.
EHR data are a systematized collection of patients’ information, recording their time-series medical features during the visits to hospitals and are stored in hospitals’ systems. EHR data mainly include: (i) structured data such as socio-demographic information, diagnoses, laboratory test results, medications, and procedures, (ii) unstructured data such as medical images (e.g., magnetic resonance imaging data and computerized tomography scans), and doctors’ notes.
We categorize the existing machine learning models in EHR analysis as follows and elaborate on several representative studies per category. Word2Vec-based models (Mikolov et al., 2013). For instance, medical concept embeddings are learned from healthcare claims data (Choi et al., 2016c), and Med2Vec (Choi et al., 2016a) utilizes the codes within a visit and a hierarchical structure with a sequential order of visits to learn the representations. AutoEncoders. A stack of denoising autoencoders (DAE) is employed by Deep Patient (Miotto et al., 2016) to learn patient representations from the multi-level clinical descriptors, whereas a sparse autoencoder (SAE) with Gaussian process regression is adopted to deal with dirty clinical data (Lasko et al., 2013). Convolution Neural Networks(LeCun et al., 1998; Bouvrie, 2006). For example, a novel temporal fusion CNN, which extends the connectivity between the layers in the time dimension, is devised to learn temporal features in (Cheng et al., 2016), and a hybrid model RCNN, which combines recurrent neural networks (RNN) and convolutional neural networks (CNN), to extract features and preserve the temporal relationship in EEG data in SLEEPNET (Biswal et al., 2017). Graph Neural Networks. In this category, GRAM (Choi et al., 2017a) proposes a DAG-based attention model to encode the hierarchical information inherent to medical ontologies into EHR data. KAME (Ma et al., 2018) devises a knowledge attention mechanism that not only learns interpretable representations for the nodes in the knowledge graph but also explores knowledge insights to be used for the model. Besides, CompNet (Wang et al., 2019) employs a graph convolutional model based on medicine combination prediction with a reinforcement learning method to learn the interactions between different medicines. GAN (Goodfellow et al., 2020). Specifically, RCGAN (Esteban et al., 2017) proposes a recurrent GAN and a recurrent conditional GAN to obtain realistic synthetic multi-dimensional time series EHR data. medGAN (Choi et al., 2017b), on the other hand, adopts a combination of an autoencoder and generative adversarial networks to achieve a similar goal. RNN. Under this category, Retain (Choi et al., 2016b) uses RNN to calculate the attention of both historical visits and significant clinical variables. Dipole (Ma et al., 2017) employs bidirectional recurrent neural networks to model the temporally dynamic behaviors of EHR data from both directions. In addition, Dipole introduces three attention mechanisms to measure the relationships of different visits for EHR analysis. Transformer-based models. BEHRT (Li et al., 2020) treats each diagnosis as words and each visit as a document with the aim of learning the relationships between patients’ diagnoses and their previous visits. G-BERT (Shang et al., 2019) constructs ontology embeddings from the diagnosis ontology tree and the medication ontology tree for medical code representation and medication recommendation. Med-BERT (Rasmy et al., 2021), trained on structured diagnosis data, designs a domain-specific cross-visit pretraining task to capture contextual semantics. ClinicalBERT (Huang et al., 2019) learns representations based on high-dimensional and sparse clinical notes and fine-tunes the representations on a readmission task.
The architecture of CORE
Further, several studies take into account the information/relevance between patients to boost the performance of analytic models, as similar patients are more likely to exhibit similar behaviors or medical symptoms. For instance, a patient similarity evaluation framework is proposed in (Zhu et al., 2016), preserving the temporal properties in EHR data meanwhile. A convolutional neural network is adopted in (Suo et al., 2018) to capture locally important information in EHR data. GRASP (Zhang et al., 2021) defines the similarity between patients for different clinical tasks via Gumbel-Max technique (Gumbel, 1954). Nonetheless, these methods either do not consider similarities between patients or cannot fully capture the similarity information.
3. Methodology
We describe the proposed CORE framework in this section by presenting each module and then the training strategy of CORE.
3.1. Problem Formulation
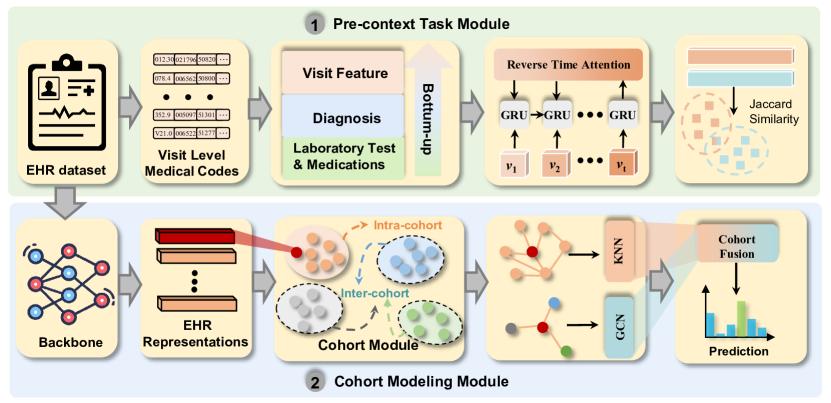
We first introduce some basic notions and terminologies before diving into the details of CORE. Given an EHR dataset that has patients , each patient has a temporal visiting sequence , where is the number of visits. The features of each visit contain three types of medical codes, namely diagnoses ={}, medications ={} and laboratory tests ={}. In this paper, we propose CORE, a universal cohort representation learning framework for EHR data analysis. As shown in Figure 2, we use the following training pipeline to demonstrate how CORE works:
| (1) |
where and are the models for the pre-context task and cohort modeling with parameters and , respectively. The Pre-context Task Module models the patient relevance based on patients’ visit sequences. The Cohort Modeling Module constructs cohorts , integrating the intra-cohort and inter-cohort information, and then correspondingly encodes the cohort information to attain augmented representations.
3.2. Pre-context Task Module
Example of ICD-9
The Pre-context Task Module aims to obtain cohorts by modeling the patient-level relevance. In brief, CORE first devises a hierarchical network to process medical codes (diagnosis codes, medication codes, and laboratory test codes) to derive visit-level features of EHR data. CORE then employs the reverse time attention mechanism to learn the patient-level features based on visit-level features. To facilitate the fine-grained cohort construction, we design a patient-level relevance learning process for this module.
3.2.1. Hierarchical Visit Modeling
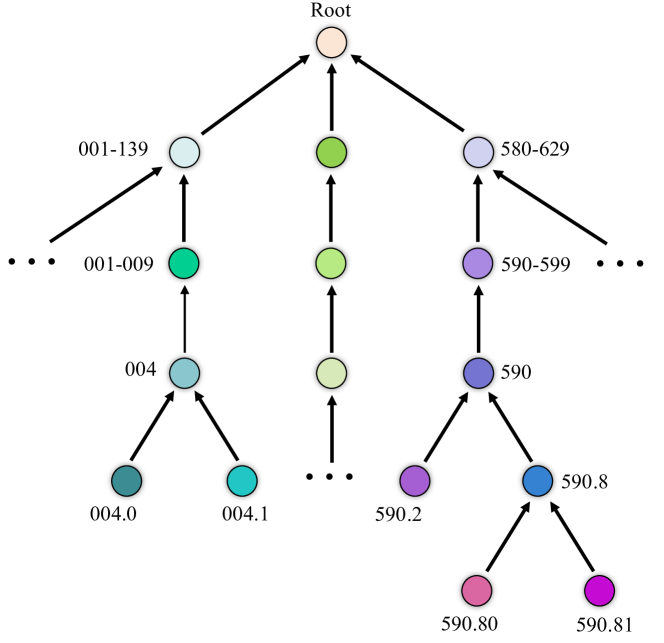
A visit contains a set of diagnosis codes , medication codes and labratory test codes . Considering the fact that most diagnosis codes follow certain specifications, such as ICD-9 (Quan et al., 2005), ICD-10 (Quan et al., 2005), ICD-11 (Treede et al., 2015), SNOMED (Stearns et al., 2001), etc, which are medical ontologies, it’s of vital significance to model such ontologies. Take ICD-9 ontology as an example, which is an ontology tree as shown in Figure 3. Each leaf in the ICD-9 ontology tree is a standard diagnosis code, e.g., 004.0. This leaf node along with its ancestors denotes the hierarchical architecture. For instance, is the hierarchical architecture of the leaf 004.0. To distinguish the leaves with similar architectures and derive informative representations of diagnosis codes, we divide the hierarchical architecture of leaves into two parts: semantics and hierarchy.
-
•
Semantics. Each node in the ontology represents a unique medical term. For example, 580-629 denotes Diseases Of The Genitourinary System, 590-599 denotes Other Diseases Of Urinary System and 590.81 denotes Pyelitis or pyelonephritis in diseases classified elsewhere.
-
•
Hierarchy. Hierarchy is the path in the diagnosis ontology tree from Root to the leaf. For example, the leaves 004.0, 004.1 and 590.2 have similar hierarchies because their paths are similar.
Semantics aims to capture the medical semantics of the diagnosis code, and the hierarchy is used to depict the diagnosis ontology tree. We employ Node2Vec and GloVe to derive the representation of the diagnosis codes from two perspectives, respectively.
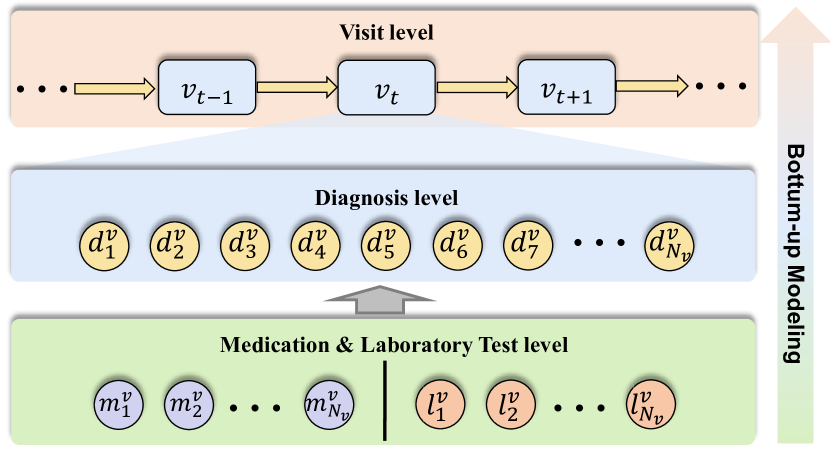
In addition to the hierarchical ontology architecture for diagnosis codes, there exists another hierarchy among different medical codes. Specifically, in a patient’s visit to the hospital, a set of diagnosis codes are assigned to record the presence of diseases, medications are prescribed to cure the disease and laboratory tests are used to help confirm the diagnosis of a disease. Similar to MiME (Choi et al., 2018), we define the hierarchy levels for visit-level representation: Medications | Laboratory tests Diagnoses Visits, as illustrated in Figure 4.
Given a visit of patient , the modeling of visit-level features is as follows.
| (2) |
| (3) |
where and are the features of medication codes and laboratory codes for visit of patient , respectively. and denote the medication codes and laboratory test codes. and correspond to the one-hot representations for medical codes, more concretely, for medication codes and laboratory test codes. , and are the weights and biases to derive the medication features and laboratory test features, respectively.
| (4) |
Similarly, the features for diagnosis codes are also obtained by a linear function. Different from medication codes and laboratory test codes, for diagnosis codes aggregated below:
| (5) |
where denotes the aggregation function and in general, we take mean as the aggregation function. denotes the hierarchical modeling for diagnosis codes, which is calculated as:
| (6) |
| (7) |
| (8) |
is the concatenate function. denotes the Node2Vec model and denotes the GloVe model. in Equation 7 is the ontology graph of diagnosis ontology. in Equation 8 is the sentence formed by the semantics of the diagnosis codes in the visit.
Finally, we obtain the visit-level features from the features of diagnosis codes, medication codes, and laboratory test codes.
| (9) |
| (10) |
where is the intermediate feature that encodes the medication codes and laboratory test codes and is the final visit-level features.
Hierarchy for visit-level features
By doing so, we have attained the visit-level features. In the next step, we shall derive the patient-level features and construct a patient similarity task to make the features informative correspondingly.
3.2.2. Reverse time attention for patient-level features
We need to make sure that the visit-level features learned in CORE manage to capture the similarity semantics for patients so that we can obtain cohorts from the visit-level features. We devise a patient similarity task to achieve this goal. First, we define the similarity between patients as the Jaccard similarity of their diagnosis codes with all their visits.
| (11) |
where is the Jaccard similarity function, denotes all the diagnosis codes among all the visits of patient .
Then for each patient, to make the labels balanced and volume appropriate, we select the most similar 5 patients as the positive samples and randomly select 5 negative samples from the remaining patients. To learn comprehensive patient-level features, we propose to adopt the reverse time attention mechanism suggested by RETAIN (Choi et al., 2016b), based on the rationale that in clinical practice, doctors will check a patient’s medical history for accurate diagnosis, and the closer a historical visit is, the more important the visit is. Therefore, we take the reverse time order of the visits to calculate the attention for each visit and finally obtain the patient-level features.
| (12) |
| (13) |
| (14) |
where is used to compute the reverse time features for each visit, and are used to map the reverse time features to a scalar which is then used by the function to derive the attention. Subsequently, the patient-level feature is obtained:
| (15) |
Such patient-level features will be used to predict whether two patients are similar against the labels we defined before. Below is the loss function for the patient similarity task.
| (16) |
| (17) |
where is the perdiction for similarity between patient and , is the classifier. is the loss for pre-context task, is the Binary Cross Entropy loss (Ruby and Yendapalli, 2020) function, is the truth label for patient and , which we obtain before according to patients’ similarity.
While training on the patient similarity task, we obtain cohorts from the patient-level features in the meanwhile which will be used in the downstream task via clustering:
| (18) |
where denotes all the learned cohorts, represents the features of patients.
3.3. Cohort Modeling Module
Cohorts play a crucial role in EHR analysis in healthcare. However, traditional cohorts are coarse-grained and mainly constrained to capturing intra-cohort information.
After we obtain the fine-grained cohort information at patient-level from the pre-context module, we set to build the intra-cohort and inter-cohort to maximally utilize the EHR data for healthcare tasks. Note that if visit-level cohorts are desired, we can use the visit-level representations before the reverse time attention mechanism.
3.3.1. Individual Representation Learning
Before we construct the cohort, we first extract the individual EHR data representation as the patient-level embedding. Given a patient , the initial representation is learned as follows:
3.3.2. Intra-cohort Module
To model the interaction of visits in the same cohort, we view each cohort as a graph, in which each node represents a visit. We then use the graph aggregation method to update the nodes. In the graph, every pair of nodes is connected. To take advantage of the information of similar patients, we propose to utilize two hyperparameters and to obtain dynamic neighbors. For a node in the graph, we continuously select the nearest neighbors until the number of selected neighbors reaches , under the premise that the similarity between the node and the selected neighbor is no lower than , just as the following equation.
| (20) |
where denotes the selected neighbors for the patient . denotes the nearest candidate neighbor. is the cohort to which the patient belongs, excluding itself. Subsequently, we employ the function as the function to aggregate the representations from selected neighbors to update the representation of .
| (21) |
3.3.3. Inter-cohort Module
After we obtain the intra-cohort information for each visit, we want to capture the inter-cohort information, which reflects the difference between cohorts. We view the centroid of each cohort as a node in the inter-cohort graph. To model the edge relationships, we select the nearest neighbors for each node and connect them in the graph, with as a hyperparameter to specify. We then employ the GCN method to derive the representation of each node in the graph.
| (22) |
Finally, we integrate the information from the initial representations by backbones, intra-cohort graph, and inter-cohort graph based on learnable attention as the final representation, which serves as the enhanced EHR data representation for the downstream healthcare tasks.
| (23) |
| (24) |
| (25) |
where is the final representation for prediction, and are the attention for intra-cohort and inter-cohort representations, respectively. We utilize a learnable attention mechanism with softmax function and MLP to learn attention. Finally, the loss function for CORE is as follows.
| (26) |
where is the loss function of the downstream task, more specifically, readmission prediction with the loss function. is the hyperparameter for the loss of the pre-context task, which is set to 0.1 in our experiments. Let denote the classifier adopted in the downstream task. The overall loss function is expressed as:
| (27) |
4. Experiments
In this section, we describe the two datasets for evaluation and introduce the backbones and baselines adopted for comparison with CORE. We then describe the experimental settings and present the experimental results.
4.1. Datasets
-
•
MIMIC-III (Johnson et al., 2016): MIMIC-III is a large public medical database, which consists of 58,976 unique hospital admissions from 38,597 patients in the Beth Israel Deaconess Medical Center between 2001 and 2012. Each admission contains a varying number of ICD-9 diagnosis codes, medication codes, and laboratory test codes. There are 2,083,180 de-identified notes associated with the admissions.
-
•
UCI Diabetes - Machine Learning Repository (Strack et al., 2014): The dataset is a public medical dataset, which is prepared to analyze factors related to readmission as well as other outcomes pertaining to patients with diabetes. This dataset records 10 years (1999-2008) of clinical care at 130 US hospitals and integrated delivery networks. UCI Diabetes includes over 50 features representing patient and hospital outcomes. It is comprised of 71,518 patients and 101,767 visits, where each visit contains at most 3 diagnosis codes. The diagnosis codes are ordered by importance, i.e., the first diagnosis code is the primary diagnosis for the patient.
The detailed statistics of both datasets are listed in Table 1. We note that the UCI Diabetes dataset does not contain any medications or laboratory test codes; hence, we drop some backbones which are related to the modeling of the two kinds of medical codes.
| Dataset | UCI Diabetes | MIMIC-III |
| # of patients | 71580 | 38597 |
| # of visits | 101767 | 53423 |
| Avg. # of visits per patient | 1.42 | 1.38 |
| # of unique diagnosis codes | 915 | 6984 |
| # of unique medication codes | 0 | 4686 |
| # of unique laboratory test codes | 0 | 726 |
| Avg. # of diagnosis codes per visit | 2.98 | 12.2 |
| Avg. # of medication codes per visit | 0 | 78 |
| Avg. # of laboratory test codes per visit | 0 | 521 |
4.2. Backbones and Baselines
CORE targets to capture the essential cohort information and encode it into representations. Our pre-context task extracts cohorts from medical codes; therefore, we need to consider the representations from backbones with/without the information of medical codes to validate the effectiveness of CORE. We select the following traditional or state-of-the-art methods as the backbones to calculate the initial representations.
-
•
Med2Vec (Choi et al., 2016a): Med2Vec not only models the co-occurrence information of medical codes but also constructs a hierarchical structure with a sequential order of visits to learn the representations. We consider it a traditional method.
-
•
MiME (Choi et al., 2018): MiME constructs a hierarchical architecture that splits the representations into treatment level, diagnosis level, visit level, and patient level, to render the learned representations interpretable and effective. There are no treatment-level codes in the UCI Diabetes dataset; therefore, we change the operation of interactions between the diagnosis level and the treatment level to diagnosis pair-wise interactions.
-
•
ClinicalBERT (Huang et al., 2019): ClinicalBERT is an application of BERT on healthcare, which only takes into account medical notes. In view of the long sequence of medical notes, ClinicalBERT splits the medical notes of a visit into fixed-length slices, meaning that the slices within a visit or a patient share the same label. Predictions for patients are computed by binning the predictions on each slice.
| Model | MIMIC-III Dataset | ||||
|---|---|---|---|---|---|
| AUPRC | Accuracy | Precision | Recall | F1 | |
| ClinicalBERT (Huang et al., 2019) | 0.630 | 58.7% | 0.602 | 0.676 | 0.637 |
| + KNN | 0.628 | 58.6% | 0.604 | 0.665 | 0.632 |
| + K-Means | 0.629 | 58.4% | 0.601 | 0.663 | 0.631 |
| + GRASP | 0.618 | 56.2% | 0.617 | 0.479 | 0.539 |
| + CORE(Ours) | 0.658 | 60.6% | 0.645 | 0.629 | 0.637 |
| Med2Vec (Choi et al., 2016a) | 0.540 | 57.4% | 0.592 | 0.325 | 0.419 |
| + KNN | 0.553 | 57.1% | 0.550 | 0.360 | 0.435 |
| + K-Means | 0.543 | 54.9% | 0.536 | 0.360 | 0.430 |
| + GRASP | 0.536 | 55.1% | 0.541 | 0.346 | 0.422 |
| + CORE(Ours) | 0.605 | 59.7% | 0.593 | 0.474 | 0.527 |
| MiME (Choi et al., 2018) | 0.542 | 57.0% | 0.574 | 0.355 | 0.439 |
| + KNN | 0.535 | 57.0% | 0.564 | 0.404 | 0.471 |
| + K-Means | 0.540 | 56.8% | 0.565 | 0.382 | 0.455 |
| + GRASP | 0.556 | 58.6% | 0.587 | 0.430 | 0.496 |
| + CORE(Ours) | 0.595 | 60.5% | 0.584 | 0.579 | 0.581 |
Further, we adopt KNN, K-Means, and GRASP as baselines for comparison with our proposed CORE.
-
•
KNN: For each node, KNN selects the nearest nodes as its candidate neighbors. KNN is employed with the mean function to update the representation of the center node.
-
•
K-Means: K-Means divides all the nodes into groups. The nodes in the same group share the same neighbors. We will randomly select neighbors to update the representation of the center node. We note that the number of clusters in K-Means is the same as the number of cohorts in CORE and the number of selected neighbors in K-Means is the same as that in the intra-cohort modeling of the Cohort Modeling Module.
-
•
GRASP (Zhang et al., 2021): GRASP is designed to utilize the information of similar patients. GRASP obtains cohorts from the representations of backbones via the Gumbel-Max technique and employs GCN with an inter-cohort graph to enhance representation learning. But GRASP only considers the relationship between cohorts, which limits the performance.
4.3. Experimental Settings
4.3.1. Readmission Prediction
We investigate the readmission prediction task on both datasets. UCI Diabetes dataset is collected to analyze factors related to readmission as well as other outcomes pertaining to patients with diabetes. Given a visit, we need to predict whether the patient will be readmitted to the hospital within 30 days. MIMIC-III is a large EHR dataset without the readmission labels, so we calculate the label for each visit. Similarly, given a visit, the target is to predict whether a patient will be readmitted to the hospital in 30 days.
4.3.2. Experimental Setup
We train the Pre-context Task Module and Cohort Module in parallel. For deriving the cohorts, we employ the agglomerative clustering and adjust the number of cohorts to explore the influence of the size of cohorts. In the Cohort Modeling Module, we select from 0.99 to 0.81 and from 5 to 50 to control the number of selected neighbors in the intra-cohort graph and select from 5 to 50 to explore the relationship between different cohorts. In addition, in the Cohort Modeling Module, we use the Adam optimizer with the initial learning rate . We randomly split each dataset into training, validation, and test sets with a ratio of 8: 1: 1. We train 50 epochs in all datasets. For each model on each dataset, we report , , , , and score to evaluate the performance of the models.
| Model | UCI Diabetes Dataset | ||||
|---|---|---|---|---|---|
| AUPRC | Accuracy | Precision | Recall | F1 | |
| Med2Vec (Choi et al., 2016a) | 0.533 | 54.4% | 0.539 | 0.506 | 0.522 |
| + KNN | 0.535 | 50.7% | 0.499 | 0.571 | 0.533 |
| + K-Means | 0.529 | 50.7% | 0.499 | 0.585 | 0.539 |
| + GRASP | 0.534 | 53.0% | 0.524 | 0.492 | 0.507 |
| + CORE(Ours) | 0.552 | 55.3% | 0.539 | 0.626 | 0.579 |
| MiME (Choi et al., 2018) | 0.531 | 54.2% | 0.535 | 0.524 | 0.530 |
| + KNN | 0.553 | 54.8% | 0.549 | 0.453 | 0.497 |
| + K-Means | 0.555 | 54.8% | 0.548 | 0.461 | 0.501 |
| + GRASP | 0.533 | 54.7% | 0.542 | 0.508 | 0.525 |
| + CORE(Ours) | 0.555 | 55.1% | 0.550 | 0.478 | 0.511 |
Example of ICD-9
| Model | Modules | MIMIC-III Dataset | ||||
|---|---|---|---|---|---|---|
| AUPRC | Accuracy | F1 | ||||
| - | \faCheckCircle | \faCheckCircle | 0.635 | 58.2% | 0.613 | |
| - | \faCheckCircle | \faCheckCircle | 0.630 | 58.3% | 0.630 | |
| - | \faCheckCircle | \faCheckCircle | 0.656 | 58.1% | 0.605 | |
| \faCheckCircle | \faCheckCircle | \faCheckCircle | 0.658 | 60.6% | 0.637 | |
4.4. Overall Performance
The overall quantitative results of our framework CORE and baselines on the test set of the MIMIC-III dataset and the UCI Diabetes dataset are shown in Table 2 and Table 3, respectively. From these tables, we have the following findings:
-
•
In general, CORE achieves the best performance on all the metrics compared to state-of-the-art baselines on both datasets. In particular, grounded on the backbone Med2Vec (Choi et al., 2018), CORE outperforms the other baselines in terms of AUPRC by a large margin on the MIMIC-III dataset from 5.2% 6.9%. Notably, the performance improvement on MIMIC-III is more significant than that on the UCI Diabetes (UCI Diabetes: 1.7% 2.3%). The reason for this phenomenon lies in that the patients with the same disease tend to exhibit higher similarity, i.e., the pre-extracted patient representations are fairly similar in the implicit semantic space that is sufficiently informative for prediction. Despite this, CORE demonstrates its superiority over the backbone and other cohort clustering baselines on the UCI Diabetes dataset.
-
•
It is worth noting that the performance of most of the cohort-based approaches yield improved performance over the general EHR data representation learning in the backbones, except for GRASP (Choi et al., 2017a), which demonstrates that appropriate cohort construction augments the EHR data representation learning, thereby yielding accurate prediction in readmission prediction. However, compared with backbones, the performance improvement of GRASP is insignificant, even worse than backbones (e.g., Row 1 vs Row 4 in Table.2). We conjecture the reason is that GRASP measures the patient similarity via simple clustering, and only utilizes inter-cohort relationships. As a consequence, GRASP fails to model the cohort information in a fine-grained level for accurate readmission prediction.
-
•
CORE consistently outperforms all the baselines when using different backbones on both datasets. However, we observe that KNN and K-Means are competitive with CORE on the UCI Diabetes dataset using the backbone MiME. It’s reasonable because we implement the pair-wise diagnosis interactions with MiME on the UCI Diabetes dataset. This means that the implicit information between diagnosis codes can be incorporated, functioning similarly to our Pre-context Task Module. In this sense, KNN or K-Means resembles our intra-cohort graph module, which could account for their achieved competitive performance.
| Model | Cohort Index | ||||
|---|---|---|---|---|---|
| 117 | 277 | 246 | 450 | 812 | |
| 77.8% | 75.6% | 79.4% | 75.6% | 58.1% | |
| GRASP | 69.4% | 69.8% | 88.2% | 66.7% | 66.1% |
| CORE (Ours) | 85.7% | 79.4% | 91.8% | 81.8% | 69.4% |
4.5. Ablation Study
We conduct an ablation study on the MIMIC-III dataset to evaluate the importance of each module of CORE with the experimental results shown in Table 4. Comparing CORE and CORE(-) (Row 1 vs Row 4), the Pre-context Task Module significantly contributes to 2.3%, 2.4% and 2.4% improvement in terms of AUPRC, Accuracy and F1, respectively. The Intra-cohort Module encodes the information of similar patients, while the Inter-cohort Module captures the difference among cohorts. The results of Row 2 and Row 3 in Table 4 severally show the performance improvement brought by the Intra-cohort Module and the Inter-cohort Module. Particularly, the huge performance drop caused by removing the Intra-cohort Module confirms the necessity of unveiling the implicit information in similar patients. In a nutshell, these results validate the importance of different modules in CORE for accurate EHR analysis.
4.6. Sensitivity Study
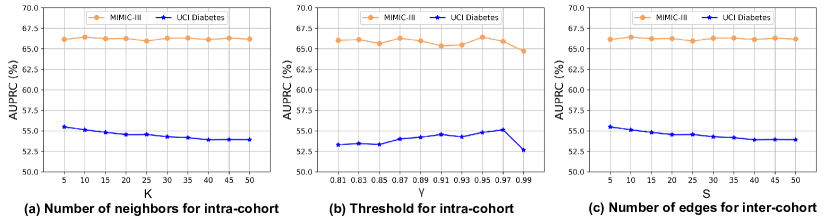
Effects of Hyperparameters , and . We investigate the impact of several crucial hyperparameters on the performance of CORE: the number of neighbors considered in Intra-cohort Module , the similarity threshold in Intra-cohort Module and the number of neighbors modeled in Inter-cohort Module . The AUPRC results of varying these hyperparameters on both datasets are shown in Figure 5. From this figure, we observe an interesting phenomenon that the performance of CORE fluctuates on the MIMIC-III dataset when setting different hyper-parameters. On the contrary, the three figures suggest that the optimal choice of , and are around 5, 0.97 and 5, respectively, either increasing or decreasing these values will result in a performance decay.
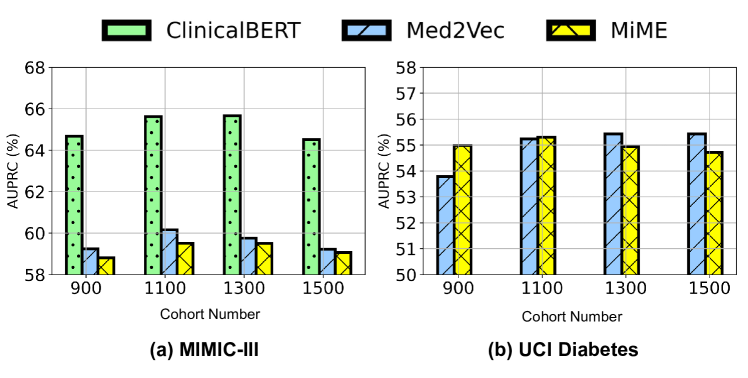
Effects of Cohort Number. In this experiment, we evaluate the impact of cohort numbers. on both datasets. The corresponding experimental results are illustrated in Figure 6. It is clearly shown that the performance of all evaluated models first increases and then decreases as the number of cohorts increases. The reason for such phenomena is related to the target of CORE, i.e., extracting the information of cohorts to integrate with backbones with boosted performance. If the number of cohorts is smaller, it is harder for the inter-cohort graph to model the difference between cohorts, and the size of cohorts tends to be larger and it’s more likely to aggregate dissimilar patients, which leads to noisy information when utilizing the cohorts. On the other hand, with the number of cohorts increasing, fewer patients will be assigned to a cohort, which may result in inadequate cohort information. Therefore, the number of cohorts exerts a vitally important influence on the readmission prediction performance on both datasets.
4.7. Case Study
Traditional Cohorts vs CORE. To probe into the superiority of CORE over the traditional medical cohort construction, we further conduct experiments for cohort comparison. We follow the commonly employed cohort division method to extract the medical cohort. Concretely, in our experiment, we choose gender (G), age (A) and both of them (G&A) as three cohort construction criteria. The comparison results between these medical cohort construction methods and CORE are displayed in Table 6. As shown, traditional medical cohorts tend to exhibit similar performance to that of the backbones, some of which are even less accurate than the backbones. This is mainly because the medical cohort construction merely relies on a single feature, resulting in a coarse-grained cohort that is effective enough for cohort pattern mining. Our framework CORE, on the contrary, leverages a patient’s sequential visit-level representations from both the intra-cohort and the inter-cohort perspectives at a fine-grained level, thereby boosting the prediction accuracy.
Cohort Case Study. To systematically evaluate the benefits of our proposed strategy of cohort construction, we conduct a cohort case study that chooses five random cohorts with 267 patients from the MIMIC-III dataset. Specifically, we compare the medical cohorts that are split by age, the semantic clustering-based method GRASP (Biswal et al., 2017) and CORE. The results are illustrated in Table 5. We observe that CORE achieves the highest accuracy in all the selected cohorts. GRASP yields worse performance than in 3 out of 5 cohorts because GRASP derives cohorts from the representations of backbones via a clustering technique. obtains cohorts according to age, which is a simple but meaningful strategy since age is a significant predisposing factor for different kinds of diseases. However, lacks other medical information about the cohorts, which may limit performance. Summing up, CORE not only derives a fine-grained cohort construction based on the prior knowledge of medical and diagnosis code, but also exploits the intra-cohort and inter-cohort information, which yield an augmented EHR data representation learning for facilitating healthcare.
| Model | MIMIC-III Dataset | ||||
|---|---|---|---|---|---|
| AUPRC | Accuracy | Precision | Recall | F1 | |
| ClinicalBERT | 0.630 | 58.7% | 0.602 | 0.676 | 0.637 |
| + | 0.629 | 58.5% | 0.599 | 0.678 | 0.636 |
| + | 0.631 | 58.3% | 0.598 | 0.676 | 0.635 |
| + | 0.626 | 58.4% | 0.599 | 0.677 | 0.636 |
| + CORE (Ours) | 0.658 | 60.6% | 0.645 | 0.629 | 0.637 |
| Med2Vec | 0.533 | 54.4% | 0.539 | 0.506 | 0.522 |
| + | 0.536 | 54.2% | 0.529 | 0.530 | 0.523 |
| + | 0.538 | 53.2% | 0.519 | 0.598 | 0.536 |
| + | 0.535 | 52.8% | 0.517 | 0.564 | 0.531 |
| + CORE (Ours) | 0.552 | 55.3% | 0.539 | 0.626 | 0.579 |
5. Conclusions
Cohort information is essential in EHR analysis in boosting analytic performance. However, two key desiderata, namely fine-grained cohort division and intra-cohort and inter-cohort information exploitation, are not well fulfilled in prior studies. To bridge this gap, we propose CORE, a universal cohort-based representation enhancement framework for EHR data representation learning. CORE derives cohorts from a Pre-context Task Module and then encodes the information of cohorts from intra-cohort and inter-cohort perspectives in a Cohort Module. Extensive experimental results show that CORE outperforms baselines on top of multiple backbones, and provide valuable medical insights into EHR analysis.
References
- (1)
- Baytas et al. (2017) Inci M Baytas, Cao Xiao, Xi Zhang, Fei Wang, Anil K Jain, and Jiayu Zhou. 2017. Patient subtyping via time-aware LSTM networks. In Proceedings of the 23rd ACM SIGKDD international conference on knowledge discovery and data mining. 65–74.
- Biswal et al. (2017) Siddharth Biswal, Joshua Kulas, Haoqi Sun, Balaji Goparaju, M Brandon Westover, Matt T Bianchi, and Jimeng Sun. 2017. SLEEPNET: automated sleep staging system via deep learning. arXiv preprint arXiv:1707.08262 (2017).
- Bouvrie (2006) Jake Bouvrie. 2006. Notes on convolutional neural networks. (2006).
- Cheng et al. (2016) Yu Cheng, Fei Wang, Ping Zhang, and Jianying Hu. 2016. Risk prediction with electronic health records: A deep learning approach. In Proceedings of the 2016 SIAM international conference on data mining. SIAM, 432–440.
- Choi et al. (2016a) Edward Choi, Mohammad Taha Bahadori, Elizabeth Searles, Catherine Coffey, Michael Thompson, James Bost, Javier Tejedor-Sojo, and Jimeng Sun. 2016a. Multi-layer representation learning for medical concepts. In proceedings of the 22nd ACM SIGKDD international conference on knowledge discovery and data mining. 1495–1504.
- Choi et al. (2017a) Edward Choi, Mohammad Taha Bahadori, Le Song, Walter F Stewart, and Jimeng Sun. 2017a. GRAM: graph-based attention model for healthcare representation learning. In Proceedings of the 23rd ACM SIGKDD international conference on knowledge discovery and data mining. 787–795.
- Choi et al. (2016b) Edward Choi, Mohammad Taha Bahadori, Jimeng Sun, Joshua Kulas, Andy Schuetz, and Walter Stewart. 2016b. Retain: An interpretable predictive model for healthcare using reverse time attention mechanism. Advances in neural information processing systems 29 (2016).
- Choi et al. (2017b) Edward Choi, Siddharth Biswal, Bradley Malin, Jon Duke, Walter F Stewart, and Jimeng Sun. 2017b. Generating multi-label discrete patient records using generative adversarial networks. In Machine learning for healthcare conference. PMLR, 286–305.
- Choi et al. (2018) Edward Choi, Cao Xiao, Walter Stewart, and Jimeng Sun. 2018. Mime: Multilevel medical embedding of electronic health records for predictive healthcare. Advances in neural information processing systems 31 (2018).
- Choi et al. (2016c) Youngduck Choi, Chill Yi-I Chiu, and David Sontag. 2016c. Learning low-dimensional representations of medical concepts. AMIA Summits on Translational Science Proceedings 2016 (2016), 41.
- Esteban et al. (2017) Cristóbal Esteban, Stephanie L Hyland, and Gunnar Rätsch. 2017. Real-valued (medical) time series generation with recurrent conditional gans. arXiv preprint arXiv:1706.02633 (2017).
- Goodfellow et al. (2020) Ian Goodfellow, Jean Pouget-Abadie, Mehdi Mirza, Bing Xu, David Warde-Farley, Sherjil Ozair, Aaron Courville, and Yoshua Bengio. 2020. Generative adversarial networks. Commun. ACM 63, 11 (2020), 139–144.
- Gumbel (1954) Emil Julius Gumbel. 1954. Statistical theory of extreme values and some practical applications: a series of lectures. Vol. 33. US Government Printing Office.
- Hou et al. (2020) Nianzong Hou, Mingzhe Li, Lu He, Bing Xie, Lin Wang, Rumin Zhang, Yong Yu, Xiaodong Sun, Zhengsheng Pan, and Kai Wang. 2020. Predicting 30-days mortality for MIMIC-III patients with sepsis-3: a machine learning approach using XGboost. Journal of translational medicine 18, 1 (2020), 1–14.
- Huang et al. (2019) Kexin Huang, Jaan Altosaar, and Rajesh Ranganath. 2019. Clinicalbert: Modeling clinical notes and predicting hospital readmission. arXiv preprint arXiv:1904.05342 (2019).
- Johnson et al. (2016) Alistair EW Johnson, Tom J Pollard, Lu Shen, Li-wei H Lehman, Mengling Feng, Mohammad Ghassemi, Benjamin Moody, Peter Szolovits, Leo Anthony Celi, and Roger G Mark. 2016. MIMIC-III, a freely accessible critical care database. Scientific data 3, 1 (2016), 1–9.
- Lasko et al. (2013) Thomas A Lasko, Joshua C Denny, and Mia A Levy. 2013. Computational phenotype discovery using unsupervised feature learning over noisy, sparse, and irregular clinical data. PloS one 8, 6 (2013), e66341.
- LeCun et al. (1998) Yann LeCun, Léon Bottou, Yoshua Bengio, and Patrick Haffner. 1998. Gradient-based learning applied to document recognition. Proc. IEEE 86, 11 (1998), 2278–2324.
- Li et al. (2020) Yikuan Li, Shishir Rao, José Roberto Ayala Solares, Abdelaali Hassaine, Rema Ramakrishnan, Dexter Canoy, Yajie Zhu, Kazem Rahimi, and Gholamreza Salimi-Khorshidi. 2020. BEHRT: transformer for electronic health records. Scientific reports 10, 1 (2020), 1–12.
- Ma et al. (2017) Fenglong Ma, Radha Chitta, Jing Zhou, Quanzeng You, Tong Sun, and Jing Gao. 2017. Dipole: Diagnosis prediction in healthcare via attention-based bidirectional recurrent neural networks. In Proceedings of the 23rd ACM SIGKDD international conference on knowledge discovery and data mining. 1903–1911.
- Ma et al. (2018) Fenglong Ma, Quanzeng You, Houping Xiao, Radha Chitta, Jing Zhou, and Jing Gao. 2018. Kame: Knowledge-based attention model for diagnosis prediction in healthcare. In Proceedings of the 27th ACM International Conference on Information and Knowledge Management. 743–752.
- Mikolov et al. (2013) Tomas Mikolov, Ilya Sutskever, Kai Chen, Greg S Corrado, and Jeff Dean. 2013. Distributed representations of words and phrases and their compositionality. Advances in neural information processing systems 26 (2013).
- Miotto et al. (2016) Riccardo Miotto, Li Li, Brian A Kidd, and Joel T Dudley. 2016. Deep patient: an unsupervised representation to predict the future of patients from the electronic health records. Scientific reports 6, 1 (2016), 1–10.
- Niwattanakul et al. (2013) Suphakit Niwattanakul, Jatsada Singthongchai, Ekkachai Naenudorn, and Supachanun Wanapu. 2013. Using of Jaccard coefficient for keywords similarity. In Proceedings of the international multiconference of engineers and computer scientists, Vol. 1. 380–384.
- Quan et al. (2005) Hude Quan, Vijaya Sundararajan, Patricia Halfon, Andrew Fong, Bernard Burnand, Jean-Christophe Luthi, L Duncan Saunders, Cynthia A Beck, Thomas E Feasby, and William A Ghali. 2005. Coding algorithms for defining comorbidities in ICD-9-CM and ICD-10 administrative data. Medical care (2005), 1130–1139.
- Rasmy et al. (2021) Laila Rasmy, Yang Xiang, Ziqian Xie, Cui Tao, and Degui Zhi. 2021. Med-BERT: pretrained contextualized embeddings on large-scale structured electronic health records for disease prediction. NPJ digital medicine 4, 1 (2021), 1–13.
- Ruby and Yendapalli (2020) Usha Ruby and Vamsidhar Yendapalli. 2020. Binary cross entropy with deep learning technique for image classification. Int. J. Adv. Trends Comput. Sci. Eng 9, 10 (2020).
- Shang et al. (2019) Junyuan Shang, Tengfei Ma, Cao Xiao, and Jimeng Sun. 2019. Pre-training of graph augmented transformers for medication recommendation. arXiv preprint arXiv:1906.00346 (2019).
- Stearns et al. (2001) Michael Q Stearns, Colin Price, Kent A Spackman, and Amy Y Wang. 2001. SNOMED clinical terms: overview of the development process and project status.. In Proceedings of the AMIA Symposium. American Medical Informatics Association, 662.
- Strack et al. (2014) Beata Strack, Jonathan P DeShazo, Chris Gennings, Juan L Olmo, Sebastian Ventura, Krzysztof J Cios, and John N Clore. 2014. Impact of HbA1c measurement on hospital readmission rates: analysis of 70,000 clinical database patient records. BioMed research international 2014 (2014).
- Suo et al. (2018) Qiuling Suo, Fenglong Ma, Ye Yuan, Mengdi Huai, Weida Zhong, Jing Gao, and Aidong Zhang. 2018. Deep patient similarity learning for personalized healthcare. IEEE transactions on nanobioscience 17, 3 (2018), 219–227.
- Treede et al. (2015) Rolf-Detlef Treede, Winfried Rief, Antonia Barke, Qasim Aziz, Michael I Bennett, Rafael Benoliel, Milton Cohen, Stefan Evers, Nanna B Finnerup, Michael B First, et al. 2015. A classification of chronic pain for ICD-11. Pain 156, 6 (2015), 1003.
- Wang et al. (2019) Shanshan Wang, Pengjie Ren, Zhumin Chen, Zhaochun Ren, Jun Ma, and Maarten de Rijke. 2019. Order-free medicine combination prediction with graph convolutional reinforcement learning. In Proceedings of the 28th ACM International Conference on Information and Knowledge Management. 1623–1632.
- Wynants et al. (2020) Laure Wynants, Ben Van Calster, Gary S Collins, Richard D Riley, Georg Heinze, Ewoud Schuit, Marc MJ Bonten, Darren L Dahly, Johanna A Damen, Thomas PA Debray, et al. 2020. Prediction models for diagnosis and prognosis of covid-19: systematic review and critical appraisal. bmj 369 (2020).
- Yan et al. (2020) Li Yan, Hai-Tao Zhang, Jorge Goncalves, Yang Xiao, Maolin Wang, Yuqi Guo, Chuan Sun, Xiuchuan Tang, Liang Jing, Mingyang Zhang, et al. 2020. An interpretable mortality prediction model for COVID-19 patients. Nature machine intelligence 2, 5 (2020), 283–288.
- Zhang et al. (2021) Chaohe Zhang, Xin Gao, Liantao Ma, Yasha Wang, Jiangtao Wang, and Wen Tang. 2021. GRASP: Generic Framework for Health Status Representation Learning Based on Incorporating Knowledge from Similar Patients. In Proceedings of the AAAI Conference on Artificial Intelligence, Vol. 35. 715–723.
- Zhu et al. (2016) Zihao Zhu, Changchang Yin, Buyue Qian, Yu Cheng, Jishang Wei, and Fei Wang. 2016. Measuring patient similarities via a deep architecture with medical concept embedding. In 2016 IEEE 16th International Conference on Data Mining (ICDM). IEEE, 749–758.