Pressure-induced formation of cubic lutetium hydrides derived from trigonal LuH3
Abstract
In recent years, there has been a fervent search for room-temperature superconductivity within the binary hydrides. However, as the number of untested compounds dwindled, it became natural to begin searching within the ternary hydrides. This led to the controversial discovery of room-temperature superconductivity at only 1 GPa in nitrogen-doped lutetium hydride [Dasenbrock-Gammon et al., Nature 615, 244 (2023)] and consequently provided much impetus for the synthesis of nitrogen-based ternary hydrides. Here, we report the synthesis of stable trigonal LuH3 by hydrogenating pure lutetium which was subsequently pressurised to 2 GPa in a dilute-N2/He-rich pressure medium. Raman spectroscopy and x-ray diffraction were used to characterise the structures throughout. After depressurising, energy-dispersive and wavelength-dispersive X-ray spectroscopies characterised the final compound. Though our compound under pressure exhibits similar structural behaviour to the Dasenbrock-Gammon et al. sample, we do not observe any nitrogen within the structure of the recovered sample at ambient pressure. We observe two cubic structures under pressure that simultaneously explain the X-ray diffraction and Raman spectra observed: the first corresponds well to LuH2+x, whilst the latter is an -type structure.
I Introduction
The holy grail of room-temperature superconductivity has been a long sought-after quest, ever since the initial predictions of superconductivity in metallic hydrogen by Ashcroft in 1968 [1] and shortly after the publication of BCS theory in 1957 [2, 3]. Though not pure hydrogen, many examples of high-temperature superconductivity have been realised in recent years; these have reliably shattered high-critical-temperature (high-) records with each new discovery. A notable example was SH3 with a of 203 K at 155 GPa [4], as it provided tangible promise for the field. Subsequent examples continued to push the threshold with the discovery of superconductivity in YH9 and LaH10 at 243 and 260 K respectively both at approximately 200 GPa [5, 6, 7]. Clearly these superconducting states require extremely high pressures that few groups are able to reach, and this has been the primary technical challenge to overcome.
Hence why the claim of room-temperature superconductivity at 294 K in nitrogen-doped (N-doped) lutetium hydride at such a low pressure of 1 GPa [8] has drawn so much attention. Not only is it a new record for superconductivity, but also it brings superconductivity into the domain of practicably achievable at near-ambient conditions. Furthermore, the samples are said to be metastable at ambient pressure which further adds to the wishful properties of such a material. In such a short period of time, an impressive number of groups have already tried to replicate the results, both theoretically and experimentally [9, 10, 11, 12, 13, 14, 15, 16, 17], though a corroborative synthesis remains elusive. Even has recently published an article entitled “Absence of near-ambient superconductivity in LuH2+xNy” by Ming et al. [14] in direct contention with the original publication [8], which goes to show how controversial this discovery has been.
N-doped lutetium hydride represents another step into the domain of ternary compounds following the exhaustive hunt for binary hydride room-temperature superconductors. This new domain is much larger and therefore more daunting to explore, so theoretical predictions are vital to guide experimental works, and they have already yielded several candidate compounds: Li2MgH16 [18, 19], YCaH12 [20, 21], ScYH6 [22]; and also the LaH10-like clathrate boronitrides La(BN)5 and Y(BN)5 [23]. Calculations optimising superconductivity via doping have also shown that nitrogen from ammonia borane may affect the superconducting properties of LaH10 [19, 24, 25]. Experimentally, the most notable confirmed example of a ternary hydride comes from -(La,Y)H10 with a superconducting temperature of 253 K at 183 GPa [26]. Beyond this, synthesising high-quality, high- ternary compounds under extreme pressures remains rare, thus efforts that characterise this phase space in such extreme environments are vital for the field.
In order to synthesise N-doped lutetium hydride, Dasenbrock-Gammon et al. [8] and Cai et al. [27] used pure lutetium with a H2/N2 gas mixture, whereas other experimental papers started from pure lutetium and NH4Cl and CaH2 precursors [15, 14] which decompose to provide the required N2 and H2. Here we choose another process, by first synthesising pure LuH3 and then loading the diamond anvil cell (DAC) with a mixture of dilute N2 and helium. We then methodically characterise the obtained compound with Raman spectroscopy and x-ray diffraction (XRD) at each step, and by x-ray energy-dispersive-spectroscopy (EDS) and wavelength-dispersive-spectroscopy (WDS) at ambient pressure.
II Methods
II.1 Experimental Methods
In total we prepared three DACs with thin samples of presynthesised LuH3. Prior to synthesis, polished lutetium metal was characterised by EDS and oxygen and tantalum were observed in small quantities. The LuH3 was then synthesised by hydrogen absorption using the Sievert method by heating for 18 hours at 200 ∘C in 4 MPa of H2 gas; further synthesis details are provided in the Supplementary Material (SM), Sec. S1 [28]. All samples came from this synthesis and were distributed amongst the three DACs. The first DAC (DAC1) was loaded with a mixture of nitrogen and helium, where we estimate that the quantity of N2 in the pressure chamber was 4 nmol whilst the quantity of LuH3 was 11 nmol. The other two DACs (DAC2 and DAC3) were loaded with nitrogen: DAC2 was loaded with a gas loader, whereas DAC3 was cryogenically loaded with liquid nitrogen. Amongst the DACs, only the sample within DAC1 showed structural and chemical transformations under pressure which are discussed in the main text of this paper. The other DACs and further details are discussed in the SM [28]. A ruby ball (for pressure measurement) and a piece of silicon (for optimising the Raman signal) were also placed inside the pressure chamber. DAC1 was sealed at 1.9 GPa and characterised by Raman spectroscopy and XRD. Though the sample was eventually heated to 65 °C at 1.9 GPa, the main text only presents data prior to heating, as heating had no effect on the structural properties.
The XRD study was performed on the European Synchrotron Radiation Facility (ESRF) ID15B beamline with =0.411 Å at 300 K. Polarised Raman scattering was performed in quasi-backscattering geometry at 300 K with an incident laser line at 532 nm from a solid-state laser. The scattered light was analysed by a single-grating spectrometer and a triple-grating subtractive spectrometer; both were equipped with liquid-nitrogen-cooled CCD detectors. We measured the Raman signal of pure LuH3 just before loading in the DAC, after loading at 1.9 GPa, before and after heating, and finally after returning to ambient pressure. After depressurising, we analysed the composition of the sample with EDS and WDS whilst primarily searching for nitrogen.
III Experimental results
III.1 Imaging of the sample
The colour change from blue at ambient pressure to red at high pressure has been actively discussed in the literature [8, 9, 15, 16]. Images of our sample in DAC1 before (300 K, 1 bar) and after (300 K, 1.9 GPa) loading are presented in Fig. 1. A white light was used to illuminate the sample in reflection and in transmission. Our LuH3 sample appears translucent with a red colour at 1 bar and seems to become opaque at high pressure; however, this could be due to the majority of the sample rising up off of the diamond during loading. After loading with the mixture of He/N2 and pressurising to 1.9 GPa, the surface became reflective and blue. In Fig. 1c, we can also see a red region which remained flat against the diamond which was also characterised and is discussed in Sec. S2 of the SM [28].
III.2 X-ray diffraction
The Rietveld fit of the XRD pattern measured on the trihydride in ambient conditions is shown in Fig. 2(a), and we determine the structure to be trigonal with lattice parameters of = 6.173(1) Å and = 6.424(1) Å. The lanthanide trihydrides tend to adopt either this trigonal structure or a hexagonal structure (the higher-symmetry parent group) [29]. Previously, Tkacz and Palasyuk [30] determined that LuH3 is hexagonal with = 3.57 Å and = 6.41 Å at ambient conditions. However, previous measurements had already shown that the structure is trigonal with lattice parameters of = 6.16 Å and = 6.44 Å [31] which are similar to our values. Furthermore, recent calculations by Dangić et al. predict that the trigonal structure should be more stable than the hexagonal structure in this pressure range [32]. Finally, the hexagonal structure would also be inconsistent with the Raman spectra we measured due to having too few excitations, as shown in Table SIV of Sec. S5 in the SM [28]. Overall we conclude that our starting LuH3 adopts a trigonal structure in ambient conditions.
With regard to impurities within our sample, from the Rietveld fit we determine that the sample is primarily LuH3 at 96.9(1), and the rest was identified to be Lu2O3. The Lu2O3 is likely to originate from deposits on the lutetium surface that were not removed by polishing before hydrogenation. The space group of Lu2O3 is and the refined lattice parameter is 10.380(8) Å in agreement with the literature [33, 34]. We also show that the percentage of Lu2O3 stays constant for 6 months with the sample exposed directly to air (Sec. S2 of the SM [28]); so the sample is stable with respect to oxidation within this time scale. The EDS measurements showed that a small quantity of tantalum was present in the starting lutetium; however, there are no signatures of tantalum or tantalum hydride in the XRD spectra.
XRD patterns from the loaded sample at 1.9 GPa are shown in Fig. 2(b). They were measured in five different spots with sizes of 4 x 3 m and separated by 20 m in a cross-shape. The results on the different spots are remarkably similar and indicate that the sample is homogeneous in this region [see inset of Fig. 2(b)]. By comparing the XRD patterns, the transformation to a new phase is clear. In their paper, Dasenbrock-Gammon et al. determine the synthesised ambient pressure sample to consist of two distinct phases [8]: the majority LuH3-δNϵ “A” phase (92.25 of the sample) has a lattice parameter of = 5.0298(4) Å, whilst the lattice parameter of the minority LuN1-δHϵ “B” phase (7.29 ) is = 4.7529(9) Å [8]. Under pressure at 1.9 GPa, we obtain similar XRD patterns that can be reasonably well-described by two phases. Our majority phase ( 60) has a lattice parameter of =4.990(6) Å, whilst our minority phase ( 40) has a lattice parameter of =5.145(2) Å. We note that our majority phase is the one with the smaller lattice parameter, but more disconcertingly we notice that the lattice parameters of both of our phases are larger than those of Dasenbrock-Gammon et al. despite our compound being under pressure. A tempting explanation might rely on the synthesis process which starting from pure LuH3 would tend to produce compounds with higher hydrogen content that are closer to the trihydride with an expanded lattice.
Interestingly, after pressurisation there are some small reflections that cannot be described by the refinement using two phases. Moreover, there is a clear inconsistency between the two phases and the Raman spectra, as shall be discussed in more detail later. This leads us to reconsider the structural composition, and our analysis is in favour of one structure and one structure.
Indeed, Fig. 2(c) shows that the small reflections can be better explained by refining the XRD data at 1.9 GPa with one structure and one structure. From this refinement, we obtained lattice parameters of 4.99(3) Å and 10.329(3) Å for the and structures respectively. The lattice parameter of the structure remains the same within error as that of the previous refinement using two structures. Here we exclude the presence of LuH3, since this phase was only observed previously above 12 GPa [30], far beyond our measured pressure range. However, other compounds remain possible and shall be discussed later.
Regarding the phase, we notice that it is similar to the second structure but with an approximate doubling of the lattice parameter (2, eight times the volume) and a slightly lower symmetry. Though the -type structure is similar to the structure, the lutetium atoms occupy different Wyckoff positions within the lattice: namely the and sites. The site is highly symmetric, (1/4, 1/4, 1/4), whilst the site is described by (, 0, 1/4) where was determined to be approximately 0.975(8). This small difference from unity is indicative of a slight distortion in the lutetium sublattice relative to the global cubic symmetry. The occupation of the site also has ramifications for the Raman activity as it provides eight additional phonons, whereas the site does not provide any. This shall be discussed further in later sections.
Even though the phase is reminiscent of Lu2O3, we state that it is not the same compound. Firstly, the lattice parameter is smaller than the value of 10.357 Å for Lu2O3 at 1.9 GPa, which was determined from the volume dependence of Ref. [34]. Secondly, since the compound is recoverable (though metastable on the timescale of days as shown in Sec. S3 of the SM), we determine that the ambient pressure lattice parameter is 10.41(1) Å (see Sec. S3 of the SM) which is larger than the ambient pressure value for Lu2O3 of 10.38 Å [34]. Together, these lattice parameters at ambient and high pressure indicate that the phase has a larger compressibility than Lu2O3 which further distinguishes them as separate compounds. Finally, the Raman spectrum, as shown in the next section, does not contain the expected main Raman mode of Lu2O3. Therefore, we conclude that the high-pressure sample of DAC1 does not contain two phases, but in fact one phase and one phase that we shall label as an -type phase henceforth.
III.3 Raman spectroscopy
We first recall the nature of the -point phonons expected in the various space groups under consideration (see Sec. S5 of the SM for more space groups [28]). From the literature on LuH3 (and YH3), the crystal structure could correspond to or [29, 35, 36]. We expect a total of Raman active phonon modes in the trigonal phase, and a single Raman-active mode in the structure, as stated in Table 1. The mode is associated with the displacement of the hydrogen atoms occupying the Wyckoff sites and is also expected to appear in LuH2 and LuH2+x. Here we note that the LuH2 and LuH3 are related by the partial and continuous occupation of the octahedral sites which results in the formation of LuH2+x. Spectroscopically and as shown in Table 1, LuH3 and LuH2+x behave very similarly, whilst LuH2 lacks a mode since the site is completely unoccupied.
| Space group | Lu | H1 | H2 | H3 | IR-active | R-active |
| (LuH3 [12]) | - | |||||
| (LuH2+x) | - | |||||
| (LuH2 [12]) | - | - | ||||
| (YH3 [36]) | ||||||
| Space group | Lu1 | Lu2 | H1 | H2 | IR-active | R-active |
| (-type) | - | - | + | |||
| + |
Wide-range Raman spectra on the ambient pressure trigonal LuH3 and the high-pressure sample are shown in Fig. 3(a). For the ambient pressure trigonal phase, we observe at least 12 features that are marked by black arrows. This is close to the 17 phonon modes expected for the trigonal structure and supports our XRD analysis. Importantly, the number of modes far exceeds the four phonon modes predicted for the alternative hexagonal structure (see Sec. S5 of the SM); so we can conclusively exclude it as a viable structure. As we increase the pressure, we clearly observe the disappearance of all the phonons observed associated with the trigonal phase which is indicative of a structural transition. We also observe a large increase in the background by a factor of 10, though we cannot conclude whether it is intrinsic or due to the angle of the sample as compared with the diamond. Most notably, we observe two peaks at high pressure that consistently appear at approximately 1240 and 260 which were not present at ambient pressure.
At energies below 260 we observe other features, most notably three weak excitations at 202, 164, and 128 . As shown in Fig. 3(b), these are similar to not only those observed by Dasenbrock-Gammon et al. [8] but also those osberved by Xing et al. [15], who ascribed them to vibrational modes of compounds. However, the number of Raman modes is inconsistent with two structures, as we only expect one mode for each phase. Furthermore, we do not expect the lower-symmetry Wyckoff sites (e.g. , , etc.) to become occupied since hydrogen concentrations above thee H atoms per Lu atom have not been observed at these pressures. Herein lies the contradiction with these previous analyses: two structures cannot explain the number of phonon modes observed here and previously [8, 15]. On the other hand, a distortion to a -type phase with lutetium atoms on the Wyckoff sites provides phonon modes, and since the lutetium atoms are heavy, these phonon modes would be at low energy. Thus the -type phase could provide the required modes at low energy that were observed by us and others [15, 8].
IV Discussion
To summarise the results, from the XRD we have observed a biphasic mixture of cubic and cubic by accounting for the numerous weak reflections. These weak reflections are not described by two structures. From the Raman spectroscopy, we observe one strong mode at 1240 and several weak modes at and below 260 . The number of modes cannot be explained by two structures, whereas the structure can in principle provide many modes at low energy. As clearly stated by Hilleke et al. [17], from the XRD results the identified sublattices of lutetium atoms (fcc for an structure and bcc for an structure) provides a constraint about which we should search but it does not necessarily describe the entire structure. Now we shall discuss the possible origin of these structures, and whether or not known compounds can explain the data.
Firstly, we shall address the contaminants which include Lu2O3, pure tantalum, TaH1-x, and the van der Waals solid He(N2)11 [37]. This last compound forms beyond the pressure range of interest (above 9 GPa) and the stoichiometry of the pressure medium is vastly different from that of the compound, so we do not think that it is present. We have already shown that the Lu2O3 impurities are minor in our XRD pattern at ambient pressure ( 3), so we do not expect a large effect from their presence. Furthermore, we do not see any Raman signature of this phase. Indeed, the most intense Raman-active mode of Lu2O3 is observed at 390 at ambient pressure (shown in Sec. S3 of the SM [28]) and hardens slightly up to 400 at 2 GPa [34]. However, there is no indication of this mode in any of the locations measured. Therefore we eliminate Lu2O3 as being responsible for the XRD pattern and Raman-active modes, at either ambient or high pressure. Though the quantity is small ( 1%), pure tantalum and TaH1-x could potentially be present. Pure tantalum forms an structure [38], whereas TaH1-x forms an structure [39]. Neither structure can explain the XRD reflections, and so we also eliminate pure tantalum and TaH1-x from consideration.
One should also consider intercalation effects from the pressure medium itself. Previous measurements have shown that helium can occupy interstitial voids and change the structural properties of materials under pressure [40, 41, 42, 43, 44]. This effect seems confined to network-forming structures [40] or to materials possessing large voids such as single-wall carbon nanotubes [41, 42], fullerenes [43], or clathrates [44]. However, neither trigonal, , nor -type phases form these types of structures, and so we do not expect such helium intercalation; see Sec. S2 of the SM for further discussion. Nor would we expect an intercalation effect from N2 molecules due to their much larger size.
We will now compare our XRD and Raman results with the known phases in the Lu-H-N landscape at room temperature and 2 GPa. These consist of pure N2 phases, ammonia (NH3) [45, 46], fcc rock-salt LuN (RS-LuN; NaCl-type , ), fcc zinc-blende LuN (ZB-LuN; ZnS-type , ), hexagonal LuHδ (), and fcc LuH2 (CaF2-type, ).
At room temperature and 2 GPa, pure N2 may form either a fluid or a solid phase. The -phase crystallises in a structure [47, 48], and a single mode is expected at 2330 , which we observe as a narrow peak in this range of energy. N2 gas has not only a similar vibron mode at high energy but also other peaks at low energy below 150 [49]. Some of the modes that we measured might originate from N2 gas, but not the ones at 195 and 166 or our dominant modes at 1240 or 260 .
Ammonia could in principle form if hydrogen liberated from the trigonal LuH3 lattice reacted with nitrogen instead of being replaced by it. At 2 GPa and ambient temperature, ammonia is expected to form a structure which should only possess one Raman-active mode [46, 50]. Ammonia is unlikely to be detected by XRD due to the weak signal from the light atoms contrasted against the large contribution from the massive lutetium atoms, therefore it is unlikely that any of the refined cubic phases could originate from it. Raman scattering under pressure shows that only modes at energies higher than 3100 are observed in this phase [46]. So we exclude ammonia from being responsible for the Raman modes we measure at 1.9 GPa.
The primary potential nitride compound is RS-LuN which has a lattice parameter of = 4.7563(4) Å at ambient conditions [51]. Therefore this cannot explain either of the two cubic phases observed by XRD, as the lattice parameter will only continue to shrink under pressure and it is already smaller than both of the lattice parameters measured. Furthermore, RS-LuN is in principle Raman inactive since only the and Wyckoff sites are occupied. Despite this, a strong excitation was observed previously at 582 and was ascribed to strong disorder [52]. Regardless, we do not observe this mode. We also note that the synthesis of RS-LuN is challenging and previously required heating pure lutetium and nitrogen at 1600 °C [51]. Thus, since we have not laser-heated our sample, we do not expect the formation of this compound. The EDS and WDS also support the idea that RS-LuN did not form (see Sec. S4 of the SM) since this would result in a clear signature from nitrogen as this compound is stable at ambient pressure. On the other hand, the ZB-LuN isomorph has only been predicted to form at pressures above 260 GPa [53, 54]. Experimentally, the RS-LuN structure was shown to form preferentially when synthesised at 30 GPa and 2000 K [55]; that is to say, in far more extreme conditions than were attained here and in other papers, the ZB-LuN structure could not be formed, and so we do not consider it viable from hereon.
Since we do not observe any signatures of trigonal LuH3 and we do not expect cubic LuH3 at 2 GPa based on its predicted and observed stability [30, 29, 12, 56, 17], it is likely that other lutetium hydrides have formed via the decomposition of the trigonal LuH3. Firstly, hexagonal LuHδ compounds (00.2) form for low hydrogen concentrations [57, 58, 59, 60]. At most, these hexagonal compounds could contribute four Raman-active phonons which would help explain the low energy modes. However, our attempts to reproduce the XRD patterns with any hexagonal structure at high pressure failed. We note that, in the recovered sample at ambient pressure, we were able to identify this phase (see Sec. S3 of the SM).
The other primary lutetium hydride is LuH2, or the similar compound LuH2+x with partially occupied sites. The lattice parameter of LuH2 is reported to be =5.033 Å at ambient conditions [61, 62, 14] which is also consistent with LuH2+x. These phases can therefore explain the XRD pattern of the refined phase. With regards to the Raman-activity, we expect one Raman-active mode which was calculated to be between 960 and 1170 at ambient pressure [32]. This would be consistent with the mode measured at 1240 at 1.9 GPa. To explain our mode measured at 260 , we note that an infrared-active mode is predicted to appear at 250 in LuH3 [32, 12]. Since LuH3 and LuH2+x are structurally similar, one would expect that they share the predicted mode. LuH2 lacks this mode [32]. Thus, provided that the mode becomes Raman active, potentially by disorder, our excitations at 1240 and 260 could provide evidence for the presence of LuH2+x. Furthermore, the blue colour observed in Fig. 1(d) would also be consistent with the formation of LuH2+x, as it is also predicted to be blue [63]. In summary, LuH2+x is consistent with both the Raman spectra and XRD patterns we measured. However, it is clear that this phase alone cannot explain the low-energy modes since no other Raman-active modes exist, and the only other predicted mode is at high-energy (above 1000 [32, 12]).
Though we identify the structure as LuH2+x, we still cannot explain the remaining Raman modes or the phase identified by XRD results with known phases. So, we shall discuss now the potential formation of the N-doped lutetium hydride compound. In Sec. S3 of the SM [28], we show that once the pressure is released, the sample is metastable but still contains the and phases. Most importantly, the recovered sample does not contain nitrogen as shown by both the EDS and WDS in Sec. S4 of the SM [28].
In fact, metal nitrides are generally challenging to form due to the significant activation barrier of the non-polar, triple-bonded nitrogen atoms (bond energy 941 kJmol-1) [64]. However once synthesised, these nitrides tend to have refractory properties and are thermally and chemically stable [64]. Previously, Dierkes et al. synthesised LuN by nitriding LuH3 [65], which is the closest analogy to the desired reaction for this work. They note that nitridation does not start below 800 °C and even then the uptake of nitrogen is slow until above 900 °C [65]; they also note that LuH3 begins to decompose by releasing hydrogen above 300°C. Perhaps, heating within this window under pressure would favour the formation of N-doped lutetium hydride. Cai et al. performed a laser-heating synthesis at 1800 °C with pure lutetium and N2/H2 pressure medium which formed a mixture of LuH2 and LuH3 with no observable nitride compounds [27]. Theoretically, it has been reliably noted that there are no thermodynamically stable ternary Lu-H-N compounds: only metastable ones at best [10, 12, 17, 56, 66]. Furthermore, we prepared two pressure cells with pure nitrogen pressure media and we observed no change in the trigonal LuH3 structure upon heating to 65 °C at 2 GPa followed by pressurising to 12 GPa. This indicates that nitrogen has a limited effect on the sample; further details are provided in Secs. S2 and S3 of the SM. So based on all of this, it would seem that the synthesis, as stated in the paper [8], of heating the DAC for 24 h at 65 °C and 2 GPa to form N-doped lutetium hydride would be unlikely to occur.
Fortunately, with the publication of Dias’ patent,we can gain insight into an alternative synthesis method [67]. According to Fig. 1 of the patent, this patentable synthesis involves heating lutetium metal in a reaction chamber with hydrogen and nitrogen gas at 4–10 MPa and 200–400 °C for 12–24 h before being pressurised to 3–20 kbar in a DAC [67]; this is rather different from the synthesis stated in the paper [8]. Despite this, our synthesis by pre-forming LuH3 at 200 °C with 4 MPa of H2 prior to loading is providentially similar, though we did not include nitrogen in this part of the synthesis. This patentable synthesis is also very similar to the work of Dierkes et al. [65], though they did not heat with the two gases together in the reaction chamber at the same time. This combined with our work strongly suggests that heating the pure lutetium metal in a hydrogen and nitrogen atmosphere at high temperatures (above 200 °C) is vital for the formation of the N-doped lutetium hydride.
Overall, these considerations for the nitridation of lutetium hydride are also relevant for the partial or complete nitridation of other rare-earth hydrides and for the formation of other nitrogen compounds. Pragmatically, the successes of the rare-earth elements in producing high-temperature superconductors and the prevalence of ammonia borane syntheses have already shifted the direction of research, as evidenced by the predictions of nitrogen doping of rare-earth compounds [19, 24, 25], or simply rare-earth nitrogen compounds such as the clathrate boronitrides La(BN)5 and Y(BN)5 [23]. As a result, the incorporation of nitrogen into rare-earth hydrides is a logical route of inquiry for future experimental works where the challenges of nitrogen chemistry will have to be taken into account.
In our case, we cannot conclusively say that we did or did not form N-doped LuH3 at 1.9 GPa, as it could have decomposed and ejected the nitrogen prior to the EDS and WDS measurements; however, it seems unlikely given the arguments discussed. What is clear is that at 1.9 GPa, we formed a compound that is similar to that described by Dasenbrock-Gammon et al. [8], but ours was metastable and eventually decayed at ambient conditions. What is also clear is that the contradictory nature of observing many Raman-active phonons with two lutetium lattices was an overlooked problem. Overall, the question then becomes, what is the origin of the -type phase?
To explain the origin of the -type phase, we speculate that this structure arises from a charge-density-wave (CDW) distortion of a pure lutetium hydride compound. Previous work on the chemically similar ScH3 and YH3 shows that there is an intermediate region between the ambient pressure trigonal or hexagonal structure and the high-pressure cubic phase [68, 69, 70]. Theoretical work on YH3 predicts that a Peierls distorted structure forms within this intermediate phase that continues to possess a close approximation of a cubic sub-lattice [69]. Unfortunately, we tried an XRD refinement of the proposed structure without success, but this does not eliminate the possibility that this mechanism gives rise to other distorted structures. A similar intermediate phase was also observed in ScH3 between 25 and 46 GPa [70] whereas this phase was observed in YH3 between 9 and 24 GPa [68]. Since lutetium is chemically similar to scandium and yttrium, one could hypothesise that a similar intermediate Peierls-distorted/CDW phase could arise in our lutetium hydride compound. The CDW then provides a mechanism to form our -type phase which is then a distortion of a higher-symmetry phase; perhaps due to the already existing similarities. Furthermore, the pressure range of the intermediate phase seems to decrease with increasing atom size; that is to say, this intermediate phase could then coincide with our measured pressure range. It is also worth noting that a strong change in the optical gap has been observed within the CDW phase in both YH3 and ScH3 [68, 70]. As such, the observation of poor-metal behaviour and upturns in the resistivity in previous measurements on lutetium hydrides [71, 72, 14, 16] could then be evidence of a CDW phase as the gap opens. Overall, a CDW phase driving the formation of the -type phase could then simultaneously explain some of the electrical properties observed, the cubic lattice of lutetium atoms, and the forest of Raman-active modes observed at low-energy without invoking the synthesis of a ternary compound.
V Conclusion
We obtain a biphasic sample which presents structural similarities to the sample of Dasenbrock-Gammon et al. [8] by starting from pure trigonal LuH3 loaded in a DAC at 1.9 GPa with a mixture of N2/He. From x-ray diffraction, we clearly see a structural transformation from the initial trigonal phase to a mixture of cubic phases under pressure. Similarly, with Raman spectroscopy we observe the loss of the modes associated with the trigonal structure and see the appearance of a strong mode at 1240 that we associate with the Raman-active mode of a cubic structure. However, we (and others) observe more excitations than are possible for two cubic structures. Overall we believe that it is unlikely that these excitations come from impurity phases since either they are not visible in XRD, they are chemically unlikely to form, or simply their excitations do not occur in the energy range. Thus we conclude that our sample is a biphasic mixture of LuH2+x and an -type structure, also composed of lutetium and hydrogen, which together may describe the XRD patterns and Raman spectra. We postulate that the -type structure is a distortion of a higher symmetry structure and could originate from a CDW phase. However, further theoretical work will be needed to support the origin and stability of this phase. More broadly, our discussion of nitrogen chemistry will aid future works in experimentally finding ternary compound superconductors.
VI Acknowledgments
This work is supported by the European Research Council (ERC) under the European Union’s Horizon 2020 research and innovation program (Grant Agreement No 865826). This work has received funding from the Agence Nationale de la Recherche under the project SADAHPT. We thank Abdellali Hadj-Azzem and Elise Pachoud for lutetium preparation, and Céline Goujon for help in the preparation of the laboratory high-pressure XRD setup. We thank Laetitia Laversenne for fruitful discussions and Eva Zurek for stimulating exchanges of information.
Competing interests
The authors declare no competing interests.
Supplementary material
Appendix A S1: Synthesis and techniques
Lutetium (Alfa 3N) was characterised by EDS before polishing it, whereupon oxygen was clearly identified in Lu2O3 deposits with atomic concentrations between 20-50 . A small amount of tantalum was also identified as shown in Fig. 13(a) We then polished the piece of lutetium in air until the surface became shiny instead of black in order to remove the oxide from the surface.
LuH3 was synthesised by hydrogen absorption using the Sievert method. We used a HERA C2-3000 device to measure the quantity of hydrogen absorbed (or desorbed) by the piece of lutetium as a function of time. This is calculated by measuring the hydrogen pressure variation in a sample holder of known volume. The measurement of the hydrogenation rate is performed out of equilibrium. The piece of polished lutetium (147.67 mg) was placed in the sample-holder of the reaction chamber. The sample-holder and compensation chambers were then pumped for one hour at ambient temperature to remove contaminating gases. The temperature was then increased to a maximum temperature of 500 °C at 10-5 mbar and kept stable for 4000 s to outgas the container as much as possible. The temperature was then decreased to 200 ∘C, and H2 gas at 4 MPa was injected into the chamber. After 18 hours, the weight percentage of absorbed H2 saturated at 1.7 which corresponds to the expected composition of LuH3, as shown in Fig. 4 (though only the first 3.5 hours are shown). After the synthesis, the sample-holder was closed and transferred into an argon glove box where it was opened to recover the LuH3 powder. We can qualitatively compare the hydrogen concentration within the lattice to previous measurements by comparing the -axis parameter [31, 73]. Previous work showed that a general trend amongst the trigonal/hexagonal rare-earth hydrides is that the -axis parameter decreases with increasing hydrogen concentration [73]. For our sample, = 6.173(1) Å whereas the -axis parameter from Mansmann et al. was determined to be 6.163 Å [31]. Similarly, the -axis value from Tkacz et al. is 6.50 Å once converted to the equivalent hexagonal structure [30]. Therefore, the hydrogen concentration within our sample is similar to previous samples and more densely packed than the sample of Tkacz et al.
A thin sample of LuH3 was prepared in a diamond anvil cell (DAC) with culets of 800 m diameter by pressing the synthesised powder between the two diamonds until the sample was approximately 5-10 m thick. A stainless steel gasket was indented to a thickness of 80m and a hole of 400 m was drilled for the pressure chamber. A ruby sphere and a small piece of silicon were placed inside the pressure chamber. Prior to loading the DAC, the LuH3 sample was characterised by Raman spectroscopy and X-ray diffraction (XRD) inside the unloaded DAC.
We prepared three DACs in total with the trigonal LuH3 powder. The first (DAC1) was largely discussed in the main text, and we used a gas loader (Top Industrie) to load a mixture of nitrogen and helium. After purging with helium, the system was filled with 10 bar of N2 and then 1500 bar of helium. We estimate that the quantity of N2 in the pressure chamber was 4 nmol whilst the quantity of LuH3 was 11 nmol. The DAC was then sealed at 0.1 GPa and then we applied 1.9 GPa and proceeded to characterise the sample by Raman spectroscopy and XRD. The second DAC (DAC2) was loaded with pure nitrogen at 1200 bar, and the third DAC (DAC3) was cryogenically loaded with pure nitrogen at 77 K.
The EDS measurements used a Bruker silicon drift detector (SDD) mounted on a FESEM ZEISS Ultra+ with a working distance of 8 mm, a take-off angle (TOA) of 35°, and an acquisition time of about 2 mins. To increase the chance of observing nitrogen, which emits at 0.392 keV, WDS was performed with a JEOL-8800 Electron Probe MicroAnalyzer (EPMA/Microsonde de Castaing). Qualitative analysis of nitrogen used a LDE1H synthetic superlattice analyzing crystal (Si/W) and TAP for Lu-M (1.58 keV). On the EPMA system, the TOA is 40°. For the EDS, the electron-beam was rastered over an area of approximately 2x2 , whilst for the WDS a defocussed spot of 10 was used to limit the material degradation by overheating or carbon contamination from the adhesive tape. Both experiments used several voltages (from 5-15 keV) though the ionisation efficiency of nitrogen is enhanced at low voltages.
X-ray powder diffraction of the starting LuH3 was performed immediately after the hydrogenation of lutetium using a D5000T diffractometer (Cu-K radiation), at ambient pressure (and outside the DAC). The measurement was repeated several times (up to 9 days after the first measurement, and a final time after 6 months) to determine the effect of air exposure on LuH3. The Rietveld refinements were done with FullProf software [74]. The X-ray powder diffraction after loading at 1.9 GPa in DAC was performed on the ESRF beamline ID15B with = 0.411 Å. Additional measurements on the LuH3 powder at ambient pressure were also performed on the same ESRF beamline. Calibration of the detector-to-sample distance, beam orientation, detector tilt with respect to the omega rotation axis, and the used wavelength was determined by a Si powder standard (‘NIST 640 C’ from NIST). The X-ray beam was focused to 4x3 m2 using Be compound refractive lenses. 2D images were collected with a six degrees oscillation of the DAC using an Eiger 2X CdTe 9M photon counting detector from Dectris and integrated into a 1D pattern using the Dioptas software [75]. Le Bail refinements (lattice parameter, peak profile, and background) on the loaded DAC at 1.9 GPa were done using the GSAS-2 package [76].
Polarised Raman scattering was performed in quasi-backscattering geometry at 300 K with an incident laser-line at 532 nm from a solid-state laser. The DAC was placed in a vacuum to avoid measuring the Raman response of air. We used a laser power between 2.5-10 mW with a typical spot size of 25 m. The scattered light was analysed by a single grating and a triple grating subtractive spectrometer, both were equipped with liquid nitrogen-cooled CCD detectors. The crossed and parallel polarisation dependence was measured by changing the orientation of the polariser on the collection path. We measured the Raman signal of pure LuH3 in the DAC before and after loading the pressure medium.
Appendix B S2: Trigonal lutetium trihydride
Fig. 5(a) shows the pattern of the lutetium trihydride immediately after synthesis; it is well-described by a trigonal structure with some Lu2O3 impurities. After the first XRD measurement, we left a small fraction of the LuH3 powder exposed to air and measured the XRD several times over the course of 9 days to check its stability. The rest of the powder was immediately stored under vacuum or in an argon glove box. Figure 5(b) shows that despite being in contact with air, the Lu2O3 content is similar within the error bar, i.e. 3.4(1) vs 3.2(1) from before. This remains true after 6 months of exposure to air.
Fig 6.a shows the polarisation dependent Raman spectra of the ambient pressure trigonal LuH3 below 955 ; at higher energies we do not identify any excitations that clearly originate from LuH3. Within the aforementioned range, we observe 13 features (marked by arrows) which could account for most of the expected 17 phonons of the trigonal structure. Overall, we do not observe any significant differences between the different polarisations. The inset shows the low-energy spectra down to 20 where we do not see any more notable features.
Fig. 6(b) shows the Raman spectrum of trigonal LuH3 before pressurising alongside the spectra of the translucent part of the sample at high pressure and again at ambient pressure after releasing the pressure. Apart from a hardening of the phonon modes under pressure, we do not see any drastic change in the spectra. Importantly, the number of modes observed does not change over the pressure cycle, so it seems that this part of the sample was untransformed and largely unaffected by the high pressure. Why remains unclear.
DAC2 was primarily used to determine the pressure dependence of the lattice volume. Initially, this was followed at the ESRF Beamline up to 3 GPa. Since the sample remained trigonal, it was heated to 65 °C and during this process, the pressure increased up to 7 GPa, yet the sample remained trigonal. The pressure was then increased further until 12 GPa at room temperature with XRD being measured at every pressure and the result is shown in Fig. 7(a). The lattice parameters of the refined trigonal structure are shown in Fig. 7(b), whilst Fig. 7(c) shows the volume dependence on pressure. This was also calculated by Dangić et al. which is presented alongside the volume dependence determined here and shows a similar trend with a small offset. After that, the pressure was decreased to 2 GPa, whereupon the Raman spectroscopy was measured which is presented in figure 6(b) Throughout all of the pressure changes the sample remained trigonal.
After cryogenically loading DAC3 and warming to room temperature, the pressure was determined to be 3.5 GPa. At this pressure, both the Raman and XRD confirmed that the structure remained trigonal (see Figs. 6(b) and 8 respectively). Here a laboratory K-Ag source ( = 0.56 Å) was also used to measure the XRD. The DAC was then heated at 65 °C for 24 h as was done for both the sample in the main text and the Dasenbrock-Gammon sample [8]; the resulting XRD pattern is shown in Fig. 8 and there is no measurable difference within the error, as shown by the refined lattice parameters in table 2. Overall we do not reproduce the cubic structural transition in this cell either. Upon decompression, the recovered sample remained trigonal but with a slightly larger -axis than the original sample before compression, though this could be intrinsic hysteretic behaviour of the sample caused by compression and decompression.
| Conditions | (Å) | -axis (Å) | -axis (Å) |
|---|---|---|---|
| Before (1bar/300K) | 1.54 | 6.1680(8) | 6.422(1) |
| 3.5 GPa before heating | 0.56 | 6.111(5) | 6.335(9) |
| 3.5 GPa after heating | 0.56 | 6.113(6) | 6.338(9) |
| After decompression | 0.56 | 6.1744(4) | 6.421(8) |
In both cells loaded with pure nitrogen (DAC2 and DAC3), we observe Raman spectra that resemble trigonal LuH3 at high pressure, as shown by Fig. 6. These trigonal samples and the small trigonal part in DAC1 all show a very similar linear hardening with pressure for the dominant phonon mode, as shown by the inset of Fig. 6(b). Sato et al. showed that the Raman spectra of pressurised SiO2 glass change when in a helium pressure medium, as the helium atoms occupy interstitials within the silicate network [40]. Here, we do not observe any significant difference between the trigonal LuH3 samples loaded in the pressure media, and the hardening of the phonons under pressure follows the same behaviour in all of the pressure media. This leads us to believe that the helium pressure medium is not causing the structural change in DAC1. Considering the effects of the pressure media themselves, since both helium and nitrogen perform well as hydrostatic pressure media to at least 10 GPa [77], we do not expect significant uniaxial effects below 2 GPa. So the difference in hydrostaticity is unlikely to be the origin of the difference between DAC1 (with transformation) and, DAC2 and DAC3 (without transformation).
Appendix C S3: Transformation of the LuH3 sample
Figs. 9(a) and 9(b) show wide-range Raman spectra on the ambient pressure trigonal LuH3 and the high-pressure compound of DAC1. Here the modes in the high-pressure structure clearly do not resemble the modes in the trigonal structure. The spectra of the high-pressure phase for multiple spots on the sample also show the same features, though the background does change. The locations of these different spots are shown in the inset image. In table 3, we write the energies of the excitations seen in the original trigonal LuH3 and the high-pressure compound.
| Compounds | LuH3 | High pressure compound |
| (0 GPa) | (1.9 GPa) | |
| Energy | 100.2 | 128 |
| (cm-1) | 109.4 | 164 |
| 117.4 | 202 | |
| 132.6 | 260 | |
| 147.5 | 1141 | |
| 368.4 | 1241 | |
| 416.8 | ||
| 454.2 | ||
| 550.2 | ||
| 702.2 | ||
| 755 | ||
| 829 | ||
| 861.8 | ||
| 1039 |
To complete the synthesis as described by Dasenbrock-Gammon et al, DAC1 was heated at 65 ∘C for 24 h at 1.9 GPa. Fig. 9(c) shows the resulting Raman spectra; not much has changed.
| -type | -type | LuHx | ||
| -axis (Å) | -axis (Å) | -axis (Å) | -axis (Å) | |
| 1 | 4.798 | 10.427 | 3.529 | 5.588 |
| 2 | 4.806 | 10.433 | - | - |
| 3 | 4.776 | - | 3.515 | 5.589 |
| 4 | 4.773 | - | 3.5099 | 5.584 |
| 5 | 4.796 | 10.402 | - | - |
| 6 | 4.785 | 10.409 | 3.527 | 5.561 |
| 7 | 4.781 | 10.399 | - | - |
| 8 | 4.788 | 10.410 | 3.524 | 5.583 |
| Average | 4.79(1) | 10.41(1) | 3.521(7) | 5.58(1) |
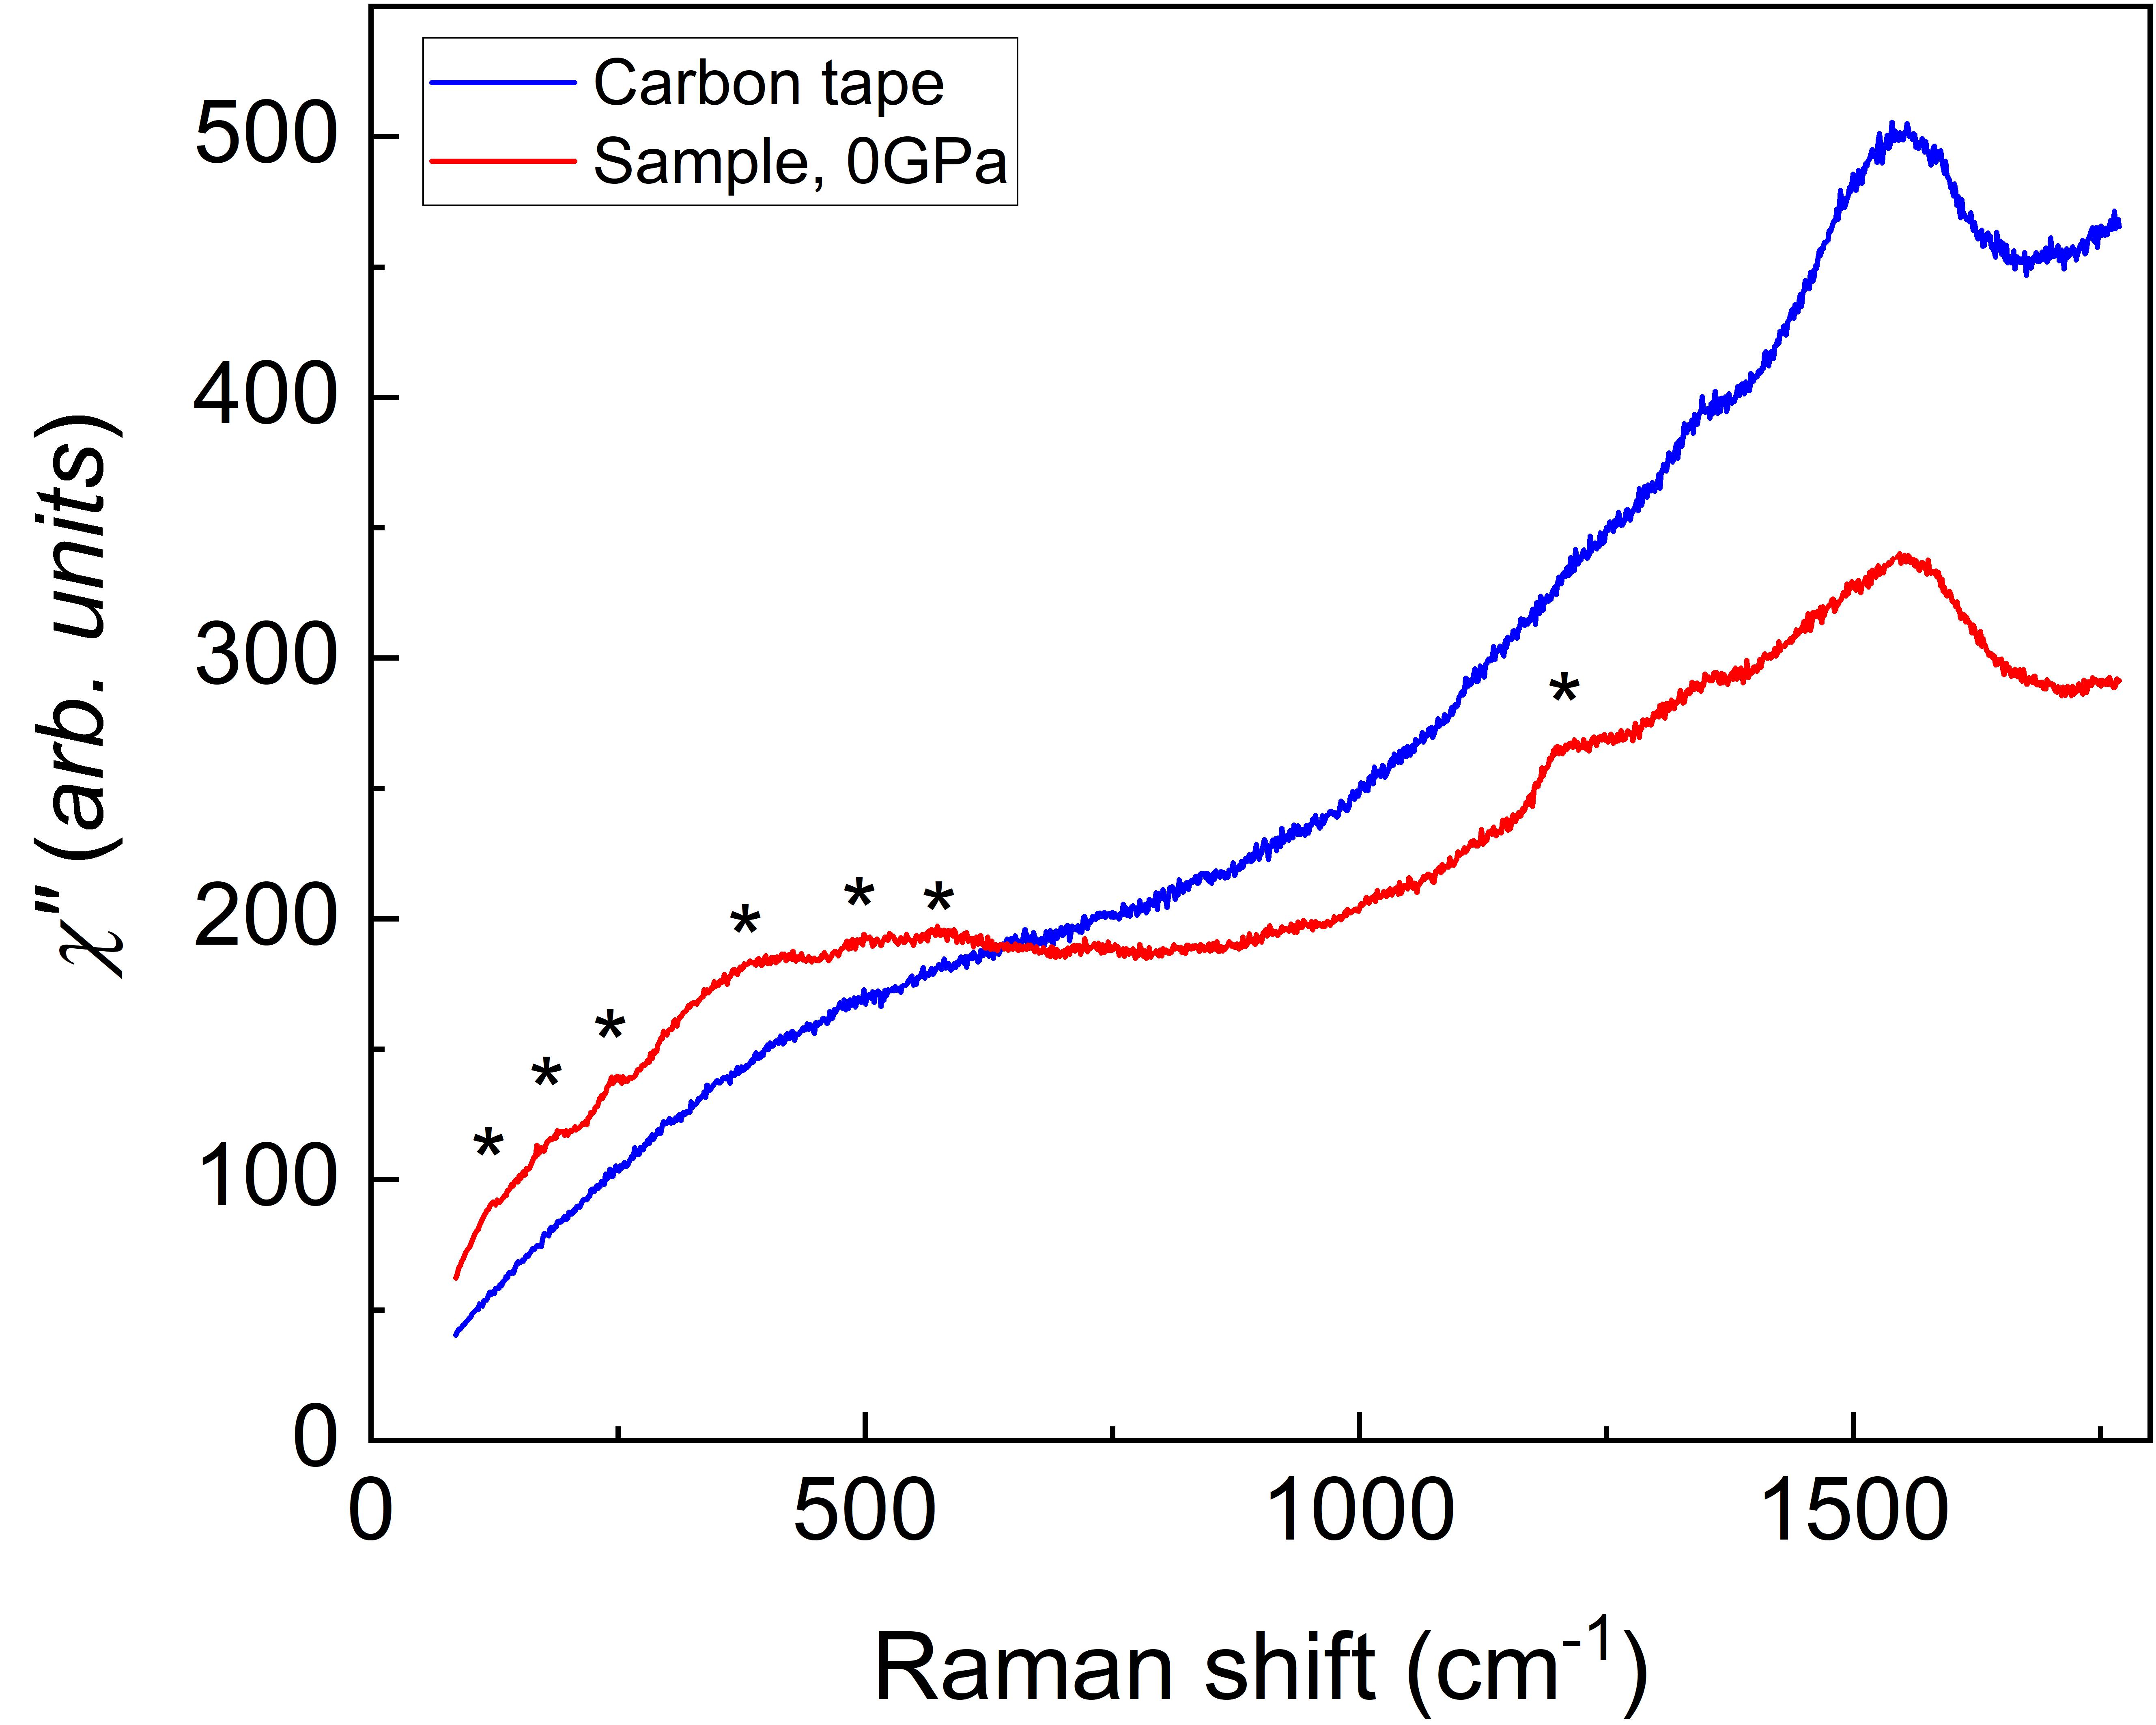
We then opened the DAC1 in helium gas (20 bar) to avoid contact with air. Then we slightly closed the DAC to keep the sample in a helium environment and remeasured the sample at essentially ambient pressure. The results are shown in Figs. 9(d) to 9(f). Shortly after opening, the spectrum resembles the cubic phase with a peak located just below 250 and what could be a broad and weak remainder of the peak at 1240 . However after one day, this high-energy peak has disappeared but the low-energy peak remains. Fig. 9(f) shows the spectrum after several days (during which time the sample was stored under vacuum), and clearly the structure has changed once again. This spectrum resembles neither the cubic nor the trigonal phase. In Fig. 10, we compare the background-subtracted signals of the data in Figs. 9(d)-(f) against the spectra of Lu2O3 [34] and ‘part B’ from Dasenbrock-Gammon et al. [8]. There is no strong resemblance between either of the other compounds, with the exception of the most intense peak of Lu2O3, which would have to be considerably broadened, and the low-energy peaks of ‘part B’, but the rest of the spectrum is different.
Subsequently, we measured the XRD after releasing the pressure, and the corresponding diffraction XRD image is shown in Fig. 11(b), whereas Fig. 11(a) shows the high-pressure phase. The most evident change is that the 0 GPa XRD image has become spotty instead of forming continuous rings. This shows that the crystalline domain sizes are larger than the X-ray beam size (4x3 µm2) which means that we can no longer fit the patterns with Rietveld refinements. Qualitatively, in the ambient pressure patterns, we see three phases as shown in Fig. 12. We measured 8 different spots. Firstly, we observe similar and -type structures to those measured at high pressure, but in addition we observe a phase. phase is present in every measured spot, but this forms either a biphasic mixture with the -type (3/8 spots) or the hexagonal phase (2/8 spots), or it forms a triphasic mixture (3/8 spots). The refined lattice parameters of the measured phases in different locations are shown in table 4.
To understand this, we must first consider the binary mixture phase diagram of lutetium and hydrogen [57, 58, 78, 60]. For low hydrogen concentrations up to 0.2 H/Lu, a pure hexagonal LuHδ () forms; the lattice parameters of which increase with increasing hydrogen concentration until they saturate at =3.5240 Å and =5.6050 Å for LuH0.2 [78]. Both of our average values of =3.521(7) Å and =5.58(1) Å indicate a lower hydrogen concentration: the values of and imply =0.16(7) and =0.09(3), respectively. Beyond 0.2 H/Lu, a binary mixture of the LuHδ and an phase forms. There is uncertainty where the end of this binary mixture ends: some sources say H/Lu [57, 58] while another says 1.8 H/Lu [60]. The latter concentration forms a compound that is approximately the same as LuH2 which has a lattice parameter of =5.035 Å [78]. This value is much larger than our average value of 4.79(1) Å. But in the instance that H/Lu is the beginning of the binary mixture, it is then probable that the low concentration phase would have a much smaller lattice parameter than LuH2 which could then be close to our value. Finally and as discussed in the main text, the lattice parameter of the -type structure expands when the pressure is released and becomes larger than the ambient pressure value of 10.38 Å for Lu2O3, therefore we conclude that the -type phase is a distinct compound from Lu2O3.
Here and in the main text, we consider the decomposition of the initial LuH3 into lower hydrides. This must result in the formation of H2 which should in principle be measurable by Raman spectroscopy. At high energy, there exists a well-known hydrogen vibron excitation at approximately 4200 at low pressure and 300 K [79, 80, 81]. However, this vibron is inherently weak and generally only visible with a pure hydrogen pressure medium or with ammonia borane after laser heating due to the large concentration of hydrogen present. In our work, the proposed decomposition of LuH3 to LuH2+x would only produce a fraction of a hydrogen atom per unit cell and therefore a low concentration of hydrogen; thus the intensity of the vibron will be weaker. Furthermore, the hydrogen can escape the pressure cell which further reduces the quantity present and diminishes the intensity. As a result of all of these reasons, we did not observe the high-energy hydrogen vibron. There also exists a weaker hydrogen excitation at approximately 1044 [81], which is clearly observable in the data of Dasenbrock-Gammon et al. in Fig. 3(c) of the main text. This is due to their use of a hydrogen pressure medium, but despite that, the excitation remains weak. Since we did not use a hydrogen pressure medium and the aforementioned reasons, it is not surprising that we do not observe it.
C.1 S4: EDS and WDS analysis of the recovered sample
Scanning electron microscopy with X-ray energy dispersive spectroscopy (EDS) and wavelength dispersive spectroscopy (WDS) were used to analyse the composition of the pure lutetium and recovered sample. Fig. 13(a) shows the EDS spectra of the recovered sample after pressuring at 1.9 GPa and heating at 65 °C, and pure Lu after polishing; all spectra were normalised by the maximum intensity of a given spectrum. At high accelerating voltages, one preferentially excites the energy levels of the heavier atoms, whilst at low voltages, the signal of lighter elements becomes more intense. This is most clearly seen in the intensity of the O-K peak which grows in intensity relative to the Lu-M peak at low voltages. Thus to find nitrogen, lower accelerating voltages should be used.
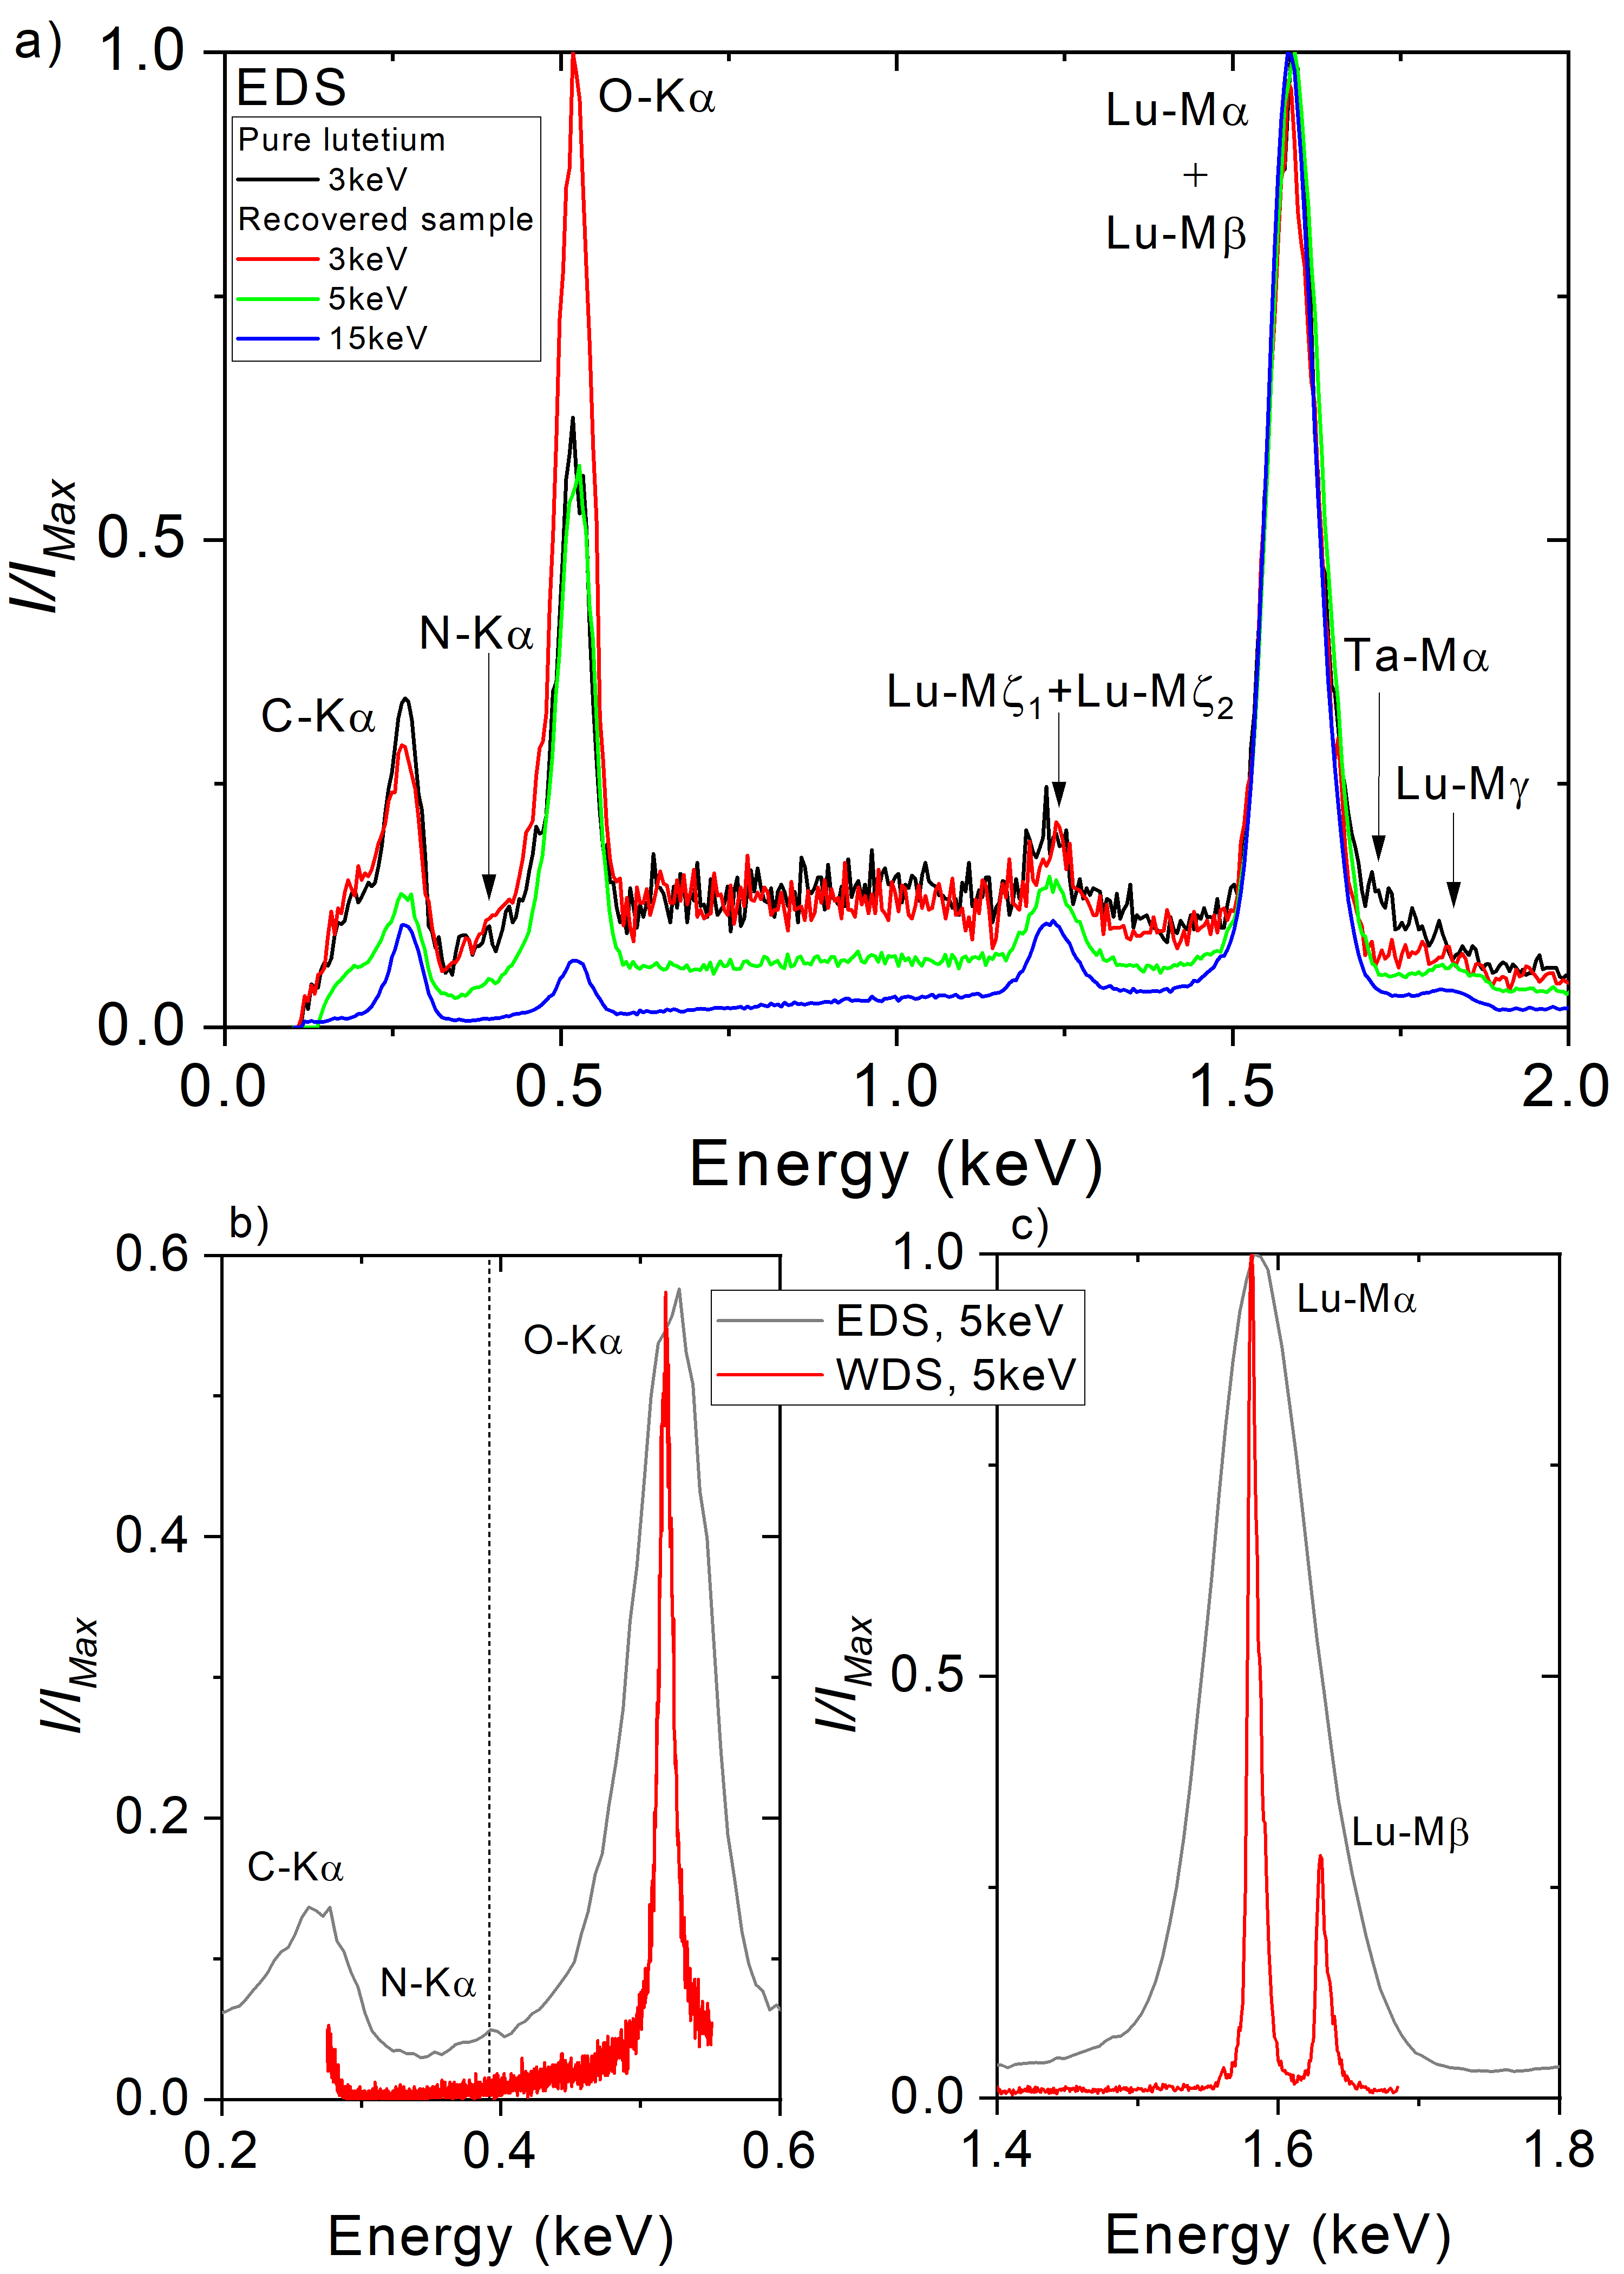
Firstly though we should comment on the other atoms detected: oxygen and carbon. As mentioned before, oxygen originates from Lu2O3 and is also present in freshly polished lutetium metal. Its presence is not a surprise. The carbon originates from the tape used to attach the sample to the sample holder, as a conductive surface must be used, therefore this is also expected.
The characteristic K emission energy of nitrogen is situated at 0.392 keV as indicated in fig 13.a. However, within the noise of the measurement for these EDS measurements, there is no indication of nitrogen in the structure. We also note that there is very little difference between the recovered sample and the pure lutetium. We also used WDS which has superior resolving power, as shown in Figs. 13(b) and 13(c) by the narrower O-K line and the Lu-M+Lu-M line being clearly resolved into the two spectral lines. This helps to distinguish the potential nitrogen excitation from the nearby carbon and oxygen excitations. With the WDS measurements, we used the same low voltage as for the EDS such that we could preferentially observe nitrogen, but there is no observable feature at the N-K excitation energy, as shown in Fig. 13(b), which indicates that there is no nitrogen in the ambient pressure recovered sample.
The EDS spectra were measured one day after opening the cell but before the Raman spectrum in Fig. 9(e), therefore it should still be somewhat representative of the cubic sample. The WDS was measured on day 2, but unfortunately, we do not know the state of the sample between 1 day and 5 days after opening. Fig. 14 shows the Raman spectrum of the recovered sample used for EDS measurements after 12 days. We identify several peaks that do not originate from the carbon tape (the sample could not be removed from the tape due to its fragility). The background subtraction of this sample is shown in Fig. 10(d), where we clearly see the reappearance of the peak at 240 which was not present after 5 days; however, this could be due to the large increase in background between day 1 and day 5 making the 240 peak immeasurable. By day 12, the background has decreased to a comparable value to day 1 and the 240 peak is observable again. The other peaks after 5 days could be present albeit less intense and broader so overall they are less distinct.
Appendix D S5: Raman tables of structures
Here we state the Raman and infrared excitations of various space groups for LuHx structures: cubic , trigonal , hexagonal , , and , and finally cubic for Lu2O3 and -type. The expected occupied Wyckoff positions for each space group are written in table 5 which are then used to predict the number of excitations and their associated symmetries. The only clear expected selection rules concern the modes that are mainly Raman active in parallel polarisations, except in hexagonal symmetries where they are Raman-active in both. For the -type phase that is proposed as the second phase at 1.9 GPa, other Wyckoff positions should be occupied by hydrogen atoms. Unfortunately, due to the low scattering cross-section of hydrogen, we cannot determine which Wyckoff sites are occupied. Calculations would be helpful to determine the stoichiometry and the occupied sites.
| Space group | Point group | Lu1 | Lu2 | H1 | H2 | H3 | H4 | H5 | Infrared-active | Raman-active |
| (LuH3 [12]) | - | - | - | - | ||||||
| (LuH2 [12]) | - | - | - | - | - | |||||
| (YH3 [36]) | - | - | - | |||||||
| (YH3 [36]) | - | - | - | - | ||||||
| (YH3 [36]) | - | - | ||||||||
| (YH3 [36]) | - | |||||||||
| (YH3 [69]) | - | |||||||||
| (-type) | - | - | - | - | - | |||||
| (Lu2O3 [34]) | - | - | - | - | ||||||
| (pure Lu and Y [60, 36]) | - | - | - | - | - | - |
References
- Ashcroft [1968] N. W. Ashcroft, Metallic hydrogen: A High-Temperature Superconductor?, Phys. Rev. Lett. 21, 1748 (1968).
- Bardeen et al. [1957a] J. Bardeen, L. N. Cooper, and J. R. Schrieffer, Theory of superconductivity, Phys. Rev. 108, 1175 (1957a).
- Bardeen et al. [1957b] J. Bardeen, L. N. Cooper, and J. R. Schrieffer, Microscopic theory of superconductivity, Phys. Rev. 106, 162 (1957b).
- Drozdov et al. [2015] A. P. Drozdov, M. I. Eremets, I. A. Troyan, V. Ksenofontov, and S. I. Shylin, Conventional superconductivity at 203 kelvin at high pressures in the sulfur hydride system, Nature (London) 525, 73 (2015).
- Kong et al. [2021] P. Kong, V. S. Minkov, M. A. Kuzovnikov, A. P. Drozdov, S. P. Besedin, S. Mozaffari, L. Balicas, F. F. Balakirev, V. B. Prakapenka, S. Chariton, D. A. Knyazev, E. Greenberg, and M. I. Eremets, Superconductivity up to 243 K in the yttrium-hydrogen system under high pressure, Nat. Commun. 12, 5075 (2021).
- Somayazulu et al. [2019] M. Somayazulu, M. Ahart, A. K. Mishra, Z. M. Geballe, M. Baldini, Y. Meng, V. V. Struzhkin, and R. J. Hemley, Evidence for superconductivity above 260 K in lanthanum superhydride at megabar pressures, Phys. Rev. Lett. 122, (2019).
- Drozdov et al. [2019] A. P. Drozdov, P. P. Kong, V. S. Minkov, S. P. Besedin, M. A. Kuzovnikov, S. Mozaffari, L. Balicas, F. F. Balakirev, D. E. Graf, V. B. Prakapenka, E. Greenberg, D. A. Knyazev, M. Tkacz, and M. I. Eremets, Superconductivity at 250 K in lanthanum hydride under high pressures, Nature (London) 569, 528 (2019).
- Dasenbrock-Gammon et al. [2023] N. Dasenbrock-Gammon, E. Snider, R. McBride, H. Pasan, D. Durkee, N. Khalvashi-Sutter, S. Munasinghe, S. E. Dissanayake, K. V. Lawler, A. Salamat, and R. P. Dias, RETRACTED ARTICLE: Evidence of near-ambient superconductivity in a N-doped lutetium hydride, Nature (London) 615, 244 (2023).
- Shan et al. [2023] P. Shan, N. Wang, X. Zheng, Q. Qiu, Y. Peng, and J. Cheng, Pressure-induced color change in the lutetium dihydride LuH2, Chin. Phys. Lett. 40, 046101 (2023).
- Huo et al. [2023] Z. Huo, D. Duan, T. Ma, Z. Zhang, Q. Jiang, D. An, H. Song, F. Tian, and T. Cui, First-principles study on the conventional superconductivity of N-doped fcc-LuH3, Matter Radiat. Extremes 8, 038402 (2023).
- Li et al. [2023] Z. Li, X. He, C. Zhang, K. Lu, B. Min, J. Zhang, S. Zhang, J. Zhao, L. Shi, Y. Peng, S. Feng, Z. Deng, J. Song, Q. Liu, X. Wang, R. Yu, L. Wang, Y. Li, J. D. Bass, V. Prakapenka, S. Chariton, H. Liu, and C. Jin, Superconductivity above 70 K observed in lutetium polyhydrides, Sci. China: Phys., Mech. & Astron. 66, 267411 (2023).
- Sun et al. [2023] Y. Sun, F. Zhang, S. Wu, V. Antropov, and K.-M. Ho, Effect of nitrogen doping and pressure on the stability of LuH3, Phys. Rev. B 108, L020101 (2023).
- Xie et al. [2023] F. Xie, T. Lu, Z. Yu, Y. Wang, Z. Wang, S. Meng, and M. Liu, Lu–H–N phase diagram from first-principles calculations, Chin. Phys. Lett. 40, 057401 (2023).
- Ming et al. [2023] X. Ming, Y.-J. Zhang, X. Zhu, Q. Li, C. He, Y. Liu, T. Huang, G. Liu, B. Zheng, H. Yang, J. Sun, X. Xi, and H.-H. Wen, Absence of near-ambient superconductivity in LuH2±xNy, Nature (London) 620, 72 (2023).
- Xing et al. [2023] X. Xing, C. Wang, L. Yu, J. Xu, C. Zhang, M. Zhang, S. Huang, X. Zhang, B. Yang, X. Chen, Y. Zhang, J.-g. Guo, Z. Shi, Y. Ma, C. Chen, and X. Liu, Observation of non-superconducting phase changes in LuH2±xNy, Nat. Commun 14, 5991 (2023).
- Zhang et al. [2023] Y.-J. Zhang, X. Ming, Q. Li, X. Zhu, B. Zheng, Y. Liu, C. He, H. Yang, and H.-H. Wen, Pressure induced color change and evolution of metallic behavior in nitrogen-doped lutetium hydride, Sci. China Phys., Mech. Astron. 66, 287411 (2023).
- Hilleke et al. [2023] K. P. Hilleke, X. Wang, D. Luo, N. Geng, B. Wang, F. Belli, and E. Zurek, Structure, stability, and superconductivity of N-doped lutetium hydrides at kbar pressures, Phys. Rev. B 108, 014511 (2023).
- Sun et al. [2019] Y. Sun, J. Lv, Y. Xie, H. Liu, and Y. Ma, Route to a superconducting phase above room temperature in electron-doped hydride compounds under high pressure, Phys. Rev. Lett. 123, 097001 (2019).
- Wang et al. [2020] C. Wang, S. Yi, S. Liu, and J. H. Cho, Underlying mechanism of charge transfer in Li-doped MgH16 Phys. Rev. B 102, 184509 (2020).
- Xie et al. [2019] H. Xie, D. Duan, Z. Shao, H. Song, Y. Wang, X. Xiao, D. Li, F. Tian, B. Liu, and T. Cui, High-temperature superconductivity in ternary clathrate YCaH12 under high pressures, J. Phys.: Condens. Matter 31, 245404 (2019).
- Liang et al. [2019] X. Liang, A. Bergara, L. Wang, B. Wen, Z. Zhao, X. F. Zhou, J. He, G. Gao, and Y. Tian, Potential high- superconductivity in CaYH12 under pressure, Phys. Rev. B 99, 100505(R) (2019).
- Wei et al. [2021] Y. K. Wei, L. Q. Jia, Y. Y. Fang, L. J. Wang, Z. X. Qian, J. N. Yuan, G. Selvaraj, G. F. Ji, and D. Q. Wei, Formation and superconducting properties of predicted ternary hydride ScYH6 under pressures, Int. J. Quantum Chem. 121, e26459 (2021).
- Ding et al. [2022] H. B. Ding, Y. J. Feng, M. J. Jiang, H. L. Tian, G. H. Zhong, C. L. Yang, X. J. Chen, and H. Q. Lin, Ambient-pressure high- superconductivity in doped boron-nitrogen clathrates La(BN)5 and Y(BN)5, Phys. Rev. B 106, 104508 (2022).
- Ge et al. [2021] Y. Ge, F. Zhang, and R. J. Hemley, Room-temperature superconductivity in boron-and nitrogen-doped lanthanum superhydride, Phys. Rev. B 104, 214505 (2021).
- Cataldo et al. [2022] S. D. Cataldo, W. von der Linden, and L. Boeri, First-principles search of hot superconductivity in La--H ternary hydrides, npj Comput. Mater. 8, 2 (2022).
- Semenok et al. [2021] D. V. Semenok, I. A. Troyan, A. G. Ivanova, A. G. Kvashnin, I. A. Kruglov, M. Hanfland, A. V. Sadakov, O. A. Sobolevskiy, K. S. Pervakov, I. S. Lyubutin, K. V. Glazyrin, N. Giordano, D. N. Karimov, A. L. Vasiliev, R. Akashi, V. M. Pudalov, and A. R. Oganov, Superconductivity at 253 K in lanthanum–yttrium ternary hydrides, Mater. Today 48, 18 (2021).
- Cai et al. [2023] S. Cai, J. Guo, H. Shu, L. Yang, P. Wang, Y. Zhou, J. Zhao, J. Han, Q. Wu, W. Yang, T. Xiang, H.-k. Mao, and L. Sun, No evidence of superconductivity in a compressed sample prepared from lutetium foil and H2/N2 gas mixture, Matter Radiat. Extremes 8, 048001 (2023).
- [28] See Supplemental Material for further details on the sample preparation and further discussion of the trigonal phase and its transformation to the cubic phases. It also includes Refs. [73-81].
- Kong et al. [2012] B. Kong, L. Zhang, X.-R. Chen, T.-X. Zeng, and L.-C. Cai, Structural relative stabilities and pressure-induced phase transitions for lanthanide trihydrides REH3 (RE=Sm, Gd, Tb, Dy, Ho, Er, Tm, and Lu), Phys. B (Amsterdam) 407, 2050 (2012).
- Tkacz and Palasyuk [2007] M. Tkacz and T. Palasyuk, Pressure induced phase transformation of REH3, J. Alloys Compd. 446-447, 593 (2007).
- Mansmann and Wallace [1964] M. Mansmann and W. Wallace, The structure of HoD3, J. Phys. (Paris) 25, 454 (1964).
- Dangić et al. [2023] Đ. Dangić, P. Garcia-Goiricelaya, Y.-W. Fang, J. Ibañez-Azpiroz, and I. Errea, Ab initio study of the structural, vibrational, and optical properties of potential parent structures of nitrogen-doped lutetium hydride, Phys. Rev. B 108, 064517 (2023).
- Lin et al. [2010] C.-M. Lin, K.-T. Wu, T.-L. Hung, H.-S. Sheu, M.-H. Tsai, J.-F. Lee, and J.-J. Lee, Phase transitions in under high pressure, Solid State Commun. 150, 1564 (2010).
- Jiang et al. [2010] S. Jiang, J. Liu, C. Lin, L. Bai, W. Xiao, Y. Zhang, D. Zhang, X. Li, Y. Li, and L. Tang, Pressure-induced phase transition in cubic Lu2O3, J. Appl. Phys. 108, 083541 (2010).
- Palasyuk and Tkacz [2005] T. Palasyuk and M. Tkacz, Pressure-induced structural phase transition in rare-earth trihydrides. Part I. (GdH3, HoH3, LuH3), Solid State Commun. 133, 481 (2005).
- Kierey et al. [2001] H. Kierey, M. Rode, A. Jacob, A. Borgschulte, and J. Schoenes, Raman effect and structure of YH3 and YD3 thin epitaxial films, Phys. Rev. B 63, 134109 (2001).
- Vos et al. [1992] W. L. Vos, L. W. Finger, R. J. Hemley, J. Z. Hu, H. K. Mao, and J. A. Schouten, A high-pressure van der Waals compound in solid nitrogen-helium mixtures, Nature (London) 358, 46 (1992).
- Kuzovnikov et al. [2017] M. A. Kuzovnikov, M. Tkacz, H. Meng, D. I. Kapustin, and V. I. Kulakov, High-pressure synthesis of tantalum dihydride, Phys. Rev. B 96, 134120 (2017).
- Kuzovnikov et al. [2021] M. A. Kuzovnikov, V. E. Antonov, A. S. Ivanov, T. Hansen, S. Savvin, V. I. Kulakov, M. Tkacz, and A. I. Kolesnikov, Neutron scattering study of tantalum monohydride and monodeuteride, Int. J. of Hydrogen Energy 46, 20630 (2021).
- Sato et al. [2011] T. Sato, N. Funamori, and T. Yagi, Helium penetrates into silica glass and reduces its compressibility, Nature Commun. 2, 345 (2011).
- Merlen et al. [2005] A. Merlen, N. Bendiab, P. Toulemonde, A. Aouizerat, A. San Miguel, J. L. Sauvajol, G. Montagnac, H. Cardon, and P. Petit, Resonant Raman spectroscopy of single-wall carbon nanotubes under pressure, Phys. Rev. B 72, 035409 (2005).
- Merlen et al. [2006] A. Merlen, P. Toulemonde, N. Bendiab, A. Aouizerat, J. L. Sauvajol, G. Montagnac, H. Cardon, P. Petit, and A. San Miguel, Raman spectroscopy of open-ended single wall carbon nanotubes under pressure: Effect of the pressure transmitting medium, Phys. Status Solidi (b) 243, 690 (2006).
- Schirber et al. [1995] J. E. Schirber, G. H. Kwei, J. D. Jorgensen, R. L. Hitterman, and B. Morosin, Room-temperature compressibility of C60: Intercalation effects with He, Ne, and Ar, Phys. Rev. B 51, 12014 (1995).
- Yagi et al. [2007] T. Yagi, E. Iida, H. Hirai, N. Miyajima, T. Kikegawa, and M. Bunno, High-pressure behavior of a SiO2 clathrate observed by using various pressure media, Phys. Rev. B 75, 174115 (2007).
- Gauthier et al. [1986] M. Gauthier, Ph. Pruzan, J. Besson, G. Hamel, and G. Syfosse, Investigation of the phase diagram of ammonia by Raman scattering, Phys. B+C (Amsterdam) 139–140, 218 (1986).
- Gauthier et al. [1988] M. Gauthier, Ph. Pruzan, J. C. Chervin, and J. M. Besson, Raman scattering study of ammonia up to 75 GPa: Evidence for bond symmetrization at 60 GPa, Phys. Rev. B 37, 2102 (1988).
- Ouillon et al. [1990] R. Ouillon, C. Turc, J.-P. Lemaistre, and P. Ranson, High resolution Raman spectroscopy in the and crystalline phases of N2, J. Chem. Phys. 93, 3005 (1990).
- Buchsbaum et al. [1984] S. Buchsbaum, R. L. Mills, and D. Schiferl, Phase diagram of nitrogen determined by Raman spectroscopy from 15 to 300 K at pressures to 52 GPa, J. Phys. Chem. 88, 2522 (1984).
- Ohno et al. [2021] H. Ohno, Y. Iizuka, and S. Fujita, Pure rotational Raman spectroscopy applied to N2/O2 analysis of air bubbles in polar firn, J. Glaciol. 67, 903 (2021).
- Ninet et al. [2006] S. Ninet, F. Datchi, A. M. Saitta, M. Lazzeri, and B. Canny, Raman spectrum of ammonia IV, Phys. Rev. B 74, 104101 (2006).
- Suehiro et al. [2004] T. Suehiro, N. Hirosaki, Y. Yamamoto, T. Nishimura, M. Mitomo, J. Takahashi, and H. Yamane, preparation of lutetium nitride by direct nitridation, J. Mater. Res. 19, 959 (2004).
- Granville et al. [2009] S. Granville, C. Meyer, A. R. H. Preston, B. M. Ludbrook, B. J. Ruck, H. J. Trodahl, T. R. Paudel, and W. R. L. Lambrecht, Vibrational properties of rare-earth nitrides: Raman spectra and theory, Phys. Rev. B 79, 054301 (2009).
- Singh and Verma [2015] S. K. Singh and U. P. Verma, Investigation of high pressure phase transition and electronic properties of lutetium nitride, J. Phys.: Conf. Ser. 640, 012029 (2015).
- Chouhan et al. [2011] S. S. Chouhan, G. Pagare, P. Soni, S. P. Sanyal, A. B. Garg, R. Mittal, and R. Mukhopadhyay, High pressure phase transition and elastic properties of lutetium monopnictides, in Solid State Physics, Proceedings of the 55th DAE Solid State Physics Symposium 2010 (Manipal University, Manipal, India, 26-30 December 2010 American Institute of Physics, Melville, NY, 2011) pp. 97–98.
- Niwa et al. [2009] K. Niwa, M. Hasegawa, and T. Yagi, Synthesis of Ln nitrides (Ln=Ce, Pr, Gd, Lu) in high pressure and temperature, J. Alloys Compd. 477, 493 (2009).
- Lucrezi et al. [2023] R. Lucrezi, P. P. Ferreira, M. Aichhorn, and C. Heil, Temperature and quantum anharmonic lattice effects in lutetium trihydride: Stability and superconductivity arXiv:2304.06685 [cond-mat] .
- Daou and Bonnet [1965] J. N. Daou and J. Bonnet, Étude de la résistivité des phases solides du système lutétium-hydrogène, C. R. Hebd. Seances Acad. Sci. 261, 1675 (1965).
- Subramanian and Smith [1982] P. Subramanian and J. Smith, Hydrogen vapor pressure measurements over a portion of the Lu-H system, J. Less-Common Met. 87, 205 (1982).
- Bonnet [1976] J. Bonnet, The effect of hydrogen solution on the anisotropy of the crystalline properties of rare-earth metals, J. Less-Common Met. 49, 451 (1976).
- Daou and Bonnet [1974] J. Daou and J. Bonnet, A new behaviour of the interstitial element H or D in solution in rare-earth metal, J. Phys. Chem. Solids 35, 59 (1974).
- Yang and An [2016] J. Yang and L. An, Elasticity, ideal tensile strength and lattice dynamics of LuH2 dihydride from first-principles investigations, Int. J. Hydrogen Energy 41, 2720 (2016).
- Bonnet and Daou [1977] J. E. Bonnet and J. N. Daou, Rare-earth dihydride compounds: Lattice thermal expansion and investigation of the thermal dissociation, J. Appl. Phys. 48, 964 (1977).
- Kim et al. [2023] S.-W. Kim, L. J. Conway, C. J. Pickard, G. L. Pascut, and B. Monserrat, Microscopic theory of colour in lutetium hydride Nat. Commun. 14, 7360 (2023).
- Luo et al. [2023] Q. Luo, C. Lu, L. Liu, and M. Zhu, A review on the synthesis of transition metal nitride nanostructures and their energy related applications, Green Energy Environ. 8, 406 (2023).
- Dierkes et al. [2017] T. Dierkes, J. Plewa, and T. Jüstel, From metals to nitrides - Syntheses and reaction details of binary rare earth systems, J. Alloys Compd. 693, 291 (2017).
- Ferreira et al. [2023] P. P. Ferreira, L. J. Conway, A. Cucciari, S. Di Cataldo, F. Giannessi, E. Kogler, L. T. F. Eleno, C. J. Pickard, C. Heil, and L. Boeri, Search for ambient superconductivity in the Lu-N-H system, Nat. Commun. 14, 5367 (2023).
- Dias [2023] R. Dias, High temperature and low pressure superconductor, World intellectual Property Organization Publication No. WO/2023/064019 ,Internation Application No. PCT/US2022/038408 (2023).
- Kume et al. [2007] T. Kume, H. Ohura, S. Sasaki, H. Shimizu, A. Ohmura, A. Machida, T. Watanuki, K. Aoki, and K. Takemura, High-pressure study of YH3 by Raman and visible absorption spectroscopy, Phys. Rev. B 76, 024107 (2007).
- Yao and Klug [2010] Y. Yao and D. D. Klug, Consecutive Peierls distortions and high-pressure phase transitions in YH3, Phys. Rev. B 81, 140104(R) (2010).
- Kume et al. [2011] T. Kume, H. Ohura, T. Takeichi, A. Ohmura, A. Machida, T. Watanuki, K. Aoki, S. Sasaki, H. Shimizu, and K. Takemura, High-pressure study of ScH3: Raman, infrared, and visible absorption spectroscopy, Phys. Rev. B 84, 064132 (2011).
- Peng et al. [2023] D. Peng, Q. Zeng, F. Lan, Z. Xing, Y. Ding, and H.-k. Mao, The near-room-temperature upsurge of electrical resistivity in Lu-H-N is not superconductivity, but a metal-to-poor-conductor transition, Matter Radiat. Extremes 8, 058401 (2023).
- Salke et al. [2023] N. P. Salke, A. C. Mark, M. Ahart, and R. J. Hemley, Evidence for near ambient superconductivity in the Lu-N-H system arXiv:2306.06301 [cond-mat.supr-con].
- Pebler and Wallace [1962] A. Pebler and W. E. Wallace, Crystal structures of some lanthanide hydrides, J. Phys. Chem. 66, 148 (1962).
- Rodríguez-Carvajal [1993] J. Rodríguez-Carvajal, Recent advances in magnetic structure determination by neutron powder diffraction, Phys. B (Amsterdam) 192, 55 (1993).
- Prescher and Prakapenka [2015] C. Prescher and V. B. Prakapenka, DIOPTAS : A program for reduction of two-dimensional X-ray diffraction data and data exploration, High Pressure Res. 35, 223 (2015).
- Toby and Von Dreele [2013] B. H. Toby and R. B. Von Dreele, GSAS-II: The genesis of a modern open-source all purpose crystallography software package, J. Appl. Crystallogr. 46, 544 (2013).
- Klotz et al. [2009] S. Klotz, J.-C. Chervin, P. Munsch, and G. Le Marchand, Hydrostatic limits of 11 pressure transmitting media, J. Phys. D: Appl. Phys. 42, 075413 (2009).
- Bonnet and Daou [1971] J. Bonnet and J. N. Daou, Étude radiocristallographique de la phase alpha du système lutétium-hydrogène entre 25 et 540°C. Coefficients moyens d’expansion thermique., C. R. Seances Acad. Sci., Ser. C 272, 1697 (1971).
- Eremets and Troyan [2011] M. I. Eremets and I. A. Troyan, Conductive dense hydrogen, Nat. Mater. 10, 927 (2011).
- Eremets et al. [2023] M. I. Eremets, V. S. Minkov, P. P. Kong, A. P. Drozdov, S. Chariton, and V. B. Prakapenka, Universal diamond edge Raman scale to 0.5 terapascal and implications for the metallization of hydrogen, Nat. Commun. 14, 903 (2011).
- Sharma et al. [1980] S. K. Sharma, H. K. Mao, and P. M. Bell, Raman measurements of hydrogen in the pressure range 0.2-630 kbar at room temperature, Phys. Rev. Lett. 44, 886 (1980).