CCD UBV and Gaia DR3 based analysis of NGC 189, NGC 1758 and NGC 7762 open clusters
Abstract
This paper presents photometric, astrometric, and kinematic analyses of the open clusters NGC 189, NGC 1758 and NGC 7762 based on CCD UBV photometric and Gaia Data Release 3 (DR3) data. According to membership analyses, we identified 32, 57 and 106 most probable member stars with membership probabilities in NGC 189, NGC 1758 and NGC 7762, respectively. The color excesses and photometric metallicities of each cluster were determined separately using UBV two-color diagrams. The color excess is mag for NGC 189, mag for NGC 1758 and mag for NGC 7762. The photometric metallicity [Fe/H] is dex for both NGC 189 and NGC 1758, and dex for NGC 7762. Distance moduli and ages of the clusters were obtained by comparing PARSEC isochrones with the color-magnitude diagrams constructed from UBV and Gaia photometric data. During this process, we kept as constant color excess and metallicity for each cluster. The estimated isochrone distance is pc for NGC 189, pc for NGC 1758 and pc for NGC 7762. These are compatible with the values obtained from trigonometric parallax. Ages of the clusters are Myr, Myr and Myr for NGC 189, NGC 1758 and NGC 7762, respectively. Galactic orbit integration of the clusters showed that NGC 1758 completely orbits outside the solar circle, while NGC 189 and NGC 7762 enter the solar circle during their orbits.
keywords:
\KWDGalaxy: open clusters and associations; individual: NGC 189, NGC 1758, NGC 7762 , Database: Gaia Photometry: color-magnitude diagram , Galaxy kinematics; Stellar kinematics;1 Introduction
Open clusters consist of stars initially gravitationally bound together, sharing similar positional and kinematic characteristics. Such clusters in our Galaxy are younger and of higher metallicity than the Milky Way’s globular clusters. As they formed from the same molecular cloud, member stars share the same general distance, chemical composition and age but vary in formation masses (the initial mass function). These properties make them ‘laboratories’ allowing the study of stellar formation (Scalo, 1998; Hopkins, 2018), evolution (Donor et al., 2020), kinematics (Tarricq et al., 2021), and dynamics (Krumholz et al., 2019). Combining results from studies of many open clusters allows them to be used as tracers of the formation and chemical evolution of the Galactic disc (Adamo et al., 2020). This paper is a part of a wider programme (Bilir et al., 2006a, 2010, 2016; Bostancı et al., 2015; Yontan et al., 2015, 2019, 2021; Ak et al., 2016; Banks et al., 2020; Akbulut et al., 2021; Koç et al., 2022; Yontan, 2023) applying a common methodology, building up such information. It makes use of ground-based photometry in combination with astrometric data from the Gaia mission (Gaia Collaboration et al., 2016, 2018, 2021, 2022), allowing the statistical removal of field stars, which act as a contaminant since they are unrelated to the cluster. The precise determination of cluster parameters requires a thorough and careful removal of this contamination, as will be outlined below.
The Gaia mission leads the way in the precise determination of cluster membership as well as being helpful for astrometric solutions, trigonometric parallaxes, and radial velocities of open clusters. The third data release of the European Space Agency’s Gaia mission (hereafter Gaia DR3, Gaia Collaboration et al., 2022) contains a great variety of new information, such as an extended radial velocity survey and astrophysical characterisation of Gaia objects. Due to the longer period data have been collected over, Gaia DR3 is of higher quality than the earlier Gaia DR2 (Gaia Collaboration et al., 2018) and Gaia DR1 (Gaia Collaboration et al., 2016) releases. As the first part of Gaia DR3, the third (early) data release Gaia EDR3 (Gaia Collaboration et al., 2021) contains astrometric, photometric and spectroscopic data for around 1.8 billion objects. Gaia DR3 has the same source catalogue as Gaia EDR3 but supplements it in the sense of the large variety of new data products. For many celestial objects, Gaia DR3 includes their astrophysical parameters estimated from parallaxes, broadband photometry, and mean radial velocity spectra (Gaia Collaboration et al., 2022). In Gaia DR3, trigonometric parallax errors are 0.02-0.07 mas for mag, 0.5 mas for mag and reach 1.3 mas for mag. The proper-motion errors are 0.02 – 0.07 mas yr-1, reaching up to 0.5 mas yr-1 for mag and 1.4 mas yr-1 for mag.
This study explores the clusters NGC 189, NGC 1758 and NGC 7762. These clusters were selected from an ongoing UBVRI photometric survey of Galactic stellar clusters at the San Pedro Martir Observatory. The current study constitutes the second of our paper series based on this survey (Yontan, 2023), as part of the wider programme described above. The paper outlines an analysis combining CCD UBV and recent Gaia DR3 photometric and astrometric data. Independent methods, such as those estimating the color excess and metallicity parameters, reduced possible parameter degeneracy and lead to reliable estimates for astrophysical parameters of all three clusters.
1.1 NGC 189
NGC 189 (, , , , SIMBAD111https://simbad.unistra.fr/simbad/ J2000) was likely discovered by Caroline Herschel in 1783 (Hoskin, 2006). The cluster was examined by Alter (1944) who mentioned that the cluster lies in a comparatively rich region, and estimated its distance as pc and diameter pc. Balazs (1961) presented color-magnitude and two-color diagrams for the cluster, estimating a distance of 790 pc. de la Fuente Marcos & de la Fuente Marcos (2009) noted NGC 189 in their list of candidate binary clusters, matching it with ASCC 4 (Kharchenko et al., 2005). The cluster has been included in many subsequent studies, such as those based on Gaia data (Cantat-Gaudin et al., 2018; Liu & Pang, 2019; Cantat-Gaudin et al., 2020; Dias et al., 2021; Poggio et al., 2021), with results listed in Table 1 for ease of comparison. The table also provides comparisons for NGC 1758 and NGC 7762.
1.2 NGC 1758
Dreyer (1888) noted three overlapping open clusters: NGC 1746, NGC 1750 and NGC 1758 (, , , , SIMBAD J2000). Since then there has been disagreement between authors of the existence of one or more of these clusters. Cuffey & Shapley (1937) presented blue and red photographic photometry for NGC 1746 (down to mag), with no mention of either NGC 1750 or NGC 1758, commenting that NGC 1746 is a thin and asymmetrical cluster. Straizys et al. (1992) conducted Vilnius photometry (Straižys, 1992) down to V 13 of 116 stars in the vicinity of the three clusters. They concluded that NGC 1746 is probably not a cluster and were not confident that the other two groupings were real as well. Tian et al. (1998) concluded there were only two clusters (NGC 1750 and NGC 1758). Galadi-Enriquez et al. (1998a, b) disagreed with Cuffey & Shapley’s identification of NGC 1746 based on their Johnson-Cousins CCD UBVRI photometry, which they judged as completed down to V 18.5 mag. Galadi-Enriquez et al. (1998b) wrote that there was no photometric evidence for the cluster NGC 1746 and that Cuffey & Shapley (1937) had erroneously assigned a stellar concentration of NGC 1758 as the asymmetric nucleus of NGC 1746. Galadí-Enríquez et al. (1999) noted NGC 1750 and NGC 1758 to be poor and loose, concluding from their relative velocity, separation, and age difference that they are physically independent clusters. Landolt & Africano (2010) undertook UBV broadband photometry for 19 stars in the direction of the suspected clusters, admitting confusion on the number of clusters that might be present. Table 1 succinctly presents parameters from the literature for NGC 1758, such as color excess, distance moduli, distances, iron abundances, age, proper-motion components, and radial velocity.
1.3 NGC 7762
Chincarini (1966) presented UBV photographic photometry of NGC 7762 (, , , , SIMBAD J2000), classifying the cluster as Trumpler class II 1 m U, 1020 pc away and of diameter 3.5 pc. Patat & Carraro (1995) reported CCD BV photometry of the central region of the cluster, commenting that it was very loose in structure and large. They concluded that NGC 7762 is of intermediate age, being Gyr old and pc distance. Szabo (1999) identified photometrically variable stars in the cluster. No Scuti variables were found, which they concluded as confirming that NGC 7762 is older than 800 Myr in age. Bonatto & Bica (2011) presented a proper motion distribution function for the cluster, characterised as a single Gaussian. Casamiquela et al. (2016) undertook high-resolution spectroscopy of the cluster, providing estimates for , and cluster velocities in the Cartesian Galactocentric frame, while Reddy & Lambert (2019) analysed high-dispersion Echelle spectra (=60 000) of red giant members to derive a [Fe/H] value of dex for NGC 7762.
| NGC 189 | ||||||||
| [Fe/H] | Ref | |||||||
| (mag) | (mag) | (pc) | (dex) | (Myr) | (mas yr-1) | (mas yr-1) | (km s | |
| 0.44 | 11.52 | 1080 | — | 2 | — | — | — | (01) |
| 0.56 | 11.35 | 860 | — | — | — | — | — | (02) |
| 0.700 | — | 1300 | — | 510 | — | (03) | ||
| — | — | — | — | — | 0.59 | 0.10 | — | (04) |
| 0.700 | — | 1300 | — | 51060 | — | — | — | (05) |
| 0.420 | — | 752 | — | 10 | +0.343.23 | 1.93 | — | (06) |
| 0.323 | — | 1088 | — | 380 | +2.7611.368 | 0.947 | — | (07) |
| — | — | — | — | +0.3380.016 | 0.023 | — | (08) | |
| — | — | — | — | +0.3380.016 | 0.023 | 0.75 | (09) | |
| — | — | 130246 | — | 56234 | +0.3230.280 | 0.195 | — | (10) |
| 0.497 | 11.991 | 1228 | — | 400 | +0.3380.071 | 0.109 | — | (11) |
| — | — | — | — | +0.3380.016 | 0.023 | — | (12) | |
| 0.6020.045 | — | 124749 | 0.1190.152 | 490490 | +0.3360.120 | 0.176 | 0.534 | (13) |
| 0.5900.023 | 12.2270.094 | 120153 | -0.080.03 | 50050 | +0.3520.032 | 0.038 | 0.32 | (14) |
| NGC 1758 | ||||||||
| 0.370.02 | — | 68024 | — | — | — | — | — | (15) |
| 0.340.07 | 10.45 | 760 | — | 400100 | +0.70 | — | (16) | |
| 0.34 | — | 760 | — | — | — | — | — | (17) |
| — | — | — | — | — | 2.32 | 0.76 | — | (04) |
| 0.34 | — | 760 | — | 400 | 4.83 | 3.31 | — | (06) |
| 0.327 | — | 621 | — | 540 | 0.012 | 0.116 | — | (07) |
| — | — | — | — | 0.013 | 0.010 | — | (08) | |
| — | — | 90756 | — | 35521 | 0.257 | 0.204 | — | (10) |
| 0.2990.007 | 0.025 | 93111 | 0.00 | — | — | — | (18) | |
| 0.300 | 10.67 | 885 | — | 355 | 0.146 | 0.129 | — | (11) |
| — | — | — | — | +3.1560.013 | 0.010 | — | (12) | |
| 0.3880.019 | — | 86429 | 0.0980.073 | 54070 | +3.1560.157 | 0.118 | 17.8409.887 | (13) |
| 0.3100.022 | 10.7360.078 | 90233 | 0.03 | 65050 | +3.1410.035 | 0.025 | 6.802.90 | (14) |
| NGC 7762 | ||||||||
| 1.02 | 13.10 | 1020 | — | 155 | — | — | — | (19) |
| 0.90 | 12.20 | 800 | — | 1800 | — | — | — | (20) |
| — | 2000 | — | — | — | (21) | |||
| 0.59 | 0.00 | — | — | — | (22) | |||
| 0.550 | — | 780 | — | 2360180 | 0.00 | — | (03) | |
| — | — | — | — | — | — | — | 0.7 | (23) |
| 0.550 | — | 780 | — | 2100100 | — | — | — | (05) |
| — | — | 780 | 0.010.04 | 2500 | — | — | — | (24) |
| — | — | — | — | +1.4520.010 | 0.010 | — | (08) | |
| — | — | — | — | +1.4520.010 | 0.010 | 0.14 | (09) | |
| — | — | — | 0.04 | — | — | — | — | (25) |
| — | — | 100541 | — | 2630158 | +1.4780.274 | +4.0020.248 | — | (10) |
| 0.616 | 11.76 | 897 | — | 2050 | +1.4520.010 | 0.010 | — | (11) |
| — | — | — | — | +1.4520.010 | 0.010 | — | (12) | |
| 0.8400.017 | — | 95713 | 0.103 | 1100370 | +1.4610.203 | +4.0060.198 | 0.492 | (13) |
| 0.6400.017 | 11.7810.072 | 91131 | 0.02 | 2000200 | +1.4890.023 | +3.9620.024 | 0.10 | (14) |
(01) Lindoff (1968), (02) Becker & Fenkart (1971), (03) Kharchenko et al. (2013), (04) Dias et al. (2014), (05) Joshi et al. (2016), (06) Sampedro et al. (2017), (07) Loktin & Popova (2017), (08) Cantat-Gaudin et al. (2018), (09) Soubiran et al. (2018), (10) Liu & Pang (2019), (11) Cantat-Gaudin et al. (2020), (12) Cantat-Gaudin & Anders (2020), (13) Dias et al. (2021), (14) This study, (15) Straizys et al. (1992), (16) Galadi-Enriquez et al. (1998a), (17) Straižys et al. (2003), (18) Bossini et al. (2019), (19) Chincarini (1966), (20) Patat & Carraro (1995), (21) Maciejewski & Niedzielski (2007), (22) Maciejewski et al. (2008), (23) Casamiquela et al. (2016), (24) Casamiquela et al. (2017), (25) Reddy & Lambert (2019)
2 Observations
2.1 CCD UBV photometric data
The observations of these three clusters were collected by R. Michel at the San Pedro Martir Observatory as part of an ongoing222http://bufadora.astrosen.unam.mx/~rmm/SPMO_UBVRI_Survey/Clusters_All.html UBVRI photometric survey of Galactic stellar clusters. In the case of these clusters, the 0.84-m () Ritchey–Chretien telescope was employed along with the Mexman filter wheel and the Marconi 5 camera (a 15m square-pixel E2V CCD31-42 detector with a gain of /ADU and a readout noise of with binning employed, providing an unvignetted field of view of arcmin2). Exposure times were 2, 20 and 200s for both filters I and R; 3, 30 and 300 for filter V; 5, 50 and 500s for filter B; and 10, 100 and 1000s for filter U.
The observations were carried out during photometric conditions across different observing runs. NGC 189 was observed on 22 September 2015. NGC 1758 was observed on 4 February 2016, and NGC 7762 on 17 January 2015. Landolt’s standard stars (Landolt, 2009) were also observed, both at the meridian and at around two airmasses, in order to properly determine the transformation equations. Flat fields were taken at the beginning and the end of each night. Bias images were obtained between cluster observations. Data reduction with point spread function (PSF) photometry was carried out with the IRAF/DAOPHOT packages. The transformation equations recommended by Stetson et al. (2019) were employed.
2.2 Gaia Data
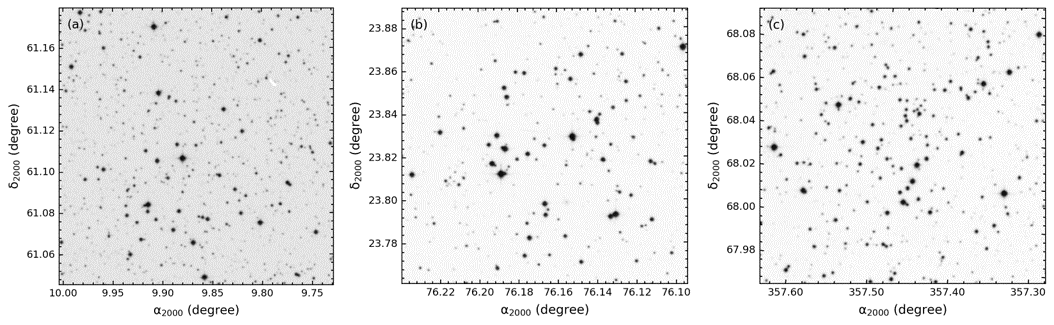
The Gaia DR3 database (Gaia Collaboration et al., 2022) was used together with CCD UBV photometry to accomplish astrometric, photometric, and kinematic analyses of NGC 189, NGC 1758 and NGC 7762. We extracted data from the Gaia DR3 database within a 40 arcmin radius (centred on literature cluster centres) and matched it with the UBV data according to stars’ equatorial coordinates, taking into account distances between coordinates of less than 5 arcsec between the data sets. Hence we created photometric and astrometric catalogues for the three clusters containing the detected stars’ positions (), apparent magnitudes, and color indices, Gaia DR3 proper-motion components (), trigonometric parallaxes (), apparent magnitudes, and color indices as well as the membership probabilities () which were calculated in this study (Table 2, page 2). UBV and Gaia based photometric and astrometric data for each star located in the cluster areas are available electronically for NGC 189, NGC 1758 and NGC 7762.333The complete tables can be obtained from VizieR electronically. field of view optical images for the clusters under study are presented in Figure 1. The photometric errors in UBV and Gaia DR3 data were adopted as internal errors, which are the uncertainties of the instrumental magnitudes of the stars. The mean errors in the UBV and Gaia DR3 photometric data were calculated as functions of apparent magnitude. The results are given in Table 3 (on page 3). We found that the mean errors in magnitude reach up to 0.1 mag, while for the and color indices, the mean errors are about 0.3 mag and 0.2 mag, respectively, for the three clusters. The mean errors in magnitudes reach up to 0.01 mag, whereas in the color index they are less than 0.25 mag for the stars mag (see Table 3).
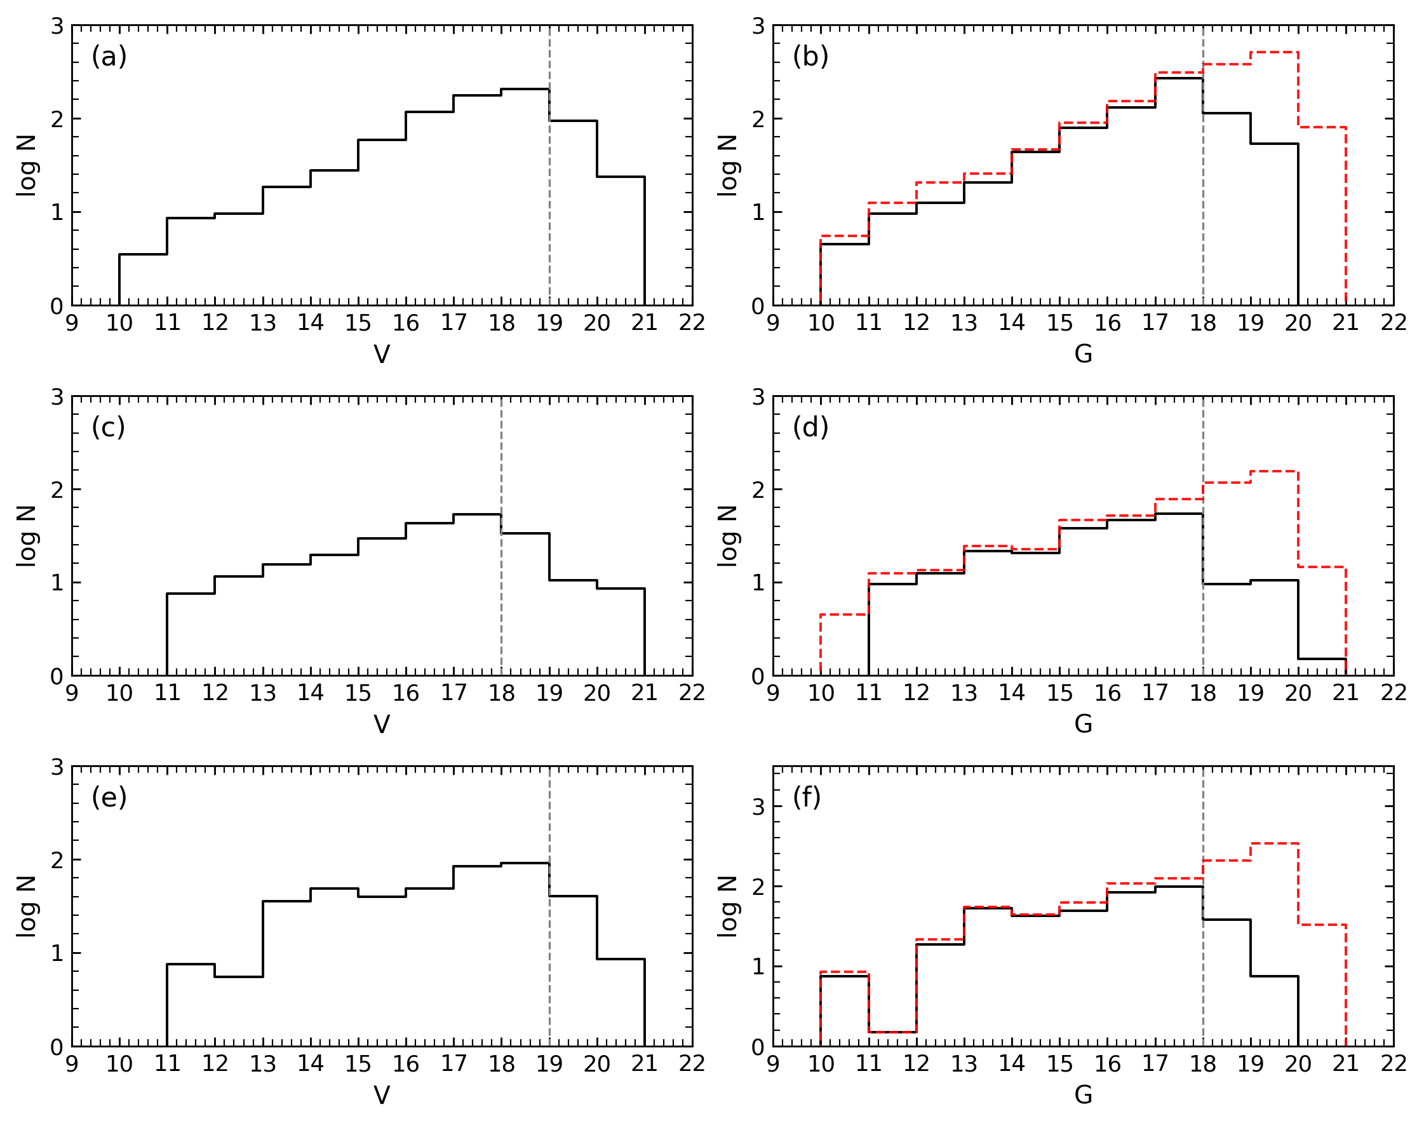
Crowding by other stellar images in CCD frames can prevent the detection of faint stars in the clusters. This crowding will lower the number of detected faint stars, dropping the ‘completeness’ from unity (where all stars are detected). Understanding the decreasing completeness of the measured stellar counts with increasing magnitude is necessary to derive reliable astrophysical parameters of open clusters. To define photometric completeness limits for the three clusters, we constructed histograms of the observed and magnitudes (Fig. 2). We compared the observed magnitude histograms with the Gaia DR3 data for the region on the sky matching the fields observed from the ground. All histograms for stellar counts are shown in Fig. 2: the black solid lines show the observational stellar distributions by magnitude bin in and , while the red solid lines (see in Fig. 2b, 2d and 2f) represent the Gaia DR3 based stellar counts. It can be seen in Fig. 2b, 2d and 2f that the numbers of stars detected in the three cluster regions are well matched with the Gaia DR3 stellar distributions up to fainter magnitudes. The magnitudes adopted as photometric completeness limits are mag for NGC 189 and NGC 7762, mag for NGC 1758 and mag for all clusters (the limits are the vertical dashed lines in all panels of Fig. 2). In Fig. 2b, 2d and 2f the number of stars decreases with the increasing crowding of low-mass stars beyond the adopted completeness limits. Observational techniques, telescope-detector combinations, and telescope qualities used in ground and space-based observations have an impact on detecting stars, especially at fainter magnitudes. This could clarify the reason why the stellar counts fainter than mag in the Gaia space-based observations are greater than the number of detected stars in the study.
. NGC 189 ID RA DEC (hh:mm:ss.ss) (dd:mm:ss.ss) (mag) (mag) (mag) (mag) (mag) (mas yr-1) (mas yr-1) (mas) 001 00:39:31.15 +61:06:23.67 10.933(0.008) 0.522(0.065) 0.863(0.064) 10.844(0.011) 1.302(0.005) — — — — 002 00:39:37.97 +61:10:12.88 11.221(0.025) 0.202(0.045) 0.590(0.050) 11.210(0.009) 0.854(0.005) — — — — 003 00:39:28.64 +61:03:56.79 11.831(0.029) 0.331(0.040) 0.443(0.047) 11.789(0.003) 0.611(0.005) -6.112(0.012) 0.382(0.014) 1.097(0.013) 0.00 004 00:39:12.49 +61:04:31.15 11.837(0.019) 0.428(0.038) 0.628(0.041) 11.655(0.003) 0.935(0.005) -0.628(0.037) -3.088(0.043) 0.859(0.39) 0.00 … … … … … … … … … … … … … … … … … … … … … … … … 733 00:39:45.99 +61:06:59.69 21.435(0.179) — 0.945(0.234) 20.808(0.012) 1.424(0.210) -2.461(01.585) 1.607(1.503) 0.727(1.303) 0.00 734 00:39:13.34 +61:07:07.29 21.583(0.165) — 0.673(0.211) — — — — — 735 00:39:04.22 +61:05:07.37 21.587(0.187) — 1.428(0.333) 20.924(0.022) 1.843(0.368) — — — 736 00:39:25.31 +61:05:25.71 21.655(0.272) — 0.886(0.317) 20.744(0.010) 1.340(0.176) -2.047(1.038 ) 1.115(1.132) 0.025(0.925) 0.01 NGC 1758 001 05:04:22.95 +23:52:14.48 11.105(0.074) 0.267(0.101) 0.429(0.111) 11.009(0.003) 0.641(0.005) 3.112(0.022) -3.649(0.016) 1.179(0.020) 0.99 002 05:04:31.31 +23:47:34.80 11.346(0.071) 0.254(0.092) 0.413(0.103) 11.266(0.003) 0.620(0.005) 3.019(0.025) -3.438(0.019) 1.117(0.021) 1.00 003 05:04:46.38 +23:49:00.94 12.101(0.048) 0.334(0.068) 0.434(0.075) 11.997(0.003) 0.662(0.005) 3.136(0.018) -3.547(0.013) 1.138(0.016) 1.00 004 05:04:56.17 +23:48:43.25 12.334(0.045) 0.322(0.062) 0.401(0.070) 12.200(0.003) 0.633(0.005) 2.927(0.020) -3.330(0.014) 1.159(0.017) 0.99 … … … … … … … … … … … … … … … … … … … … … … … … 226 05:04:26.84 +23:46:42.32 21.308(0.127) — 0.882(0.193) 21.004(0.025) 0.854(0.444) — — — 0.47 227 05:04:40.16 +23:51:46.41 21.359(0.132) — 0.253(0.176) — — — — — — 228 05:04:37.57 +23:48:04.10 21.385(0.162) — 0.720(0.217) 20.724(0.012) 0.641(0.260) 0.349 (2.355) -0.566(1.632) -1.666(1.586) 0.00 229 05:04:46.99 +23:47:08.86 21.585(0.170) — 0.939(0.260) 20.696(0.011) 0.968(0.427) -0.428(1.428) -1.276(1.079) 0.279 (1.264) 0.00 NGC 7762 001 23:49:21.67 +68:01:01.74 11.705(0.011) 1.218(0.012) 1.700(0.013) 10.794(0.003) 2.131(0.005) 1.290(0.018) 3.747 (0.019) 1.034(0.017) 0.98 002 23:50:31.42 +68:01:41.56 11.725(0.017) 1.204(0.014) 1.609(0.019) 10.904(0.003) 2.010(0.005) 1.345(0.021) 4.134 (0.022) 1.017(0.019) 0.98 003 23:50:13.51 +68:03:02.70 12.199(0.012) 1.094(0.009) 1.559(0.013) 11.482(0.003) 1.925(0.005) 3.135(0.015) -3.269(0.016) 1.034(0.014) 0.00 004 23:49:23.53 +68:04:24.88 12.471(0.052) 0.726(0.023) 1.266(0.056) 11.835(0.003) 1.763(0.005) 3.358(0.177) 0.207 (0.182) 1.661(0.174) 0.00 … … … … … … … … … … … … … … … … … … … … … … … … 403 23:50:01.51 +68:01:21.45 21.300(0.146) — 0.457(0.190) — — — — — — 404 23:49:28.77 +68:01:48.92 21.390(0.178) — 1.349(0.296) 20.462(0.007) 2.040(0.138) -0.890(0.759) -1.817(0.634) -0.506(0.581) 0.00 405 23:50:11.55 +68:01:49.47 21.491(0.205) — 1.227(0.326) — — — — — — 406 23:49:34.88 +67:58:37.81 21.912(0.267) — 0.575(0.355) 20.838(0.011) 1.772(0.235) -1.741(1.444) 1.070 (1.400) -1.654(1.290) 0.00
| NGC 189 | ||||||
|---|---|---|---|---|---|---|
| (10, 12] | 4 | 0.020 | 0.047 | 0.050 | 0.006 | 0.005 |
| (12, 14] | 17 | 0.015 | 0.026 | 0.028 | 0.003 | 0.005 |
| (14, 15] | 18 | 0.009 | 0.015 | 0.014 | 0.003 | 0.005 |
| (15, 16] | 27 | 0.009 | 0.018 | 0.012 | 0.003 | 0.007 |
| (16, 17] | 58 | 0.011 | 0.024 | 0.014 | 0.003 | 0.006 |
| (17, 18] | 117 | 0.015 | 0.041 | 0.021 | 0.003 | 0.010 |
| (18, 19] | 175 | 0.025 | 0.089 | 0.037 | 0.003 | 0.021 |
| (19, 20] | 204 | 0.038 | 0.171 | 0.062 | 0.003 | 0.039 |
| (20, 22] | 116 | 0.103 | 0.295 | 0.160 | 0.005 | 0.100 |
| NGC 1758 | ||||||
| (10, 12] | 4 | 0.072 | 0.097 | 0.107 | 0.003 | 0.005 |
| (12, 14] | 18 | 0.020 | 0.042 | 0.044 | 0.003 | 0.005 |
| (14, 15] | 15 | 0.010 | 0.022 | 0.021 | 0.003 | 0.005 |
| (15, 16] | 19 | 0.006 | 0.013 | 0.009 | 0.003 | 0.006 |
| (16, 17] | 29 | 0.011 | 0.017 | 0.014 | 0.003 | 0.008 |
| (17, 18] | 42 | 0.012 | 0.040 | 0.020 | 0.003 | 0.014 |
| (18, 19] | 53 | 0.021 | 0.074 | 0.032 | 0.003 | 0.030 |
| (19, 20] | 32 | 0.036 | 0.082 | 0.073 | 0.004 | 0.065 |
| (20, 22] | 17 | 0.099 | 0.226 | 0.158 | 0.010 | 0.240 |
| NGC 7762 | ||||||
| (10, 12] | 2 | 0.014 | 0.013 | 0.016 | 0.003 | 0.005 |
| (12, 14] | 12 | 0.019 | 0.013 | 0.021 | 0.003 | 0.005 |
| (14, 15] | 35 | 0.014 | 0.013 | 0.016 | 0.003 | 0.005 |
| (15, 16] | 48 | 0.008 | 0.016 | 0.010 | 0.003 | 0.006 |
| (16, 17] | 39 | 0.010 | 0.031 | 0.014 | 0.003 | 0.006 |
| (17, 18] | 48 | 0.014 | 0.077 | 0.026 | 0.003 | 0.011 |
| (18, 19] | 84 | 0.022 | 0.133 | 0.043 | 0.003 | 0.022 |
| (19, 20] | 90 | 0.038 | 0.186 | 0.076 | 0.003 | 0.048 |
| (20, 22] | 48 | 0.099 | — | 0.184 | 0.005 | 0.100 |
2.3 Spatial Structures of the Clusters
Before investigating the spatial structure of the three clusters, we determined the central equatorial coordinates (, ) by applying the star count method. The calculated central coordinates for NGC 189 and NGC 7762 are in agreement with the values given by Cantat-Gaudin et al. (2020). Results are listed in Table 4 (on page 4) for the three clusters.
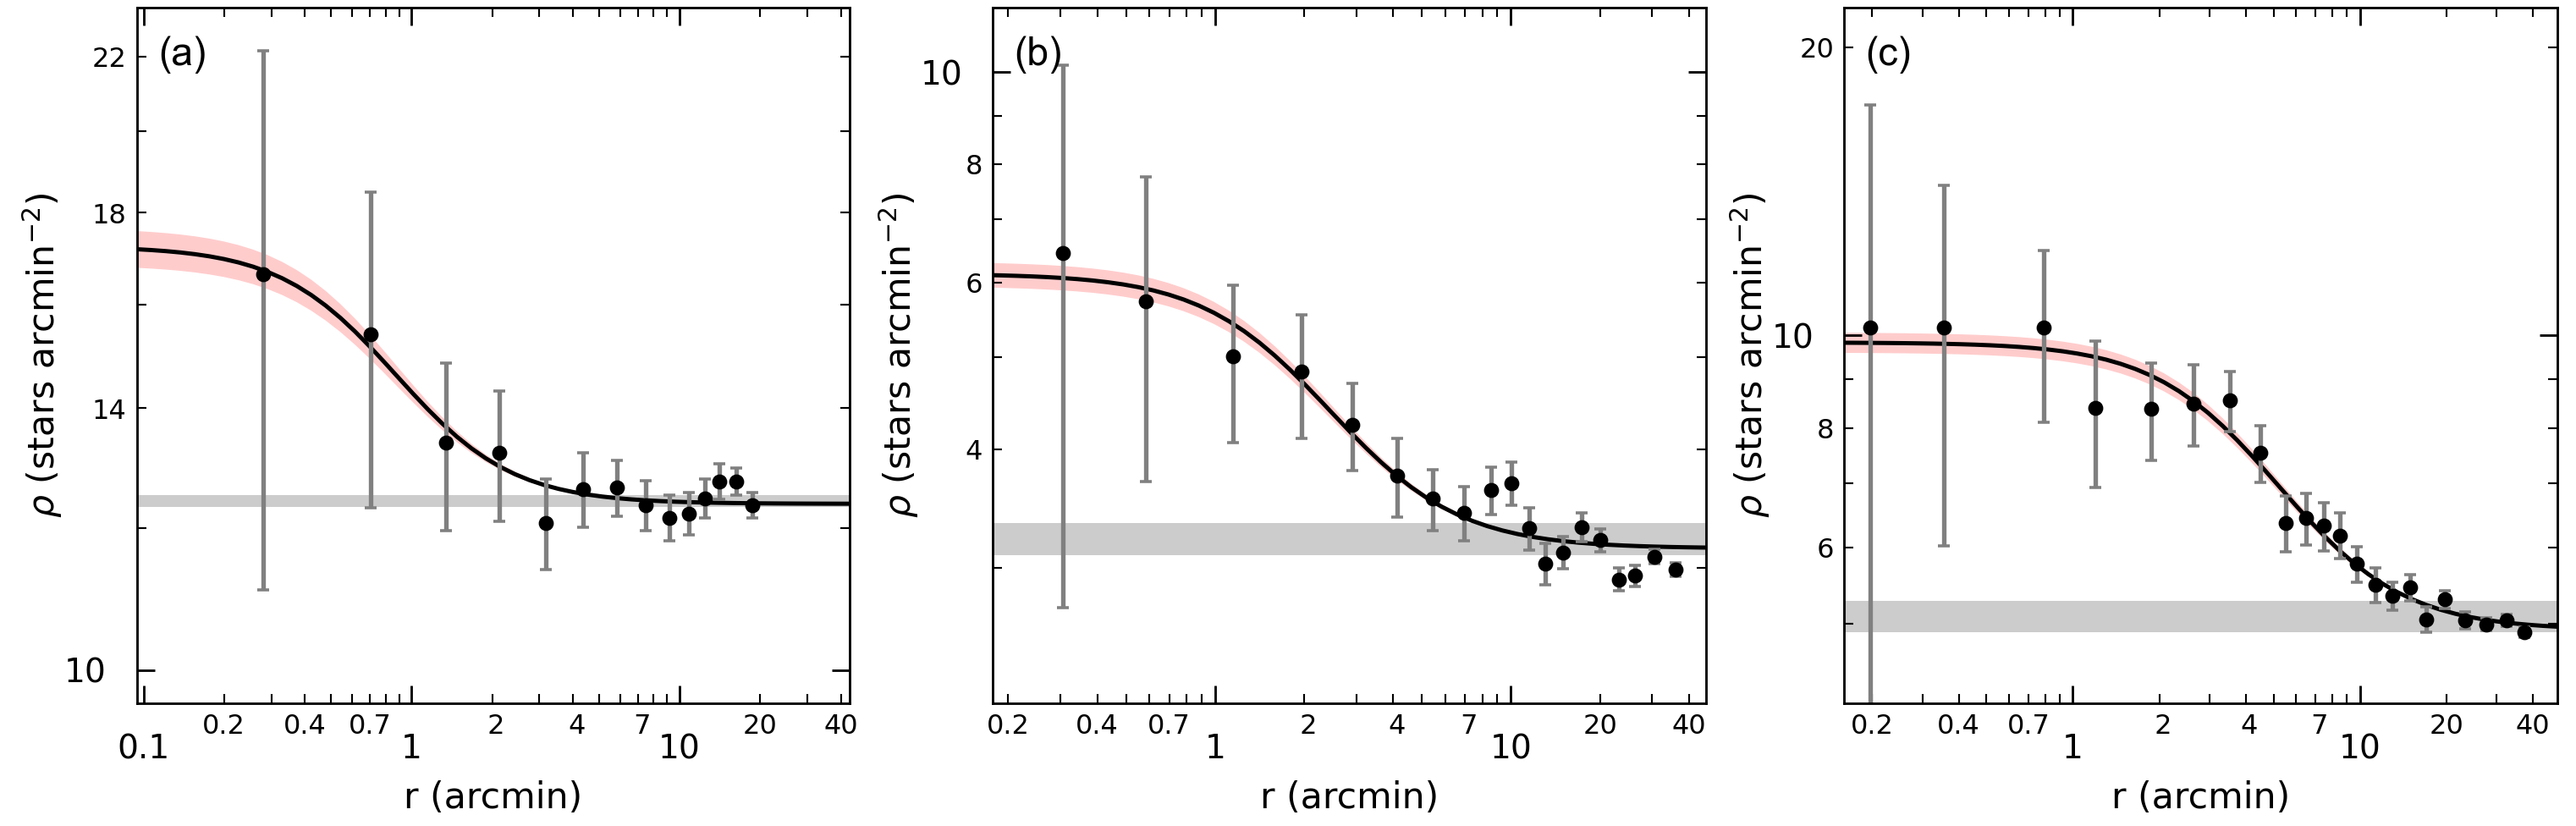
To measure the extent of the clusters, we used Gaia DR3 data within 40 arcmin of the derived cluster centres. Estimation of the structural parameters of NGC 189, NGC 1758 and NGC 7762 employed a radial density profile (RDP) for each cluster as shown in Figure 3 (page 3). We divided a cluster’s area into several concentric rings around the cluster center that we estimated in the study and calculated the stellar number density () for an th ring as , where and indicate the number of stars in that circle and the surface area, respectively. Uncertainties in the stellar number densities were estimated by Poisson statistics (, where is the number of stars). We fitted the empirical RDP of King (1962), which is expressed by the following formula:
| (1) |
where is the background stellar density, the central stellar density and the core radius of the cluster. The RDP fitting procedure utilized a minimization method. The derived structural parameters for each cluster are listed in Table 4 (page 4). The best-fit RDP of each cluster is represented by a solid line in the corresponding sub-figures of Figure 3. We estimated the limiting radii () according to a visual review of RDP. We identified that the limiting radius as the point where the background stellar density (shown by the horizontal grey band in Figure 3) matches with or equals the RDP. We therefore considered the limiting radii as for NGC 189, for NGC 1758 and for NGC 7762. To determine the mathematical accuracy of these visually determined values, we used the equation of Bukowiecki et al. (2011):
| (2) |
We therefore calculated the limiting radii () as for NGC 189, for NGC 1758 and for NGC 7762 (see also Table 4). The fact that the calculated limiting radii are compatible with the observational values, and that the correlation coefficients of the King models with the best-fit model parameters to the data are higher than , indicates that the estimated structural parameters are well estimated.
| Cluster | ||||||||
|---|---|---|---|---|---|---|---|---|
| (hh:mm:ss.ss) | (dd:mm:ss.ss) | (stars arcmin-2) | (stars arcmin-2) | (arcmin) | (arcmin) | (arcmin) | ||
| NGC 189 | 00:39:27.89 | +61:06:46.35 | 4.860.41 | 12.380.08 | 0.810.12 | 4 | 3.55 | 0.959 |
| NGC 1758 | 05:04:42.00 | +23:48:46.90 | 2.970.17 | 3.140.08 | 2.130.28 | 7 | 7.18 | 0.951 |
| NGC 7762 | 23:49:53.00 | +68:02:06.00 | 4.910.24 | 4.920.13 | 4.390.46 | 15 | 14.95 | 0.957 |
2.4 Color-Magnitude diagrams and membership probabilities of stars
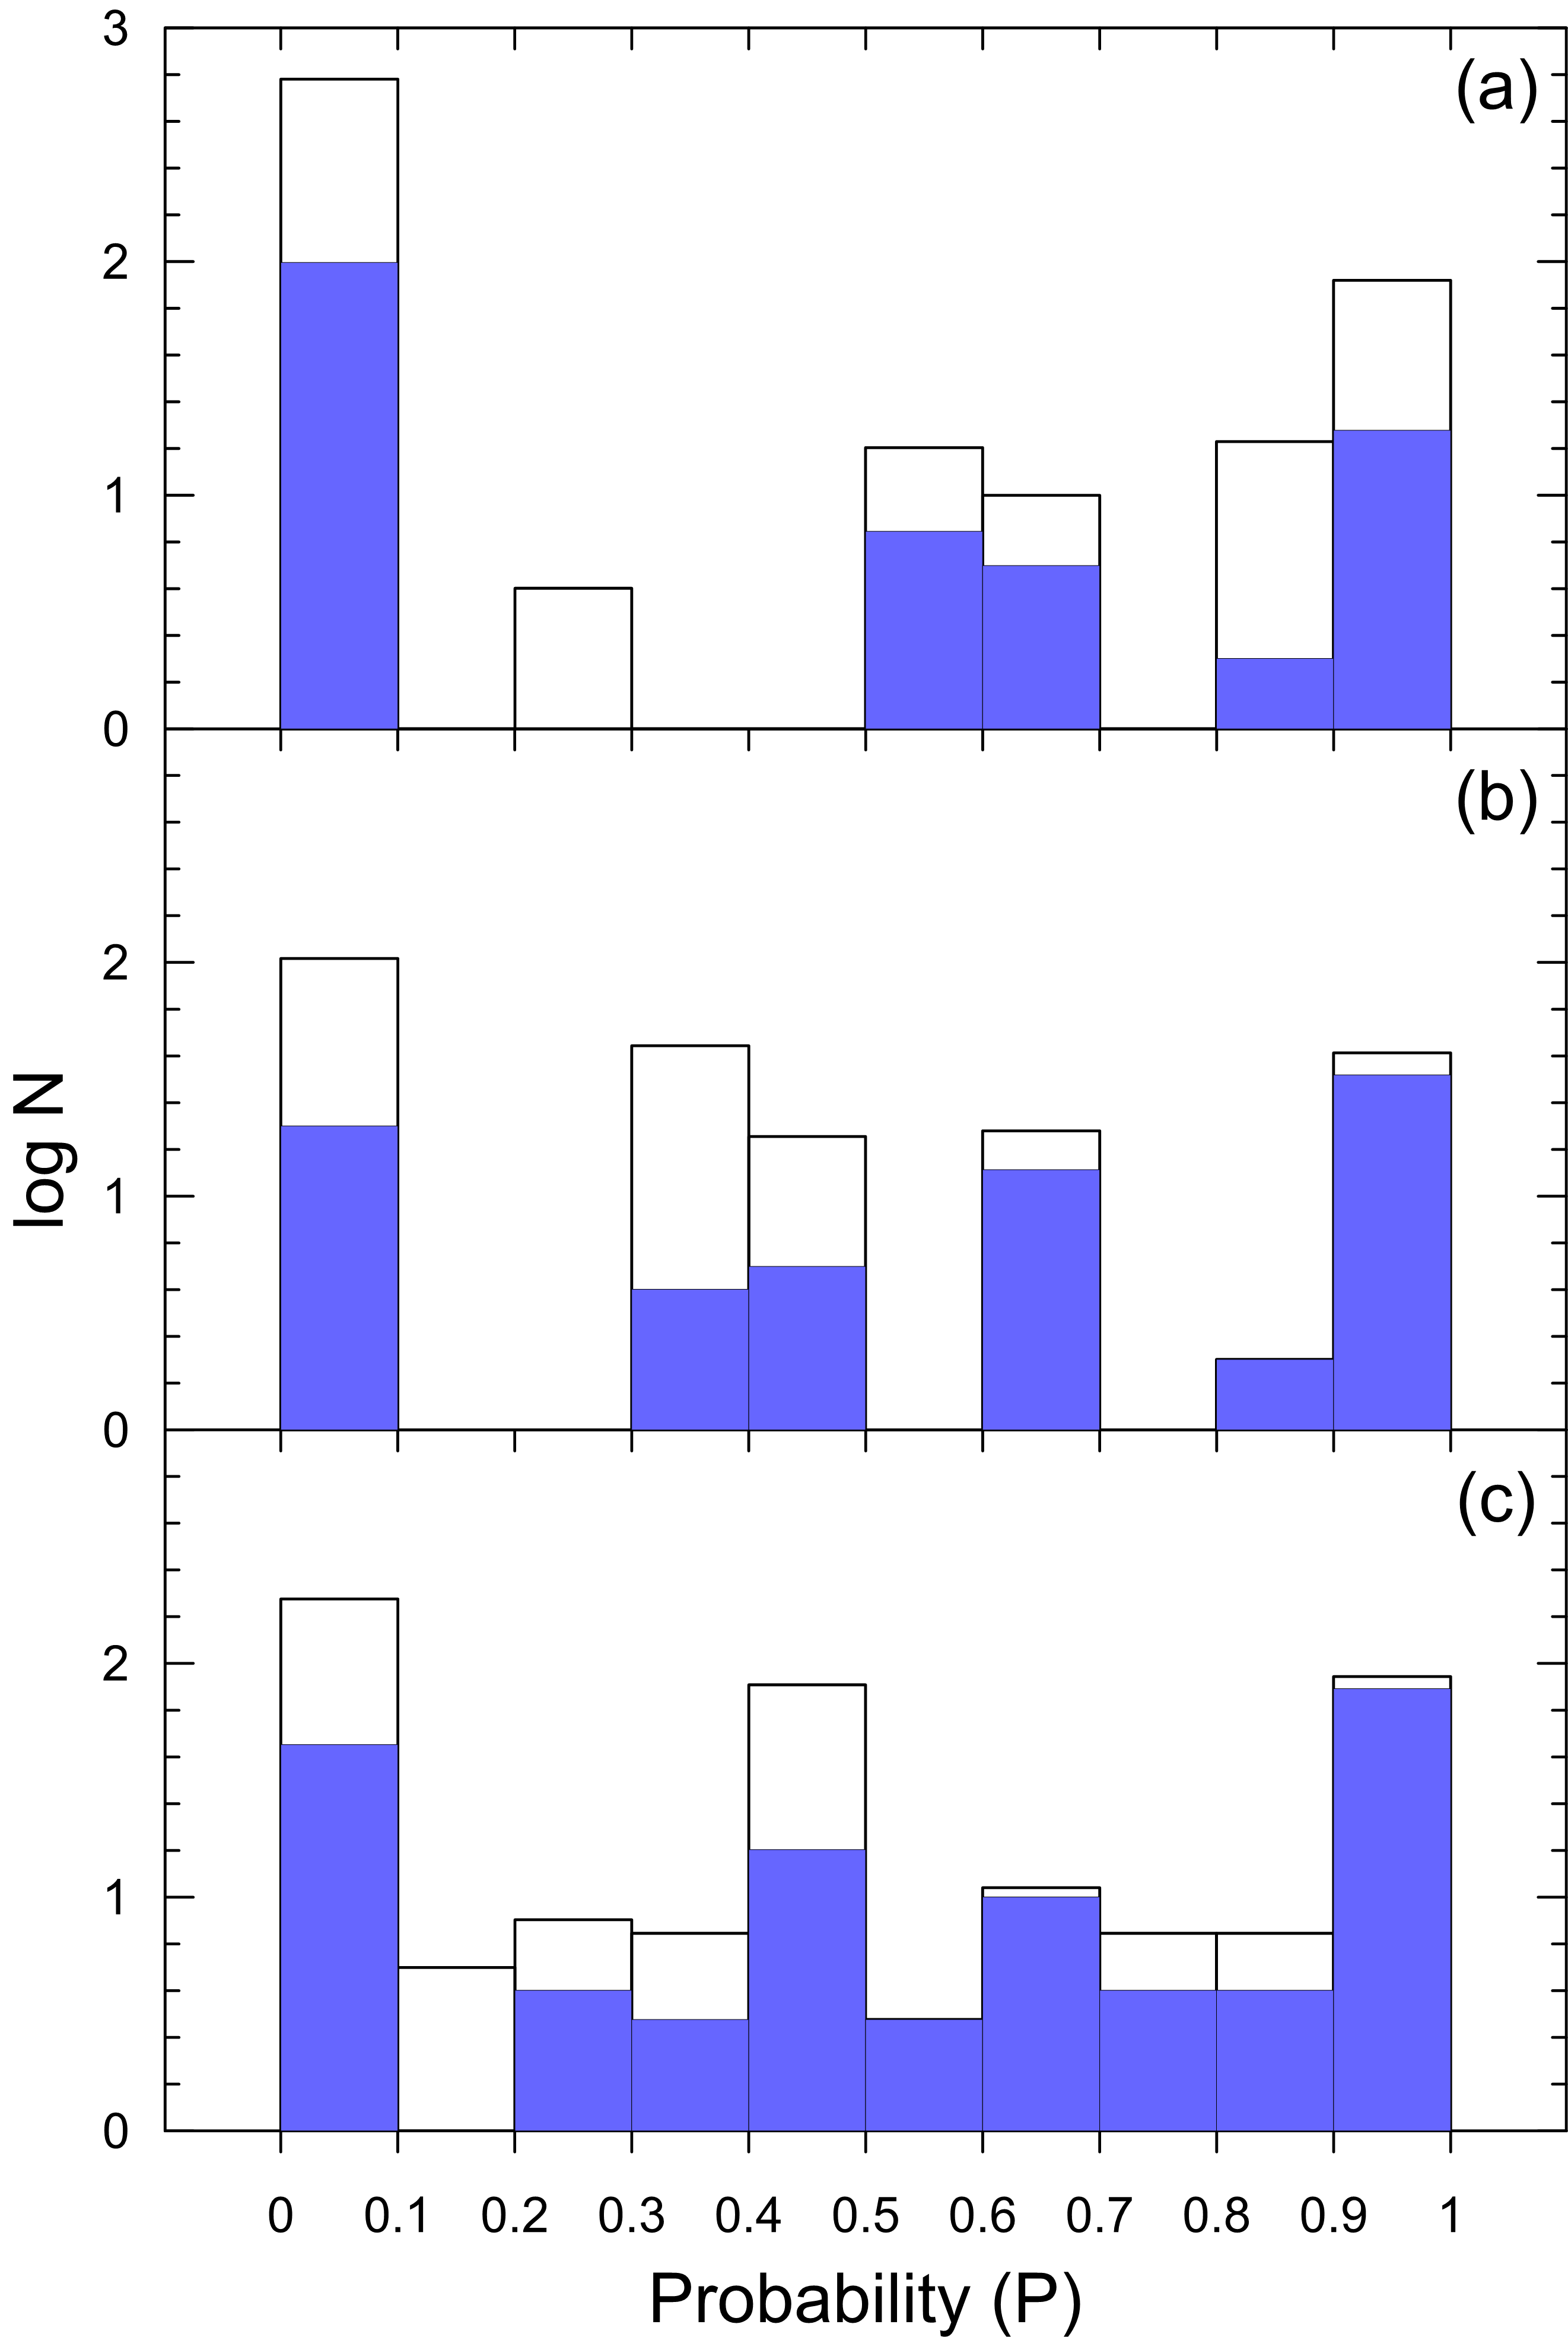
Open clusters are located through the Galactic plane, leading to them usually being affected by field star contamination. To obtain fundamental cluster parameters more precisely, it is important to separate cluster members from foreground/background non-member stars. Stars in an open cluster are formed under the same physical conditions, and they move in the same general vectorial directions in space. These properties make proper-motion components useful tools to separate cluster members (Bisht et al., 2020) from field stars. Thanks to Gaia DR3’s high accuracy astrometric data, membership analyses give reliable results if carefully made. To determine membership probabilities () of stars located in the direction of the three clusters, we performed the Unsupervised Photometric Membership Assignment in Stellar Clusters (upmask; Krone-Martins & Moitinho, 2014) method on Gaia DR3 astrometric data. The method was used in previous studies by various researchers (Cantat-Gaudin et al., 2018, 2020; Castro-Ginard et al., 2018, 2019, 2020; Banks et al., 2020; Akbulut et al., 2021; Wang et al., 2022; Yontan, 2023). upmask is a -means clustering method which considers the proper-motion components as well as the trigonometric parallaxes of the stars. This technique allows the detection of similar groups of stars, together with estimates of membership probabilities for these groups. To determine the most probable members for NGC 189, NGC 1758 and NGC 7762 and to evaluate membership probabilities, we ran 100 iterations of upmask which considered each detected star’s astrometric measurements (, , , , ) and their uncertainties. We determined 79 likely member stars for NGC 189, 61 for NGC 1758 and 118 stars for NGC 7762 as the most probable cluster members with membership probabilities and brighter than the photometric completeness limits described above.
The observed color-magnitude diagrams (CMDs) are useful tools to derive age, distance, and other key parameters for open star clusters. In other respects, CMDs created in different photometric systems are effective tools to explore the main sequence, turn-off, and giant region of star clusters. In this study, we used UBV based CMDs to take into account the possible ‘contamination’ by binary stars in the main sequence of the three clusters. Considering the stars with the probabilities , we constructed CMDs and fitted the Zero Age Main-Sequence (ZAMS) line of Sung et al. (2013) to these diagrams through visual inspection according to most probable main-sequence stars. We shifted the ZAMS by 0.75 mag over the brighter stars to adjust for possible binary star contamination by making sure that we chose clearly the most probable main sequence, turn-off and giant members. Consequently, with constraints on the completeness-estimated magnitude limits and fitted ZAMS, we obtained 32 member stars for NGC 189, 57 for NGC 1758 and 106 for NGC 7762 with membership probabilities . The diagrams with fitted ZAMS and distribution of both field and cluster stars are shown in Figs. 4a (for NGC 189), 4c (for NGC 1758) and 4e (for NGC 7762). The stellar distributions using the Gaia based photometry are shown in Figs. 4b (for NGC 189), 4d (for NGC 1758) and 4f (for NGC 7762).
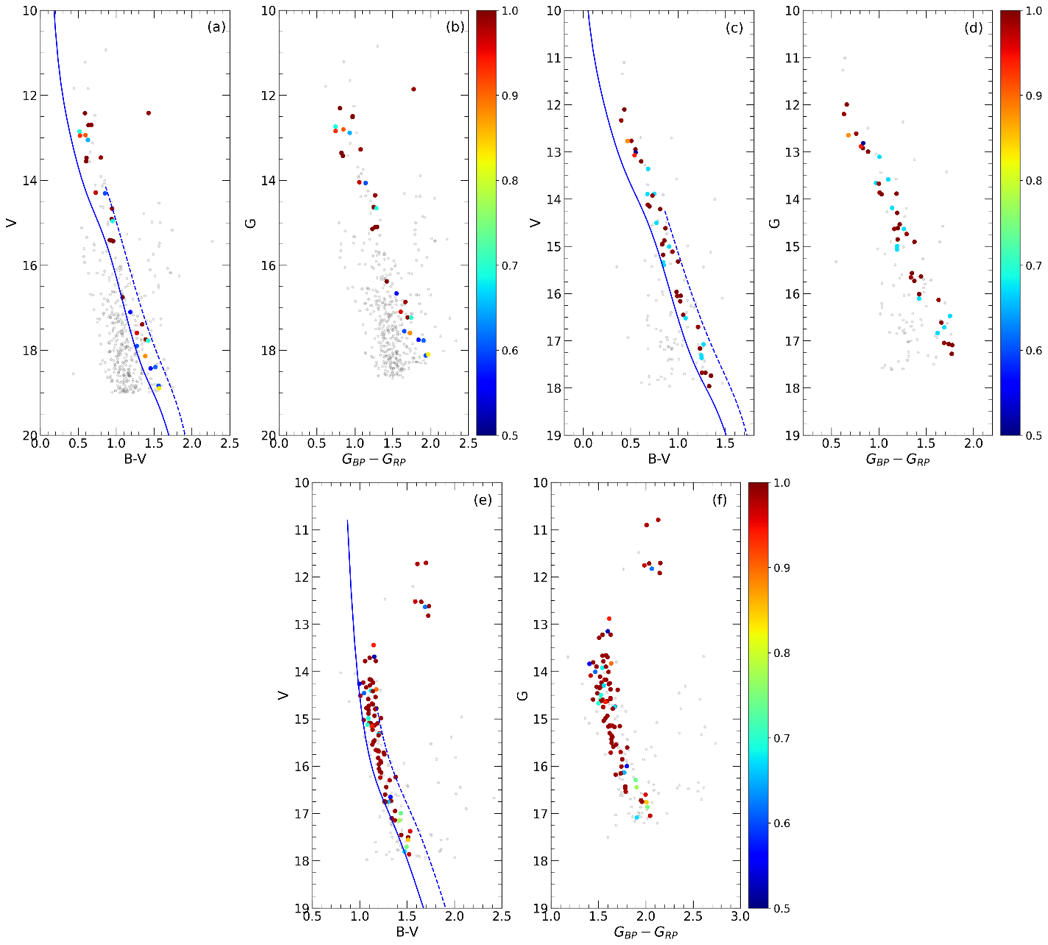
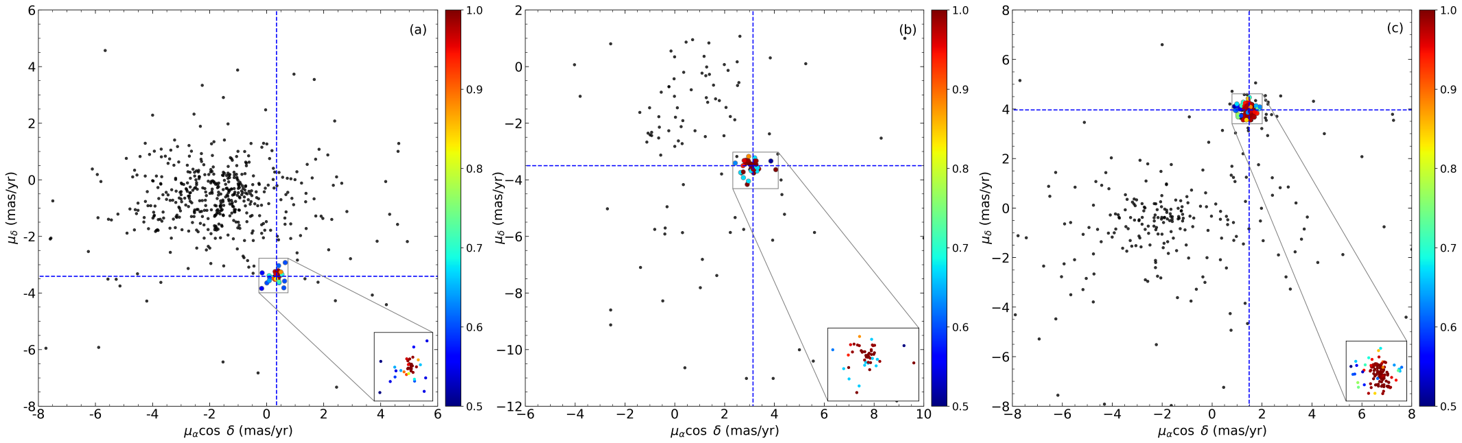
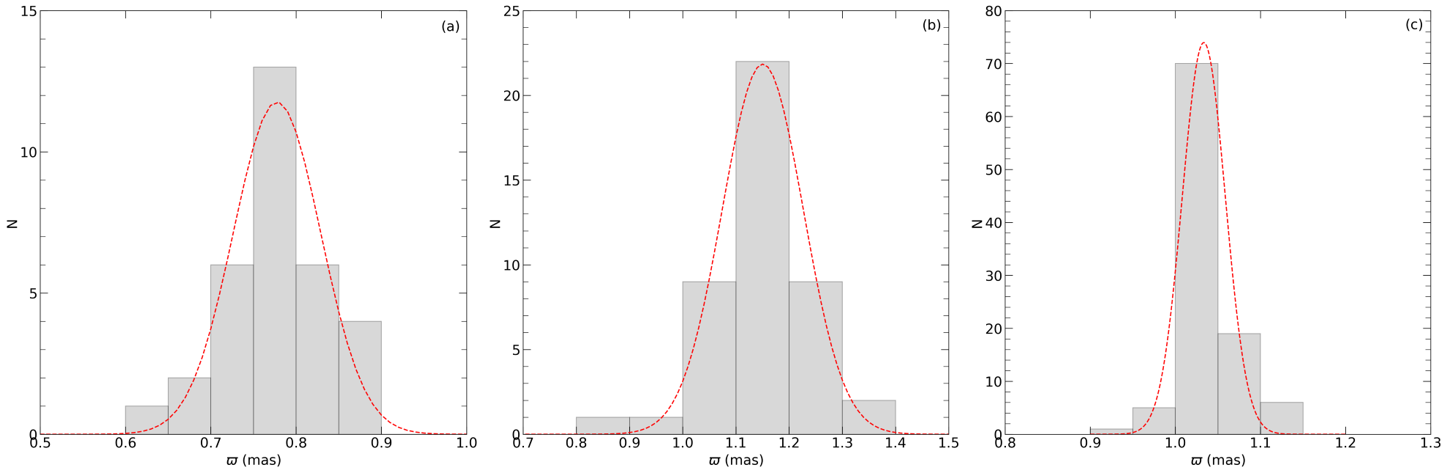
Figure 5 plots the membership probabilities of detected stars as a function of stellar numbers. To determine the locations of the most probable cluster members and the field stars in proper-motion space, we drew vector point diagrams (VPDs) for the three clusters (see Fig. 6). It can be seen from the figure that all three clusters are clearly separated from their field stars. In Fig. 6, the intersection of the blue dashed lines indicates the mean proper-motion values estimated from the stars with membership probabilities . The mean proper-motion components are listed in Table 5. These results are in good agreement with the values of previous studies based on Gaia observations for the three clusters (see Table 1). To estimate the astrometric distance of each cluster, we used trigonometric parallaxes considering the cluster members (i.e., stars with ). We constructed the trigonometric parallax histograms using these members and calculated the mean values for each cluster by fitting Gaussian functions to the distributions as shown in Fig. 7. As a result, the mean trigonometric parallax values were obtained as mas for NGC 189, mas for NGC 1758 and mas for NGC 7762. By applying the linear equation of (mas) to the mean trigonometric parallaxes, we derived the astrometric distances as pc for NGC 189, pc for NGC 1758 and pc for NGC 7762. We obtained similar mean parallax values for NGC 189 and NGC 7762 compared to Cantat-Gaudin et al. (2020) and Cantat-Gaudin & Anders (2020). NGC 1758 was not examined by those studies.
| Cluster | ||||
|---|---|---|---|---|
| (mas yr-1) | (mas yr-1) | (mas) | (pc) | |
| NGC 189 | +0.3520.032 | -3.4120.038 | 0.7780.051 | 128584 |
| NGC 1758 | +3.1410.035 | -3.5070.025 | 1.1500.076 | 87057 |
| NGC 7762 | +1.4890.023 | +3.9620.024 | 1.0330.025 | 96823 |
3 Astrophysical Parameters
In this section, we sum up the methods followed to determine the fundamental parameters of the open clusters NGC 189, NGC 1758, and NGC 7762. We followed the processes outlined in Yontan (2023). Dense stellar regions, different membership selection criteria, high/differential extinction towards the cluster regions, and different analyses procedures can influence the determination of the fundamental astrophysical parameters of clusters and result in degeneracies between reddening and age parameters (Anders et al., 2004; King et al., 2005). Such a situation is the cause of large discrepancies across the estimated parameters performed by various researchers for the same clusters. To avoid possible degeneracy issues and achieve accurate calculations, the color excesses and metallicities of the clusters were derived using two-color diagrams (TCDs) separately, while we obtained distance moduli and ages individually by fitting theoretical models on CMDs.
3.1 Color Excess
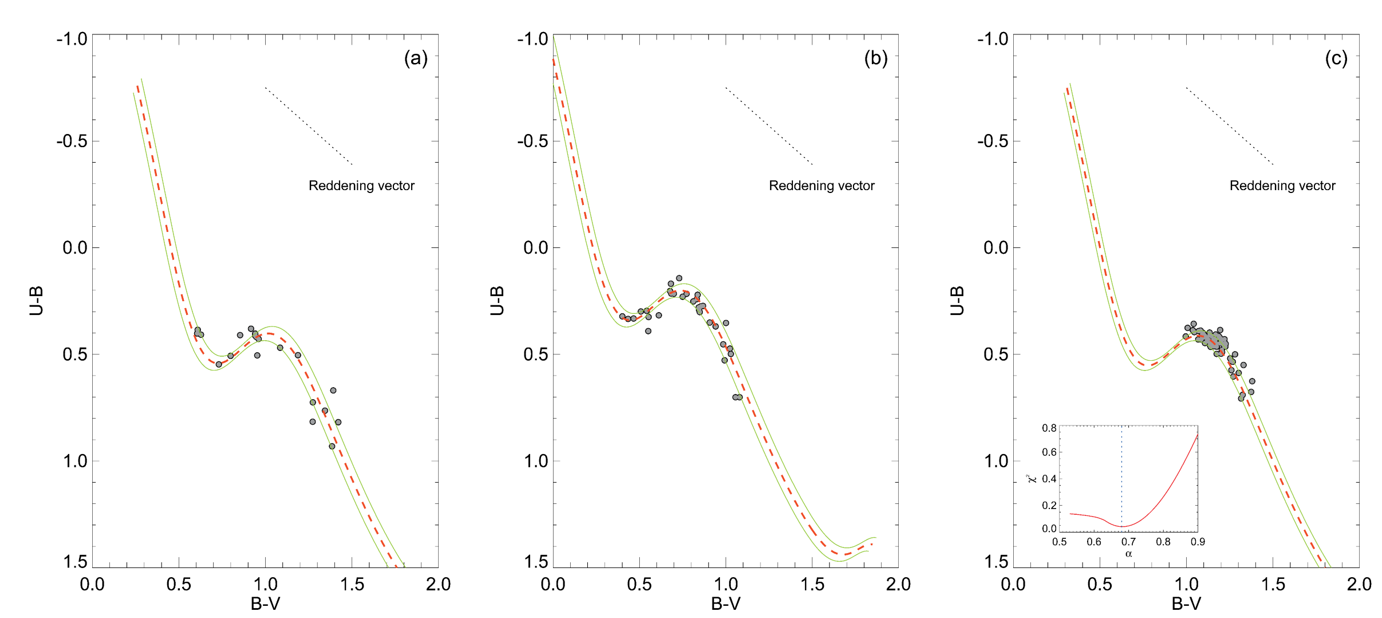
Estimation of reddening was performed using TCDs of the clusters. We selected the main-sequence member stars with probability and within the magnitude ranges for NGC 189, mag for NGC 1758 and mag for NGC 7762 in order to derive the and color excess values. We plotted TCDs using these member stars and fitted the ZAMS of Sung et al. (2013) to these distributions. The ZAMS was fitted by considering varied values of the reddening slope , applying a minimization method. The best result of minimum equates to the reddening slope being as well as the color excess being mag for NGC 189 and mag for NGC 1758. In the case of NGC 7762 the best reddening slope and color excess values are and mag, respectively. TCDs with the best solutions are presented in Fig. 8. Color excess errors are deviations. Our estimated color excess for NGC 189 is close to the values found by Kharchenko et al. (2013), Joshi et al. (2016) and Dias et al. (2021). For NGC 1758, the estimated is compatible with the studies of Kharchenko et al. (2005) and Sampedro et al. (2017). For NGC 7762 the current estimate is in good agreement with results given by Kharchenko et al. (2013), Maciejewski & Niedzielski (2007) and Cantat-Gaudin et al. (2020). See Table 1 for a detailed comparison.
3.2 Photometric Metallicities
As with reddening, it is important to know the metallicity before attempting to derive the age and distance of a cluster. Given a lack of spectroscopic observations, TCDs can be used to estimate photometric metallicity (Karaali et al., 2003a, b, 2011). In the present study, we used the method of Karaali et al. (2011) to determine the photometric metallicity of each cluster. In this method, F and G-type main-sequence stars falling into the mag color range (Eker et al., 2018, 2020) and their UV-excesses are used. Having calculated de-reddened and color indices of the most probable member stars () and considering the , color excesses derived in the study (see Section 3.1), we made a selection of F-G type main-sequence stars by limiting their color range within mag. This resulted in the selection of five stars for NGC 189, four stars for NGC 1758 and 37 stars for NGC 7762. Next, the construction of diagrams (Figure 9 upper panels) was made for these selected stars and compared against that of the Hyades main sequence. This allowed the determination of the differences between the color indices of the observed cluster members and the Hyades stars which have the same colors. The calculated differences are defined as the UV-excess () via the equation , where H and S are Hyades and cluster stars, respectively. The calculated UV-excesses were calibrated to the normalised values according to mag. We plotted histograms of the normalised values and applied Gaussian fits to these distributions to estimate the mean values (Figure 9 lower panels). Considering the peaks of the fitted Gaussian functions, the photometric metallicities of the three open clusters were estimated using the following equation from Karaali et al. (2011):
| (3) |
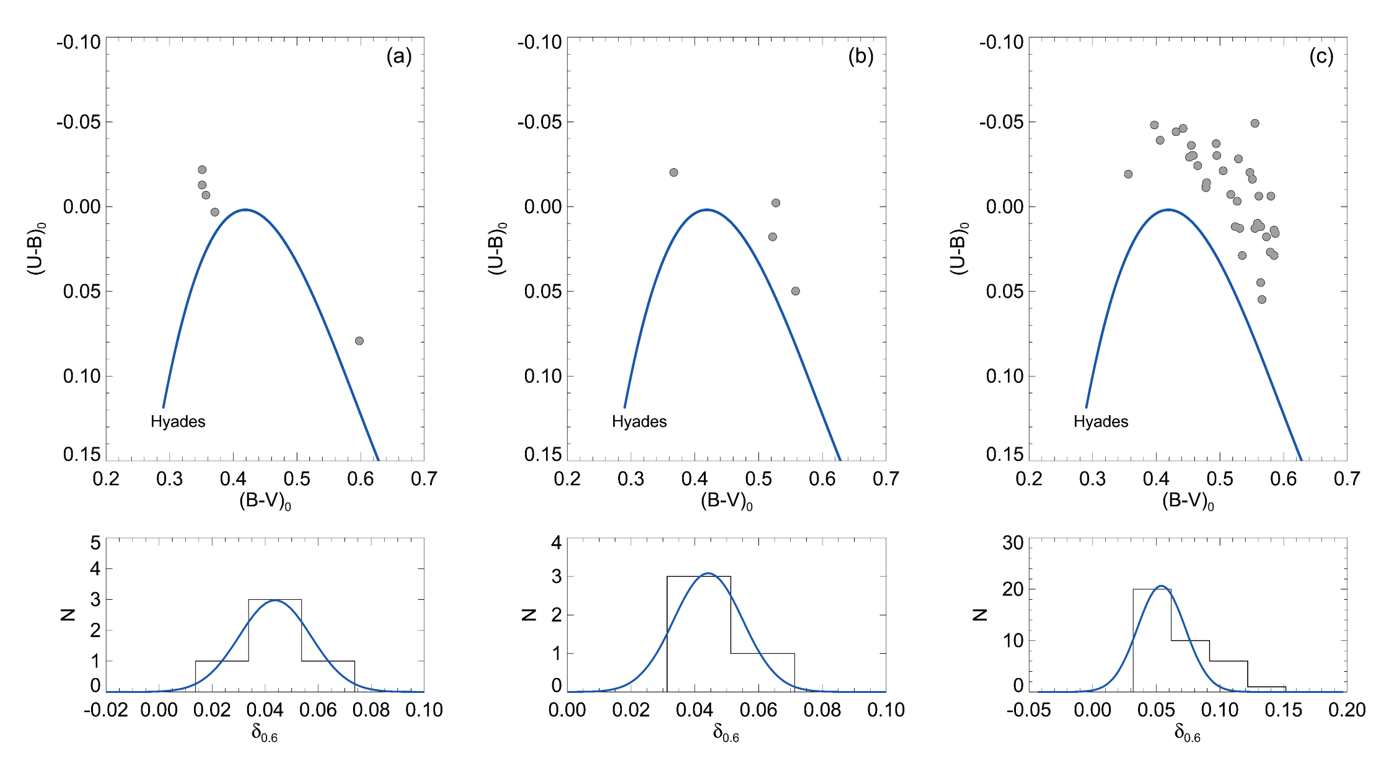
Fig. 9 presents the TCDs and the distributions of the normalised UV excesses for three clusters. The calculated mean values of NGC 189, NGC 1758, and NGC 7762 are mag, mag, and mag respectively. Thus, the estimated photometric metallicities are [Fe/H]= dex for NGC 189, [Fe/H]= dex for NGC 1758 and [Fe/H]= dex for NGC 7762. Moreover, estimated photometric metallicities ([Fe/H]) were converted to the mass fraction for choosing isochrones used in age determination. To do this, we took into account the expressions presented from Bovy444https://github.com/jobovy/isodist/blob/master/isodist/Isochrone.py which are improved for parsec isochrones (Bressan et al., 2012). The related expressions are given as follows:
| (4) |
and
| (5) |
Where and are intermediate values where solar metallicity was adopted as 0.0152 (Bressan et al., 2012). We obtained for NGC 189 and NGC 1758 as well as for NGC 7762.
3.3 Distance and Age
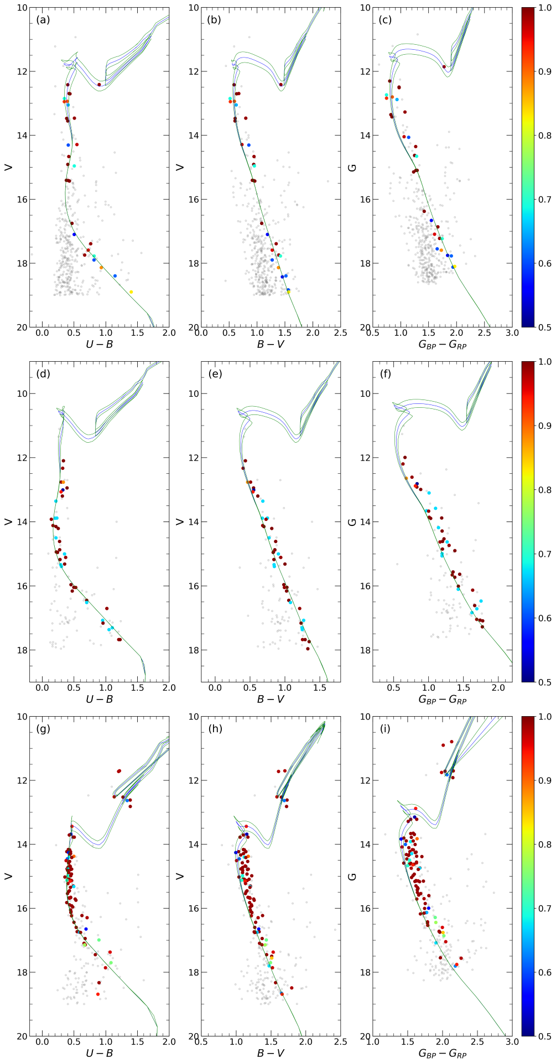
In the present study, the age and distance moduli of the studied clusters were estimated simultaneously by fitting parsec isochrones (Bressan et al., 2012) to the observed CMDs. We plotted , and CMDs and fitted selected isochrones via visual inspection, taking into account the main-sequence, turn-off, and giant stars with membership probabilities . For each cluster, selection of parsec isochrones555http://stev.oapd.inaf.it/cgi-bin/cmd was made according to the mass fraction calculated from photometric metallicities earlier in this study (Section 3.2). For the data-driven isochrone fitting process, the isochrones were reddened in regard to the color excesses and as determined in this study, while the Gaia DR3 reddened procedure employed the equation as given by Sun et al. (2021). Errors for distance moduli and distances were obtained from the expression presented by Carraro et al. (2017). Uncertainties in age were estimated by considering the scatter of the observed data representing the main sequence, turn off and giant member stars. We, therefore, selected low and high-age isochrones whose values were close to the cluster’s estimated age, taking into account this scatter. , and CMDs with the best fitting isochrones are given as Fig. 10. Estimated distance moduli and ages for each cluster are as follows:
-
1.
NGC 189: We over-plotted the different isochrones of = 8.65, 8.70 and 8.74 with on all the CMDs for the cluster NGC 189, as shown in Fig. 10 (panels a, b and c). The age of NGC 189 is estimated from the well-fitting isochrone log-years to the most probable main-sequence and giant stars, and corresponds to the age Myr. The derived age is in good agreement with the results of Kharchenko et al. (2013), Joshi et al. (2016) and Loktin & Popova (2017). We derived the distance modulus of the NGC 189 as mag, which leads to the isochrones-based distance for the cluster being pc. This distance value is close to most of the values given by many authors (etc. Cantat-Gaudin et al., 2018, 2020, see Table 1 for detailed comparison). The isochrone distance estimated for the cluster is compatible with the astrometric distance value ( pc) calculated from Gaia DR3 trigonometric parallaxes of member stars. We estimated the Galactocentric distance as kpc by considering the Sun’s distance to the Galactic centre as 8 kpc (Majewski, 1993). The Galactocentric coordinates were derived as pc, respectively. These are compatible with the values of Cantat-Gaudin et al. (2018).
-
2.
NGC 1758: We over-plotted the isochrones and 8.84 with to the observed CMDs as presented in Fig. 10 (panels d, e and f). The best-fit isochrone corresponded to the age of the NGC 1758 being or a value of Myr. This age estimate is about 100 Myr older than the estimated ages presented by Bossini et al. (2019) and Dias et al. (2021). We estimated the distance modulus of the NGC 1758 as mag. This corresponds to the isochrone-based distance for the cluster being pc. This result is close to the values given by Liu & Pang (2019) and Bossini et al. (2019). It is also compatible with the results given by Cantat-Gaudin et al. (2018), Cantat-Gaudin & Anders (2020), and Dias et al. (2021) (see Table 1 for a detailed comparison). The isochrone distance estimated for the NGC 1758 is compatible with the astrometric distance value of pc. The Galactocentric distance and Galactocentric coordinates were obtained as kpc and pc. These are in good agreement with the values of Cantat-Gaudin et al. (2018).
-
3.
NGC 7762: Isochrones of ages and 9.35 were over-plotted with to the and Gaia data-based CMDs, as shown in Fig. 10 (panels g, h and i). Considering the most probable main sequence, turn-off and giant cluster members, we concluded that the best fitting isochrone gives the age of the NGC 7762 as , which corresponds to Myr. The estimated age of the cluster is in good agreement with the values of Maciejewski & Niedzielski (2007), Joshi et al. (2016) and Cantat-Gaudin et al. (2020). We obtained the distance modulus of the NGC 7762 as mag, which gives the isochrone-based distance of the cluster as pc. This value is compatible with the values given in many studies which are based on Gaia data (Soubiran et al., 2018; Cantat-Gaudin et al., 2020; Cantat-Gaudin & Anders, 2020, see Table 1 for a detailed comparison). The isochrone distance is close to the distance value ( pc) calculated from Gaia DR3 trigonometric parallaxes in this study. The Galactocentric distance and Galactocentric coordinates were obtained as kpc and pc. These are compatible with the corresponding estimates of Cantat-Gaudin et al. (2018).
4 Kinematics and Galactic orbit parameters
We estimated the space velocity components and Galactic orbit parameters of NGC 189, NGC 1758 and NGC 7762 using the Python package galpy Bovy (2015)666See also https://galpy.readthedocs.io/en/v1.5.0/. To perform integrations of the Galactic orbits for these clusters, we adopted the default galpy potential of the Milky Way that assumes an axisymmetric potential for the Galaxy (MWPotential2014, Bovy 2015). The MilkywayPotential2014 code is described by a three-component model consisting of the bulge, disc, and halo potentials. The bulge is described as a spherical power-law density profile according to the expression of Bovy (2015):
| (6) |
where and are the present reference radius and cut-off radius, respectively. and denote the amplitude that is applied to the potential in mass density units and inner power, respectively. The Galactic disc component that we used is expressed by Miyamoto & Nagai (1975) as:
| (7) |
where and are the distances from the Galactic centre and Galactic plane, respectively. is the universal gravitational constant, and the mass of the Galactic disc, the scale length of the disc and the height of the disc. The halo component is assumed as a spherically symmetric spatial distribution of the dark matter density. The expression of Navarro et al. (1996) was adopted to model the halo as:
| (8) |
where denotes the mass of the dark matter halo of the Milky Way and represents its radius. The galactocentric distance and the circular velocity of the Sun were taken as kpc and km s-1, respectively (Bovy & Tremaine, 2012; Bovy, 2015). The Sun’s distance from the Galactic plane was taken as 274 pc (Chen et al., 2001).
The input parameters for the orbital integration of the three clusters are listed in Table 6, namely the equatorial coordinates () estimated in the study (Section 2.3), proper motion components () estimated in Section 2.4, distance () from the Section 3.3, and radial velocity (). The radial velocities of the clusters were derived using the data available in the Gaia DR3 catalogue. To calculate the mean radial velocities (and their uncertainties) of the clusters, we selected the stars with membership probabilities and used the weighted average of their radial velocities taken from Gaia DR3 data (for equations see Soubiran et al., 2018). The mean radial velocities were calculated as km s-1 for NGC 189 from five member stars, as km s-1 for NGC 1758 from eight members, and km s-1 for NGC 7762 from 31 members. The literature mean radial velocity estimates for NGC 189 are (Soubiran et al., 2018) and km s-1 (Dias et al., 2021), while for NGC 1758 the literature value is km s-1 (Dias et al., 2021). The values for NGC 7762 are km s-1 (Casamiquela et al., 2016), km s-1 (Soubiran et al., 2018) and km s-1 (Dias et al., 2021) (Table 1). The mean radial velocities derived in this study for NGC 189 and NGC 7762 are within 1-2 km s-1 of the values given by these different researchers. In the case of NGC 1758, there is a difference between the estimated and literature mean radial velocity value. We used radial velocities of eight stars with membership probabilities for NGC 1758, whereas in the study of Dias et al. (2021) the mean radial velocity of the cluster was estimated from two members. We concluded that the reason for the discrepancies between these two studies is the number and membership probabilities of the stars used in calculations.
Kinematic and dynamic calculations were analyzed with 1 Myr steps over a 3 Gyr integration time. Estimates for the apogalactic distance , perigalactic distance , eccentricity , the maximum vertical distance from Galactic plane , Galactic space velocity components (, , ), and orbital period were derived and listed in Table 6. The space velocity components were estimated as km s-1 for NGC 189, km s-1 for NGC 1758 and km s-1 for NGC 7762. To apply the local standard of rest (LSR), we employed the velocity components of Coşkunoǧlu et al. (2011) as () = , , km s-1. Hence, we derived transformed parameters as km s-1 for NGC 189, km s-1 for NGC 1758 and km s-1 for NGC 7762. Moreover, the total space velocities () of NGC 189 were calculated to be km s-1, km s-1 for NGC 1758 and km s-1 for NGC 1798 (for all estimated parameters see Table 6). To obtain the birth radii of three clusters, we utilized the orbital integration in the past epochs, using time bins equal to estimated cluster ages.
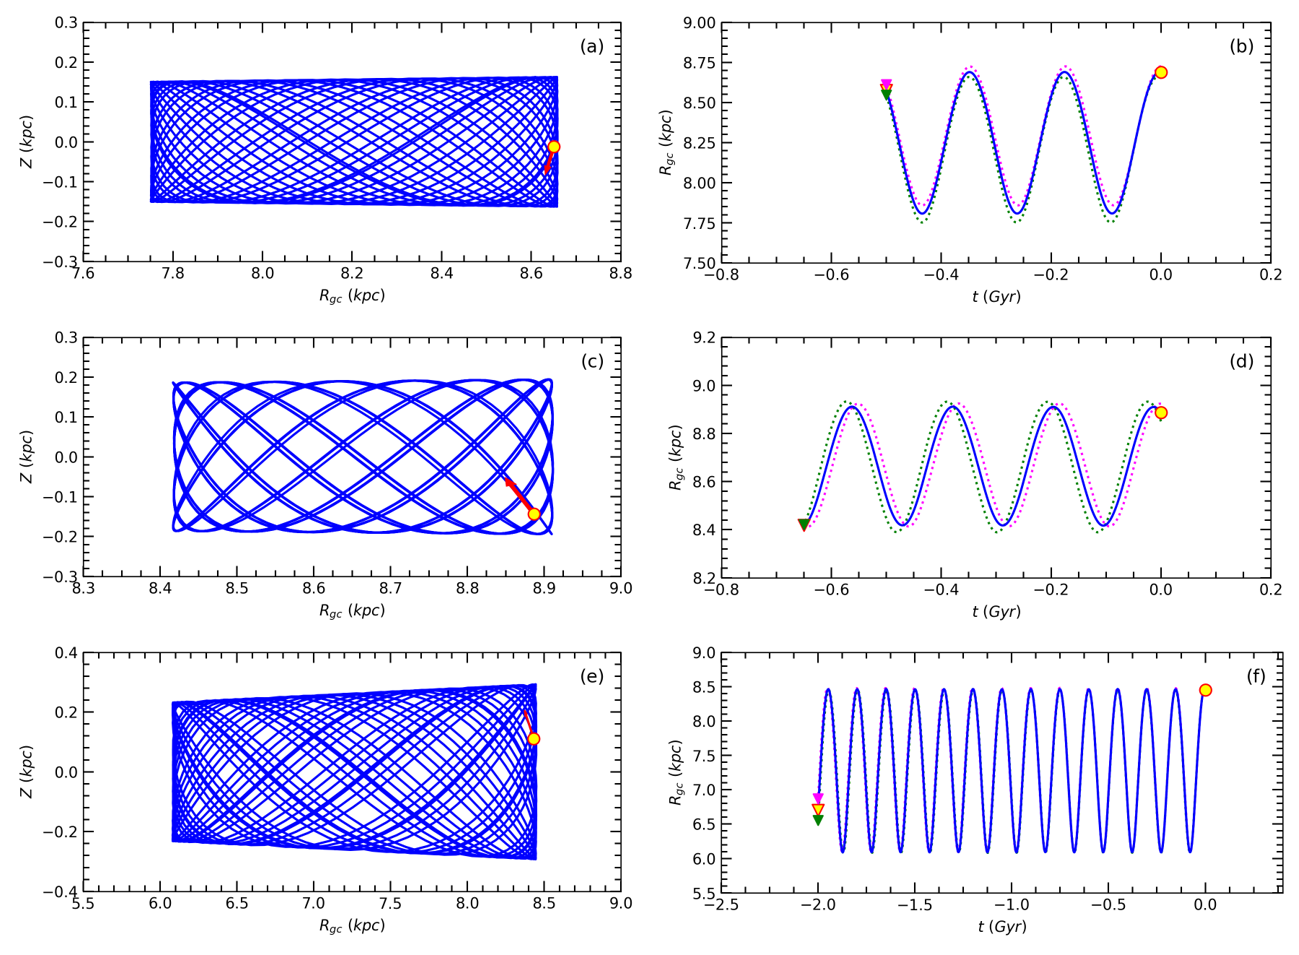
The Galactic orbits of the three clusters are represented in Fig. 11. The left panels of this figure show the ‘side views’ of the cluster motions (panel a for NGC 189; panel c for NGC 1758 and panel e for NGC 7762) in respect of distance from the Galactic center and the Galactic plane. According to the analyses, both NGC 189 and NGC 1758 follow a ‘boxy’ pattern with almost zero eccentricities, whereas the orbit of the NGC 7762 differs from a ‘boxy’ pattern given its larger eccentricity. We investigated the orbital parameters to understand how uncertainties in the input parameters (, , and ) influence the orbit integration results and estimated birth-radii of the clusters. In the right panel of the Fig. 11 the motion in the Galactic disc and the effect of uncertainties in the input parameters are presented in terms of time for the three clusters (panel b for NGC 189; panel d for NGC 1758, and panel f for NGC 7762). It can be seen from the figure that the range in possible birth radii, between the extreme estimates, do not exceed 0.4 kpc for any of the three clusters.
These estimates for the birth-radii indicate that both NGC 189 and NGC 1758 were formed outside the solar vicinity at 8.58 and 8.42 kpc, while NGC 7762 was formed inside the solar vicinity with a birth radius of 6.70 kpc. According to the perigalactic and apogalactic distances of the three clusters, it can be concluded that the orbit of NGC 1758 is completely outside the solar circle (Fig. 11e), while NGC 189 and NGC 7762 cross the solar circle during their orbits (Fig. 11a and c, respectively). All three clusters rise above the plane up to pc. This indicates that NGC 189, NGC 1758 and NGC 7762 belong to the thin-disc component of the Milky Way (Bilir et al., 2006b, c, 2008).
5 Summary & Conclusions
We presented photometric, astrometric, and kinematic studies of the open clusters NGC 189, NGC 1758 and NGC 7762 using CCD and Gaia DR3 data. We identified 32, 57 and 106 member stars (with estimated membership probabilities ) in the regions of NGC 189, NGC 1758, and NGC 7762, respectively. These members were employed in the estimation of the main astrophysical parameters of the clusters. We used data-based TCDs, deriving color excesses and photometric metallicities separately to achieve reliable age and distance values. We also investigated the kinematical properties of the clusters. The results of these analyses are listed in Table 6. In literature studies, parameters were derived simultaneously through statistical solutions for the three clusters. This can cause degeneracies between the parameters (reddening, age and distance) and large uncertainties in the measured values. We therefore believe that the approach described in this paper leads to more reliable estimates.
The main findings of the current study are summarized as follows:
| Parameter | NGC 189 | NGC 1758 | NGC 7762 |
|---|---|---|---|
| ( (Sexagesimal) | 00:39:27.89, 61:06:46.35 | 05:04:42.00, :48:46.90 | 23:49:53.00, :02:06.00 |
| ( (Decimal) | 121.4858, | 179.1584, | 117.2060, |
| (stars arcmin-2) | |||
| (stars arcmin-2) | |||
| (arcmin) | |||
| (arcmin) | 4 | 7 | 15 |
| (pc) | 1.40 | 1.98 | 3.97 |
| Cluster members () | 32 | 57 | 106 |
| (mas yr-1) | |||
| (mas yr-1) | |||
| (mas) | |||
| (pc) | |||
| (mag) | |||
| (mag) | |||
| (mag) | |||
| (mag) | |||
| (mag) | |||
| (dex) | |||
| Age (Myr) | |||
| Distance modulus (mag) | |||
| Isochrone distance (pc) | |||
| (pc) | (, 1024, -36) | (, 13, -164) | (, 806, 93) |
| (kpc) | 8.69 | 8.89 | 8.45 |
| (km/s) | |||
| (km/s) | |||
| (km/s) | |||
| (km/s) | |||
| (km/s) | |||
| (pc) | |||
| (pc) | |||
| (pc) | |||
| (Myr) | |||
| Birthplace (kpc) | 8.58 | 8.42 | 6.70 |
-
1.
We investigated the structural properties of the clusters. We used the central coordinates determined in the study during RDP analyses. The centers of three clusters are:
-
1..1
() for NGC 189,
-
1..2
() for NGC 1758, and
-
1..3
() for NGC 7762.
The limiting radii were obtained as for NGC 189, for NGC 1758, and for NGC 7762. Astrometric analyzes showed that NGC 1746 does not exist, but has been misidentified in the past and instead is NGC 1758.
-
1..1
-
2.
We separated cluster members from the field stars by considering data-based CMDs as well as the Gaia DR3 proper motion and trigonometric parallax data. We utilized the upmask method to calculate the membership probabilities of stars. Based on the distribution of the most probable member stars () on CMDs, we fitted ZAMS curves that included the effect of possible binary star contamination on the cluster main sequence. From the location of these selected stars on VPDs, we derived mean proper motion components as:
-
2..1
() mas yr-1 for NGC 189,
-
2..2
() mas yr-1 for NGC 1758 and
-
2..3
() mas yr-1 for NGC 7762.
Utilizing the Gaussian fits on histograms constructed from most probable member stars’ Gaia DR3 trigonometric parallaxes (), we determined mean trigonometric parallaxes as mas for NGC 189, mas for NGC 1758 and mas for NGC 7762. Using the equation (mas), we converted the mean trigonometric values into astrometric distances ():
-
2..1
pc for NGC 189,
-
2..2
pc for NGC 1758 and
-
2..3
pc for NGC 7762.
-
2..1
-
3.
Comparison of the diagrams of most probable member stars with the ZAMS (Sung et al., 2013) via minimization led to estimates of the reddening slope and color excesses for the clusters. The best fitting solutions corresponded to and mag for NGC 189, 0.72 and mag for NGC 1758 and 0.68 and mag for NGC 7762.
-
4.
Estimation of photometric metallicity is based on the calculation of UV-excesses of selected F-G main-sequence stars with membership probabilities , compared to the Hyades main-sequence on diagrams. The values of photometric metallicities ([Fe/H]) were calculated as dex for NGC 189, dex for NGC 1758 and dex for NGC 7762. We transformed the [Fe/H] values to mass fractions to derive the ages and distances of the clusters (in the following step below). These are for NGC 189 and NGC 1758, while for NGC 7762.
-
5.
Keeping the color excess and metallicity parameters as constants, we derived distance moduli and ages by fitting parsec isochrones to the CMDs of the clusters constructed from and Gaia DR3 data. The distance moduli (), isochrone distances (), and ages () were found to be:
-
5..1
mag, pc, Myr for NGC 189, respectively;
-
5..2
mag, pc, and Myr for NGC 1758 and
-
5..3
mag, pc, and Myr for NGC 7762.
-
5..1
-
6.
We calculated the mean radial velocities of the clusters using only the stars with membership probabilities and taking into account the radial velocities available in Gaia DR3 database. This allowed us to estimate the kinematic properties of the clusters. The values of the mean radial velocities () were estimated to be km s-1 for NGC 189, km s-1 for NGC 1758 and km s-1 for NGC 7762.
-
7.
Galactic orbits and their relevant output parameters were derived using the MWPotential2014 of Bovy (2015). We concluded that NGC 189 and NGC 7762 are following ‘boxy’ orbits. Estimates for the birth-radii indicate that both NGC 189 and NGC 1758 were formed outside the solar vicinity at 8.58 and 8.42 kpc, respectively while NGC 7762 was formed inside the solar vicinity with a birth radius of 6.70 kpc.
Acknowledgments
This study has been supported in part by the Scientific and Technological Research Council (TÜBİTAK) 122F109. The observations of this publication were made at the National Astronomical Observatory, San Pedro Mártir, Baja California, México, and the authors wish to thank the staff of the Observatory for their assistance during these observations. This research has made use of the WEBDA database, operated at the Department of Theoretical Physics and Astrophysics of the Masaryk University. We also made use of NASA’s Astrophysics Data System as well as the VizieR and Simbad databases at CDS, Strasbourg, France and data from the European Space Agency (ESA) mission Gaia777https://www.cosmos.esa.int/gaia, processed by the Gaia Data Processing and Analysis Consortium (DPAC)888https://www.cosmos.esa.int/web/gaia/dpac/consortium. Funding for DPAC has been provided by national institutions, in particular the institutions participating in the Gaia Multilateral Agreement. IRAF was distributed by the National Optical Astronomy Observatory, which was operated by the Association of Universities for Research in Astronomy (AURA) under a cooperative agreement with the National Science Foundation. PyRAF is a product of the Space Telescope Science Institute, which is operated by AURA for NASA. We thank the University of Queensland for the collaboration software. We are grateful to the anonymous referees for their feedback, which improved the paper.
References
- Adamo et al. (2020) Adamo, A., Zeidler, P., Kruijssen, J. M. D. et al. (2020). Star clusters near and far. Space Science Reviews, 216(4), 69.
- Ak et al. (2016) Ak, T., Bostancı, Z. F., Yontan, T. et al. (2016). CCD UBV photometry of the open cluster NGC 6819. Astrophysics and Space Science, 361(4), 126. doi:10.1007/s10509-016-2707-2.
- Akbulut et al. (2021) Akbulut, B., Ak, S., Yontan, T. et al. (2021). A study of the Czernik 2 and NGC 7654 open clusters using CCD UBV photometric and Gaia EDR3 data. Astrophysics and Space Science, 366(7), 68. doi:10.1007/s10509-021-03975-x.
- Alter (1944) Alter, G. (1944). A Photographic Survey of Galactic Clusters: V. NGC 189, I 1590, 358, 366, 381, 433, 436, 457, 609, 637, I 166, 743. Monthly Notices of the Royal Astronomical Society, 104(3), 179–190. doi:10.1093/mnras/104.3.179.
- Anders et al. (2004) Anders, P., Bissantz, N., Fritze-v. Alvensleben, U. et al. (2004). Analysing observed star cluster SEDs with evolutionary synthesis models: systematic uncertainties. Monthly Notices of the Royal Astronomical Society, 347(1), 196–212. doi:10.1111/j.1365-2966.2004.07197.x.
- Balazs (1961) Balazs, B. A. (1961). Dreifarben-Photometrie von NGC 189 und Stock 24. Astronomische Abhandlungen der Hamburger Sternwarte, 5(10), 317–339.
- Banks et al. (2020) Banks, T., Yontan, T., Bilir, S. et al. (2020). Vilnius photometry and Gaia astrometry of Melotte 105. Journal of Astrophysics and Astronomy, 41(1), 6. doi:10.1007/s12036-020-9621-2.
- Becker & Fenkart (1971) Becker, W., & Fenkart, R. (1971). A catalogue of galactic star clusters observed in three colours. Astronomy and Astrophysics Supplement, 4(1), 241–252.
- Bilir et al. (2016) Bilir, S., Bostancı, Z. F., Yontan, T. et al. (2016). CCD UBV photometry and kinematics of the open cluster NGC 225. Advances in Space Research, 58(9), 1900–1914. doi:10.1016/j.asr.2016.06.039.
- Bilir et al. (2008) Bilir, S., Cabrera-Lavers, A., Karaali, S. et al. (2008). Estimation of Galactic Model Parameters in High Latitudes with SDSS. Publications of the Astronomical Society of Australia, 25(2), 69–84. doi:10.1071/AS07026.
- Bilir et al. (2006a) Bilir, S., Güver, T., & Aslan, M. (2006a). Separation of dwarf and giant stars with ROTSE-IIId. Astronomische Nachrichten, 327(7), 693. doi:10.1002/asna.200510614.
- Bilir et al. (2010) Bilir, S., Güver, T., Khamitov, I. et al. (2010). CCD BV and 2MASS photometric study of the open cluster NGC 1513. Astrophysics and Space Science,, 326(1), 139–150. doi:10.1007/s10509-009-0233-1.
- Bilir et al. (2006b) Bilir, S., Karaali, S., Ak, S. et al. (2006b). Galactic longitude dependent galactic model parameters. New Astronomy, 12(3), 234–245. doi:10.1016/j.newast.2006.10.001.
- Bilir et al. (2006c) Bilir, S., Karaali, S., & Gilmore, G. (2006c). Investigation of the ELAIS field by Vega photometry: absolute magnitude-dependent Galactic model parameters. Monthly Notices of the Royal Astronomical Society, 366(4), 1295–1309. doi:10.1111/j.1365-2966.2006.09891.x.
- Bisht et al. (2020) Bisht, D., Zhu, Q., Yadav, R. K. S. et al. (2020). A comprehensive study of open clusters Czernik 14, Haffner 14, Haffner 17 and King 10 using multicolour photometry and Gaia DR2 astrometry. Monthly Notices of the Royal Astronomical Society, 494(1), 607–623. doi:10.1093/mnras/staa656.
- Bonatto & Bica (2011) Bonatto, C., & Bica, E. (2011). From proper motions to star cluster dynamics: measuring the velocity dispersion in deconvolved distribution functions. Monthly Notices of the Royal Astronomical Society, 415(1), 313–322. doi:10.1111/j.1365-2966.2011.18699.x.
- Bossini et al. (2019) Bossini, D., Vallenari, A., Bragaglia, A. et al. (2019). Age determination for 269 Gaia DR2 open clusters. Astronomy and Astrophysics, 623, A108. doi:10.1051/0004-6361/201834693.
- Bostancı et al. (2015) Bostancı, Z. F., Ak, T., Yontan, T. et al. (2015). A comprehensive study of the open cluster NGC 6866. Monthly Notices of the Royal Astronomical Society, 453(1), 1095–1107. doi:10.1093/mnras/stv1665.
- Bovy (2015) Bovy, J. (2015). galpy: A python library for Galactic dynamics. The Astrophysical Journal Supplement Series, 216(2), 29. doi:10.1088/0067-0049/216/2/29.
- Bovy & Tremaine (2012) Bovy, J., & Tremaine, S. (2012). On the local dark matter density. The Astrophysical Journal, 756(1), 89. doi:10.1088/0004-637X/756/1/89.
- Bressan et al. (2012) Bressan, A., Marigo, P., Girardi, L. et al. (2012). PARSEC: stellar tracks and isochrones with the PAdova and TRieste Stellar Evolution Code. Monthly Notices of the Royal Astronomical Society, 427(1), 127–145. doi:10.1111/j.1365-2966.2012.21948.x.
- Bukowiecki et al. (2011) Bukowiecki, Ł., Maciejewski, G., Konorski, P. et al. (2011). Open Clusters in 2MASS Photometry. I. Structural and Basic Astrophysical Parameters. Acta Astronomica, 61(3), 231–246. doi:10.48550/arXiv.1107.5119.
- Cantat-Gaudin & Anders (2020) Cantat-Gaudin, T., & Anders, F. (2020). Clusters and mirages: cataloguing stellar aggregates in the Milky Way. Astronomy and Astrophysics, 633, A99. doi:10.1051/0004-6361/201936691.
- Cantat-Gaudin et al. (2020) Cantat-Gaudin, T., Anders, F., Castro-Ginard, A. et al. (2020). Painting a portrait of the galactic disc with its stellar clusters. Astronomy and Astrophysics, 640, A1. doi:10.1051/0004-6361/202038192.
- Cantat-Gaudin et al. (2018) Cantat-Gaudin, T., Jordi, C., Vallenari, A. et al. (2018). A Gaia DR2 view of the open cluster population in the Milky Way. Astronomy and Astrophysics, 618, A93. doi:10.1051/0004-6361/201833476.
- Carraro et al. (2017) Carraro, G., Sales Silva, J. V., Moni Bidin, C. et al. (2017). Galactic Structure in the Outer Disk: The Field in the Line of Sight to the Intermediate-age Open Cluster Tombaugh 1. The Astronomical Journal, 153(3), 99. doi:10.3847/1538-3881/153/3/99.
- Casamiquela et al. (2017) Casamiquela, L., Carrera, R., Blanco-Cuaresma, S. et al. (2017). OCCASO - II. physical parameters and Fe abundances of red clump stars in 18 open clusters. Monthly Notices of the Royal Astronomical Society, 470(4), 4363–4381. doi:10.1093/mnras/stx1481.
- Casamiquela et al. (2016) Casamiquela, L., Carrera, R., Jordi, C. et al. (2016). The OCCASO survey: presentation and radial velocities of 12 Milky Way open clusters. Monthly Notices of the Royal Astronomical Society, 458(3), 3150–3167. doi:10.1093/mnras/stw518.
- Castro-Ginard et al. (2020) Castro-Ginard, A., Jordi, C., Luri, X. et al. (2020). Hunting for open clusters in Gaia DR2: 582 new open clusters in the Galactic disc. Astronomy and Astrophysics, 635, A45. doi:10.1051/0004-6361/201937386.
- Castro-Ginard et al. (2019) Castro-Ginard, A., Jordi, C., Luri, X. et al. (2019). Hunting for open clusters in Gaia DR2: the Galactic anticentre. Astronomy and Astrophysics, 627, A35. doi:10.1051/0004-6361/201935531.
- Castro-Ginard et al. (2018) Castro-Ginard, A., Jordi, C., Luri, X. et al. (2018). A new method for unveiling open clusters in Gaia. new nearby open clusters confirmed by DR2. Astronomy and Astrophysics, 618, A59. doi:10.1051/0004-6361/201833390.
- Chen et al. (2001) Chen, B., Stoughton, C., Smith, J. A. et al. (2001). Stellar Population Studies with the SDSS. I. The Vertical Distribution of Stars in the Milky Way. The Astrophysical Journal, 553(1), 184–197. doi:10.1086/320647.
- Chincarini (1966) Chincarini, G. (1966). The galactic cluster NGC 7762. Memorie della Societa Astronomica Italiana, 37, 423–425.
- Coşkunoǧlu et al. (2011) Coşkunoǧlu, B., Ak, S., Bilir, S. et al. (2011). Local stellar kinematics from RAVE data - I. Local standard of rest. Monthly Notices of the Royal Astronomical Society, 412(2), 1237–1245. doi:10.1111/j.1365-2966.2010.17983.x.
- Cuffey & Shapley (1937) Cuffey, J., & Shapley, H. (1937). Red indices in galactic clusters. Annals of Harvard College Observatory, 105(21), 403–444.
- de la Fuente Marcos & de la Fuente Marcos (2009) de la Fuente Marcos, R., & de la Fuente Marcos, C. (2009). Double or binary: on the multiplicity of open star clusters*. A&A, 500(2), L13–L16. URL: https://doi.org/10.1051/0004-6361/200912297. doi:10.1051/0004-6361/200912297.
- Dias et al. (2021) Dias, W. S., Monteir, H., Moitinho, A. et al. (2021). Updated parameters of 1743 open clusters based on Gaia DR2. Monthly Notices of the Royal Astronomical Society, 504(1), 356–371. doi:10.1093/mnras/stab770.
- Dias et al. (2014) Dias, W. S., Monteiro, H., Caetano, T. C. et al. (2014). Proper motions of the optically visible open clusters based on the UCAC4 catalog. Astronomy and Astrophysics, 564(1), A79. doi:10.1051/0004-6361/201323226.
- Donor et al. (2020) Donor, J., Frinchaboy, P. M., Cunha, K. et al. (2020). The open cluster chemical abundances and mapping survey. IV. abundances for 128 open clusters using SDSS/APOGEE DR16. The Astronomical Journal, 159(5), 199. URL: https://dx.doi.org/10.3847/1538-3881/ab77bc. doi:10.3847/1538-3881/ab77bc.
- Dreyer (1888) Dreyer, J. L. E. (1888). A New General Catalogue of Nebulæ and Clusters of Stars, being the Catalogue of the late Sir John F. W. Herschel, Bart, revised, corrected, and enlarged. Memoirs of the Royal Astronomical Society, 49, 1.
- Eker et al. (2018) Eker, Z., Bakış, V., Bilir, S. et al. (2018). Interrelated main-sequence mass-luminosity, mass-radius, and mass-effective temperature relations. Monthly Notices of the Royal Astronomical Society, 479(4), 5491–5511. doi:10.1093/mnras/sty1834.
- Eker et al. (2020) Eker, Z., Soydugan, F., Bilir, S. et al. (2020). Empirical bolometric correction coefficients for nearby main-sequence stars in the Gaia era. Monthly Notices of the Royal Astronomical Society, 496(3), 3887–3905. doi:10.1093/mnras/staa1659.
- Gaia Collaboration et al. (2018) Gaia Collaboration, Brown, A. G. A., Vallenari, A. et al. (2018). Gaia Data Release 2. Summary of the contents and survey properties. Astronomy and Astrophysics, 616, A1. doi:10.1051/0004-6361/201833051.
- Gaia Collaboration et al. (2021) Gaia Collaboration, Brown, A. G. A., Vallenari, A. et al. (2021). Gaia Early Data Release 3. summary of the contents and survey properties. Astronomy and Astrophysics, 649, A1. doi:10.1051/0004-6361/202039657.
- Gaia Collaboration et al. (2016) Gaia Collaboration, Prusti, T., de Bruijne, J. H. J. et al. (2016). The Gaia mission. Astronomy and Astrophysics, 595, A1. doi:10.1051/0004-6361/201629272.
- Gaia Collaboration et al. (2022) Gaia Collaboration, Vallenari, A., Brown, A. G. A. et al. (2022). Gaia Data Release 3: Summary of the content and survey properties. arXiv e-prints, (p. arXiv:2208.00211). doi:10.48550/arXiv.2208.00211.
- Galadi-Enriquez et al. (1998a) Galadi-Enriquez, D., Jordi, C., & Trullols, E. (1998a). The overlapping open clusters NGC 1750 and NGC 1758. III. Cluster-field segregation and clusters physical parameters. Astronomy and Astrophysics, 337, 125–140.
- Galadí-Enríquez et al. (1999) Galadí-Enríquez, D., Jordi, C., & Trullols, E. (1999). Astrometry and photometry of open clusters: NGC 1746, NGC 1750 and NGC 1758. Astrophysics and Space Science, 263(1), 307–310.
- Galadi-Enriquez et al. (1998b) Galadi-Enriquez, D., Jordi, C., Trullols, E. et al. (1998b). The overlapping open clusters NGC 1750 and NGC 1758. I. UBVRI-CCD photometry. Astronomy and Astrophysics, 333, 471–478.
- Hopkins (2018) Hopkins, A. M. (2018). The Dawes review 8: Measuring the stellar initial mass function. Publications of the Astronomical Society of Australia, 35, e039. doi:10.1017/pasa.2018.29.
- Hoskin (2006) Hoskin, M. (2006). Caroline Herschel’s catalogue of nebulae. Journal for the History of Astronomy, 37, 251–255. doi:10.1177/002182860603700301.
- Joshi et al. (2016) Joshi, Y. C., Dambis, A. K., Pandey, A. K. et al. (2016). Study of open clusters within 1.8 kpc and understanding the Galactic structure. Astronomy and Astrophysics, 593(1), A116. doi:10.1051/0004-6361/201628944.
- Karaali et al. (2003a) Karaali, S., Ak, S. G., Bilir, S. et al. (2003a). A charge-coupled device study of high-latitude Galactic structure: testing the model parameters. Monthly Notices of the Royal Astronomical Society, 343(3), 1013–1024. doi:10.1046/j.1365-8711.2003.06743.x.
- Karaali et al. (2011) Karaali, S., Bilir, S., Ak, S. et al. (2011). An improved metallicity calibration with UBV photometry. Publications of the Astronomical Society of Australia, 28(2), 95–106. doi:10.1071/AS10026.
- Karaali et al. (2003b) Karaali, S., Bilir, S., Karataş, Y. et al. (2003b). New metallicity calibration down to [fe/h] = -2.75 dex. Publications of the Astronomical Society of Australia, 20(2), 165–172. doi:10.1071/AS02028.
- Kharchenko et al. (2005) Kharchenko, N. V., Piskunov, A. E., Röser, S. et al. (2005). Astrophysical parameters of Galactic open clusters. Astronomy and Astrophysics, 438(3), 1163–1173. doi:10.1051/0004-6361:20042523.
- Kharchenko et al. (2013) Kharchenko, N. V., Piskunov, A. E., Schilbach, E. et al. (2013). Global survey of star clusters in the Milky Way. II. the catalogue of basic parameters. Astronomy and Astrophysics, 558(1), A53. doi:10.1051/0004-6361/201322302.
- King (1962) King, I. (1962). The structure of star clusters. I. an empirical density law. Astronomical Journal, 67, 471. doi:10.1086/108756.
- King et al. (2005) King, I. R., Bedin, L. R., Piotto, G. et al. (2005). Color-Magnitude Diagrams and Luminosity Functions Down to the Hydrogen-Burning Limit. III. A Preliminary Hubble Space Telescope Study of NGC 6791. The Astronomical Journal, 130(2), 626–634. doi:10.1086/431327.
- Koç et al. (2022) Koç, S., Yontan, T., Bilir, S. et al. (2022). A Photometric and Astrometric Study of the Open Clusters NGC 1664 and NGC 6939. The Astronomical Journal, 163(4), 191. doi:10.3847/1538-3881/ac58a0.
- Krone-Martins & Moitinho (2014) Krone-Martins, A., & Moitinho, A. (2014). UPMASK: unsupervised photometric membership assignment in stellar clusters. Astronomy and Astrophysics, 561, A57. doi:10.1051/0004-6361/201321143.
- Krumholz et al. (2019) Krumholz, M. R., McKee, C. F., & Bland-Hawthorn, J. (2019). Star clusters across cosmic time. Annual Review of Astronomy and Astrophysics, 57(1), 227–303. doi:10.1146/annurev-astro-091918-104430.
- Landolt (2009) Landolt, A. U. (2009). UBVRI photometric standard stars around the celestial equator: Updates and additions. The Astronomical Journal, 137(5), 4186–4269. doi:10.1088/0004-6256/137/5/4186.
- Landolt & Africano (2010) Landolt, A. U., & Africano, J. L. (2010). Photometry of a group of stars in the direction of NGC 1746/1750/1758. Publications of the Astronomical Society of the Pacific, 122(895), 1008. URL: https://dx.doi.org/10.1086/656322. doi:10.1086/656322.
- Lindoff (1968) Lindoff, U. (1968). The ages of open clusters. Arkiv for Astronomi, 5(1), 1–21.
- Liu & Pang (2019) Liu, L., & Pang, X. (2019). A Catalog of Newly Identified Star Clusters in Gaia DR2. The Astrophysical Journal Supplement Series, 245(2), 32. doi:10.3847/1538-4365/ab530a.
- Loktin & Popova (2017) Loktin, A. V., & Popova, M. E. (2017). Updated version of the ‘homogeneous catalog of open cluster parameters. Astrophysical Bulletin, 72(3), 257–265. doi:10.1134/S1990341317030154.
- Maciejewski et al. (2008) Maciejewski, G., Boeva, S., Georgiev, T. et al. (2008). Photometric study of open clusters NGC 2266 and NGC 7762. Baltic Astronomy, 17, 51–65.
- Maciejewski & Niedzielski (2007) Maciejewski, G., & Niedzielski, A. (2007). CCD BV survey of 42 open clusters. Astronomy and Astrophysics, 467(3), 1065–1074. doi:10.1051/0004-6361:20066588.
- Majewski (1993) Majewski, S. R. (1993). Galactic structure surveys and the evolution of the Milky Way. Annual Review of Astronomy and Astrophysics, 31, 575–638. doi:10.1146/annurev.aa.31.090193.003043.
- Miyamoto & Nagai (1975) Miyamoto, M., & Nagai, R. (1975). Three-dimensional models for the distribution of mass in galaxies. Publications of the Astronomical Society of Japan, 27, 533–543.
- Navarro et al. (1996) Navarro, J. F., Frenk, C. S., & White, S. D. M. (1996). The Structure of Cold Dark Matter Halos. Astrophysical Journal, 462, 563. doi:10.1086/177173.
- Patat & Carraro (1995) Patat, F., & Carraro, G. (1995). NGC 7762: A forgotten moderate age open cluster. Astronomy and Astrophysics Supplement, 114, 281.
- Poggio et al. (2021) Poggio, E., Drimmel, R., Cantat-Gaudin, T. et al. (2021). Galactic spiral structure revealed by Gaia EDR3. Astronomy and Astrophysics, 651, A104. URL: https://doi.org/10.1051/0004-6361/202140687. doi:10.1051/0004-6361/202140687.
- Reddy & Lambert (2019) Reddy, A. B. S., & Lambert, D. L. (2019). Comprehensive abundance analysis of red giants in the open clusters Stock 2, NGC 2168, 6475, 6991, and 7762. Monthly Notices of the Royal Astronomical Society, 485(3), 3623–3641. doi:10.1093/mnras/stz468.
- Sampedro et al. (2017) Sampedro, L., Dias, W. S., Alfaro, E. J. et al. (2017). A multimembership catalogue for 1876 open clusters using UCAC4 data. Monthly Notices of the Royal Astronomical Society, 470(4), 3937–3945. doi:10.1093/mnras/stx1485.
- Scalo (1998) Scalo, J. (1998). The IMF Revisited: A Case for Variations. In G. Gilmore, & D. Howell (Eds.), The Stellar Initial Mass Function (38th Herstmonceux Conference) (p. 201). volume 142 of Astronomical Society of the Pacific Conference Series. doi:10.48550/arXiv.astro-ph/9712317.
- Soubiran et al. (2018) Soubiran, C., Cantat-Gaudin, T., Romero-Gómez, M. et al. (2018). Open cluster kinematics with Gaia DR2. Astronomy and Astrophysics, 619, A155. doi:10.1051/0004-6361/201834020.
- Stetson et al. (2019) Stetson, P., Pancino, E., et al. (2019). Homogeneous photometry - vii. globular clusters in the gaia era. Monthly Notices of the Royal Astronomical Society, 485, 3042–3063. doi:10.1093/mnras/stz585.
- Straižys (1992) Straižys, V. (1992). Multicolor stellar photometry. Tucson : Pachart Pub. House.
- Straižys et al. (2003) Straižys, V., Kazlauskas, A., Černiauskas, A. et al. (2003). Overlapping Open Clusters NGC 1750 and NGC 1758 Behind the Taurus Dark Clouds. II. CCD Photometry in the Vilnius System. Baltic Astronomy, 12, 323–351. doi:10.1515/astro-2017-0055.
- Straizys et al. (1992) Straizys, V., Cernis, K., & Maistas, E. (1992). Probable open clusters NGC 1750 and NGC 1758 behind the Taurus Dark Clouds. Baltic Astronomy, 1, 125–141. doi:10.1515/astro-1992-0201.
- Sun et al. (2021) Sun, M., Jiang, B., Yuan, H. et al. (2021). The ultraviolet extinction map and dust properties at high galactic latitude. The Astrophysical Journal Supplement Series, 254(2), 38. doi:10.3847/1538-4365/abf929.
- Sung et al. (2013) Sung, H., Lim, B., Bessell, M. S. et al. (2013). Sejong open cluster survey (SOS). 0. target selection and data analysis. Journal of Korean Astronomical Society, 46(3), 103–123. doi:10.5303/JKAS.2013.46.3.103.
- Szabo (1999) Szabo, R. (1999). New variable stars in NGC 7762. Information Bulletin on Variable Stars, 4700, 1.
- Tarricq et al. (2021) Tarricq, Y., C., S., Casamiquela, L. et al. (2021). 3D kinematics and age distribution of the open cluster population. Astronomy and Astrophysics, 647, A19. doi:10.1051/0004-6361/202039388.
- Tian et al. (1998) Tian, K.-P., Zhao, J.-L., Shao, Z.-Y. et al. (1998). Determination of proper motions and membership of the open clusters ngc 1750 and ngc 1758. Astronomy and Astrophysics Supplement, 131(1), 89–98. URL: https://doi.org/10.1051/aas:1998253. doi:10.1051/aas:1998253.
- Wang et al. (2022) Wang, H., Zhang, Y., Zeng, X. et al. (2022). Searching for variable stars in the open cluster NGC 2355 and its surrounding region. The Astronomical Journal, 164(2), 40. doi:10.3847/1538-3881/ac755a.
- Yontan (2023) Yontan, T. (2023). An investigation of open clusters Berkeley 68 and Stock 20 using CCD UBV and Gaia DR3 data. The Astronomical Journal, (p. arXiv:2211.09825). doi:10.48550/arXiv.2211.09825.
- Yontan et al. (2021) Yontan, T., Bilir, S., Ak, T. et al. (2021). A study of open clusters Frolov 1 and NGC 7510 using CCD UBV photometry and Gaia DR2 astrometry. Astronomische Nachrichten, 342(3), 538–552. doi:10.1002/asna.202113837.
- Yontan et al. (2019) Yontan, T., Bilir, S., Bostancı, Z. F. et al. (2019). CCD UBV photometric and Gaia astrometric study of eight open clusters — ASCC 115, Collinder 421, NGC 6793, NGC 7031, NGC 7039, NGC 7086, Roslund 1 and Stock 21. Astrophysics and Space Science, 364(9), 152. doi:10.1007/s10509-019-3640-y.
- Yontan et al. (2015) Yontan, T., Bilir, S., Bostancı, Z. F. et al. (2015). CCD UBVRI photometry of NGC 6811. Astrophysics and Space Science, 355(2), 267–281. doi:10.1007/s10509-014-2175-5.