OpenDriver:An Open-Road Driver State Detection Dataset
\And
Abstract
In modern society, road safety relies heavily on the psychological and physiological state of drivers. Negative factors such as fatigue, drowsiness, and stress can impair drivers’ reaction time and decision-making abilities, leading to an increased incidence of traffic accidents. Among the numerous studies for impaired driving detection, wearable physiological measurement is a real-time approach to monitoring a driver’s state. However, currently, there are few driver physiological datasets in open-road scenarios and the existing datasets suffer from issues such as poor signal quality, small sample sizes, and short data collection periods. Therefore, in this paper, a large-scale multimodal driving dataset for driver impairment detection and biometric data recognition is designed and described. The dataset contains two modalities of driving signals: six-axis inertial signals and electrocardiogram (ECG) signals, which were recorded while over one hundred drivers were following the same route through open roads during several months. Both the ECG signal sensor and the six-axis inertial signal sensor are installed on a specially designed steering wheel cover, allowing for data collection without disturbing the driver. Additionally, electrodermal activity (EDA) signals were also recorded during the driving process and will be integrated into the presented dataset soon. Future work can build upon this dataset to advance the field of driver impairment detection. New methods can be explored for integrating other types of biometric signals, such as eye tracking, to further enhance the understanding of driver states. The insights gained from this dataset can also inform the development of new driver assistance systems, promoting safer driving practices and reducing the risk of traffic accidents. The OpenDriver dataset will be publicly available soon.
Keywords Multimodal driving dataset Six-axis inertial signals Electrocardiogram signals Open-road scenarios
1 Introduction
Currently, road traffic accidents have become the eighth primary cause of death on a global scale, resulting in the loss of more than 1.35 million lives annually and causing up to 50 million injuries [1]. Driver impairment, including fatigue[2], sleepiness[3], distraction[4], anger[5], have been recognized as significant contributing factors to traffic accidents. These conditions may lead to impaired driving performance, reduced situational awareness, and delayed reaction times, all of which increase the risk of collisions and injuries. Therefore, developing effective interventions and countermeasures to prevent and mitigate driver impairment is essential to ensuring road safety.
Wearable physiological measurement is an effective approach to detecting drivers’ states due to its high real-time capability. Compared to visual methods that use monitoring videos to detect impaired driving, physiological signal measurement is less susceptible to external lighting and object occlusion. Among various physiological measurements, electrocardiogram (ECG) signal is one type of physiological measurement that reflect the electrical activity of the heart and can provide information about drivers’ physiological states. Specifically, changes in heart rate (HR) and heart rate variability (HRV) have been shown to be associated with different driving states, such as fatigue[6], sleepiness[7, 8], and stress[9]. Compared to other physiological measurements, ECG signals are relatively easy to measure using a set of electrodes attached to the skin, making them a practical and convenient method for assessing driver states[8]. Some of the driving datasets were collected using driving simulators, which utilized a range of techniques to simulate real-world driving conditions[10, 11, 12]. However, It should be noted that there are differences between simulated and open-road scenarios. Simulated data dependent on the conditions of acquisition may not fully reflect the actual states and driving behavior of drivers[13]. At present, there are few publicly available physiological signal datasets collected in real driving scenarios, and the existing datasets suffer from several limitations, including: 1) Some datasets[14, 15] used intrusive measurement methods to collect physiological signals. These invasive methods often required devices to be attached to the driver’s chest, head, or other parts of the body, which could interfere with normal driving, and therefore resulted in misleading data which cannot reflect drivers’ actual performance. 2) Due to the limited number of participants, algorithms based on these datasets might lack generalizability considering inter-individual variability in physiological signals[16]. 3) The data collection period for each individual is relatively short, typically spanning several hours[17, 10]. As a result, these datasets often contain segments of data from a single day or a few days, which makes it impossible to compare the effects of drivers’ state on data collection over an extended period. 4) Data in DriveDB [14] were collected more than ten years ago, leading to poor quality of the physiological signals, especially in regards to the electrocardiogram signals which were sampled at a relatively low frequency.
In this paper, a large-scale dataset collected in real-world driving scenarios is presented, which includes six-axis inertial data, drivers’ ECG signals and EDA signals. Considering the limitation of existing datasets, our dataset makes three contributions:
-
•
Non-intrusive methods are used to collect ECG signals by placing ECG sensors on the steering wheel cover, which allows us to collect data without disrupting the drivers.
-
•
The dataset contains data collected from over 100 vehicles and 100 drivers, which provides rich information to analyze individual differences. Additionally, the data collection period spans over several months and over ten thousand trips are included, enabling long-term research on driver assessment.
-
•
Collected ECG data are all from professional drivers, which closely reflect real driving scenarios.
-
•
Six-axis inertial data and ECG data were collected simultaneously, enabling the utilization of both modalities to analyze driver’s mental state and behavior. Researchers could categorize the driving routes into city roads and highways based on six-axis inertial data, and these weak labels can facilitate research on the relationship between driver’s cognitive load and ECG features.
2 Dataset
2.1 Data collection
The data were collected in an actual driving scenario, with the aim of studying the effective identification of drivers’ driving scenarios and driving behaviors. The dataset contains two modalities of driving signals: six-axis inertial signals and electrocardiogram (ECG) signals. The six-axis inertial signals include the signals of three-axis acceleration and three-axis angular velocity, which can be collected using sensors such as accelerometers and gyroscopes. The six-axis inertial signals can provide real-time information on steering wheel angle and vehicle acceleration during operation. ECG signals can also be used in various applications in driving scenarios, such as fatigue driving detection, emotion detection, driving behavior analysis, and biometric identification. The signals in the dataset are recorded in trips, with each trip representing a driving process of a professional driver on a specified route. In total, four specified routes are designed in the dataset, and the data collection of each driver spanned several months. The participating drivers have no relevant diseases that may affect data collection, and they generally have a long driving experience, with a representative age range of 40-55 years old.
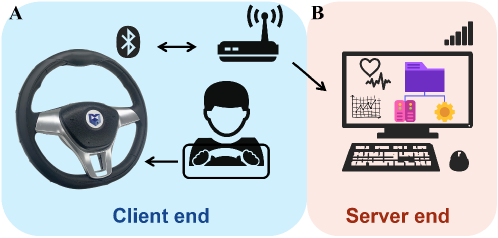
Our driving signal acquisition system consists of two main parts, the client end and the server end. When the user is in normal driving state (with both hands on the steering wheel), the data acquisition device automatically collects and processes the relevant driving signals. The collected data is then transmitted to the gateway via Bluetooth, and the database end continually receives and stores the data for subsequent data analysis (Figure 1). When the user is in free driving state (with one hand on the steering wheel or not holding the steering wheel), only six-axis inertial signals are recorded.
During the data collection process, a specially designed data collection device was used, which includes two main sensors: an ECG signal acquisition sensor and a six-axis signal sensor, both of which were installed on the steering wheel cover. The collection of six-axis inertial signals was achieved through a group of sensors called Inertial Measurement Units (IMUs). IMUs typically include three accelerometers and three gyroscopes. Accelerometers measure the acceleration of an object on three axes, while gyroscopes measure the rotational speed of an object on three axes. By integrating and converting these signals, information such as the velocity, acceleration, and position of the object can be obtained. The collection of ECG signals was achieved by simultaneously contacting a group of electrode pads with both hands. By amplifying the weak electrical signals measured between the two electrode pads, the corresponding ECG signals can be obtained and stored. High-precision sensors were used in our devices to collect and upload driving signal data in real-time. The installation position and method of the devices were carefully designed and verified to ensure the accuracy and authenticity of the data. In addition, our data collection devices did not affect the driving experience of the driver in any way, ensuring the reliability and effectiveness of the data collection process.
2.2 Data description
Data scale: OpenDriver dataset covers tens of thousands of trips from over 100 vehicles and drivers. We have preliminarily sorted out 3,278 complete trip records involving 81 drivers, with a total signal duration of approximately 4,600 hours. This dataset is currently the largest known public dataset of driving signals.
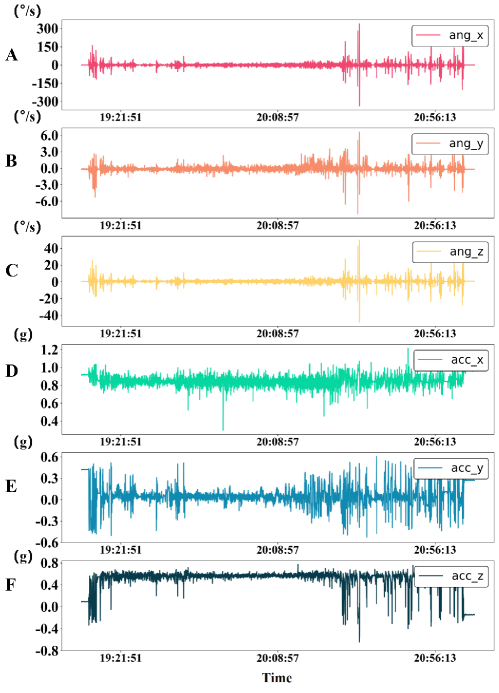
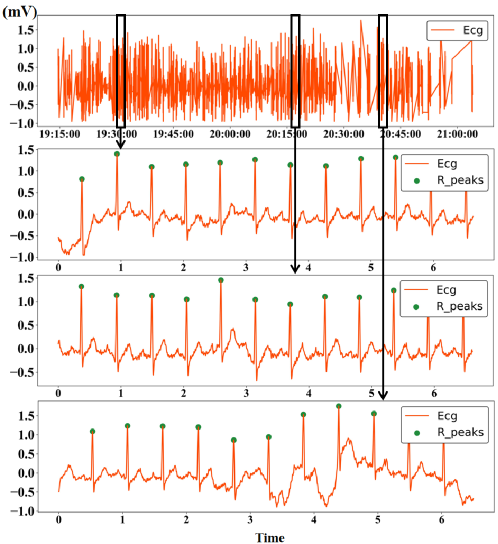
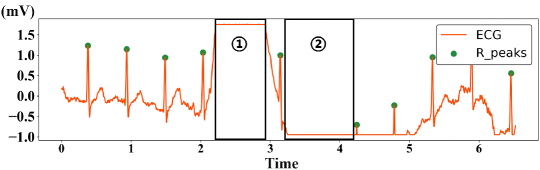
Data information: The sampling frequency of the six-axis data is 25Hz for our OpenDriver dataset, which includes three sets of acceleration data and three sets of angular velocity data(Figure 2). The sampling frequency of the ECG data was 360Hz, which were collected in single-lead format(Figure 3).
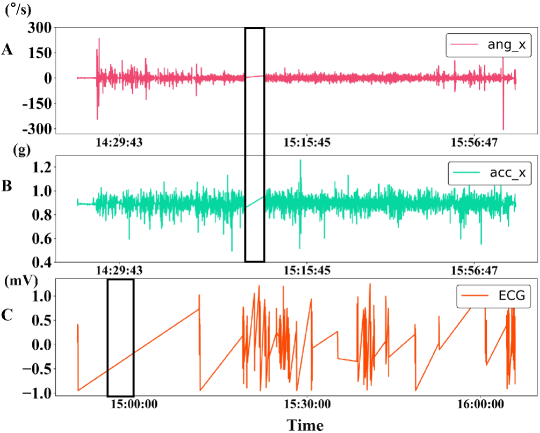
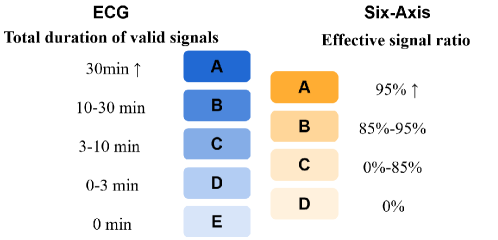
Data quality: Due to the fact that the data collection took place in actual driving scenarios, the signals are not as ideal as those collected in simulated scenarios. During the actual data collection process, a certain amount of data loss may occur due to power outages, network signal loss, and other situations (Figure 4). Additionally, the effective collection of electrocardiogram signals requires the driver to hold the steering wheel with both hands, which means that some driving habits of the driver can also affect the collection of electrocardiogram signals (Figure 5). In order to reflect the completeness of each driving signal data, we have conducted a complete evaluation and grading of each driving signal. The electrocardiogram signals are graded from A to E according to completeness, where A represents the most complete signal, and E represents a completely missing signal. The six-axis inertial signals are graded from A to D according to completeness, where A represents the most complete signal, and E represents a completely missing signal(Figure 6). For electrocardiogram signals, due to the limitations of the collection equipment and the actual scenario, some signals may be truncated, resulting in poor signal quality. Therefore, in addition to the completeness evaluation of electrocardiogram signals, we also provide corresponding quality evaluation codes to help researchers gain a preliminary understanding of the signals when using them.
3 Future Work
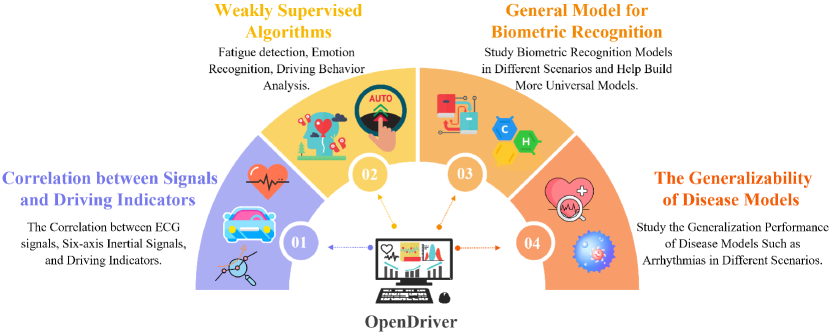
Future research in this field can focus on several directions(Figure 7). Firstly, the development of weakly supervised and transfer learning algorithms using the dataset for more precise, reliable fatigue detection, emotion recognition, and driving behavior analysis. For fatigue and stress detection, weak labels such as driving duration and HRV feature changes can be provided to support researchers in driver state recognition-related work. In addition, additional information can be obtained from features such as steering wheel angle provided by the six-axis inertial signal. At the same time, EDA data has also been collected and included to further enhance the dataset’s validity and practicality.The second research direction is to build a general model for biometric recognition. The dataset includes long-term records of multiple individuals, covering physiological signal changes resulting from long-term driving. These data can be used to study biometric recognition models in different scenarios and help build more universal models.The third direction is to use the dataset to study the generalizability of disease models such as arrhythmias in different scenarios. The dataset includes arrhythmia signals that occur during driving, which can be used to study the generalization performance of disease models such as arrhythmias in different scenarios.Finally, the relationship between ECG signals, six-axis inertial signals, and driving behavior can be explored. The correlation between ECG signals, six-axis inertial signals, and driving indicators, such as speed, acceleration, and lane keeping, can be analyzed to gain a deeper understanding of the potential mechanisms underlying driver states and behavior. In addition, this dataset can be made available to the research community to encourage the development of novel algorithms and models for driver state detection and behavior analysis. It can also be used as a benchmark dataset and evaluation metric for future research in this field.
In summary, this dataset presents a valuable resource for research in the field of driver state detection and behavior analysis. The future work highlighted above can enhance the accuracy and effectiveness of existing methods and enable the development of novel approaches for improving driving safety.
References
- [1] World Health Organization and others. Global status report on road safety 2018. Geneva: World Health Organization; 2018, 2016.
- [2] Pierre Philip, Jacques Taillard, E Klein, Patricia Sagaspe, Anthony Charles, WL Davies, C Guilleminault, and Bernard Bioulac. Effect of fatigue on performance measured by a driving simulator in automobile drivers. Journal of Psychosomatic Research, 55(3):197–200, 2003. Publisher: Elsevier.
- [3] Stéphanie Bioulac, Jean-Arthur Micoulaud-Franchi, Mickael Arnaud, Patricia Sagaspe, Nicholas Moore, Francesco Salvo, and Pierre Philip. Risk of motor vehicle accidents related to sleepiness at the wheel: a systematic review and meta-analysis. Sleep, 40(10):zsx134, 2017. Publisher: Oxford University Press US.
- [4] Oscar Oviedo-Trespalacios, Md Mazharul Haque, Mark King, and Simon Washington. Understanding the impacts of mobile phone distraction on driving performance: A systematic review. Transportation Research Part C: Emerging Technologies, 72:360–380, 2016. Publisher: Elsevier.
- [5] Tingru Zhang and Alan HS Chan. The association between driving anger and driving outcomes: A meta-analysis of evidence from the past twenty years. Accident Analysis & Prevention, 90:50–62, 2016. Publisher: Elsevier.
- [6] Yvonne Tran, Nirupama Wijesuriya, Mika Tarvainen, Pasi Karjalainen, and Ashley Craig. The relationship between spectral changes in heart rate variability and fatigue. Journal of Psychophysiology, 23(3):143–151, 2009. Publisher: Hogrefe Publishing.
- [7] José Vicente, Pablo Laguna, Ariadna Bartra, and Raquel Bailón. Detection of driver’s drowsiness by means of HRV analysis. In 2011 Computing in Cardiology, pages 89–92. IEEE, 2011.
- [8] Ruben Buendia, Fabio Forcolin, Johan Karlsson, Bengt Arne Sjöqvist, Anna Anund, and Stefan Candefjord. Deriving heart rate variability indices from cardiac monitoring—An indicator of driver sleepiness. Traffic Injury Prevention, 20(3):249–254, 2019. Publisher: Taylor & Francis.
- [9] Nermine Munla, Mohamad Khalil, Ahmad Shahin, and Azzam Mourad. Driver stress level detection using HRV analysis. In 2015 International Conference on Advances in Biomedical Engineering (ICABME), pages 61–64. IEEE, 2015.
- [10] José Vicente, Pablo Laguna, Ariadna Bartra, and Raquel Bailón. Drowsiness detection using heart rate variability. Medical & Biological Engineering & Computing, 54:927–937, 2016. Publisher: Springer.
- [11] MS Wang, Nak-Tak Jeong, Ki-Su Kim, SB Choi, SM Yang, SH You, JH Lee, and MW Suh. Drowsy behavior detection based on driving information. International Journal of Automotive Technology, 17:165–173, 2016. Publisher: Springer.
- [12] Xiong Bill Yu. Non-contact driver drowsiness detection system. Technical report, 2012.
- [13] Cláudia Sofia Alferes Ribeiro da Silva and others. Driver’s fatigue state monitoring using physiological signals. 2017.
- [14] Noelia Rodríguez-Ibáñez, Miguel A García-González, Mireya Fernández-Chimeno, and Juan Ramos-Castro. Drowsiness detection by thoracic effort signal analysis in real driving environments. In 2011 Annual International Conference of the IEEE Engineering in Medicine and Biology Society, pages 6055–6058. IEEE, 2011.
- [15] A Ihs. Swedish National Road and Transport Research Institute. Linköping, Sweden: Swedish National Road and Transport Research Institute-VTI, 2006.
- [16] George Rigas, Yorgos Goletsis, Panagiota Bougia, and Dimitrios I Fotiadis. Towards driver’s state recognition on real driving conditions. International Journal of Vehicular Technology, 2011, 2011. Publisher: Hindawi.
- [17] Nipun Gupta. ECG and wearable computing for drowsiness detection. PhD Thesis, California State University, Northridge, 2014.