Date of publication xxxx 00, 0000, date of current version xxxx 00, 0000. 10.1109/ACCESS.2017.DOI
Corresponding author: Leo Mrsic (e-mail: leo.mrsic@algebra.hr)
Predicting Short-Term Energy Demand in the Smart Grid: A Deep Learning Approach for Integrating Renewable Energy Sources in Line with SDGs 7, 9, and 13
Abstract
Integrating renewable energy sources into the power grid is becoming increasingly important as the world moves towards a more sustainable energy future in line with SDG 7. However, the intermittent nature of renewable energy sources can make it challenging to manage the power grid and ensure a stable supply of electricity, which is crucial for achieving SDG 9. In this paper, we propose a deep learning-based approach for predicting energy demand in a smart power grid, which can improve the integration of renewable energy sources by providing accurate predictions of energy demand. Our approach aligns with SDG 13 on climate action, enabling more efficient management of renewable energy resources. We use long short-term memory networks, well-suited for time series data, to capture complex patterns and dependencies in energy demand data. The proposed approach is evaluated using four historical short-term energy demand data datasets from different energy distribution companies, including American Electric Power, Commonwealth Edison, Dayton Power and Light, and Pennsylvania-New Jersey-Maryland Interconnection. The proposed model is also compared with three other state-of-the-art forecasting algorithms: Facebook Prophet, Support Vector Regression, and Random Forest Regression. The experimental results show that the proposed REDf model can accurately predict energy demand with a mean absolute error of 1.4%, indicating its potential to enhance the stability and efficiency of the power grid and contribute to achieving SDGs 7, 9, and 13. The proposed model also has the potential to manage the integration of renewable energy sources in an effective manner.
Index Terms:
Energy demand forecasting, smart grid application, SDG 7, SDG 9, SDG 13, LSTM, sustainable energy=-15pt
I Introduction
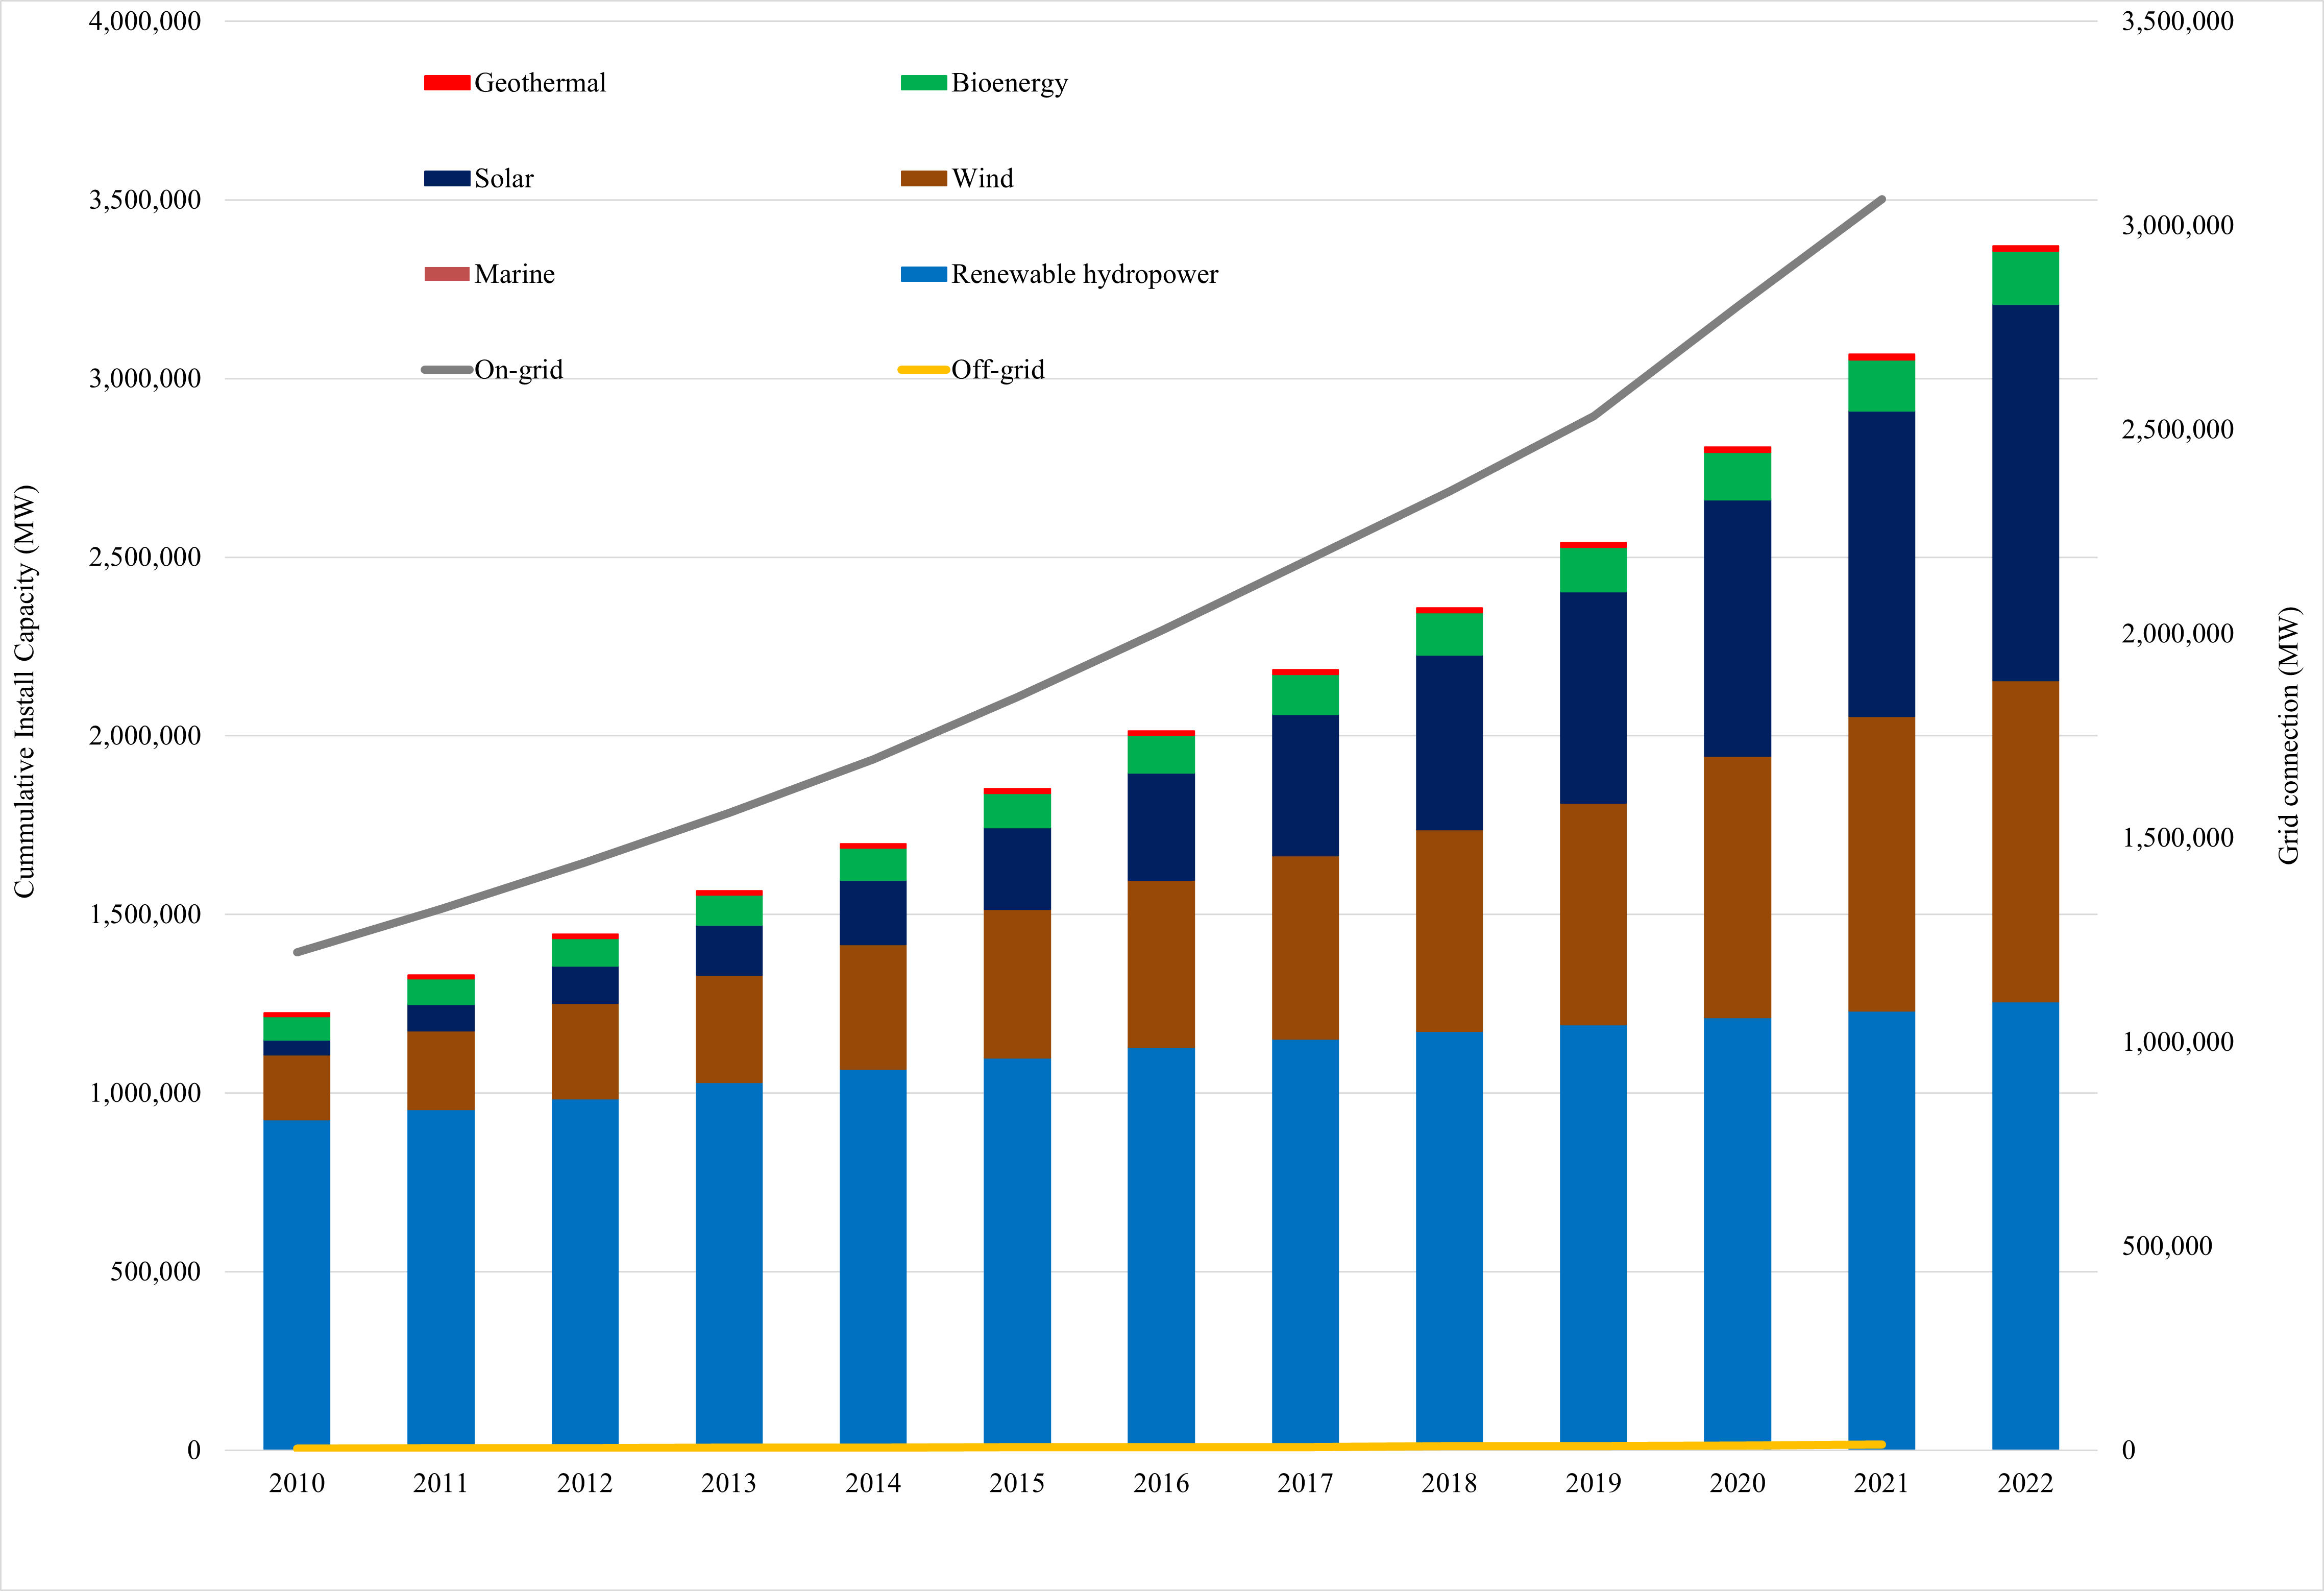
At present, the whole world is experiencing a serious dilemma in the energy field due to the rapid depletion of fossil fuels due to rising populations, urbanization, and technological advancements. In addition, burning fossil fuels results in water and air contamination, climate change, and the production of greenhouse gases, all of which contribute to the acceleration of global warming and have severe adverse effects on ecosystems and human health [1]. To mitigate the impacts of climate change, scientists, academics, and policymakers are working to mainstream renewable energy (RE) as a replacement for carbon-based power sources. To achieve the goal of the 1.5°C scenario by 2050, the most significant threshold is to ensure 90% electricity generation from RE sources and 79% of the overall energy consumption [2]. Over the last decade, the installation and generation of renewable energy in terms of off-grid and on-grid systems have increased significantly. According to the International Renewable Energy Agency (IRENA), the latest trends in renewable energy are shown in Fig. 1 [3]. This figure shows that the maximum number of installations are getting direct connections to the grid, and as compared to other technologies, the increase in solar and wind-based power plants is noticeable.
Integrating renewable energy sources into the power grid is becoming increasingly important as the world moves towards a more sustainable future [4, 5]. However, the integration of these sources is not without its challenges. One of the biggest challenges is the unpredictability of renewable energy generation, which can lead to imbalances in the power grid [6, 7]. One way to address this challenge is to predict energy demand using deep learning for a smart power grid, reflecting SDG 7: Affordable and Clean Energy [8]. The United Nations has set a target to “ensure access to affordable, reliable, sustainable, and modern energy for all” by 2030. Developing accurate and effective predictive models for renewable energy demand is critical to achieving this goal.
By accurately predicting renewable energy demand in a smart grid, utilities can more effectively manage their renewable energy resources and reduce their reliance on fossil fuels, leading to a more sustainable and environmentally friendly energy system [9, 10]. This can help reduce greenhouse gas emissions, improve air quality, and support the transition to a low-carbon economy.
In addition to SDG 7, other relevant, sustainable development goals for predicting renewable energy demand in a smart grid could include SDG 9: Industry, Innovation, and Infrastructure [11], which emphasizes the importance of developing sustainable infrastructure and promoting innovation in the energy sector, and SDG 13: Climate Action [12], which calls for urgent action to combat climate change and its impacts.
This study aims to present a detailed analysis of how deep learning can predict energy demand in a smart power grid to improve the integration of renewable energy sources. Accurately predicting energy demand is crucial for managing the power grid, as it allows for the optimal distribution and use of renewable energy sources.
The use of machine learning techniques in the energy sector has gained significant attention in recent years [13, 14, 15]. With the increasing demand for energy, finding more efficient ways to manage energy consumption and reduce carbon emissions is essential. Several studies have been found relevant to this.
The authors of the paper [16] analyzed the efficiency of different deep learning models, including RNN, LSTM, and GRU, in predicting energy demand for the Smart Grid Smart City project using datasets from 2010 to 2014. The models are evaluated using RMSE, MAE, and scores. The results showed that GRU outperforms basic RNN and LSTM with the lowest RMSE error and highest score due to its ability to deal with the vanishing gradient problem and its impact on the number of parameters.
In another work [17], the authors proposed using hybrid deep learning methods to improve load forecasting accuracy in the Saudi smart grid system. It aims to develop reliable forecasting models and understand the relationship between various features and attributes in the Saudi smart grid. The model uses a real dataset from Jeddah and Medinah grids for an entire year with a one-hour time resolution and compares prediction results with conventional deep learning methods, including RNN [18], LSTM [19], GRU [20], and CNN [21]. The results show that the proposed hybrid deep learning models, particularly CNN-GRU and CNN-RNN, provide 1.4673% and 1.222% improvement in load forecasting accuracy, respectively, compared to the benchmark strategy.
In the work [22], the authors used LSTM-RNN architecture to predict household electrical energy consumption two months in advance. The model is trained on relevant features and evaluated by comparing actual and predicted values. The proposed model helps households conserve energy and is evaluated using the UCI repository dataset of domestic electric consumption [23]. The results showed that the LSTM model has much higher precision than statistical and engineering prediction models, with a compatible RMSE of 0.6 compared to conventional models.
The study by Taleb et al. [24] proposed a hybrid machine learning model that combines standard neural networks with an automatic weight update process based on past errors. This flexible model can predict energy demand over various time ranges and regions. The effectiveness of the proposed model was demonstrated by achieving a mean absolute error (MAE) of 372.08 in energy demand prediction for Mayotte Island.
Residential load forecasting is becoming increasingly important as smart meters are increasingly deployed at the household level to collect historical data on energy consumption. In the study by Mubashar et al. [25], they proposed a method for load forecasting and validated it using real-world data sets. They compared the performance of their proposed method, which uses LSTM models, with two commonly used techniques, ARIMA and exponential smoothing. They evaluated the accuracy of load forecasts generated using these three techniques using real data from 12 houses over three months. The results indicated that LSTM models performed better than the other two methods for time series-based predictions. Their model achieved an MAE of 2.44736176.
Another work by Rosato et al. [26] presented a novel deep learning approach for multivariate prediction of energy time series. The proposed approach utilized Convolutional Neural Network and Long Short-Term Memory models to combine and filter several correlated time series while considering their long-term dependencies. The learning scheme is implemented as a stacked deep neural network, with one or more layers feeding their output into the input of the subsequent layer. The effectiveness and accuracy of the proposed approach are demonstrated through real-world applications in the energy sector, highlighting its robustness and accuracy. The lowest RMSE the method achieved among all the variations tested is 2.252, achieved on a baseline 1-day forecast.
Electric power load demand forecasting is critical for energy management, requiring accurate planning and infrastructure investment predictions. Despite a lot of research in this area, accuracy remains an issue. The study by Nguyen et al. [27] proposed an electricity demand forecasting method based on the LSTM deep learning model, tested using six years of power consumption data in Vietnam. The proposed method achieved an RMSE of 9.63, indicating its potential as a valuable tool for energy sector studies.
This paper by Pramono et.al [28], proposed a method for short-term load forecasting using a wavenet-based model that employs dilated causal residual convolutional neural network (CNN) and long short-term memory (LSTM) layers. The proposed model outperforms other deep learning-based models in terms of root mean squared error (RMSE), and mean absolute error (MAE), achieving RMSE and MAE equal to 203.23, and 142.23 for the ENTSO-E testing dataset 1, and 292.07 and 196.95 for ENTSO-E dataset 2. For the ISO-NE dataset, the RMSE, and MAE are equal to 85.12, 58.96 for ISO-NE testing dataset 1 and 85.31, and 62.23 for ISO-NE dataset 2. The proposed method aimed to support the demand response program in hybrid energy systems, especially those using renewable and fossil sources. Two different ways of conducting model testing were conducted: one using datasets with identical distributions as the validation data and the other with unknown distributions.
The related works in this field demonstrate various approaches for predicting energy demand using machine learning techniques such as neural networks and time series analysis. These studies have shown promising results in improving energy demand forecasts, highlighting the potential of machine learning in the energy sector. However, there is still room for improvement, and further research is needed to refine and optimize these techniques to provide more accurate and reliable predictions.
In consideration of recent studies and the objectives outlined in this study, we propose an approach that utilizes deep learning, a sub-field of machine learning that is well-suited for the analysis of sequential data, such as time series data [29, 30]. Our proposed approach employs a long short-term memory (LSTM) network, which is a type of recurrent neural network (RNN) explicitly designed to model sequential data with temporal dependencies [19]. To train the model, we use historical energy demand data and evaluate its performance using various metrics, including mean absolute error (MAE), root mean squared error (RMSE), and coefficient of determination ().
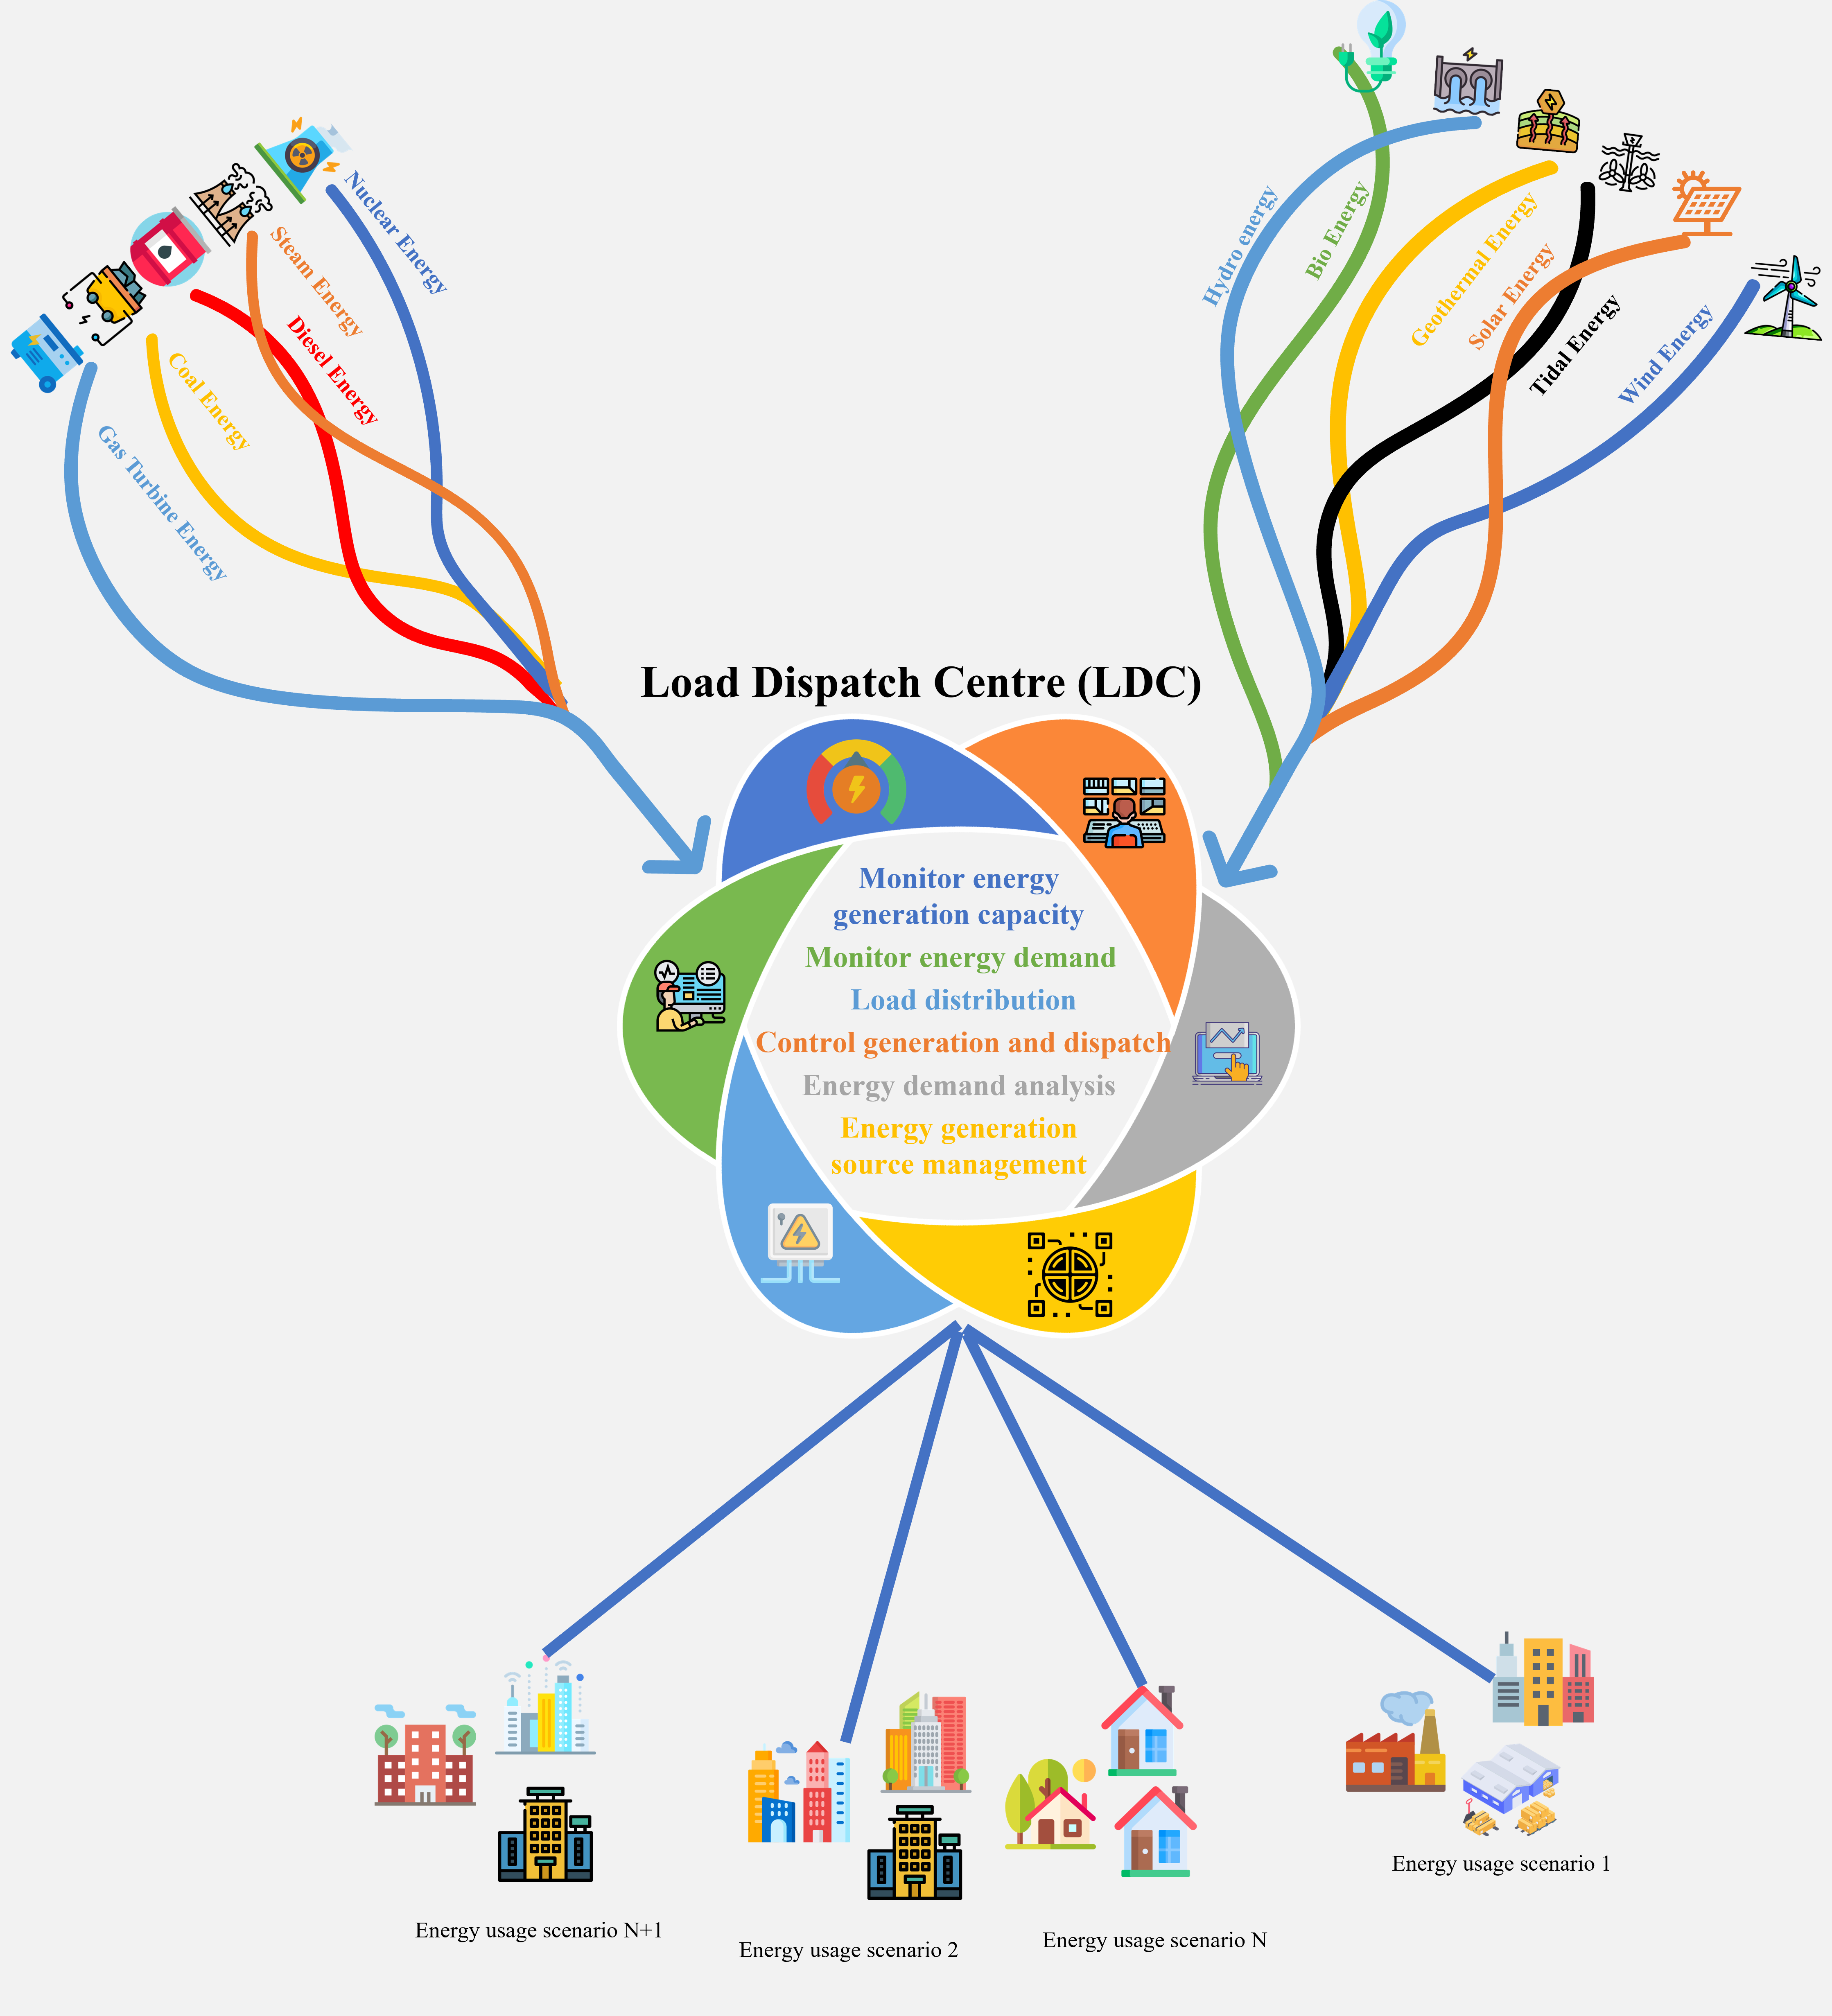
In addition to accurately predicting energy demand, the proposed method also demonstrates robust generalization capabilities for previously unobserved data. The ability to accurately foresee energy demand has the potential to improve the management of power grids, allowing for more efficient distribution and utilization of renewable energy sources and reducing reliance on nonrenewable energy sources. In addition, the proposed method has the potential to increase the overall efficiency of power infrastructure, reduce costs, and facilitate more effective integration of renewable energy sources. Fig. 2 depicts the broader context of the smart grid application, taking energy demand forecasting into account. The following is a summary of the key contributions of this work:
-
•
Proposing an approach that utilizes deep learning, specifically a long short term memory (LSTM) network, for predicting energy demand. This approach is well-suited for analyzing sequential data, such as time series data, and has the potential to improve the accuracy and reliability of energy demand forecasts, enabling proper management of renewable energy generation and distribution.
-
•
Minimizing the mean absolute error (MAE) in the proposed energy demand prediction model.
-
•
Evaluating the performance of the proposed approach using various metrics, including mean absolute error (MAE), root mean squared error (RMSE), and coefficient of determination ().
The remaining sections of this paper are structured as follows. In the following section, the study’s materials and methods, including data acquisition and pre-processing, model development, evaluation, and deployment, are described in detail. The experimental findings are then presented in the results and discussion section, along with a comparison to other existing methods. Finally, the study concludes with recommendations for future research.
II Materials and Methods
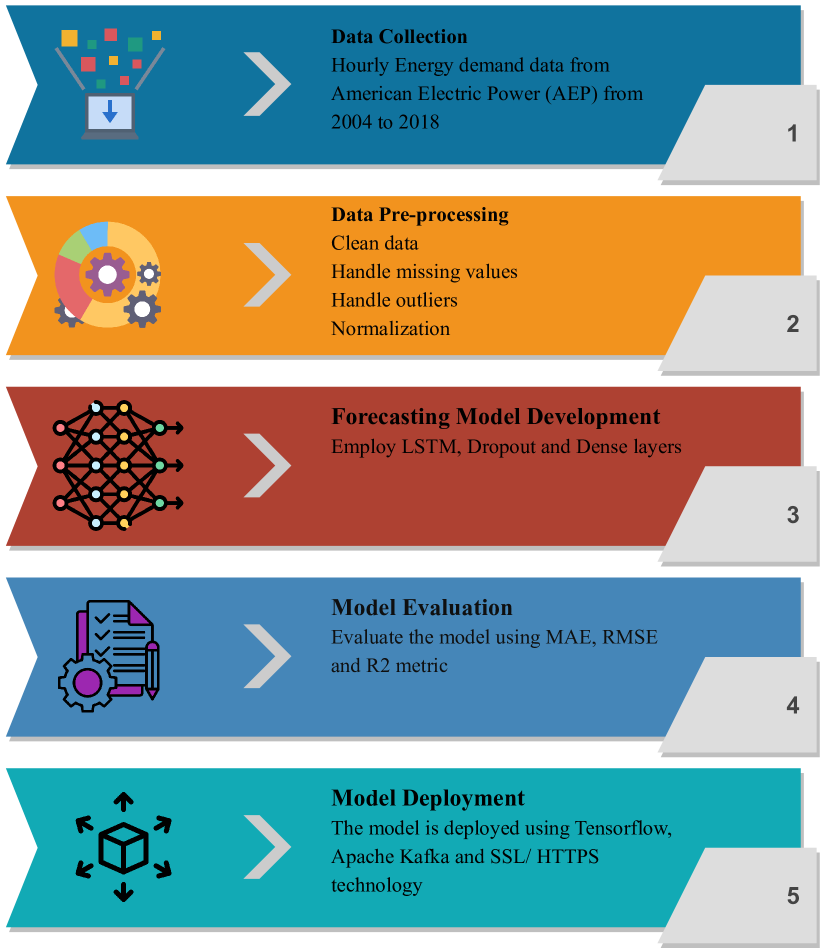
In this study, we propose an approach based on deep learning for forecasting energy demand in a smart grid. The primary objective of this strategy is to improve the integration of renewable energy sources by providing accurate energy demand forecasts that can aid in the administration of the power grid. Beginning with data collection, pre-processing, and model development, the proposed method continues with model evaluation and deployment. Starting with the formulation of the problem, we will describe each phase in detail and explain the tools and techniques used at each stage. The overview of the methodology employed in this study is shown in Fig. 3.
II-A Problem Formulation
The problem formulation section provides the foundation and context for the proposed solution in the study by clearly defining the objective, scope, and challenges of the energy demand forecasting problem. The problem of predicting energy demand for a smart power grid can be formulated mathematically as follows:
Given a time series of historical energy demand data, represented by a sequence of vectors , where is a vector of energy demand values at time , the goal is to predict the energy demand at a future time, represented by a vector , where is the number of time steps ahead for which the prediction is made.
We can represent this problem as a function , where the function maps the historical energy demand data to the predicted energy demand.
The objective is to find the optimal function that minimizes the prediction error, which can be defined as the mean absolute error (MAE) between the predicted and actual energy demand values.
II-B Data Collection
Data collection is an essential step in the process of predicting energy demand in a smart power grid. This section briefly describes the steps and techniques used for data collection in the proposed study.
The first step in data collection is identifying the relevant data sources. This includes identifying the types of data that are necessary for the model to make accurate predictions, such as energy consumption data, weather data, and economic data. Data can be collected from various sources, such as utilities, government agencies, and publicly available datasets. In this study, hourly energy demand data from American Electric Power (AEP) is utilized [31]. AEP is one of the largest electric utility companies in the United States, serving over 5 million customers across 11 states. This dataset contains a total of 121273 rows of data on hourly energy consumption from December 2004 to January 2018. Besides AEP, COMED [32], DAYTON [33], and PJME [34] datasets have also been used to test the model’s performance. All these datasets are widely used for benchmarking energy demand forecasting models and are available at this GitHub repository, https://github.com/panambY/Hourly_Energy_Consumption [35].
COMED hourly energy consumption data refers to the hourly electricity consumption data for the Commonwealth Edison (COMED) service area, which covers the northern part of Illinois in the United States. The data provides information on the hourly electricity demand for residential, commercial, and industrial customers in the COMED service area. This dataset contains historical energy consumption data in an hourly fashion from December 2011 to January 2018, with a total of 66497 data points.
DAYTON hourly energy consumption data refers to the hourly electricity consumption data for the Dayton Power and Light (DP&L) service area, which covers the city of Dayton, Ohio, and surrounding areas in the United States. The data provides information on the hourly electricity demand for residential, commercial, and industrial customers in the DP&L service area. This dataset contains historical energy consumption data in an hourly fashion from December 2004 to January 2018, with a total of 121275 data points.
PJME hourly energy consumption data refers to the hourly electricity consumption data for the Pennsylvania-New Jersey-Maryland Interconnection (PJM) regional transmission organization in the United States. The data provides information on the hourly electricity demand for a large portion of the eastern United States, covering 13 states and the District of Columbia, and includes variables such as date, time, temperature, and electricity demand. This dataset contains historical energy consumption data in an hourly fashion from December 2002 to January 2018, with a total of 145366 data points. Table I shows an overview of the datasets utilized to benchmark the proposed model.
| Dataset | Start Datetime | End Datetime | Number of Data points |
|---|---|---|---|
| AEP | 2004-12-31 01:00:00 | 2018-01-02 00:00:00 | 121273 |
| COMED | 2011-12-31 01:00:00 | 2018-01-02 00:00:00 | 66497 |
| DAYTON | 2004-12-31 01:00:00 | 2018-01-02 00:00:00 | 121275 |
| PJME | 2002-12-31 01:00:00 | 2018-01-02 00:00:00 | 145366 |
After data has been collected, it has to be pre-processed to ensure that it is in a format that is compatible with the model. This includes removing any inconsistencies or errors from the data and transforming the data into a format that the model can use. Normalization, feature scaling, and outlier removal are the data pre-processing procedures described in the following section.
II-C Data Pre-processing
Data pre-processing is an essential step in the process of predicting energy demand in a smart power grid. It ensures that the data used to train and evaluate the model is clean, consistent, and in a suitable format for the model. In this section, we will describe the steps and techniques used for data pre-processing in the proposed study.
The initial phase in data pre-processing is data cleansing. This includes eliminating any data inconsistencies, errors, or missing values. Common data cleansing techniques include removing duplicates, replacing absent values with imputed values, and converting data to a standard format.
The following phase is to transform the data into a format that the model can utilize. This includes the normalization, scaling, and encoding of categorical variables. Normalization is the process of adjusting the data so that the mean is 0 and the standard deviation is 1. Scaling the data can prevent the magnitude of the data from affecting the model. The entire process of data pre-processing is presented in Algorithm 1.
Data pre-processing is a critical step in the process of predicting energy demand in a smart power grid. It includes cleaning the data and transforming the data. These steps help ensure that the data used to train and evaluate the model is clean, consistent, and in a suitable format for the model.
II-D Model Development
This section describes the process of developing a forecasting model to predict energy demand in a smart power grid. The proposed method employs a deep learning-based model, in particular a long short-term memory (LSTM) network, which is a type of recurrent neural network (RNN) designed to manage sequential data with temporal dependencies. LSTM is a form of recurrent neural network (RNN) architecture that is frequently used in deep learning applications for sequence modelling, including natural language processing, speech recognition, and time series forecasting.
In time series forecasting, LSTM is particularly useful for capturing difficult-to-model long-term dependencies in the data. Predicting hourly energy demand is one possible application of LSTM in time series forecasting. In order to use LSTM to predict hourly energy demand, the model is trained on historical data in order to understand the patterns and relationships between the input features and the target variable, in this case, energy demand in megawatts. Based on the input features, the model can then be used to make predictions for future time steps.
LSTM is comprised of a set of nonlinear transformations that operate on the input and hidden states of the network, as well as gating mechanisms that regulate the passage of information through the network. The equations for a single LSTM cell are shown in equation (1).
| (1) |
Here, is the input at time step , is the hidden state of the previous time step, and are the weights and biases of the network, and and are the sigmoid and hyperbolic tangent activation functions, respectively. The equations involve several gates, including an input gate , a forget gate , and an output gate , which control the flow of information through the network. The cell state is updated based on the input and hidden states, and the hidden state is computed as a function of the cell state and the output gate.
The initial phase in model development is to collect and pre-process the data. As inputs to the model, we utilized historical energy demand data. The data was collected from the PJM data interface for the AEP zone and pre-processed to ensure it was in the correct format for the model. The pre-processing stages included data cleansing, handling missing values, and data normalization.
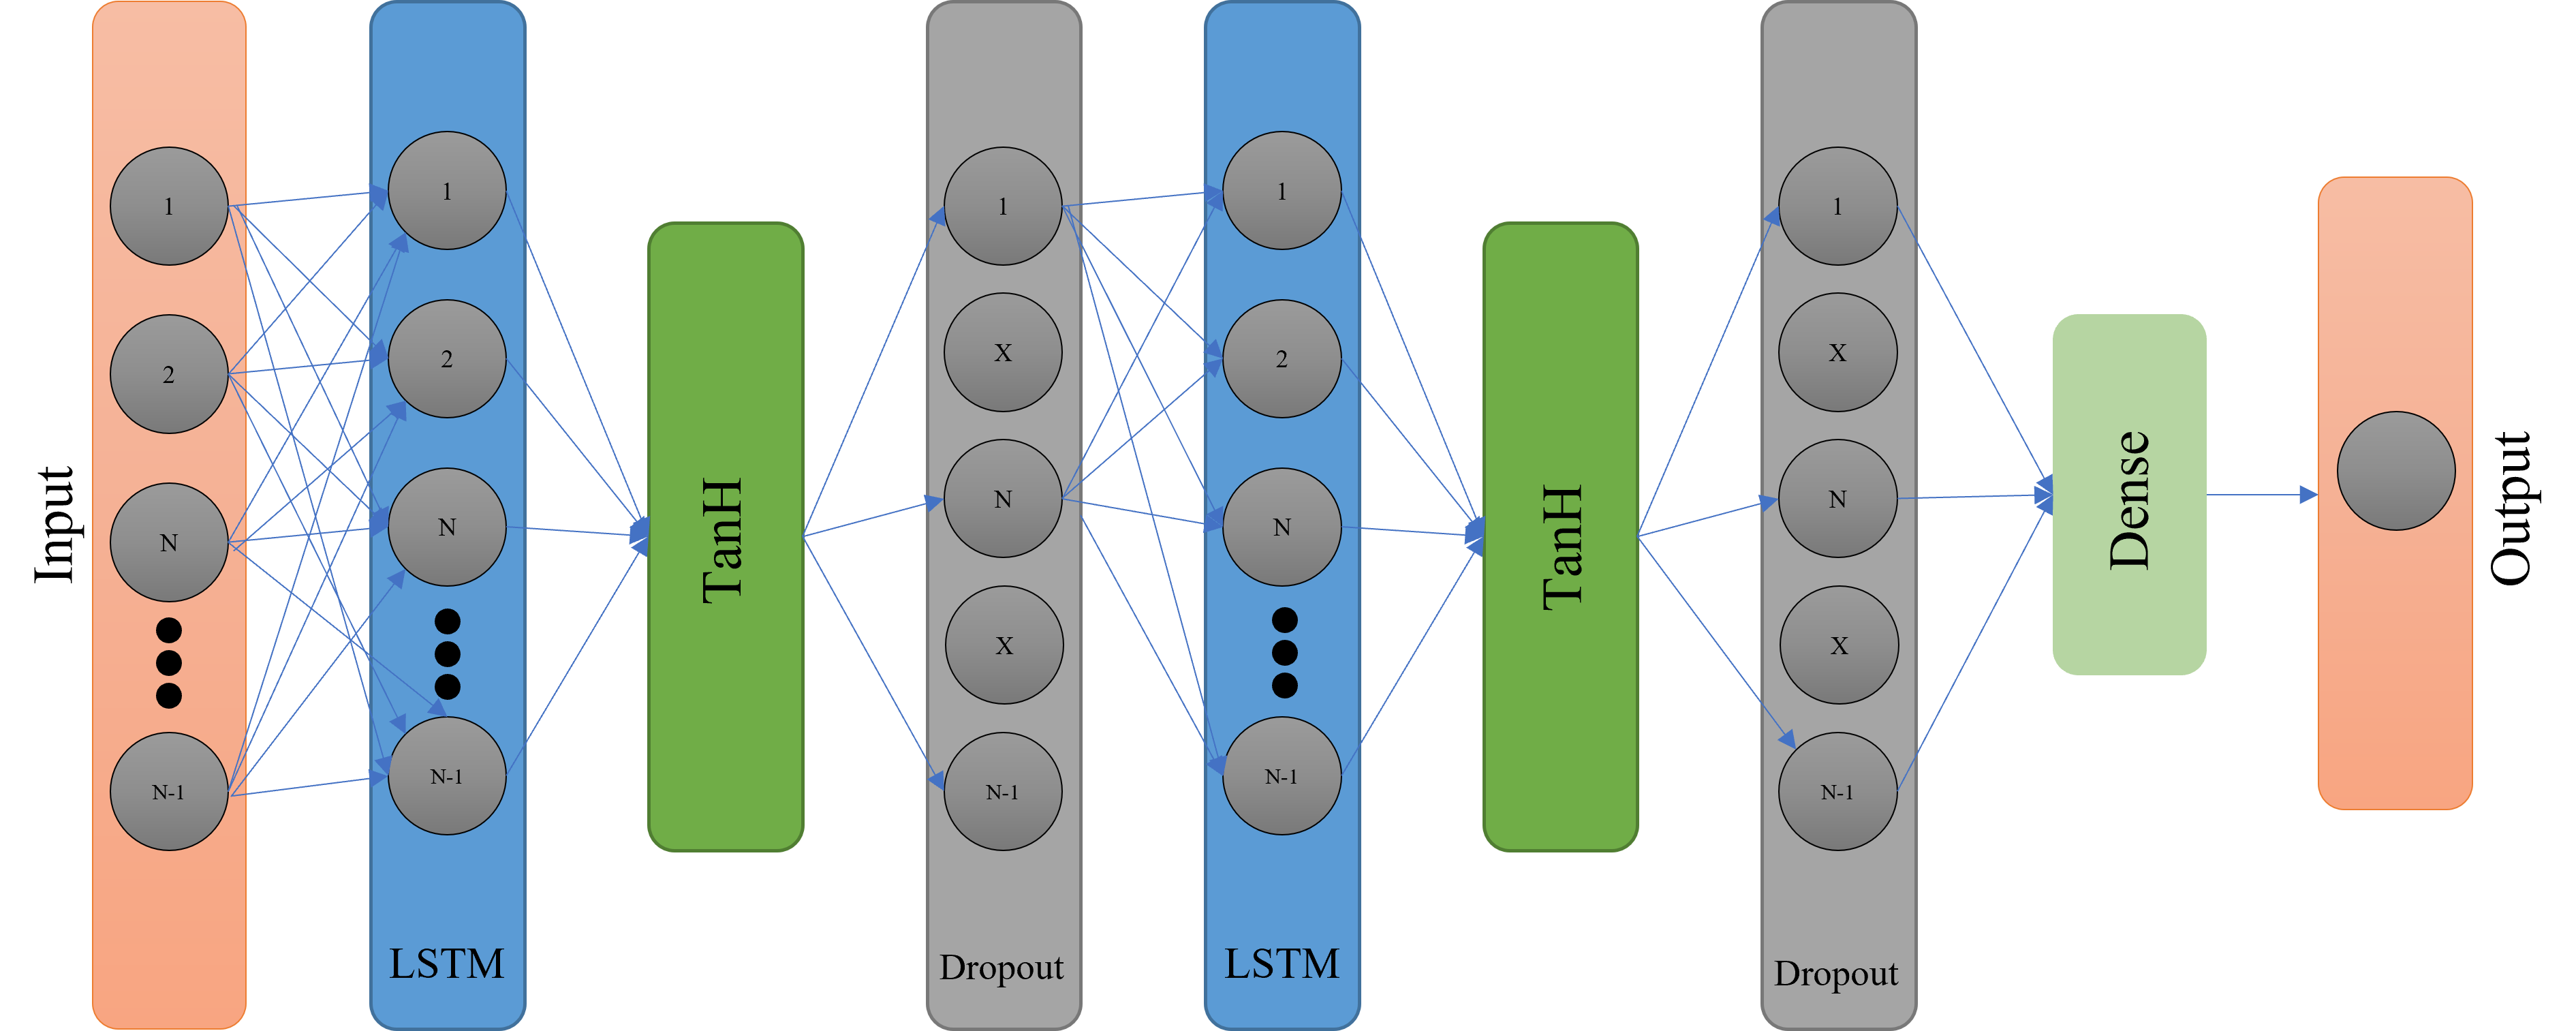
Next, the network structure of the LSTM model was defined. Input layers, multiple LSTM layers, dropout layers, and output layers comprise the LSTM model. The number of neurons in the input layer corresponds to the number of input features, which in this instance are the historical energy demand data. The LSTM layers are the basis of the model and are responsible for learning the temporal dependencies in the data. Multiple LSTM layers were layered on top of one another to improve the model’s ability to learn complex data patterns. A grid search cross-validation technique was used to ascertain the number of LSTM layers and the number of neurons in each layer. Grid search cross-validation entails creating a grid of possible values for each hyperparameter and evaluating the model’s performance on each combination of hyperparameters using a cross-validation strategy. Then, the performance of the model is compared across all possible combinations, and the hyperparameters that yield the highest performance are chosen. This technique is computationally intensive, but it offers a systematic and trustworthy method for choosing optimal hyperparameters for deep learning models. A single neuron in the output layer represents the anticipated energy demand.
The LSTM model was implemented using the Keras [36] library in Python [37]. The model was trained using an Adam optimizer and mean squared error (MSE) as the loss function. The model was trained for a fixed number of epochs, and the training process was stopped when the model’s performance on a validation set stopped improving. Algorithm 2 presents the steps utilized in the forecasting model’s development. The architecture of the proposed model is shown in Fig. 4.
Here, timesteps is the number of time steps in the input data, features is the number of features in the input data, x is the number of units in the LSTM layer, y is the number of units in the fully connected layer, z is the number of epochs for training, and w is the batch size for training. X_train and y_train represent the training data, and X_test represents the test data. In the proposed model, the unit used in LSTM is 200, and the number of units used in the fully connected layer is 1. The training epoch of the model is 10, and batch_size is 1000.
The algorithm starts by initializing the model using the Sequential() function from the Keras library, and the LSTM, dropout, and fully connected layers are added using the add() function. The model is then compiled using the compile() function and trained using the fit() function. Finally, predictions are made on the test data using the predict() function.
The trained model was then evaluated using performance metrics such as MAE, RMSE, and coefficient of determination () on a test set. These metrics were used to evaluate the model’s ability to accurately predict energy demand. The model was then deployed and used to predict energy demand.
II-E Model Evaluation Metrics
This section describes the process and metrics of evaluating the performance of the proposed LSTM model for predicting energy demand in a smart power grid. The model was trained using historical energy demand data and evaluated using three performance metrics: mean absolute error (MAE), coefficient of determination (), and root mean squared error (RMSE).
The MAE is a measure of the difference between the predicted energy demand and the actual energy demand. It is calculated as the average absolute difference between the predicted and actual values. Mathematically, it is defined as equation (2):
| (2) |
where is the number of test samples, is the actual energy demand, and is the predicted energy demand. The smaller the MAE, the better the model’s performance.
In a linear regression model, the coefficient of determination () represents the proportion of the variance in the dependent variable that is explained by the independent variables. R-squared values range from 0 to 1, with greater values indicating a superior model fit to the data. A higher R-squared value indicates a better fit and a stronger relationship between the independent and dependent variables when used to evaluate the current model. Mathematically, it is defined as equation (3):
| (3) |
where is the actual value of the dependent variable, is the predicted value of the dependent variable, and is the mean of the dependent variable.
Another evaluation metric used in this study is root mean squared error (RMSE). It measures the average magnitude of the error in the predictions of a model. RMSE calculates the difference between the actual values and the predicted values of a dataset and then takes the square root of the average of those differences. A lower RMSE value indicates that the model has a better fit with the actual values and has higher accuracy in making predictions. Mathematically, it is defined as equation (4):
| (4) |
Here, is the actual value, is the predicted value, and is the number of observations.
II-F Model Deployment
Deploying the proposed LSTM model for predicting energy demand in a smart power grid in a secure way requires the use of appropriate tools and techniques. This section describes the technique of deploying the model in a secure manner.
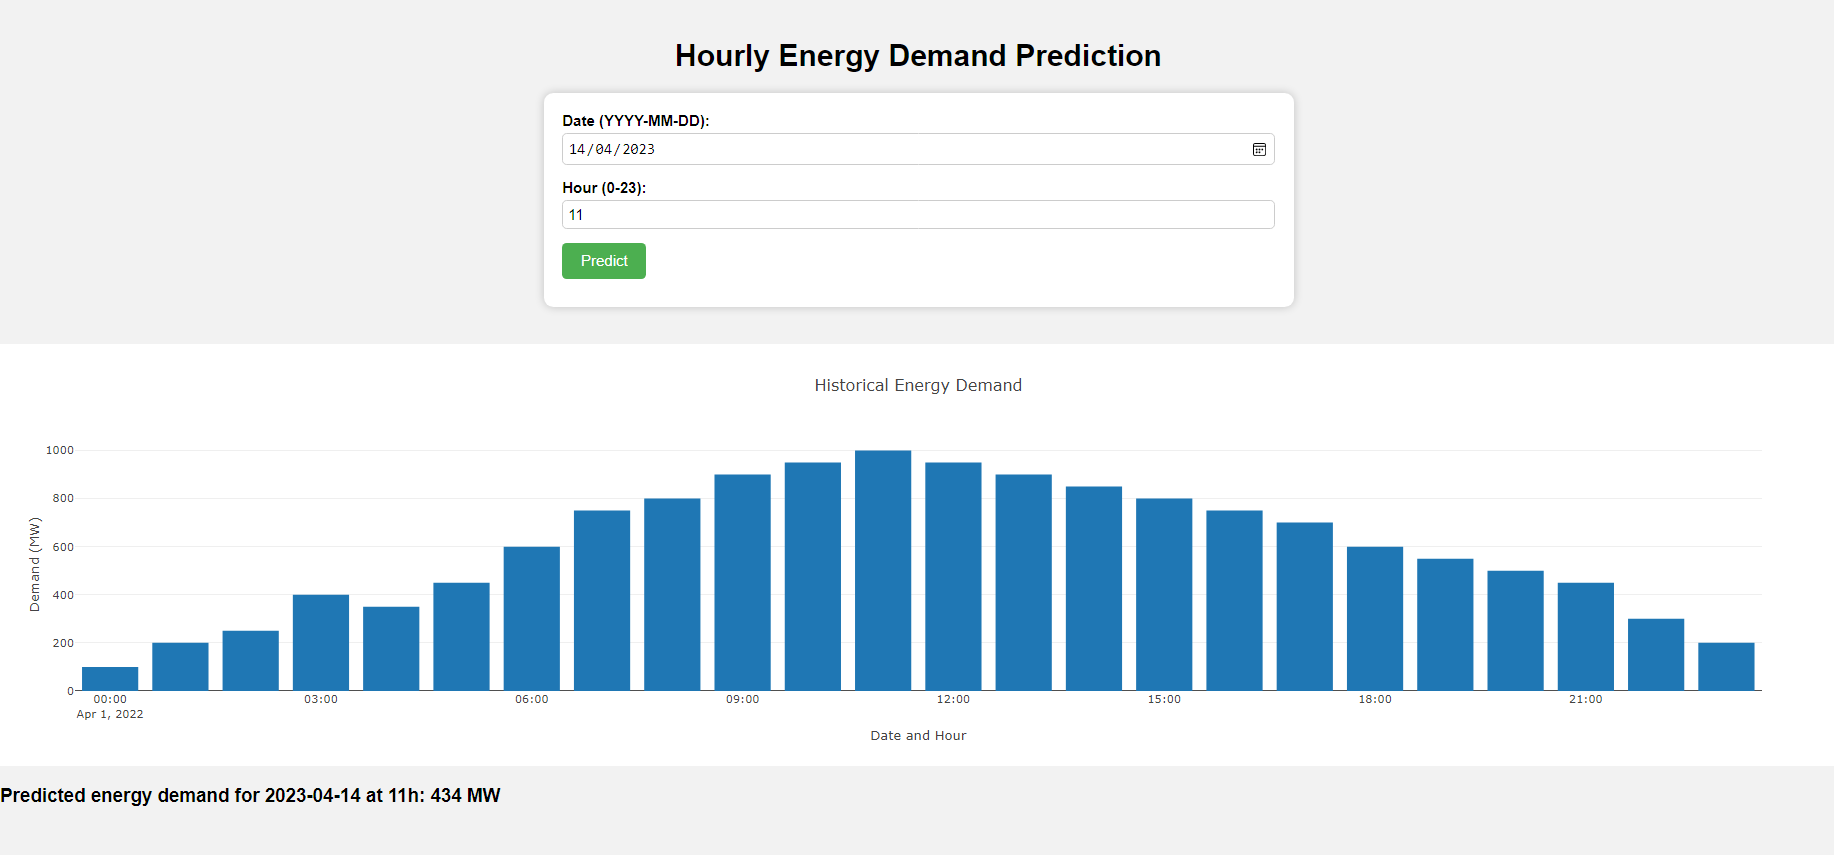
First, TensorFlow [38] is used to serve the model. TensorFlow provides a number of security features that can be used to protect the model during deployment. For example, TensorFlow provides the ability to encrypt model data and communication between the model and other systems. TensorFlow also provides the ability to authenticate users and devices that access the model. Then, Apache Kafka [39] is used to deploy the model in a secure way. Apache Kafka is a message queuing system that handles high-throughput data streams. It is used to send real-time energy demand data to the model and also receives predictions from the model. Apache Kafka provides built-in security features such as encryption and authentication, which are used to protect the data during transmission. In order to secure the communication between the model and other systems, SSL [40] is used in the proposed model. The use of SSL ensures that all data transmitted between the systems is encrypted and that only authorized systems can access the model. Fig. 5 shows the architecture of the model deployment phase for the proposed system. The figure shows that Kafka handles the application, user query, communication between the model server, and prediction output. Users place the prediction requests in the Kafka application, and then the Kafka application forwards the requests to the Tensorflow model server. Then the model server returns the predicted result and handles the response to the Kafka application, which is then served to the users. All the communication between the Kafka application and the Tensorflow model server is encrypted with the SSL service. The prototype front end of the application is shown in Fig. 6. This figure shows the interface for taking input and giving prediction output obtained from the Tensorflow model server.
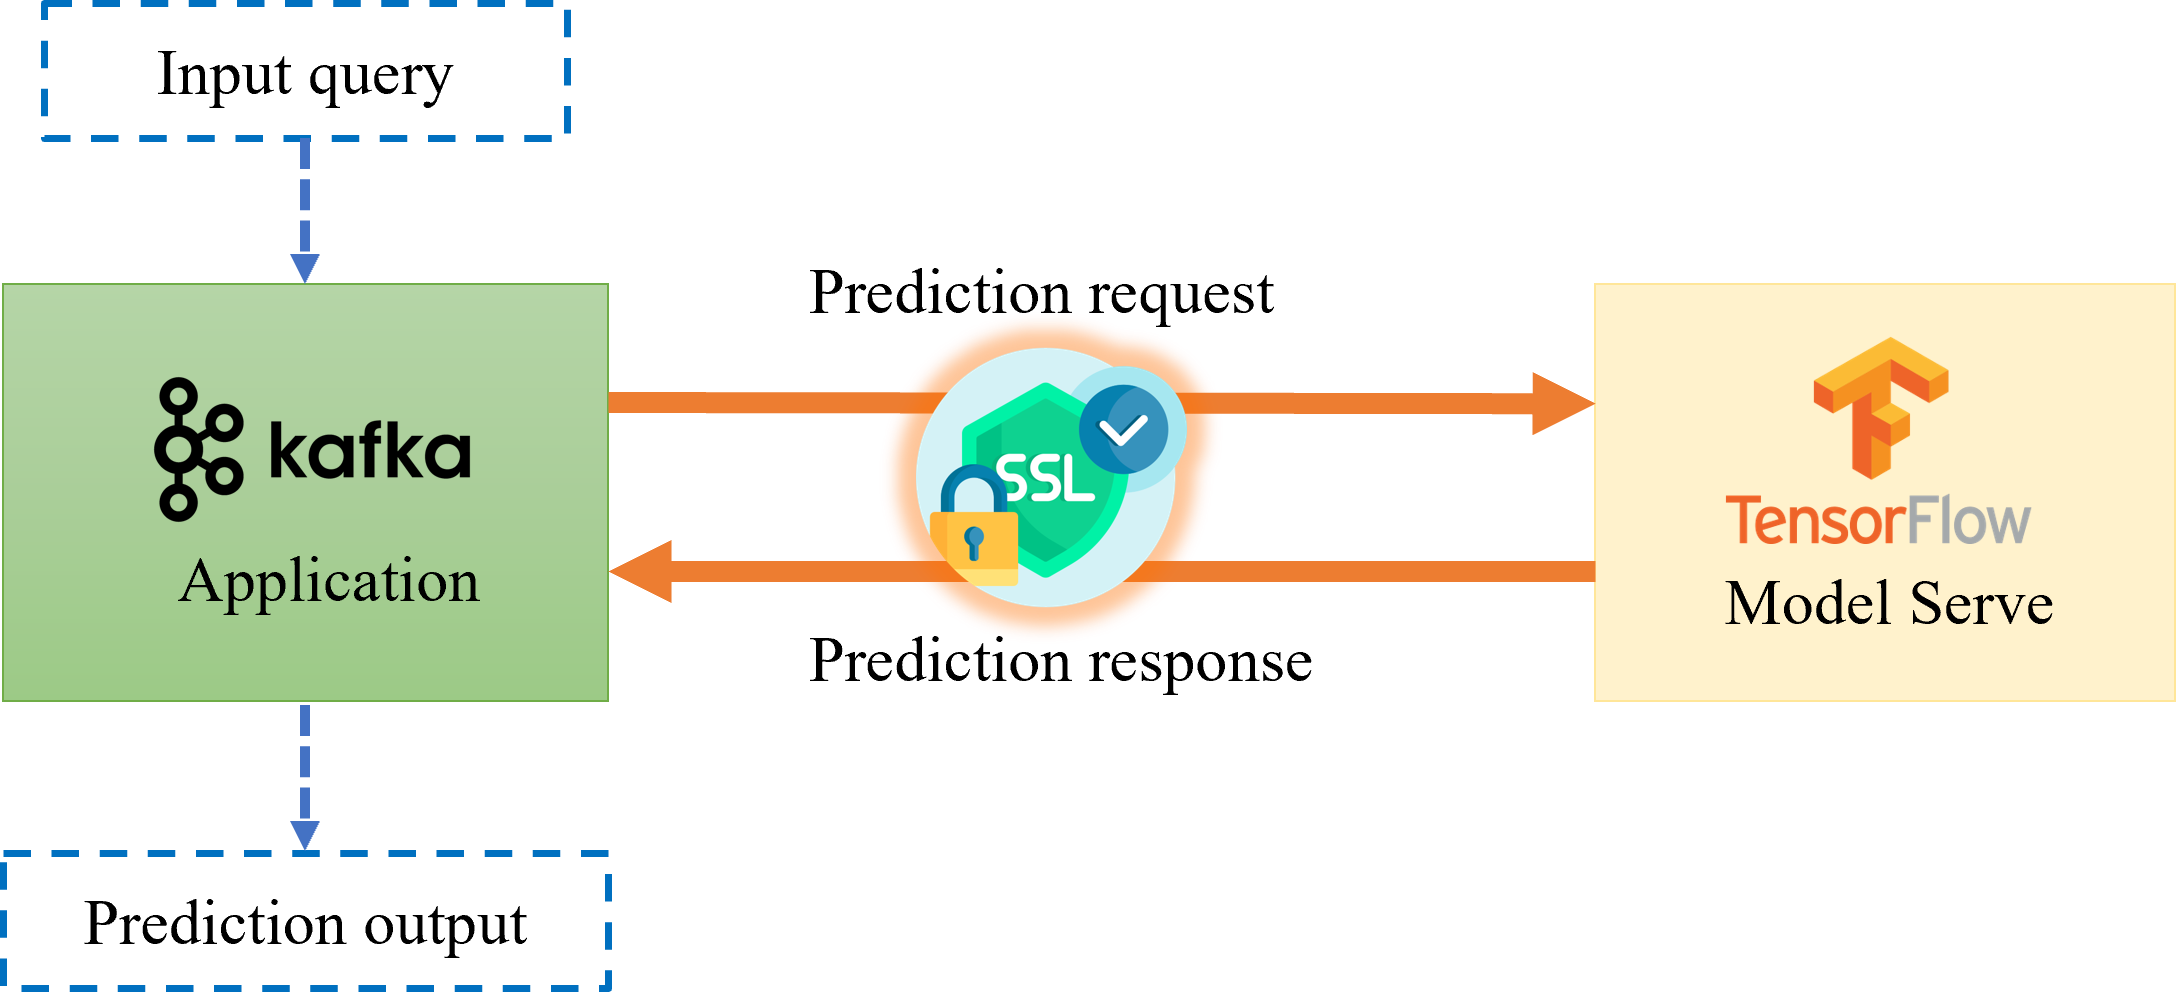
In a nutshell, deploying the proposed LSTM model for predicting energy demand in a smart power grid in a secure way requires the use of appropriate tools and techniques such as TensorFlow and Apache Kafka. TensorFlow provides built-in security features such as encryption and authentication while serving the model, and Apache Kafka provides built-in security features such as encryption and authentication for data transmission on the application side. Secure communication protocols, such as SSL, are also used to encrypt the data transmitted between systems.
II-G Experimental Setup
We implemented our proposed approach using Python version 3.6.5 as the primary programming language. The experiments were conducted on a personal computer equipped with a Ryzen 7 processor, 24GB RAM, and a GTX 1650 GPU. The computer was running Windows 10 as the operating system. We used Jupyter as our integrated development environment (IDE) to develop and test the model.
To implement and train our model, we utilized TensorFlow and Keras, two popular deep-learning frameworks widely used in the research community. TensorFlow provided us with the necessary tools to develop our deep learning model, and Keras allowed us to easily create, compile, and train the model.
We used Apache Kafka, an open-source distributed event streaming platform, to facilitate the data streaming process. This helped us handle high volumes of data and ensure efficient data processing. For model deployment purposes, we used ModelServe, a high-performance model serving solution that allowed us to quickly and easily deploy our trained model to production environments.
III Results and Discussion
The proposed deep learning-based approach for predicting energy demand was evaluated using four datasets of historical energy demand data from different energy companies. The datasets consisted of hourly energy demand data for a certain period of time. The data was divided into a training set, which consisted of 80% of the data, and a test set, which consisted of 20% of the data for all the datasets. The datasets were also trained and tested with three other state-of-the-art machine learning models, namely support vector regression (SVR) [41, 30], random forest regression (RFR) [42], and Facebook Prophet [43]. The performances of these models are also compared with that of the proposed REDf model.
The deep learning model, REDf was trained using the long short-term memory (LSTM) network architecture with 200 units. The model was trained using the Adam optimization algorithm with a learning rate of 0.001. The training process took approximately 25 minutes on the experimental machine.
The performance of the model was evaluated using three metrics: mean absolute error (MAE), root mean squared error (RMSE), and coefficient of determination (). The MAE is a measure of how close the predicted values are to the true values, while the is a measure of how well the model fits the data, and the RMSE measures the average magnitude of the error in the predictions of a model. The experimental results are shown in Table II.
| Model-Dataset | MAE | RMSE | |
|---|---|---|---|
| REDf-AEP | 0.983528 | 0.015727 | 0.024934 |
| REDf-COMED | 0.979773 | 0.014244 | 0.022124 |
| REDf-DAYTON | 0.980513 | 0.015475 | 0.023882 |
| REDf-PJME | 0.985893 | 0.014589 | 0.020731 |
| SVR-AEP | 0.98211 | 159.269 | 346.6035 |
| SVR-COMED | 0.958165 | 149.0452 | 471.2771 |
| SVR-DAYTON | 0.976002 | 11.06447 | 24.87383 |
| SVR-PJME | 0.726128 | 1878.685 | 3382.786 |
| Prophet-AEP | 0.052402 | 2018.417 | 2522.092 |
| Prophet-COMED | -0.02157 | 1782.898 | 2321.032 |
| Prophet-DAYTON | -9.93916 | 0.602689 | 0.632263 |
| Prophet-PJME | -3.29872 | 0.359557 | 0.407602 |
| RFR-AEP | 0.133212716 | 1926.91703 | 2412.619163 |
| RFR-COMED | 0.170067298 | 1613.67172 | 2099.070115 |
| RFR-DAYTON | 0.06511635 | 300.3368395 | 380.3775072 |
| RFR-PJME | 0.04711097 | 4890.830657 | 6309.890678 |
Based on the results presented in Table II, it is evident that the proposed REDf model achieved high accuracy in the predictions, with MAE ranging from 1.4% to 1.5% across all evaluated datasets, ranging from 97.9% to 98.5% for different datasets, and RMSE of approximately 0.02 across all evaluation datasets. In contrast, the state-of-the-art Support Vector Regression (SVR) model exhibited a good fit for the data, but its performance was inconsistent across all datasets. Despite achieving a good fit for the data, the SVR model’s predicted values were not close to the actual data, as evidenced by the high MAE scores. Additionally, Facebook’s Prophet, another state-of-the-art forecasting model, demonstrated poor performance for all datasets in all evaluation metrics. This model achieved a positive value only for the AEP dataset, while obtaining negative values for other datasets, indicating poor fit and poor predictive capability. The model also exhibited very high scores for MAE and RMSE, signifying poor accuracy in predicting outcomes and significant average error. A similar trend in the Random Forest Regression (RFR) model is observed as the score ranges from 4% to 17% among different datasets. The high MAE and RMSE scores produced by the RFR model indicate poor data fitting characteristics and a limited prediction capability. Overall, the proposed REDf model exhibited a well-balanced performance in terms of good fit and prediction capability. The experimental results can be further corroborated with visual representations of the actual versus predicted data plots of the models. Fig. 7, Fig. 8, Fig. 9, and Fig. 10 show the actual versus predicted data plots for AEP, COMED, DAYTON, and PJME datasets respectively.
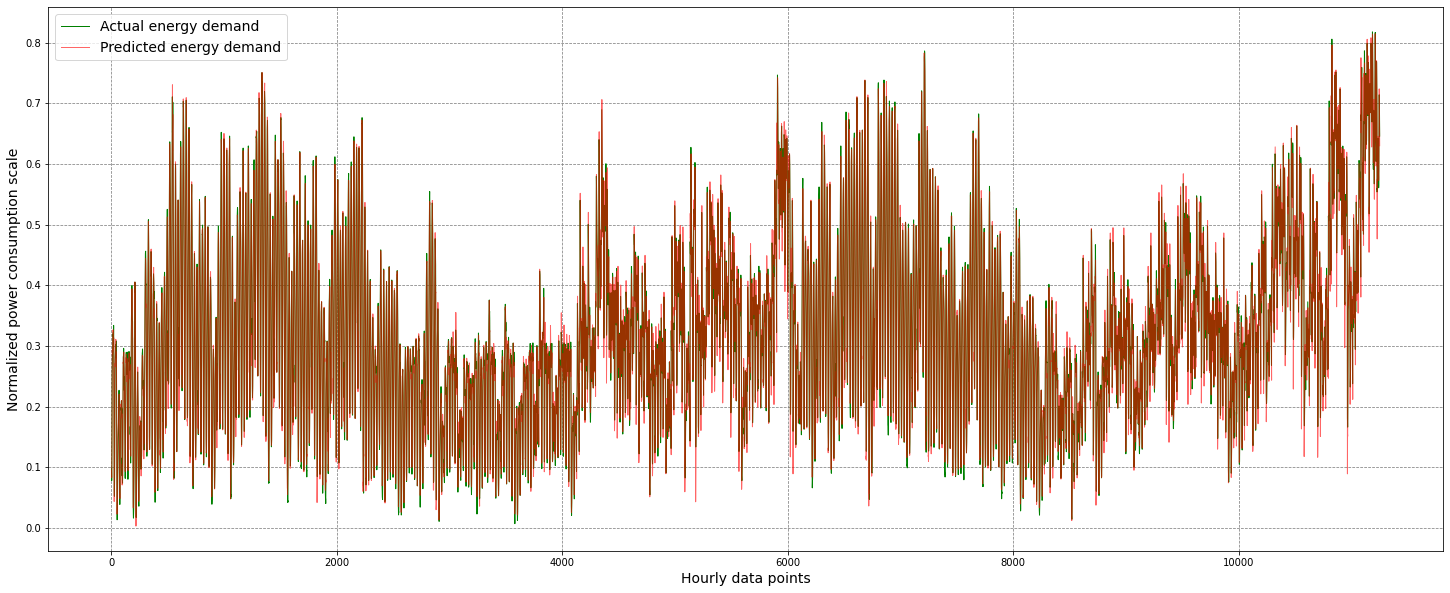
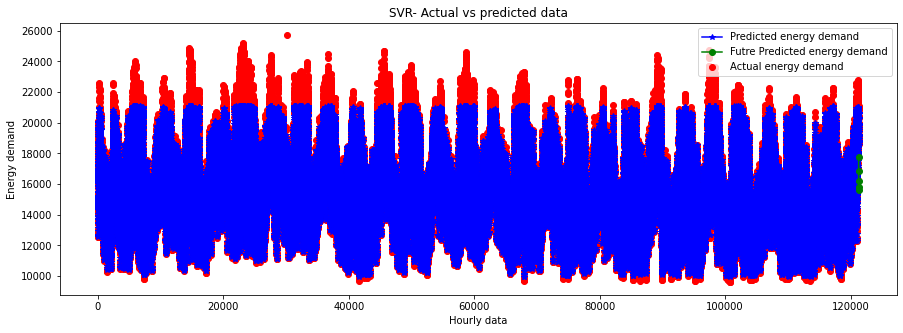
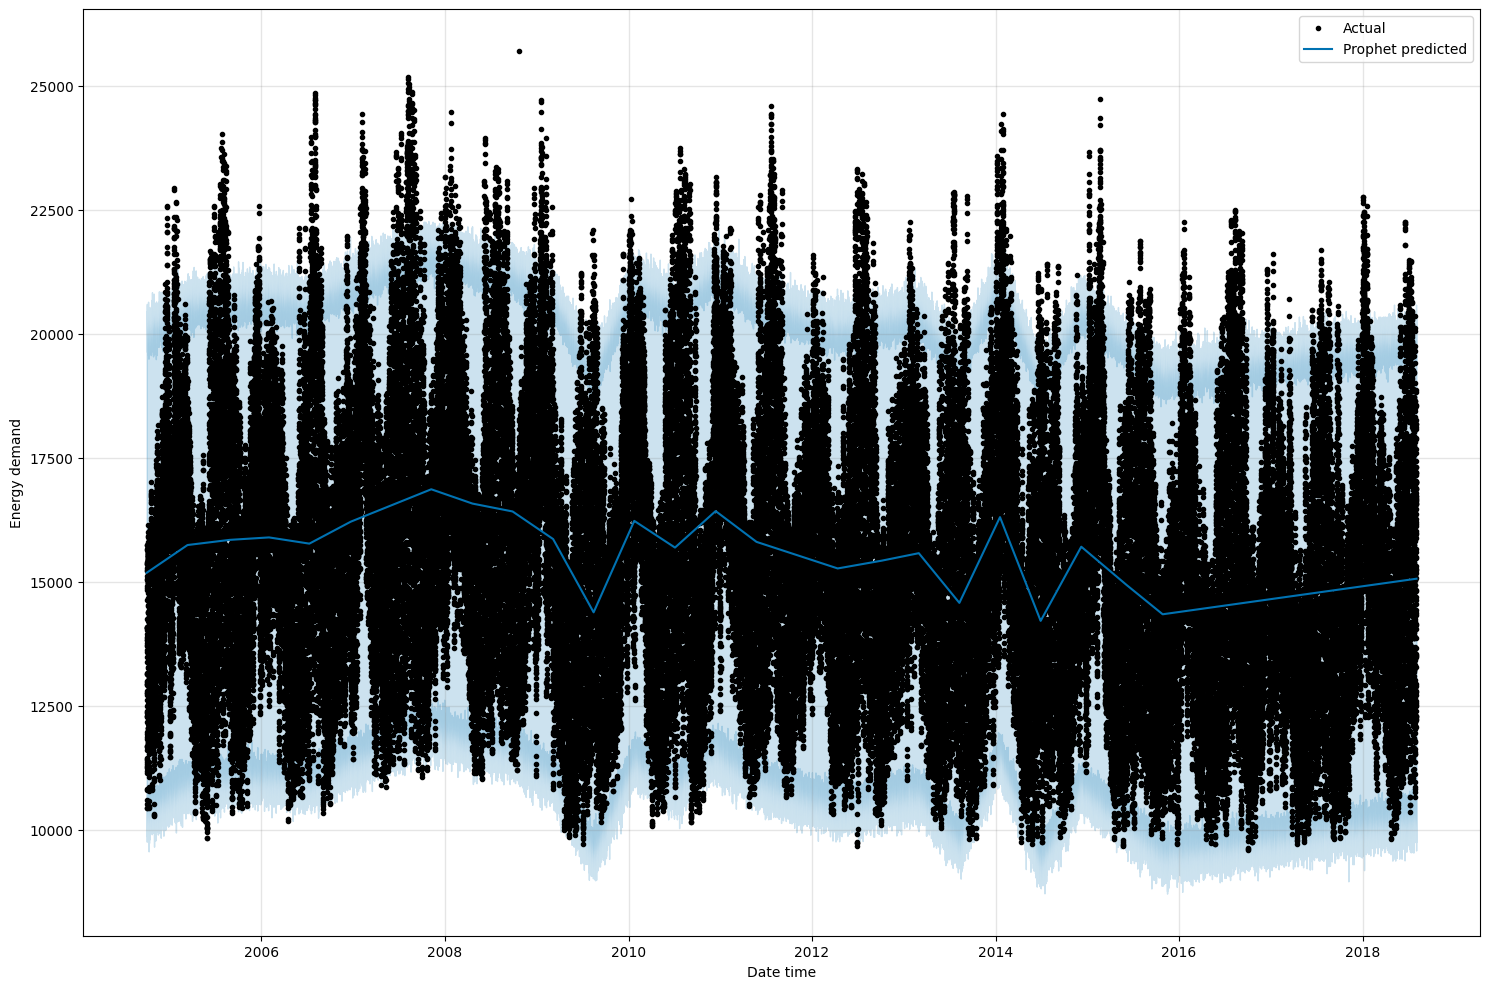
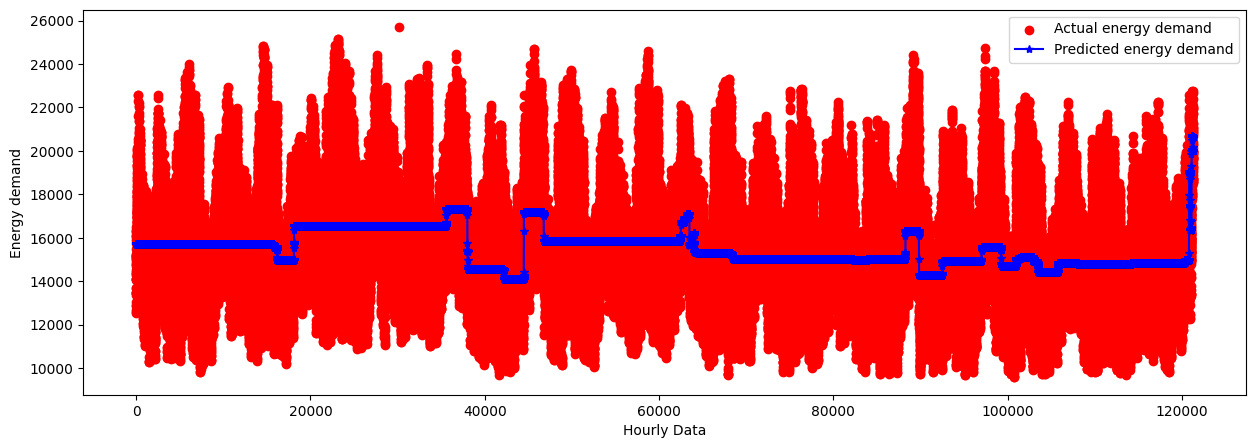
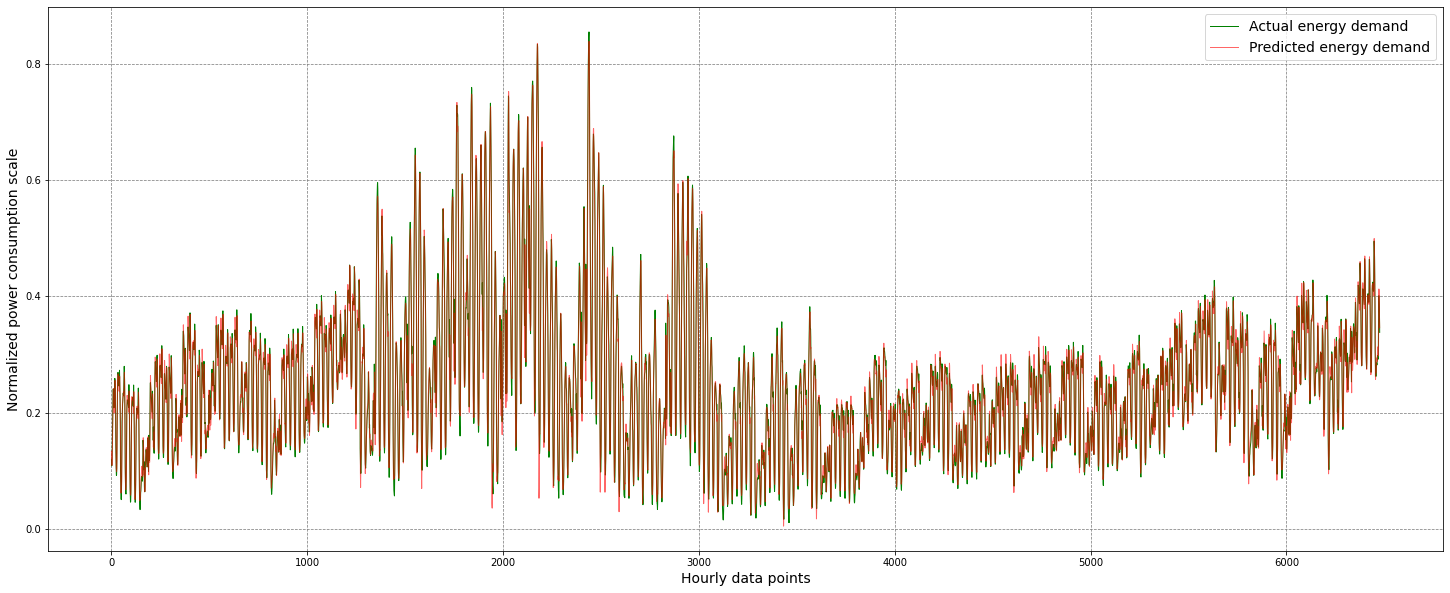
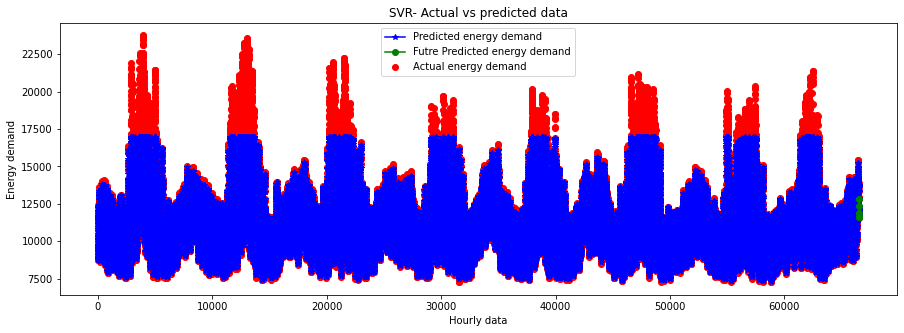
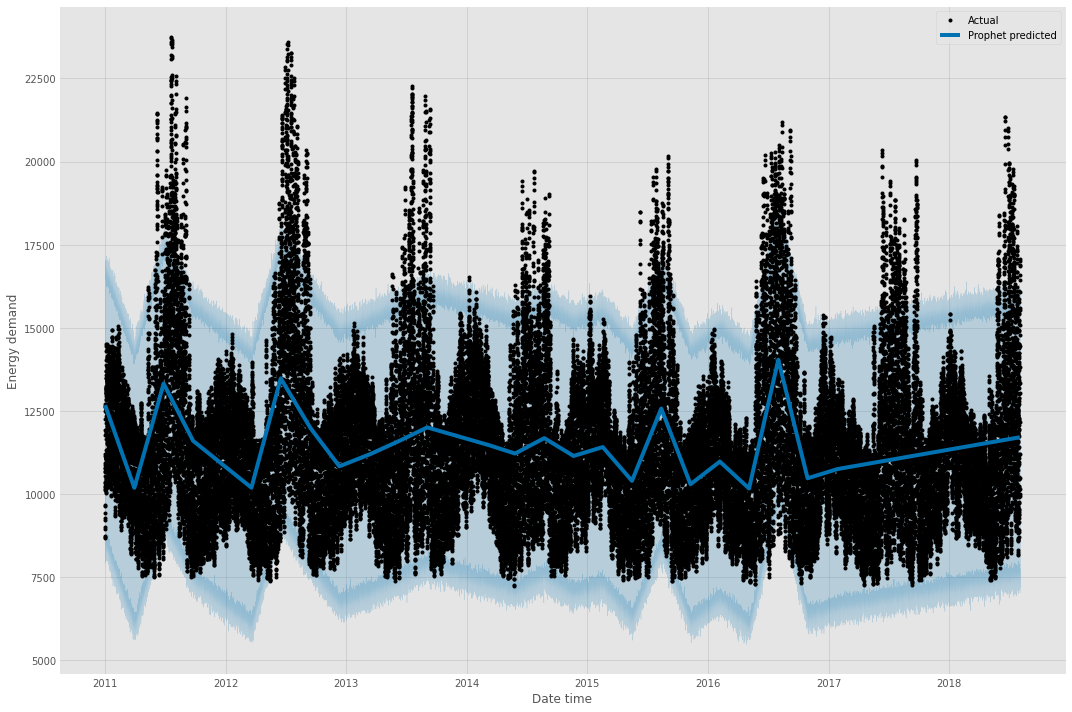
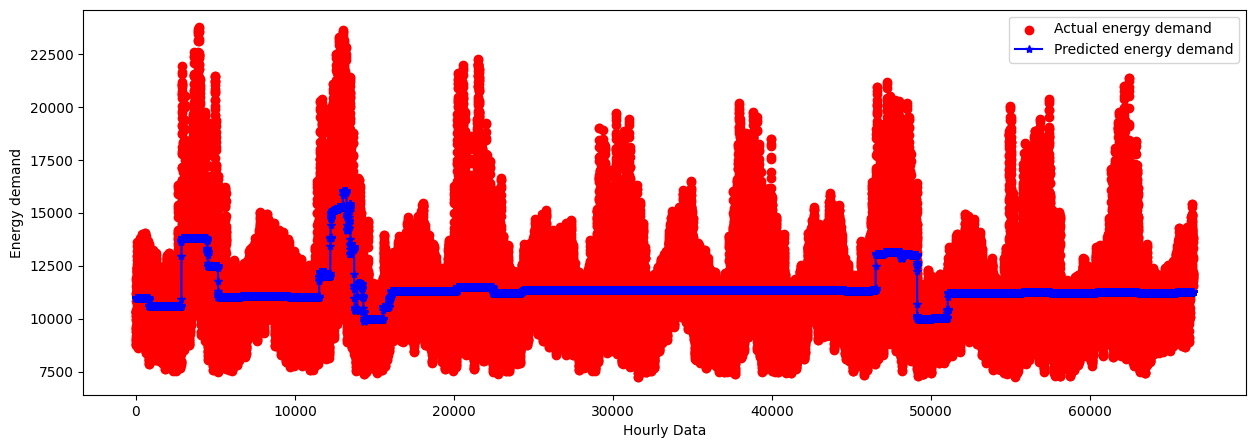
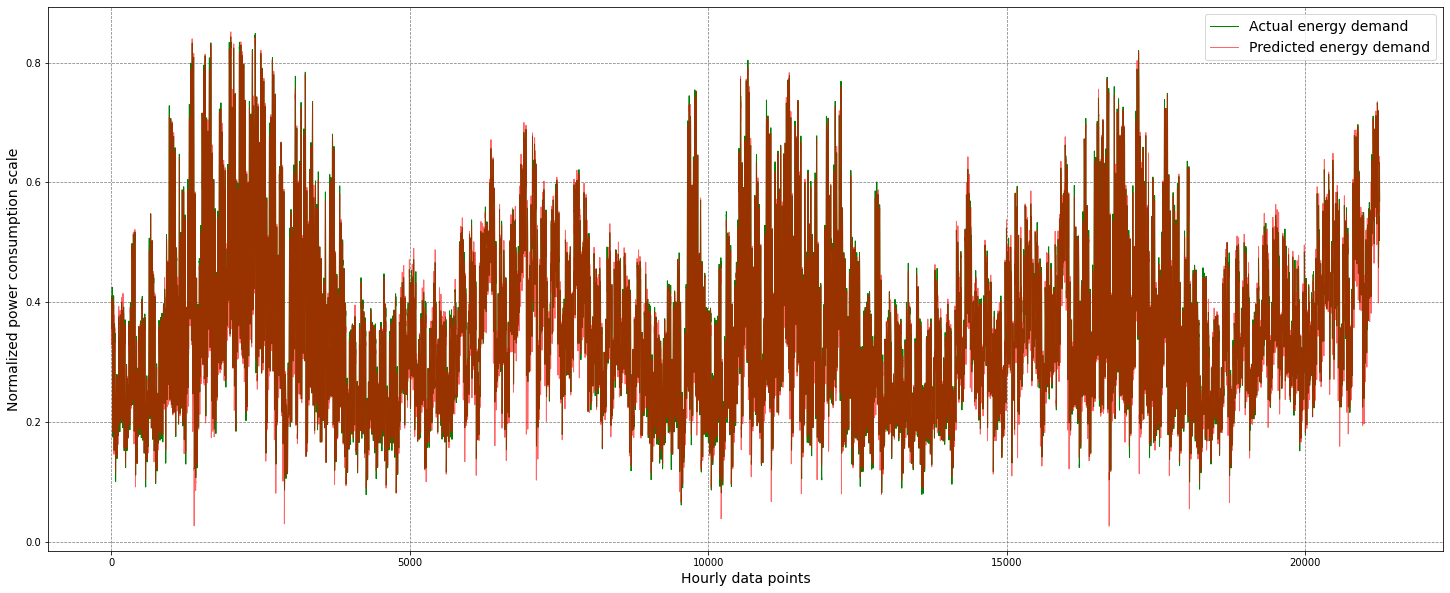
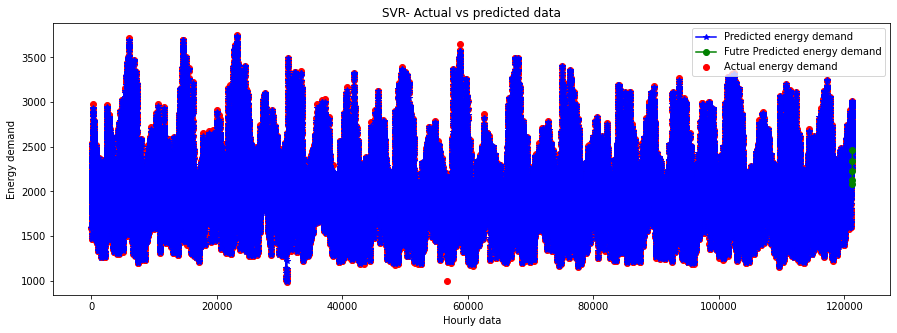
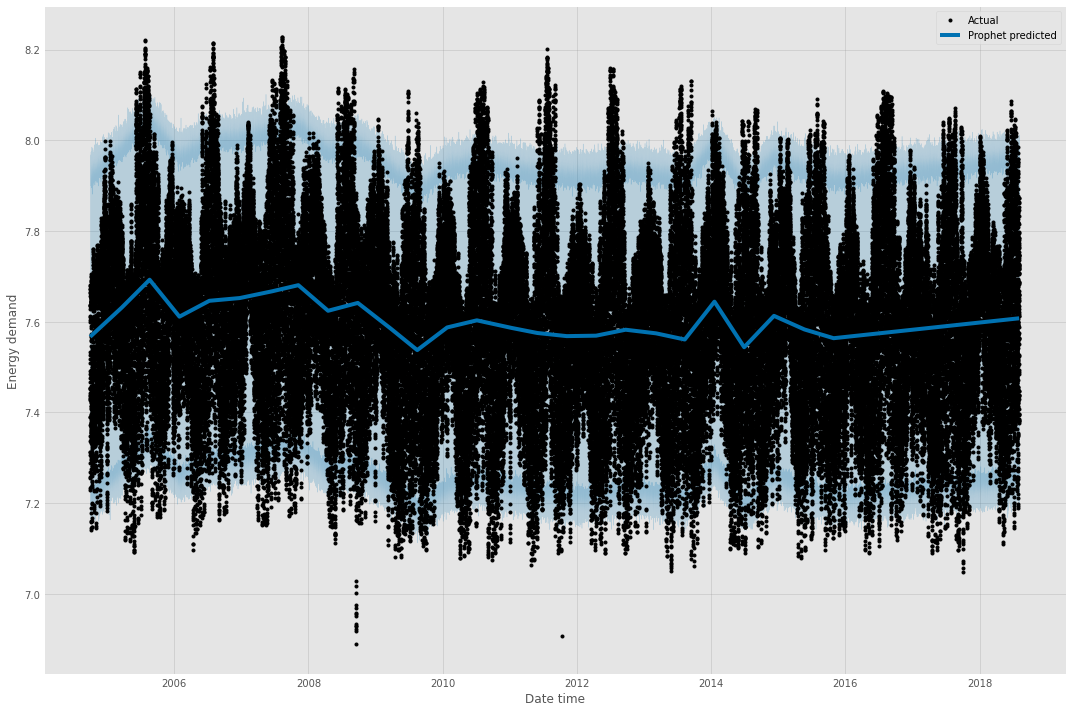
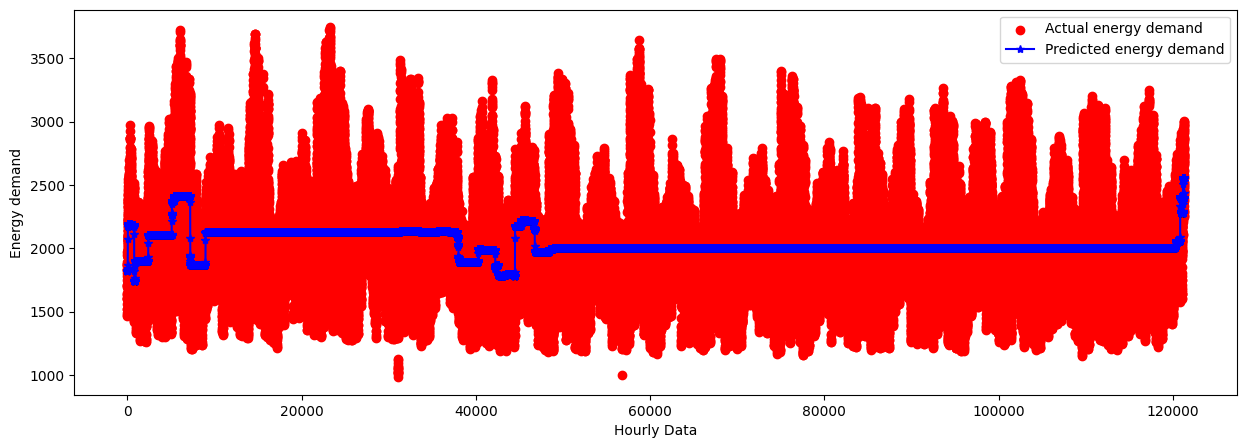
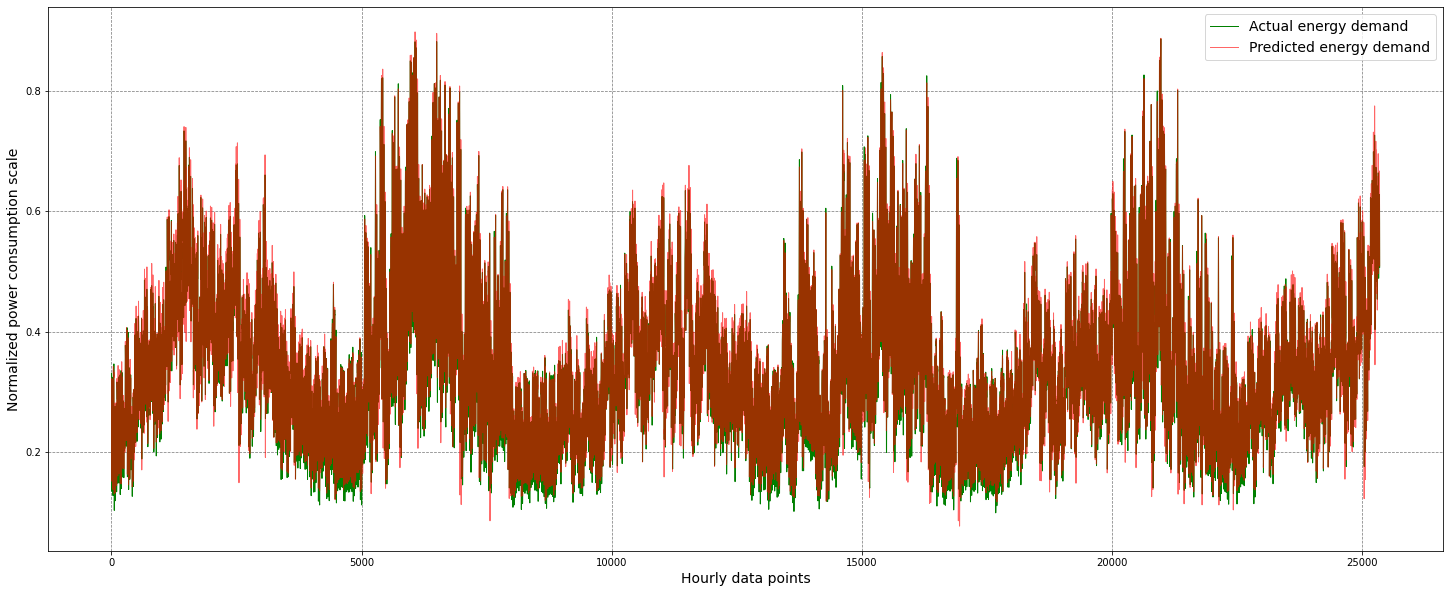
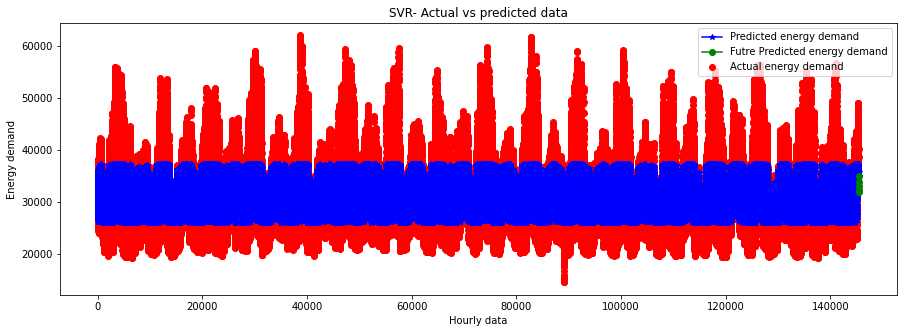
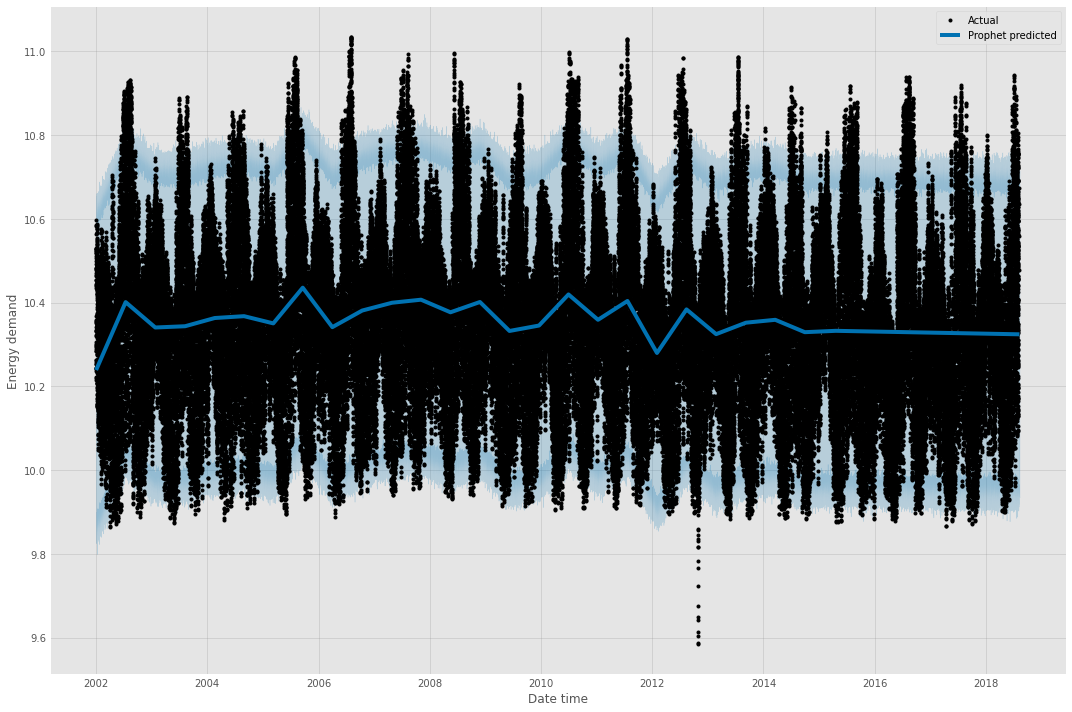
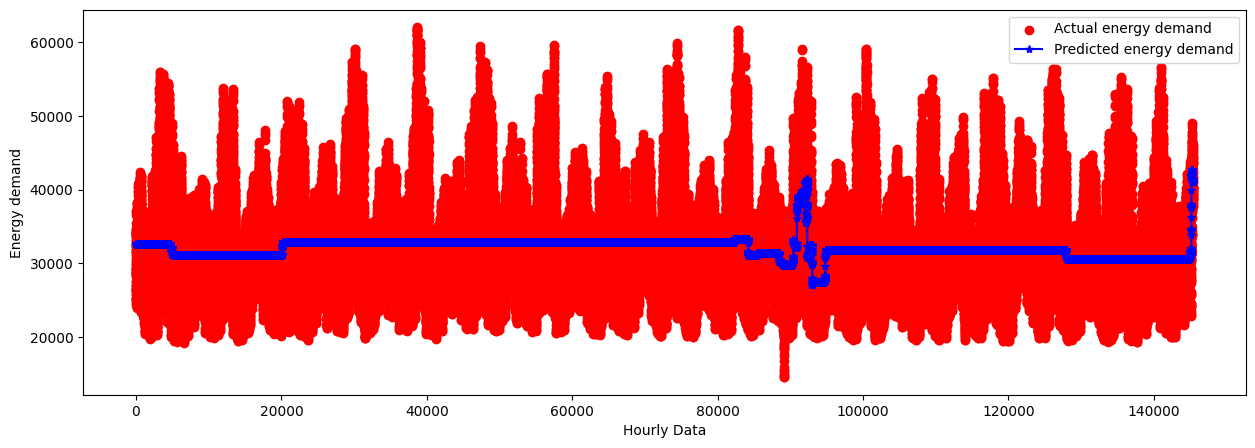
The plots depict hourly energy demand over time, with the x-axis representing the time frame and the y-axis representing energy demand. The green line depicts the actual energy demand, while the red line shows the predicted energy demand by the proposed REDf model. For the SVR and RFR models, the red dots indicate actual data points, and the blue dots represent predicted data points. For the Facebook Prophet model, the black dots represent actual data, and the blue line shows the predicted data by the model. Analysis of the plots indicates that the difference between the actual and predicted energy demand is minimal for the proposed REDf model across all datasets. Conversely, the difference between the actual and predicted energy demand is significantly high for the SVR, RFR, and Prophet models in almost all datasets, except for the SVR model in the Dayton dataset. The actual versus predicted plots for the proposed REDf model demonstrate that the predicted energy demand values are very close to the actual values, indicating a good fit for the data and accurate forecasting of energy demand data.
The proposed REDf model is highly accurate in forecasting energy demand based on the experimental results. The model’s predicted values align with the original energy demand values. This indicates that the model has a good fit for the data and can be relied upon for accurate predictions of energy demand.
It is important to note that the results are based on a specific dataset and architecture, and the performance of the proposed approach may vary depending on the type of data and the specific implementation details. However, the results demonstrate the potential of the proposed approach for predicting short-term energy demand in a smart power grid. The results achieved from the experiment can be compared to other recent works in predicting energy demand in smart power grids.
One of the most closely related studies is by Amalou et al. [16], who used a similar approach to deep learning with Long Short-Term Memory (LSTM) networks to predict energy demand. They achieved an MAE of 0.021, of 0.53, and an RMSE of 0.039 on their test set. Our proposed model achieved better performance in terms of MAE, and RMSE, compared to this study.
Another related study is by Alrasheedi et al. [17], who used a hybrid approach of CNN and GRU techniques to predict energy demand. They achieved an RMSE of 0.8168 and a of 0.973 on their test set. Our model achieved better performance in both RMSE and , compared to this study.
A recent study by Shachee et al. [22] proposed a hybrid deep learning-based model of LSTM and RNN that utilizes historical load data to predict energy demand. They achieved an RMSE of 0.6 on their test set. Our model achieved better performance in this evaluation metric compared to this study.
Taleb et al. [24] presented a hybrid model that combines standard neural networks with an automatic weight update process, achieving a mean absolute error (MAE) of 372.08 in energy demand prediction. Mubashar et al. [25] proposed a method for load forecasting using LSTM models and compared its performance with two commonly used techniques, ARIMA and exponential Smoothing. Their proposed method outperformed the other two, achieving an MAE of 2.44736176. Rosato et al. [26] presented a novel deep learning approach using Convolutional Neural Network and Long Short-Term Memory models, achieving the lowest RMSE of 2.252 for the baseline 1-day forecast. Nguyen et al. [27] proposed an electricity demand forecasting method based on the LSTM deep learning model, achieving an RMSE of 9.63. Pramono et al. [28] proposed a method for short-term load forecasting using a wavenet-based model that employs dilated causal residual CNN and LSTM layers, achieving RMSE and MAE equal to 203.23 and 142.23 for ENTSO-E dataset 1 and 292.07 and 196.95 for ENTSO-E dataset 2. The proposed methods have demonstrated their potential for supporting energy management and demand response programs in hybrid energy systems.
Various deep learning-based methods have been proposed to accurately forecast energy demand, including standard neural networks with an automatic weight update process, LSTM models, CNN and LSTM models, and wavenet-based models. These models have been shown to outperform traditional methods such as ARIMA and exponential smoothing, achieving lower MAE and RMSE values. However, our proposed model significantly outperforms all the existing models, achieving an exceptionally low MAE of 0.015 and RMSE of 0.02, demonstrating its potential to revolutionize the energy sector by providing more accurate energy demand forecasting.
The performance of the proposed model was compared with other recent studies in predicting energy demand in smart power grids. Table III shows the evaluation metrics of the proposed model and different studies. The table reveals that the proposed model outperforms the other models regarding MAE, and RMSE in all the evaluated datasets. The LSTM-RNN [22] model did not report the MAE and values mentioning only RMSE. The CNN-GRU [17] model achieved a high score but did not report the MAE and RMSE values. On the other hand, the LSTM and GRU models reported MAE and values, but their performance was inferior to the proposed model. Apart from these, most studies did not report values. The proposed model, REDf, has been evaluated on four datasets, and its performance is compared with other models proposed in recent years. The table shows that the proposed REDf model has outperformed all other models in terms of all three metrics: MAE, R-squared, and RMSE. The proposed model has achieved an MAE ranging from 0.014244 to 0.015727, an R-squared ranging from 0.979773 to 0.985893, and an RMSE ranging from 0.020731 to 0.024934. On the other hand, the best-performing models in the comparison have achieved an MAE of 372.08, an R-squared of 0.973, and an RMSE of 2.252. The results indicate that the proposed REDf model is significantly better than other models proposed in recent years and can be used for effective energy demand forecasting in smart power grids.
| Reference | Year | Model | MAE | RMSE | |
|---|---|---|---|---|---|
| [16] | 2022 | LSTM | 0.021 | 0.53 | 0.039 |
| [16] | 2022 | GRU | 0.022 | 0.64 | 0.034 |
| [17] | 2022 | CNN-GRU | - | 0.973 | 0.8168 |
| [22] | 2022 | LSTM-RNN | - | - | 0.6 |
| [24] | 2022 | CNN-LSTM-MLP | 372.08 | - | - |
| [25] | 2022 | LSTM | 2.44736176 | - | - |
| [26] | 2019 | CNN-LSTM | - | - | 2.252 |
| [27] | 2020 | LSTM | - | - | 9.63 |
| [28] | 2019 | CNN-LSTM-ENTSO-E | 142.23 | - | 203.23 |
| [28] | 2019 | CNN-LSTM-ISO-NE | 58.96 | - | 85.12 |
| - | - | Proposed REDf-AEP | 0.015727 | 0.983528 | 0.024934 |
| - | - | Proposed REDf-COMED | 0.014244 | 0.979773 | 0.022124 |
| - | - | Proposed REDf-DAYTON | 0.015475 | 0.980513 | 0.023882 |
| - | - | Proposed REDf-PJME | 0.014589 | 0.985893 | 0.020731 |
The proposed model for predicting the demand for energy in a smart grid can also assist in realizing substantial environmental advantages while advancing several sustainable development goals (SDGs).
First and foremost, this paradigm can help fulfil SDG 7: Access to Affordable and Clean Energy. Utility companies can better manage their renewable energy resources and lessen their dependency on fossil fuels by precisely anticipating the demand for renewable energy. This will result in a more ecologically friendly and sustainable energy system. This may facilitate the transition to a low-carbon economy, improve air quality, and cut greenhouse gas emissions. As a result, people’s access to and affordability of energy, particularly in low-income areas, may improve.
In addition, this demand model for renewable energy might help with SDG 9: Industry, Innovation, and Infrastructure. Utility companies and other stakeholders can build sustainable infrastructure and encourage innovation in the energy industry by offering accurate and trustworthy estimates of the demand for renewable energy. New technologies and business models may be created as a result, which might hasten the uptake of renewable energy sources and encourage their use in a sustainable and efficient manner.
Thirdly, a model like this can help achieve SDG 13: Climate Action. Predictive models for renewable energy demand can aid in the fight against climate change and its effects by encouraging renewable energy sources and lowering dependency on fossil fuels. To mitigate the effects of climate change, such as more frequent and severe weather events; this can involve lowering greenhouse gas emissions, enhancing air quality, and enhancing air quality.
Achieving various sustainable development objectives relating to access to affordable and clean energy, innovation and infrastructure, and climate action can be facilitated by developing precise forecast models for renewable energy demand in smart grids. Our proposed model, which uses deep learning, LSTM networks, and data pre-processing approaches, performed better than other recent research in this sector. This shows that our method can be an efficient way to estimate energy demand in smart power grids and might have significant economic and environmental benefits by encouraging the adoption of renewable energy sources and lowering dependency on fossil fuels. As a result, our work contributes significantly to the ongoing efforts to create sustainable energy systems that can support a more equitable future and less harmful to the environment.
III-A Environmental Benefits
Using machine learning methods like deep learning to predict energy consumption has the potential to significantly improve smart power grids. Power grid administrators may maximize the distribution and use of renewable energy sources, minimizing reliance on non-renewable sources and encouraging the integration of clean energy by accurately projecting energy demand. As a result, customers and the environment could benefit from decreased prices, increased efficiency, and better control over power networks. The generalization and prediction abilities of the suggested method have been shown to be strong. This strategy can support the international effort to combat climate change and achieve sustainable development by incorporating the principles of SDGs 7 (affordable and clean energy), 9 (industry, innovation, and infrastructure), and 13 (climate action).
III-B Challenges
Although the proposed method for predicting energy demand using deep learning has the potential to improve the integration of renewable energy sources and optimize the efficiency of power infrastructures, it is not without obstacles. The data availability and quality required for training deep learning models is a significant challenge. It is possible that historical energy demand data are unavailable or insufficient, which can compromise the accuracy of the model’s predictions. Another obstacle is the high computational requirements and lengthy nature of deep learning model training. This can be problematic when working with enormous datasets or multiple variables. In addition, the interpretability of the model can be problematic, as the inner workings of deep learning models can be challenging to comprehend, limiting their transparency and accountability. It is crucial to address these obstacles to successfully implement the proposed approach in smart power infrastructures.
The results of this work can be summed up as follows: (1) The suggested model outperformed other recent efforts in anticipating energy consumption in smart power grids in terms of performance. (2) For anticipating energy consumption in smart power grids, deep learning with LSTM networks and data pre-processing methods proved successful. (3) The suggested model has the ability to help achieve environmental benefits and sustainable development goals, as evidenced by its accuracy in anticipating energy consumption in smart power networks. (4) The suggested model can aid in the more effective use of renewable energy sources by better forecasting energy demand and lowering the requirement for environmentally hazardous non-renewable energy sources. (5) A more sustainable use of natural resources can be achieved by reducing energy waste and using energy more efficiently.
IV Conclusion
This paper proposes an LSTM-based deep learning model for forecasting energy demand in smart power grids. Four distinct datasets, including AEP, COMED, DAYTON, and PJME, were used to evaluate the proposed model, which employed data pre-processing techniques. The model obtained excellent results across all datasets, with a mean absolute error (MAE) of between 1.4% and 1.5%. Moreover, the model attained the highest score of all datasets evaluated, 98.5%. These results indicate that the proposed model accurately predicts energy demand in smart power grids.
The development of accurate energy demand prediction models is essential for attaining multiple sustainable development objectives relating to affordable and clean energy, innovation and infrastructure, and climate action. Predictive models for energy demand can help mitigate the adverse effects of climate change and promote a more sustainable and environmentally benign energy system by reducing reliance on fossil fuels and promoting the use of renewable energy sources. Our proposed model represents a significant contribution to ongoing efforts to develop sustainable energy systems that can support a more equitable and environmentally favourable future.
The proposed model performed exceptionally well in anticipating the short-term energy demand in smart power grids. Combining deep learning with LSTM networks and data pre-processing techniques proved to be an effective method for accurately predicting the demand for renewable energy. These results demonstrate the practical applicability of the proposed model, providing utilities and other stakeholders with a valuable tool to manage their renewable energy resources and promote more efficient and sustainable energy use.
How to increase the accuracy of predictions and how to incorporate other factors, such as weather conditions and renewable energy generation forecasts, can be the subject of additional study. In addition, it would be intriguing to investigate how this technique could be combined with other technologies, such as IoT and blockchain, to create a more robust and effective smart grid system.
Availability of data and materials
The data and codes are available at the following Github repository, htps://github.com/ping543f/ren-energy
References
- [1] M. I. Islam, M. H. Maruf, A. Al Mansur, R. H. Ashique, M. A. ul Haq, A. Shihavuddin, and M. S. Jadin, “Feasibility analysis of floating photovoltaic power plant in bangladesh: A case study in hatirjheel lake, dhaka,” Sustainable Energy Technologies and Assessments, vol. 55, p. 102994, 2023.
- [2] IRENA, “World energy transitions outlook 2022: 1.5° c pathway,” 2022.
- [3] I. R. E. Agency, “What are the latest trends in renewable energy?” https://www.irena.org/Data/View-data-by-topic/Capacity-and-Generation/Statistics-Time-Series, 2023, accessed on 2023-04-01.
- [4] A. Q. Al-Shetwi, “Sustainable development of renewable energy integrated power sector: Trends, environmental impacts, and recent challenges,” Science of The Total Environment, vol. 822, p. 153645, 2022. [Online]. Available: https://www.sciencedirect.com/science/article/pii/S0048969722007379
- [5] N. Jenkins, C. Long, and J. Wu, “An overview of the smart grid in great britain,” Engineering, vol. 1, no. 4, pp. 413–421, 2015. [Online]. Available: https://www.sciencedirect.com/science/article/pii/S2095809916300224
- [6] E. S. Ali, R. A. El-Sehiemy, A. A. Abou El-Ela, K. Mahmoud, M. Lehtonen, and M. M. F. Darwish, “An effective bi-stage method for renewable energy sources integration into unbalanced distribution systems considering uncertainty,” Processes, vol. 9, no. 3, 2021. [Online]. Available: https://www.mdpi.com/2227-9717/9/3/471
- [7] S. Maier and A. Gemenetzi, “Optimal renewable energy systems for industries in rural regions,” Energy, Sustainability and Society, vol. 4, pp. 1–12, 2014.
- [8] U. Nations, “Sustainable development goals: 7 affordable and clean energy,” https://www.un.org/sustainabledevelopment/energy/, 2015, accessed on 2023-04-01.
- [9] I. Ozer, S. B. Efe, and H. Ozbay, “A combined deep learning application for short term load forecasting,” Alexandria Engineering Journal, vol. 60, no. 4, pp. 3807–3818, Aug. 2021. [Online]. Available: https://linkinghub.elsevier.com/retrieve/pii/S111001682100137X
- [10] M. Faiq, K. Geok Tan, C. Pao Liew, F. Hossain, C.-P. Tso, L. Li Lim, A. Y. Khang Wong, and Z. Mohd Shah, “Prediction of energy consumption in campus buildings using long short-term memory,” Alexandria Engineering Journal, vol. 67, pp. 65–76, Mar. 2023. [Online]. Available: https://linkinghub.elsevier.com/retrieve/pii/S1110016822008006
- [11] U. Nations, “Sustainable development goals: 9 industries, innovation and infrastructure,” https://www.un.org/sustainabledevelopment/infrastructure-industrialization/, 2015, accessed on 2023-04-01.
- [12] U. Nations, “Sustainable development goals: 13 climate action,” https://www.un.org/sustainabledevelopment/climate-change/, 2015, accessed on 2023-04-01.
- [13] K. Yan, W. Li, Z. Ji, M. Qi, and Y. Du, “A hybrid lstm neural network for energy consumption forecasting of individual households,” IEEE Access, vol. 7, pp. 157 633–157 642, 2019.
- [14] S. S. Arnob, A. I. M. S. Arefin, A. Y. Saber, and K. A. Mamun, “Energy demand forecasting and optimizing electric systems for developing countries,” IEEE Access, vol. 11, pp. 39 751–39 775, 2023.
- [15] G. Hafeez, K. S. Alimgeer, Z. Wadud, I. Khan, M. Usman, A. B. Qazi, and F. A. Khan, “An innovative optimization strategy for efficient energy management with day-ahead demand response signal and energy consumption forecasting in smart grid using artificial neural network,” IEEE Access, vol. 8, pp. 84 415–84 433, 2020.
- [16] I. Amalou, N. Mouhni, and A. Abdali, “Multivariate time series prediction by rnn architectures for energy consumption forecasting,” Energy Reports, vol. 8, pp. 1084–1091, 2022, technologies and Materials for Renewable Energy, Environment and Sustainability. [Online]. Available: https://www.sciencedirect.com/science/article/pii/S2352484722013932
- [17] A. Alrasheedi and A. Almalaq, “Hybrid deep learning applied on saudi smart grids for short-term load forecasting,” Mathematics, vol. 10, no. 15, 2022. [Online]. Available: https://www.mdpi.com/2227-7390/10/15/2666
- [18] J. J. Hopfield, “Neural networks and physical systems with emergent collective computational abilities,” Proceedings of the national academy of sciences, vol. 79, no. 8, pp. 2554–2558, 1982.
- [19] S. Hochreiter and J. Schmidhuber, “Long short-term memory,” Neural computation, vol. 9, no. 8, pp. 1735–1780, 1997.
- [20] R. Dey and F. M. Salem, “Gate-variants of gated recurrent unit (gru) neural networks,” in 2017 IEEE 60th International Midwest Symposium on Circuits and Systems (MWSCAS), 2017, pp. 1597–1600.
- [21] Y. LeCun, L. Bottou, Y. Bengio, and P. Haffner, “Gradient-based learning applied to document recognition,” Proceedings of the IEEE, vol. 86, no. 11, pp. 2278–2324, 1998.
- [22] S. Shachee, H. Latha, and N. Hegde Veena, “Electrical energy consumption prediction using lstm-rnn,” in Evolutionary Computing and Mobile Sustainable Networks: Proceedings of ICECMSN 2021. Springer, 2022, pp. 365–384.
- [23] D. Dua and E. Karra Taniskidou, “Uci machine learning repository,” 2017. [Online]. Available: http://archive.ics.uci.edu/ml
- [24] I. Taleb, G. Guerard, F. Fauberteau, and N. Nguyen, “A flexible deep learning method for energy forecasting,” Energies, vol. 15, no. 11, p. 3926, 2022.
- [25] R. Mubashar, M. J. Awan, M. Ahsan, A. Yasin, and V. P. Singh, “Efficient residential load forecasting using deep learning approach,” International Journal of Computer Applications in Technology, vol. 68, no. 3, pp. 205–214, 2022.
- [26] A. Rosato, R. Araneo, A. Andreotti, and M. Panella, “2-d convolutional deep neural network for multivariate energy time series prediction,” in 2019 IEEE International Conference on Environment and Electrical Engineering and 2019 IEEE Industrial and Commercial Power Systems Europe (EEEIC / I&CPS Europe), 2019, pp. 1–4.
- [27] V.-B. Nguyen, M.-T. Duong, and M.-H. Le, “Electricity demand forecasting for smart grid based on deep learning approach,” in 2020 5th International Conference on Green Technology and Sustainable Development (GTSD). IEEE, 2020, pp. 353–357.
- [28] S. H. Pramono, M. Rohmatillah, E. Maulana, R. N. Hasanah, and F. Hario, “Deep learning-based short-term load forecasting for supporting demand response program in hybrid energy system,” Energies, vol. 12, no. 17, p. 3359, 2019.
- [29] H. Ismail Fawaz, G. Forestier, J. Weber, L. Idoumghar, and P.-A. Muller, “Deep learning for time series classification: a review,” Data Mining and Knowledge Discovery, vol. 33, no. 4, pp. 917–963, Jul. 2019. [Online]. Available: https://link.springer.com/10.1007/s10618-019-00619-1
- [30] M. J. Hossain, S. M. Abdullah, M. Barkatullah, M. S. U. Miah, T. B. Sarwar, and M. F. Monir, “Predicting the success of suicide terrorist attacks using different machine learning algorithms,” in 2022 25th International Conference on Computer and Information Technology (ICCIT), 2022, pp. 378–383.
- [31] aep, “American electric power,” 2023. [Online]. Available: https://www.aep.com/about
- [32] ComEd, “Powering Lives | ComEd - An Exelon Company,” 2023. [Online]. Available: https://www.comed.com/Pages/default.aspx
- [33] A. Ohio, “About AES Ohio | AES Ohio,” 2023. [Online]. Available: https://www.aes-ohio.com/about-aes-ohio
- [34] pjm, “PJM,” 2023. [Online]. Available: https://pjm.com/
- [35] V. H. Pereira, “Hourly_energy_consumption/data at master · panambY/Hourly_energy_consumption,” 2023. [Online]. Available: https://github.com/panambY/Hourly_Energy_Consumption
- [36] F. Chollet et al., “Keras,” https://github.com/fchollet/keras, 2015.
- [37] G. Van Rossum and F. L. Drake, Python 3 Reference Manual. Scotts Valley, CA: CreateSpace, 2009.
- [38] M. Abadi, P. Barham, J. Chen, Z. Chen, A. Davis, J. Dean, M. Devin, S. Ghemawat, G. Irving, M. Isard, M. Kudlur, J. Levenberg, R. Monga, S. Moore, D. G. Murray, C. Olah, M. Schuster, J. Shlens, B. Steiner, I. Sutskever, K. Talwar, P. Tucker, V. Vanhoucke, V. Vasudevan, F. Vi’egas, O. Vinyals, P. Warden, M. Wicke, Y. Yu, and X. Zheng, “TensorFlow: Large-scale machine learning on heterogeneous distributed systems,” https://www.tensorflow.org/, 2015.
- [39] A. S. Foundation, “Apache kafka,” https://kafka.apache.org/, 2021.
- [40] N. C. Corp., “Secure sockets layer (ssl) protocol version 3.0,” https://www.ietf.org/rfc/rfc6101.txt, 1996.
- [41] S. S. Islam, M. S. Haque, M. S. U. Miah, T. B. Sarwar, and R. Nugraha, “Application of machine learning algorithms to predict the thyroid disease risk: an experimental comparative study,” PeerJ Computer Science, vol. 8, p. e898, 2022.
- [42] M. Khan, N. Alam, M. Miah, M. Shahjalal, T. B. Sarwar, M. Rokon et al., “Predicting young imposter syndrome using ensemble learning,” Complexity, vol. 2022.
- [43] S. J. Taylor and B. Letham, “Forecasting at scale,” The American Statistician, vol. 72, no. 1, pp. 37–45, 2018.
![[Uncaptioned image]](/html/2304.03997/assets/saef.png) |
Md Saef Ullah Miah is an assistant professor in the Department of Computer Science, American International University-Bangladesh (AIUB). He is currently engaged in research and teaching activities and has practical experience in software development and project management. He earned his Master of Science and Bachelor of Science degrees from AIUB. In addition to his professional activities, he is passionate about working on various open-source projects. His main research interests are data and text mining, natural language processing, machine learning, material informatics, and Blockchain applications. |
![[Uncaptioned image]](/html/2304.03997/assets/jun.jpg) |
Junaida Sulaiman received Ph.D degree from Kyushu Institue of Technology in 2015. She is currently a Senior Lecturer at the Faculty of Computing, Universiti Malaysia Pahang. Her research interest include artificial intelligence and time series prediction. |
![[Uncaptioned image]](/html/2304.03997/assets/imam.png) |
Md. Imamul Islam is a postgraduate student pursuing an MSc in Sustainable Energy and Power Electronics at the Faculty of Electrical and Electronic Engineering Technology (FTKEE), Universiti Malaysia Pahang (UMP). He completed his bachelor’s degree in Electrical and Electronic Engineering (EEE) from the Green University of Bangladesh in 2020. Md. Imamul Islam is currently a lecturer in EEE (study leave) at the same university from which he graduated. His research interests lie in Renewable Energy (RE), Power Electronics, and Machine Learning. He has been a research assistant (RA) at the Center for Research on Renewable and Sustainable Energy Systems (ReSES) for two years. His research work has resulted in several high-quality journal and conference publications. Besides his academic activities, he is fully involved in voluntary and charitable work. He is an executive member of the governing body for 2022–23 of the Lighter Youth Foundation. |
![[Uncaptioned image]](/html/2304.03997/assets/prince.jpg) |
Md. Masuduzzaman is currently pursuing his PhD in IT convergence engineering from the Wireless and Emerging Network System Laboratory (WENS Lab) at Kumoh National Institute of Technology, Gumi, South Korea. He received his B.Sc. and M.Sc. degrees in Computer Science in 2013 and 2015, both from American International University-Bangladesh. His primary research interests include Blockchain, the Internet of Things (IoT), Unmanned Aerial Vehicles (UAV), Edge Computing, Deep Learning, Cryptography, and Network Security. |
![[Uncaptioned image]](/html/2304.03997/assets/ncg.jpg) |
NIMAY CHANDRA GIRI received his B.Tech. degree in ECE from B.P.U.T. Odisha in 2010, M.Tech. degree from C.U.T.M. Odisha. He is pursuing a PhD in Agrivoltaic Systems (AVS) from C.U.T.M. Odisha. He has 11.10 years of teaching, training, and skill experience. His research and skill areas include solar photovoltaic (SPV) applications, energy conversion, energy-food-water-climate nexus, and techno-socioeconomic development for society. He has qualified as a Master trainer and Assessor by NSDC, India. Internationally, he was selected for solar PV system design and development work by TechTree, Singapore, in 2021. He has 40+ publications in SCIE, Scopus, ESCI, and UGC-Care indexed Journals and Conferences. |
![[Uncaptioned image]](/html/2304.03997/assets/sid.jpg) |
Siddhartha Bhattacharyya [FRSA, FIET (UK), FIEI, FIETE, LFOSI, SMIEEE, SMACM, SMAAIA, SMIETI, LMCSI, LMISTE] is currently the Principal of Rajnagar Mahavidyalaya, Birbhum, India. In addition, he is also serving as a scientific advisor at Algebra University College, Zagreb, Croatia. Before this, he was a professor at Christ (deemed to be University), in Bangalore, India. He also served as the principal of the RCC Institute of Information Technology, Kolkata, India. He has served as a senior research scientist at the VSB Technical University of Ostrava, Czech Republic. He is the recipient of several coveted national and international awards. He received the Honorary Doctorate Award (D. Litt.) from The University of South America and the SEARCC International Digital Award ICT Educator of the Year in 2017. He was appointed as the ACM Distinguished Speaker for 2018-2020. He has been appointed the IEEE Computer Society Distinguished Visitor for 2021-2023. He is a co-author of 6 books and the co-editor of 94 books, and he has more than 400 research publications in international journals and conference proceedings to his credit. He is the founding president of the Asia-Pacific Artificial Intelligence Association (AAIA), Kolkata Branch. He is also the Chair of IEEE Computational Intelligence Society, Kolkata Chapter. His research interests include hybrid intelligence, pattern recognition, multimedia data processing, social networks, and quantum computing. |
![[Uncaptioned image]](/html/2304.03997/assets/favi.jpg) |
Segbedji Geraldo FAVI holds a Bachelor’s degree in Industrial Maintenance Engineering from the University Institute of Technology of Lokossa, University of Abomey-Calavi, Benin. He has a Master’s degree in Sustainable Rural Transformation engineering. He specialises in Water-energy-food nexus engineering, Energy audits, and mini-grid and off-grid system design. He worked on a multidisciplinary research project at the Centre for Rural Development (SLE), Humboldt University Berlin. His research focuses on renewable energy for agriculture and the productive use of energy. He is pursuing a PhD in climate change and energy with a focus on Agrivoltaic systsystemsS) the West African Doctoral School on Climate Change and Energy (DRP-CCE). |
![[Uncaptioned image]](/html/2304.03997/assets/mrsic.png) |
Leo Mrsic is a highly accomplished venture scientist with extensive experience in managing companies and teams of various sizes. He holds a diploma in the field of insurance, a Master of Science in Business Economics, and a doctorate in the field of statistical modelling from the University of Zagreb. Additionally, he is a permanent court expert in finance, accounting, and computer science, with over 100 expert assessments completed. Mr. Mrsic holds the scientific title of Associate Professor/Senior Research Associate and the teaching title of University College Professor with Tenure. He serves as the Vice-Dean for Research and Development at Algebra College, Head of the Algebra LAB Research and Innovation Center, and Head of the Data Science study program at Algebra University College in Zagreb. Mr. Mrsic is also an active member of the business and EDU communities, serving as a project manager, book author, author of scientific and professional papers, and business and program director of professional and scientific conferences. He has over 1,200 official teaching hours of experience and is a mentor on 30+ final-year student work theses in digital technology application in business and innovation. Mr. Mrsic is especially oriented towards evaluating personalized EDU paths and acquiring skills in the global environment. He is also a consultant on regional capacity-building projects and projects to attract subsidies/funds from local and international investment programs. In addition, he is an Associate Professor at the Faculty of Information Studies in Novo Mesto, Slovenia; the Faculty of Media in Ljubljana, Slovenia; and the Public Research Institute Rudolfovo, a scientific and technological centre in Novo Mesto, Slovenia, where he participates as part of a team of scientists on EU-funded projects. Mr. Mrsic was a member of the ESCO Maintenance Committee of the European Commission in Brussels in the third convocation (2018-2022) and continues to serve as an observer to the ESCO MSWG starting from 2022. He also holds an IPMA A Certified Program Director certificate and has successfully delivered over 100 projects. |