Characterisation of the upper atmospheres of HAT-P-32 b, WASP-69 b, GJ 1214 b, and WASP-76 b through their He i triplet absorption
Characterisation of atmospheres undergoing photo-evaporation is key to understanding the formation, evolution, and diversity of planets. However, only a few upper atmospheres that experience this kind of hydrodynamic escape have been characterised. Our aim is to characterise the upper atmospheres of the hot Jupiters HAT-P-32 b and WASP-69 b, the warm sub-Neptune GJ 1214 b, and the ultra-hot Jupiter WASP-76 b through high-resolution observations of their He I triplet absorption. In addition, we also reanalyse the warm Neptune GJ 3470 b and the hot Jupiter HD 189733 b. We used a spherically symmetric 1D hydrodynamic model coupled with a non-local thermodynamic equilibrium model for calculating the He I triplet distribution along the escaping outflow. Comparing synthetic absorption spectra with observations, we constrained the main parameters of the upper atmosphere of these planets and classify them according to their hydrodynamic regime. Our results show that HAT-P-32 b photo-evaporates at (130 70)1011 g s-1 with a hot (12 400 2900 K) upper atmosphere; WASP-69 b loses its atmosphere at (0.9 0.5)1011 g s-1 and 5250 750 K; and GJ 1214 b, with a relatively cold outflow of 3750 750 K, photo-evaporates at (1.3 1.1)1011 g s-1. For WASP-76 b, its weak absorption prevents us from constraining its temperature and mass-loss rate significantly; we obtained ranges of 6000-17 000 K and 23.5 21.5 1011 g s-1. Our reanalysis of GJ 3470 b yields colder temperatures, 3400 350 K, but practically the same mass-loss rate as in our previous results. Our reanalysis of HD 189733 b yields a slightly higher mass-loss rate, (1.4 0.5)1011 g s-1, and temperature, 12 700 900 K compared to previous estimates. We also found that HAT-P-32 b, WASP-69 b, and WASP-76 b undergo hydrodynamic escape in the recombination-limited regime, and that GJ 1214 b is in the photon-limited regime. Our results support that photo-evaporated outflows tend to be very light, H/He 98/2. The dependences of the mass-loss rates and temperatures of the studied planets on the respective system parameters (X-ray and ultraviolet stellar flux, gravitational potential) are well explained by the current hydrodynamic escape models.
Key Words.:
planets and satellites: atmospheres – planets and satellites: individual: HAT-P-32 b – planets and satellites: individual: WASP-69 b – planets and satellites: individual: WASP-76 b – planets and satellites: individual: GJ 1214 b1 Introduction
It seems common that planets, including Solar System terrestrials, experience hydrodynamic atmospheric escape at some stages of their lifetime (see e.g. Watson et al., 1981a; Yelle, 2004; García-Muñoz, 2007; Lammer et al., 2020b, a). This process, by which massive outflows of gas escape from the planet’s upper atmosphere, is called photo-evaporation when it is triggered by stellar irradiation, and it plays a central role in planetary evolution (see e.g. Tian et al., 2005; Jackson et al., 2012; Owen & Wu, 2017). Photo-evaporation can be responsible for shaping features such as the radius desert and the radius valley, significantly impacting the observed planetary demography and diversity (e.g. Owen & Wu, 2013; Lopez & Fortney, 2013; Malsky & Rogers, 2020).
Thus, the atmospheric characterisation of planets undergoing hydrodynamic escape provides information about the planetary properties and the escaping mechanism (e.g. Lampón et al., 2021a), and hints about their formation history and evolutionary pathways (see e.g. Jin & Mordasini, 2018; Owen et al., 2020; Mordasini, 2020). This characterisation requires constraining the main parameters of the planetary upper atmospheres, namely the mass-loss rate (), the temperature of the upper atmosphere (), H/He number ratio (hereafter called ratio), and ionisation profile, which are frequently largely degenerate. Among these parameters, it is especially important to constrain the H/He ratio. Knowledge of this ratio (i) significantly reduces the – degeneracy (see e.g. Lampón et al., 2020); (ii) gives hints to the atmospheric evolution and about the composition and global processes of the middle-lower atmosphere of the planet (see e.g. Hu et al., 2015; Malsky & Rogers, 2020; Salpeter, 1973; Stevenson, 1975, 1980; Wilson & Militzer, 2010); and (iii) contributes to understanding the detectability of the He I triplet absorption (Lampón et al., 2020, 2021b; Fossati et al., 2022). In addition, constraining the H/He ratio is essential for supporting or excluding the hypothesis that the outflow of planets undergoing photo-evaporation tend to have higher H/He ratios than the usually expected solar-like 90/10 value (Lampón et al., 2021a). To date, the H/He ratio of the upper atmosphere has been derived for only five planets, of which four show a H/He ratio of 97/3: HD 209458 b (Lampón et al., 2020; Khodachenko et al., 2021), HD 189733 b (Lampón et al., 2021b; Rumenskikh et al., 2022), GJ 3470 b (Shaikhislamov et al., 2021; Lampón et al., 2021b), WASP-52 b (Yan et al., 2022). Only for WASP-107 b has a solar-like value been derived (Khodachenko et al., 2021). Moreover, Dos Santos et al. (2022) and Fossati et al. (2022) point out that HAT-P-11 b and WASP-80 b, respectively, have upper atmospheres with very high H/He ratios.
The hydrodynamic escape regime is another important aspect of atmospheres experiencing photo-evaporation (Murray-Clay et al., 2009; Owen & Alvarez, 2016; Lampón et al., 2021a). General properties of hydrodynamic atmospheric escape are subsumed into three different regimes: energy-limited (EL), recombination-limited (RL), and photon-limited (PL) (see e.g. Owen & Alvarez, 2016; Lampón et al., 2021a). Although these regimes were theoretically predicted by Murray-Clay et al. (2009) and Owen & Alvarez (2016), evidence backed by observational results is very recent (Lampón et al., 2021a). Consequently, so far only a few planets have been classified into these regimes: the hot Jupiters HD 209458 b and HD 189733 b, which are in the EL and RL regimes, respectively (Lampón et al., 2021b), and the warm Neptune GJ 3470 b and the sub-Neptunes HD 63433 b, HD 63433 c, and GJ 1214 b, which are in the PL regime (Lampón et al., 2021b; Zhang et al., 2022b; Orell-Miquel et al., 2022).
To date, the main problem of atmospheric characterisation is the scarcity of observations. Since the first time this process was observed, in HD 209458 b by Vidal-Madjar et al. (2003), signatures of hydrodynamic escape have been observed in only a few more exoplanets. The observations are limited to neutral H lines (mainly Ly and H), measured in HD 209458 b, HD 189733 b, GJ 436 b, GJ 3470 b, KELT-20 b, KELT-9 b, and HAT-P-32 b (Vidal-Madjar et al., 2003; Lecavelier des Etangs et al., 2012; Bourrier et al., 2018; Ehrenreich et al., 2011; Kulow et al., 2014; Casasayas-Barris et al., 2018; Yan & Henning, 2018; Wyttenbach et al., 2020; Czesla et al., 2022); some ultraviolet metal lines (e.g. O I and C II) in HD 209458 b and HD 189733 b (Vidal-Madjar et al., 2004; Ben-Jaffel & Ballester, 2013; García Muñoz et al., 2021); some lines in the near-UV (e.g. Fe II and Mg II) in WASP-12 b, WASP-121 b, and HD 209458 b (Fossati et al., 2010; Haswell et al., 2012; Sing et al., 2019; Cubillos et al., 2020); and the metastable He I 23S–23P lines,111At vacuum wavelengths of 10 832.06, 10 833.22, and 10 833.31 Å, often referred to by their air wavelength as the He 10 830 Å triplet. hereafter He(23S), in WASP-107 b (Spake et al., 2018; Allart et al., 2019; Kirk et al., 2020; Spake et al., 2021), WASP-69 b (Nortmann et al., 2018; Vissapragada et al., 2020; Khalafinejad et al., 2021), HAT-P-11 b (Allart et al., 2018; Mansfield et al., 2018), HD 209458 b (Alonso-Floriano et al., 2019), HD 189733 b (Salz et al., 2018; Guilluy et al., 2020), GJ 3470 b (Pallé et al., 2020; Ninan et al., 2020), WASP-52 b (Vissapragada et al., 2020; Kirk et al., 2022), WASP-76 b (Casasayas-Barris et al., 2021), HAT-P-18 b (Paragas et al., 2021), HAT-P-32 b (Czesla et al., 2022), GJ 1214 b (Orell-Miquel et al., 2022), TOI 560 b, TOI 1430.01, TOI 1683.01, and TOI 2076 b (Zhang et al., 2022a, 2023). However, the observations in WASP-76 b and GJ 1214 b are still to be confirmed (see Casasayas-Barris et al. (2021) for WASP-76 b and Spake et al. (2022) for GJ 1214 b).
The ultra-hot Jupiter WASP-76 b, the hot Jupiter HAT-P-32 b, and the warm sub-Neptune GJ 1214 b, are suitable for photo-evaporation studies as they show a He(23S) absorption (tentative in the case of GJ 1214 b and WASP-76 b) compatible with extended atmospheres. Moreover, these planets are especially interesting due to their special features: WASP-76 b is the only ultra-hot Jupiter where He(23S) has been detected, HAT-P-32 b is the planet with the largest He(23S) absorption observed to date, and GJ 1214 b (together with the recently measured TOI 560 b, TOI 1430.01, TOI 1683.01, and TOI 2076 b) is the smallest planet with observed He(23S) absorption. Czesla et al. (2022) and Orell-Miquel et al. (2022) modelled their respective He(23S) absorption, but not in much detail. Thus, a more comprehensive study of the parameter space is required in order to infer more accurate constraints on the main parameters of their upper atmospheres.
The hot Jupiter WASP-69 b is another interesting exoplanet with an extended upper atmosphere, as shown by the He(23S) high-resolution spectra measured by Nortmann et al. (2018). Recently, Vissapragada et al. (2020) also observed He(23S) in this planet, but using a photometric technique. Vissapragada et al. (2020) and Wang & Dai (2021) modelled the He(23S) in order to constrain some of the main parameters of its upper atmosphere. However, an extended study exploring the temperature and mass-loss rate ranges, including the H/He ratio and the derivation of its hydrodynamic escape regime, has not been performed yet.
In this work our aim is to characterise the upper atmosphere of the exoplanets HAT-P-32 b, WASP-69 b, GJ 1214 b, and WASP-76 b by analysing their He(23S) high-resolution spectra. We used the same methods as in Lampón et al. (2020, 2021b, 2021a), but here we calculate synthetic spectra more accurately (as shown in Sect. 3). Further, as the X-ray and ultraviolet (XUV) irradiation of GJ 3470 b and HD 189733 b have been recently revised, we also reanalyse these planets. We used a spherically symmetric 1D hydrodynamic model coupled with a non-local thermodynamic equilibrium (non-LTE) model to calculate the He(23S) distribution. We should note that our model, as it is a 1D model, does not account for other parameters that might affect the strength of the He(23S) absorption signal, being the stellar wind the most important (see e.g. Vidotto & Cleary, 2020; Khodachenko et al., 2021; Fossati et al., 2022). An estimation of this effect has, nevertheless, been performed (see Sect. 3.2). Applying a high-resolution radiative transfer code that includes thermal, turbulent, and wind broadening, we compute synthetic absorption spectra, and by comparing with observations we constrain the main parameters of the upper atmosphere. In addition, by analysing the hydrogen recombination and advection processes, we determine the hydrodynamic escape regime of these exoplanets. Further, in order to infer more general properties, we compare the results for these planets, including the hot Jupiter HD 209458 b, which also undergoes photo-evaporation and has been previously studied with the same method.
The paper is organised as follows. Section 2 summarises the He(23S) observations of HAT-P-32 b, WASP-69 b, GJ 1214 b, and WASP-76 b. Section 3 briefly describes the methods we used for modelling the He(23S) distribution, computing the synthetic absorption spectra, and constraining the main parameters of the upper atmospheres. Section 4 shows and discusses the results obtained. The main conclusions are summarised in Sects. 5 and 6.
2 Observations of the He i triplet absorption
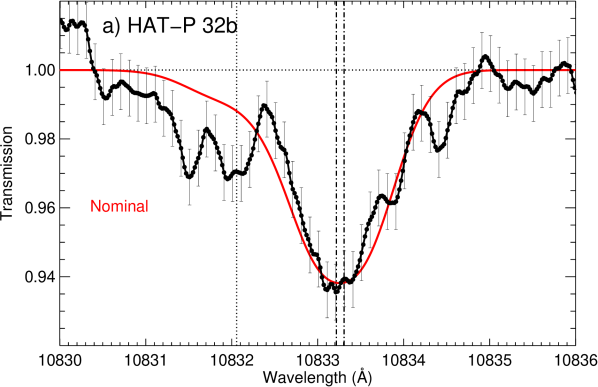
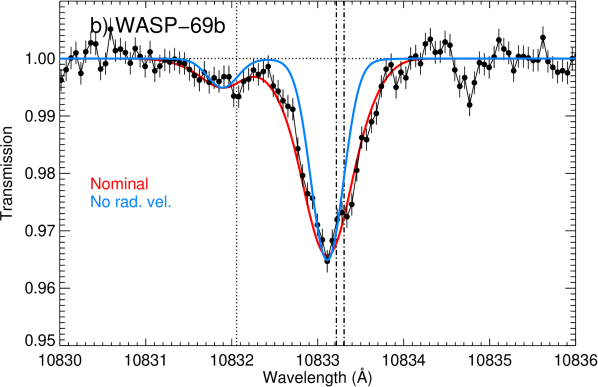
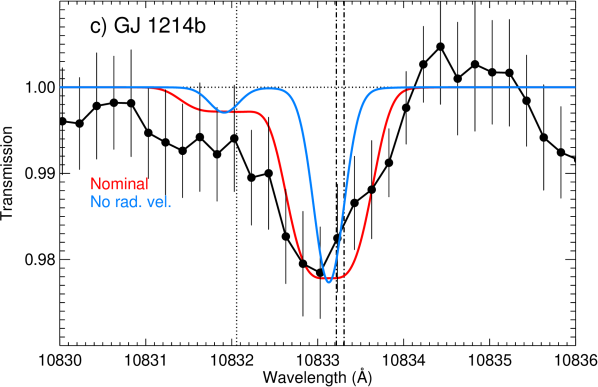
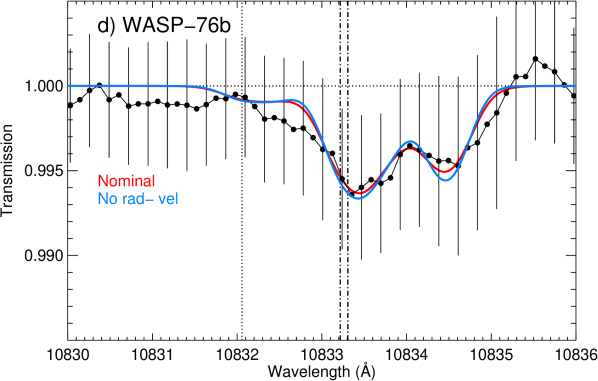
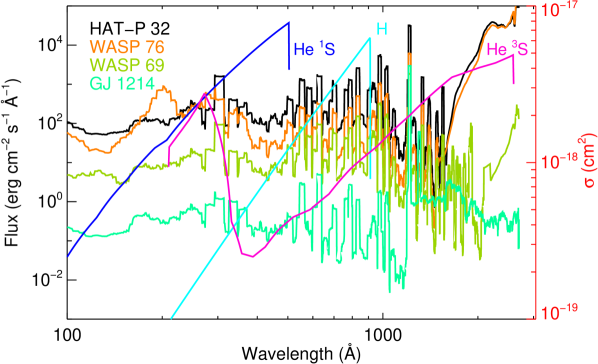
In this section we summarise the He(23S) measurements that we use for our analysis of HAT-P-32 b, WASP-69 b, GJ 1214 b, and WASP-76 b. The original observations are described by Czesla et al. (2022), Nortmann et al. (2018), Orell-Miquel et al. (2022), and Casasayas-Barris et al. (2021), respectively. All these measurements were taken with the high-resolution spectrograph CARMENES,222Calar Alto high-Resolution search for M dwarfs with Exoearths with Near-infrared and optical Échelle Spectrographs, at the 3.5 m Calar Alto Telescope (Quirrenbach et al., 2014). and are shown in Fig. 1.
For HAT-P-32 b, the analysed He(23S) transmission spectrum corresponds to the combination of two mid-transit spectra. It shows a He excess absorption at the level of 6%, which is the highest observed in a planet to date. In contrast to most planets, the stronger He(23S) line, formed by the two unresolved lines centred at 10 833.22 Å and 10 833.31 Å, does not show any significant shift in this planet. The weaker He(23S) line, centred at 10 832.06 Å, is very deep at mid-transit (see Fig. 1a), but appears substantially reduced or absent in other transit phases (Czesla et al., 2022). In addition, the mid-transit spectrum shows a significant excess absorption near 10831.5 Å, which corresponds to a blueshift of 50 km s-1. However, this signal does not appear during the pre-transit, ingress, and start, and is faint in the egress (Czesla et al., 2022), which then raises questions about its nature. As shown by Czesla et al. (2022), the spectra show an important redshifted absorption of 25 km s-1 in the pre-transit, which increases in the ingress phase and disappears in the egress. Absorption in the egress is much weaker than during ingress, and no post-transit is observed. These features show a complex spatial distribution of the gas, compatible with a redshifted component in front of the trajectory of the planet, as suggested by Czesla et al. (2022).
For WASP-69 b, we study the He(23S) transmission spectrum averaged over the time-resolved spectra taken between the second and third transit contacts (T2 and T3, respectively) from two different transits (Nortmann et al., 2018). The stronger He(23S) line shows a He excess absorption at the level of 3.59 0.19% with a blueshift of 3.58 0.23 km s-1. The weaker He(23S) line is shallow, at the level of 0.4 %, as shown in Fig. 1b. Nortmann et al. (2018) also observed a faint ingress, 1 %, with a redshift of 1.4 0.9 km s-1, and a stronger post-transit, 1.8 %, with an averaged blueshift of 10.71.0 km s-1. However, they did not observe pre-transit absorption. Interestingly, these features are compatible with a blueshifted tail behind the trajectory of the planet, which is just the opposite of the HAT-P-32 b scenario.
In the case of GJ 1214 b, we analysed the He(23S) transmission spectrum averaged between the first and the fourth contacts (T1 and T4, respectively) from one transit. The stronger He(23S) line shows a He excess absorption at the level of 2.1 % with a blueshift of 4 4 km s-1 (see Fig. 1c). The weaker He(23S) line is at the level of 0.6 %. The pre- and post-transits do not show any significant absorption, although the signal-to-noise ratio (S/N) could be too low for such a detection. This detection has to be confirmed, as only one transit was measured in good telluric conditions (Orell-Miquel et al., 2022).
For WASP-76 b, we analyse the He(23S) transmission spectrum averaged between T1 and T4 from two different transits. The stronger He(23S) line is 0.52 0.12% deep. Absorption is very broad and largely redshifted, 105 km s-1 (see Fig. 1d). The low S/N prevents us from measuring pre- and post-transit absorption in this planet. Due to the telluric contamination and the low S/N, these observations need confirmation (Casasayas-Barris et al., 2021).
3 Methods
3.1 Modelling the He i triplet density distribution
We computed the He(23S) density distribution using the model by Lampón et al. (2020), which we briefly describe here. We used a spherically symmetric 1D hydrodynamic model coupled with a non-LTE model for simulating the hydrodynamic atmospheric escape in the substellar direction (the one that connects the star-planet centres). As the solutions are degenerated with respect to the main parameters of the escape (e.g. , , and the H/He ratio), it is important to fully explore the parameter spaces. While 3D magneto-hydrodynamic models are necessary for reproducing the complex and detailed spatial distribution of the gas, their high computational cost usually prevents us from carrying out studies with a large number of simulations. Such studies are currently feasible using 1D spherically symmetric approaches, which allow the main parameters of the escape to be explored reasonably well (see e.g. Murray-Clay et al., 2009; Stone & Proga, 2009; Tripathi et al., 2015; Owen et al., 2020).
In order to simplify the hydrodynamic calculations, we assumed that the speed of sound of the outflow, , does not depend on the radius. In that equation is the Boltzmann constant, is the temperature, and (r) is the mean molecular weight. We note that this does not necessarily imply that and are independent of , but their ratio is. The constant speed of sound is given by = , where has a constant value, close to the maximum of the temperature profile obtained when solving the energy budget equation (see e.g. Fig. 3 in Lampón et al., 2020), and is the average of (r), which is iteratively calculated in the model (see Appendix A in Lampón et al., 2020). This assumption lets us decouple the hydrodynamic momentum equation from the energy budget equation and hence obtain an analytical solution analogous to the isothermal Parker wind approximation (Lampón et al., 2020).
Given the bulk parameters of the planetary system (i.e. the mass, radius, and orbital separation of the planet, listed in Table 2, and the XUV stellar flux), (including all species considered in the model), , and the H/He ratio are the input parameters of the model. Among other outputs, the model yields the density distribution of species: neutral and ionised hydrogen, H0 and H+, respectively; the helium singlet, He(11S); ionised helium, He+; and the He(23S) abundance. We neglected the He++ concentration in our calculations and assumed that the electron density is entirely produced by the H0 ionisation. Production and loss processes are listed in Table 2 of Lampón et al. (2020), which are a minor extension of those considered by Oklopčić & Hirata (2018).
Nominally, we set up the lower boundary at 1.02 with a total gas density of 1014 cm-3, which is large enough to absorb all the stellar XUV and near-UV radiation. In this work we also assumed a rather high upper boundary of the planet’s atmosphere, close to the stellar diameter. This was motivated by the very extended atmospheres of some planets (e.g. GJ 1214 b and GJ 3470 b). In this way it is guaranteed that we account for practically all the absorption along the line of sight (LOS) for all paths subtended by the stellar disc in every phase of the transit (see Sect. 3.4).
3.2 Stellar winds
It has been shown in previous studies that there are also other parameters, among which the stellar wind (SW) is the most important, that could significantly affect the He(23S) signal (see e.g. Khodachenko et al., 2021; Vidotto & Cleary, 2020; Fossati et al., 2022). A detailed study of the SW and its effect on the planetary wind is beyond the scope of this paper as it requires a 3D model. Nevertheless, and despite the very large uncertainties in the SW parameters, we estimated its potential effects on our nominal (i.e. no SW considered) ranges. To evaluate this effect we repeated our simulations assuming that the atmosphere, still spherical, is shortened and consider that it spans only up to the ionopause (i.e. the region where the planetary and stellar winds pressures are in equilibrium). The location of the ionopause was estimated following Khodachenko et al. (2019), considering only the substellar direction. As the SW parameters (density profile, temperature, and velocity) are highly dependent on unknown factors (e.g. the stellar magnetic field), we chose those characterising the fast solar wind (see Fig. 3 in Johnstone et al., 2015b), which actually has a larger impact on the planetary wind than the slow solar wind. They were scaled to the distance of the corresponding planetary orbit. Furthermore, we use another approximation considering the same temperature and velocity as for the fast solar wind, but scaling the density to the stellar mass-loss rate. We used Eq. 7 in Johnstone et al. (2015b) to estimate stellar mass-loss rates, except for GJ 1214, for which we used the relationship , as this star is in the saturated regime (see e.g. Johnstone et al., 2015b, a), and HAT-P-32 and WASP-76, for which we used a value of three times the solar value as we do not have the stellar rotational period (needed in Eq. 7 of Johnstone et al. (2015b)). See Table 1 for the stellar wind parameters used in this analysis.
| Star | Tswp | vswp | nswp | ne,swp | |
|---|---|---|---|---|---|
| (MK) | (km s-1) | (cm-3) | (cm-3) | ||
| HAT-P-32 | 3.0 | 2.4 | 470 | 5700 | 17 100 |
| WASP-69 | 1.6 | 2.0 | 540 | 2800 | 4480 |
| GJ 1214 | 0.1 | 2.6 | 330 | 48 000 | 4800 |
| WASP-76 | 3.0 | 2.4 | 470 | 6100 | 18 300 |
| GJ 3470 | 3.7 | 2.4 | 470 | 5500 | 20 000 |
| HD 189733 | 3.4 | 2.4 | 470 | 6000 | 20 400 |
We find that, in general, it might have a significant impact on the He(23S) absorption for planets with very extended atmospheres when considering strong SW. However, it only slightly changes our nominal T- ranges. In particular, we found no significant effects (either using the fast or the scaled SW), for the derived – of HAT-P-32 b, WASP-69 b, and WASP-76 b. For the other planets the results are discussed in Sects. 4.3 and 4.5.
In those estimations we assumed that He(23S) is depleted at the ionopause altitude. However, under some scenarios, it is possible that the electron density supplied by the SW produces a He(23S) enhancement (see Shaikhislamov et al., 2021). For these cases the effects would be to lower the SW estimations.
| Parameter | Value | Ref |
| HAT-P-32 | ||
| 286.221 pc | GA | |
| 1.219 0.016 | HR | |
| 1.160 0.041 | HR | |
| 6269 64 K | ZH | |
| -0.04 0.08 | HR | |
| 0.0343 0.0004 au | HR | |
| 88.9 0.4 deg | HR | |
| 1.789 0.025 | HR | |
| 0.585 0.031 | CZ | |
| WASP-69 | ||
| 50.287 pc | GA | |
| 0.813 0.028 | AN | |
| 0.826 0.029 | AN | |
| 4715 50 K | AN | |
| +0.144 0.077 | AN | |
| 0.04525 0.00053 au | AN | |
| 86.7 0.2 deg | AN | |
| 1.057 0.047 | AN | |
| 0.26 0.017 | AN | |
| GJ 1214 | ||
| 14.6416 pc | GA | |
| 0.216 0.012 | HP | |
| 0.150 0.011 | HP | |
| 3026 150 K | HP | |
| +0.39 0.15 | BR | |
| 0.01411 0.00032 au | HP | |
| 88.2 0.5 deg | HP | |
| 0.24463 0.00473 | CL | |
| 0.02571 0.00135 | CL | |
| WASP-76 | ||
| 189.039 pc | GA | |
| 1.756 0.071 | EH | |
| 1.458 0.021 | EH | |
| 6329 65 K | EH | |
| +0.366 0.053 | EH | |
| 0.0330 0.0002 au | EH | |
| 88.0 deg | WE | |
| 1.854 | EH | |
| 0.894 | EH | |
3.3 Stellar fluxes
The XUV stellar flux, , can ionize neutral H (below 912 Å) and He (below 504 Å) atoms. Good knowledge of the spectral stellar energy distribution (SED) in this range is essential for interpreting the evaporation effects on the planet’s atmosphere. However, the H in the interstellar medium absorbs much of the extreme ultraviolet (EUV, 100–920 Å) stellar flux, hampering a correct evaluation of the stellar flux in most cases. Stellar XUV lines are formed in the transition region and corona, at temperatures of (K) 4–7.5. Thus, a correct coronal model should be able to predict the XUV emission coming from spectral lines and continuum. For this work, following Sanz-Forcada et al. (2011), we used this approach to generate a synthetic SED in the XUV spectral range, extended up to 1600 Å, 2100 Å, 1200 Å, and 1500 Å for HAT-P-32, WASP-69, GJ 1214, and WASP-76, respectively. Further, we use the atomic database APEC (Smith et al., 2001), which has some limitations beyond 1200 Å, but it is quite accurate in the XUV (Chadney et al., 2015). The coronal models used in this paper are detailed in Sanz-Forcada et al. (2023, in prep.). In the case of WASP-76 only an upper limit could be used for the stellar XUV fluxes, since its general flux level is based on an XMM-Newton detection with a significance lower than 3.
In order to extend the SED of the stars to 2600 Å to cover the He(23S) absorption, for HAT-P-32, WASP-69, and WASP-76 we used the stellar atmospheric model of Castelli & Kurucz (2003) scaled to their temperature, surface gravity, and metallicity (see Table 2). For GJ 1214 we used the Hubble/COS spectra for the 1200–1650 Å range, and the Hubble/STIS spectra for 1650–2600 Å. The SEDs for the extended spectral range of 5–2600 Å for the planets at their respective orbital separations are shown in Fig. 2.
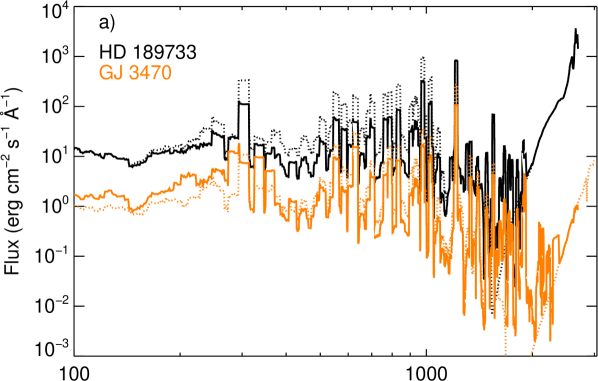
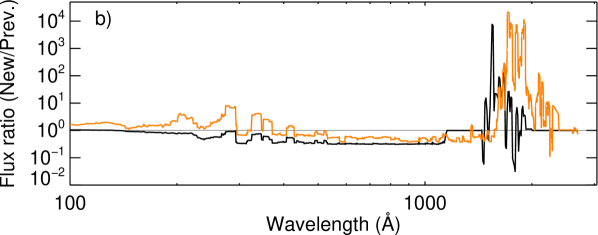
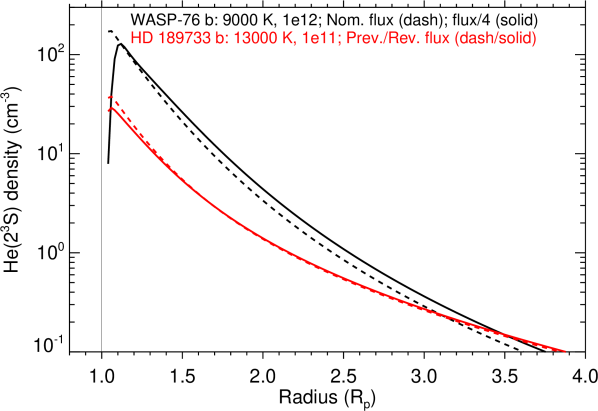
The XUV data of HD 189733 and GJ 3470 were revised after an improved treatment of the coronal abundances of the stars in Sanz-Forcada et al. (2023, in preparation). Their SEDs at the planetary distance are shown in Fig. 3. As we see in the figure, the flux density for HD 189733 is significantly reduced, by a factor from two to three at wavelengths between 250 Å and 1200 Å. In the case of GJ 3470 the flux density is increased by an average factor of close to three at wavelengths below 400 Å, and it is reduced by a factor of close to two between 400 Å and 1200 Å. We also extended our coronal model up to 2300 Å for GJ 3470 and from 1450 Å to 1900 Å for HD 189733. For longer wavelengths, up to 2600 Å, we plugged in the model of Castelli & Kurucz (2003) (see Lampón et al., 2021b, for details about the stellar fluxes of both planets).
3.4 Spectral absorption
The He(23S) absorptions of the four planets were computed using a radiative transfer code for the transit geometry (Lampón et al., 2020). The code inputs are the bulk parameters of the planetary systems, the He(23S) abundances and the gas radial outflow velocities computed with the model described above. Similarly to our previous works, the spectroscopic data for the three metastable helium lines are from the NIST Atomic Spectra Database.555https://www.nist.gov/pml/atomic-spectra-database. In the radiative transfer code, broadenings and shifts of the lines can be included from three major sources. First, we account for the Doppler broadening caused by the microscopic thermal velocities dictated by the local kinetic temperature. Second, by assuming turbulent velocities a line widening can be incorporated (Salz et al., 2018), which also depends on the kinetic temperature and is given by = , where is the mass of a He atom (see Eq. 16 in Lampón et al., 2020). Third, we also incorporated the broadening produced by the component of the radial outflow velocity of the gas along the line of sight. This effect can be notable in planets with extended atmospheres, where the absorption of the uppermost layers, usually moving out at the larger velocities, is significant. The gas radial outflow velocities can also produce a weaker absorption at the core of the stronger lines (compared to that in their wings) in atmospheres that are very compressed, that move at high velocities, and with a He(23S) concentration profile that peaks just above the lower boundary. Moreover, where necessary, we can also include in the absorption averaged wind calculations (e.g. day-to-night, super-rotation winds) and planetary rotation (see e.g. Salz et al., 2018; Seidel et al., 2020, and Eq. 15 in Lampón et al., 2020), here referred to as ‘non-radial’ winds, complementary to the hydrodynamic radial winds.
We computed the mid-transit synthetic spectrum for HAT-P-32 b and the phase-averaged synthetic spectrum for WASP-69 b, GJ 1214 b, and WASP-76 b, mimicking the He(23S) observations (see Sect. 2), as suggested by Dos Santos et al. (2022). The inputs related to the transit geometry, the planetary and stellar radii, and the transit impact parameter are listed in Table 2.
3.5 Constraining the main parameters of the upper atmosphere
Following the methods of Lampón et al. (2020, 2021b) we carried out a parameter study to constrain the main parameters of the upper atmosphere of HAT-P-32 b, WASP-69 b, GJ 1214 b, and WASP-76 b. For a given H/He ratio, we performed a grid of simulations with a wide range of T and (hereafter - grid). We calculated the reduced contour map of the - grid by comparing the synthetic spectrum of every simulation with the measured He(23S) absorption profile (see Sect. 3.4 in Lampón et al., 2021b). The selected spectral ranges for the fitting of spectra are 10830.5–10835 Å, 10831–10834.5 Å, 10831–10834.5 Å, and 10831–10836 Å, for HAT-P-32 b, WASP-69 b, GJ 1214 b, and WASP-76 b, respectively. The number of fitted data points is taken as the number of independent measurements taken by CARMENES in the selected spectral range, that is, the spectral range divided by the spectral resolution of CARMENES in this channel, = 80 400. This yields 36, 29, 31, and 44 spectral points for the respective planets. The number of degrees of freedom equals the number of spectral points minus two, the number of fitted variables (temperature and mass-loss rate; see Sect. 3.4 in Lampón et al., 2021b).
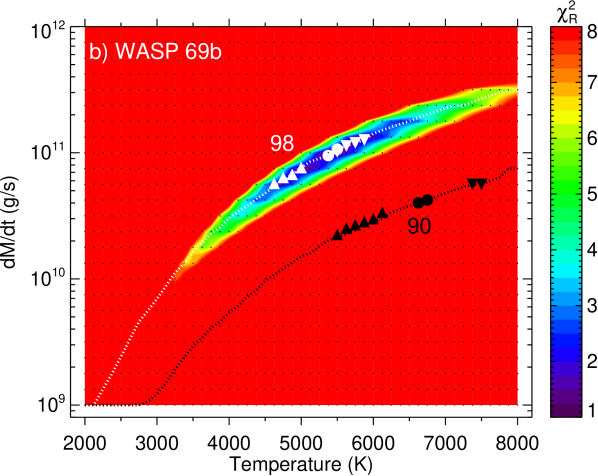
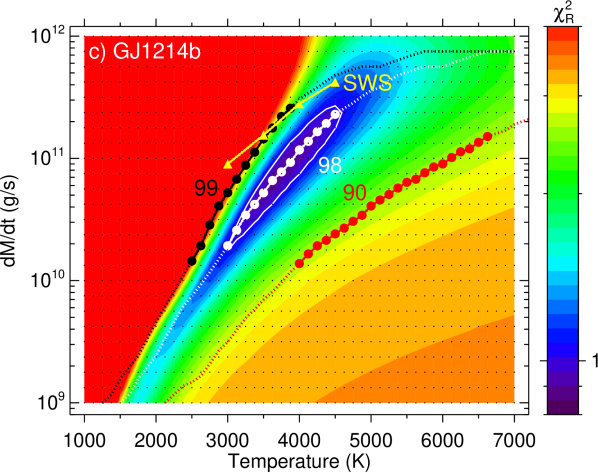
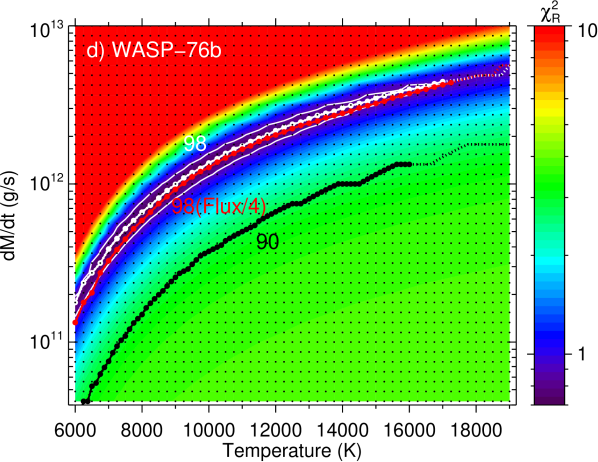
Figure 4 shows the simulations for the different - grids (black dots), the best fits within the 95% confidence of the (large symbols, hereafter the constrained - range), and the best fits for the rest of the temperatures and mass-loss rates (dotted lines, hereafter the extended - range). In addition to , , and the H/He ratio, turbulence and non-radial winds could significantly affect the width of the He(23S) absorption line (Lampón et al., 2021b), impacting the constrained - range. In the case of very extended atmospheres, the upper boundary can also influence the results. The reason is that the uppermost layers, which are rather dense (Sect. 3.1) and out-flowing at large velocities (Fig. 17), could produce additional absorption and broadening of the line. In Sect. 4 we discuss how such parameters affect the constrained - range of the studied planets.
The H/He ratio can be constrained by comparing the H0 density profiles determined from the He(23S) observations to the H0 abundances derived from Ly measurements (Lampón et al., 2020, 2021a). For the planets studied here, unfortunately, there are no available Ly absorption measurements. Nevertheless, we tried to constrain the H/He ratio (see Sect. 4), for the case of HAT-P-32 b, by using the simultaneous H measurements (Czesla et al., 2022), and for the case of GJ 1214 b by analysing the relationship between the heating efficiency and the H/He ratio.
To constrain the mean heating efficiency of the upper atmosphere, (hereafter heating efficiency), we followed Lampón et al. (2021b). We used the energy-limited approximation, , (Watson et al., 1981b; Erkaev et al., 2007), together with the relationship / = 4/5 derived by Salz et al. (2015), to obtain
| (1) |
where is the gravitational potential, and are respectively the planetary mass and radius, and is the gravitational constant; is the effective absorption radius, i.e. the altitude where the XUV optical depth is unity; = 1–1.5 is the potential energy reduction factor, with = , where is the planetary orbital separation and the stellar mass. In this way, we calculated with and obtained from our model, the system’s parameters from Table 2, and the from Sect. 3.3 listed in Table 3.
3.6 Classification of planets by their hydrodynamic escape regimes
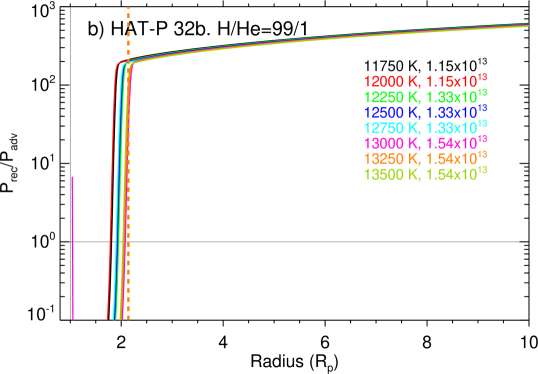
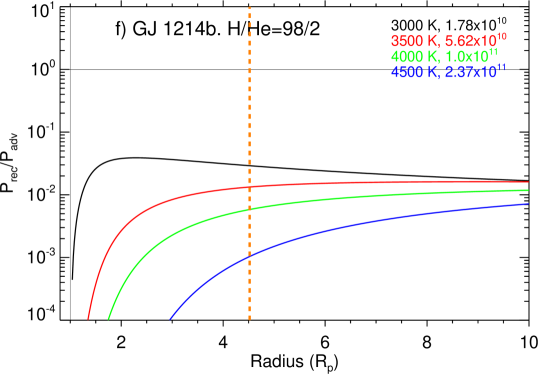
We classified the studied planets according to their corresponding hydrodynamic escape regime following the method described by Lampón et al. (2021a). Briefly, regimes can be distinguished by the production and losses of H0, and additionally by the heating efficiency of the outflow. In the recombination-limited regime, production of H0 by recombination dominates over advection in practically the entire upper atmosphere (i.e. when 1, where and are the recombination rate and the advection rate, respectively) (see Eq. 1 and definitions in Lampón et al., 2021a). In this regime, the ionisation front (IF), the region where the atmosphere transitions from essentially neutral to mostly ionised, is confined to a narrow region. Additionally, the heating efficiency is very low, with values considerably lower than 0.1, as radiative cooling is an important fraction of the absorbed stellar energy.
In the photon-limited regime, advection dominates the production of H0, and then . In this case the IF extends to practically the entire upper atmosphere, and the heating efficiency is relatively high, with values close to or higher than 0.1, as the radiative cooling is moderate or negligible. In addition, the heating efficiency is nearly constant with respect to , as in this regime (see Eq. 1).
In the energy-limited regime recombination and advection are non-negligible in most of the upper atmosphere. The IF is wide, although it does not occupy the whole upper atmosphere. Moreover, the heating efficiency is close to or higher than 0.1, as in the photon-limited regime. However, the heating efficiency is not constant with respect to .
4 Results
 |
 |
 |
 |

4.1 HAT-P-32 b
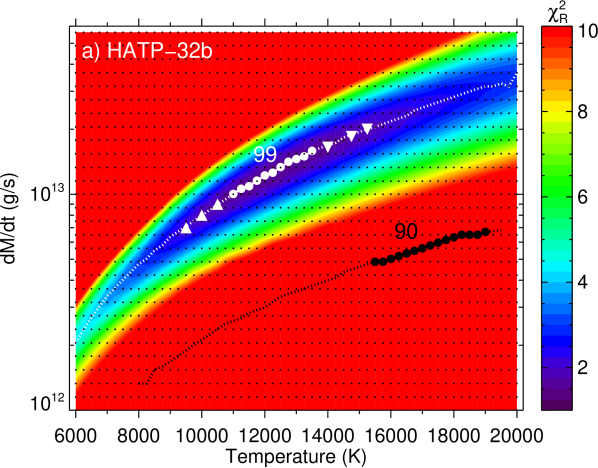
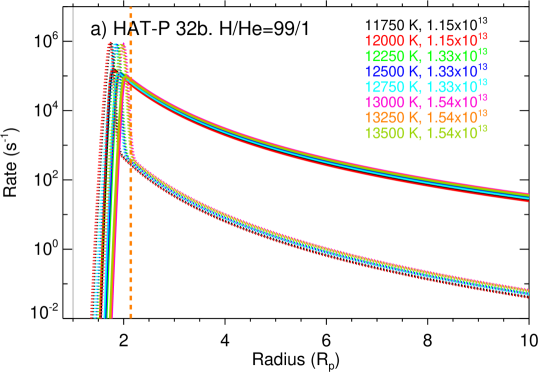
The reduced contour map of HAT-P-32 b for our nominal case is shown in Fig. 4a. In these calculations, we assumed a H/He ratio of 99/1 (see below) and included the turbulence broadening component at the corresponding temperature. The observed absorption line is well fitted by the simulations from the constrained - range (white circles). The red curve in Fig. 1a corresponds to the synthetic absorption of one of these simulations, = 12 500 K and = 1.4 1013 g s-1. At low (high) temperatures the gas radial outflow velocities are lower (higher) (see Fig. 17a), which yields a narrower (broader) absorption line and consequently worse fits (higher ).
In the nominal calculations above we did not include any atmospheric component moving away from (red) or towards (blue) the observer. However, Czesla et al. (2022) showed (see Sect. 2) that some of these components are present at other phases of the transit. Hence, they could also be present, although at different velocity shifts, in the observed mid-transit spectra. Thus, to explore these potential contributions to the derived mass-loss rates, we conducted further calculations following Czesla et al. (2022). These tests consider, in addition to the gas radial velocities from the hydrodynamic model, a 20% fraction of the atmosphere moving with a redshift of 20 km s-1. As this contribution broadens the synthetic absorption, the derived temperatures and mass-loss rates extend to lower values: 9500 K and 6 1012 g s-1 (see Fig. 4a, upward white triangles).
Similarly, to assess the effect of turbulence, we repeated the analysis by excluding its broadening. We found that this broadening does not significantly alter the derived temperatures and mass-loss rates because it is much smaller than the widening produced by the large gas radial outflow velocities in the upper atmosphere of this planet (see Fig. 17a).
As discussed in Sect. 2, the mid-transit spectrum also shows a significant absorption at 10831.5 Å, which is appreciably blueshifted from the position of the weak He(23S) line. However, as this feature is only significant at the mid- and end-transit phases, it is uncertain whether this absorption is produced by the bulk atmosphere. To determine the contribution of this possible absorption in our results, we reperformed the analysis by excluding this feature (i.e. considering the fitting in the spectral range of 10831–10835 Å and the corresponding 32 spectral points). However, we found no significant differences in the constrained - range.
HAT-P-32 b shows a very narrow ionisation front (IF) located at high altitudes (1.5–2 ; see Fig. 5a), which is a rather different scenario to those found for other planets (i.e. HD 209458 b, HD 189733 b, GJ 3470 b, WASP-69 b, GJ 1214 b, and WASP-76 b). The assumption of constant speed of sound that we apply in our hydrodynamic model could lead to the overestimation of the gas radial outflow velocities in the lower part of the IF region (e.g. compare the velocity profiles in Fig. 17a with those of Fig. 16 in Czesla et al. 2022 obtained with the more comprehensive model of Muñoz & Schneider, 2019). This overestimation could produce a non-realistic broadening of the He(23S) absorption if the IF region is narrow and located at high altitudes where the velocities and their gradients are significant. In order to analyse this possible degeneracy, we repeated the analysis for the nominal case but assuming zero radial velocities of the gas inside the IF region. We found that the He(23S) absorption line inside the IF region is significantly narrowed, and that the derived temperatures and mass-loss rates extend to higher values, 15250 K and 2 1013 g s-1, as shown in Fig. 4a (downward white triangles).
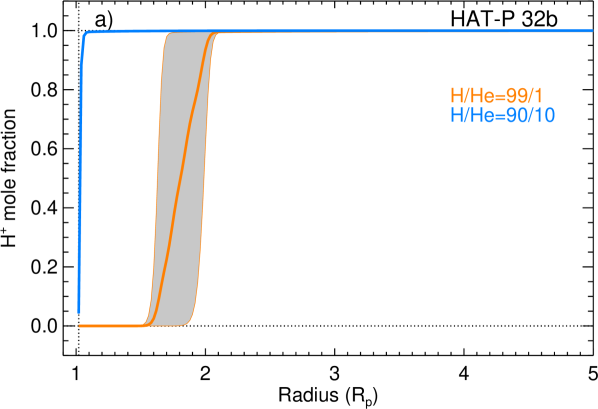
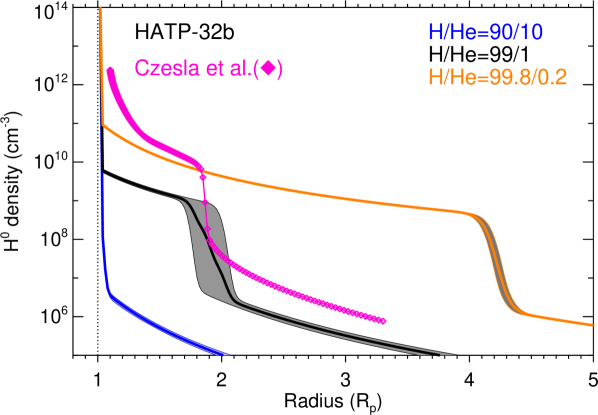
In addition to the He(23S) absorption, Czesla et al. (2022) also measured H absorption spectra in HAT-P-32 b. By modelling this absorption with a hydrodynamical model that includes only H (no He), they found that the H absorption (e.g. the concentration of H(2)) is mainly produced in the IF region, which is very narrow and located at 1.8 (see Fig. 16 in Czesla et al., 2022). Thus, we focus on reproducing with our model the concentrations of H0 and H+ derived from the H absorption just in that IF region. In Fig. 6 we show the H0 profiles that resulted from our models corresponding to the constrained - ranges for the He(23S) for H/He ratios of 90/10, 99/1, and 99.8/0.2 (blue, black, and orange curves, respectively), together with those derived by Czesla et al. (2022) (magenta curve). The H/He = 99/1 case yields a location of the IF region (at about 1.8 ) similar to that obtained from the H measurements. We should note, however, that the H0 and H+ concentrations are lower than those derived by Czesla et al. (2022), so that our predicted H absorption underestimates the measurements. However, assuming lower gas radial outflow velocities in the lower part of the IF region (as discussed above), would yield higher H0 and H+ concentrations that would reproduce the observed H absorption with no significant variation on our constrained - ranges. For H/He ratios of 90/10 and 99.8/0.2, the IF region is far away from that derived by Czesla et al. (2022). Therefore, we conclude that the H/He ratio in the upper atmosphere of HAT-P-32 b is (99.0/1.0). For this H/He ratio and taking into account the complete constrained - range (i.e. white circles, and upward and downward white triangles in Fig. 4a), we derive a = (130 70) 1011 g s-1 and = 12 400 2900 K.
Regarding the He(23S) abundance, we find that its density distribution is confined to a narrow range, decreasing by about two orders of magnitude from 1.6 to 5.5 (see Fig. 16a). It peaks at the IF which, as already discussed, is very narrow and is located at relatively high altitudes, 1.6 (see Fig. 5a). The outflow is almost completely ionised in the whole upper atmosphere (as it begins where the IF starts). In this region, the H0 production is dominated by recombination, as shown in the panels in the first row of Fig. 7, and the heating efficiency is very low, 0.017 0.003. Thus, we conclude that HAT-P-32 b is in the recombination-limited (RL) regime (see Sect. 3.6).
In summary, we find that HAT-P-32 b photo-evaporates at = (130 70) 1011 g s-1 (thus refining the order of magnitude of 1013 g s-1 reported by Czesla et al. 2022), has a maximum upper atmospheric temperature of 12 400 2900 K, has an upper atmospheric H/He ratio of 99/1, is in the RL regime, and has a heating efficiency of 0.017 0.003. We also find that turbulence broadening is not significant in this planet, and the presence of the absorption at 10831.5 Å does not alter our results. Our derived - range, accounts for plausible different wind configurations and different velocities in the IF zone, which have a significant effect on the absorption broadening.
4.2 WASP-69 b
4.2.1 General results
Figure 4b shows the reduced contour map of WASP-69 b for our nominal case. The results were obtained by including the hydrodynamical model outputs of the He(23S) concentrations and the radial velocities of the gas. They were obtained for a H/He ratio of 98/2 (see discussion below). In the calculations of the line absorption, we included a net blueshift of 4.5 km s-1, as suggested by the observations (see Fig. 1b), and also the turbulence broadening at the appropriate temperature. That panel shows two simulations for one - pair, = 1011 g s-1, and = 5375 K (i.e. for one of the white circles in Fig. 4b). We see, on the one hand, that the model reproduces the observed absorption very well and, on the other, that the broadening of the lines produced by the radial outflow is significant (compare red and blue curves), and thus allows us to constrain the - range. As shown in Fig. 4b (white dots) the range of - is very narrow, mainly caused by the dependence of the gas radial outflow velocities on temperature (see Fig. 17b). At low (high) temperatures the radial velocities are lower (higher) and yield narrower (broader) synthetic profiles and consequently worse fits (higher ).
The narrow - range described above was obtained under the assumption that we have an overall net blueshift of the whole upper atmosphere of 4.5 km s-1. However, the absorption of the combined T2-T3 transit spectra analysed here is also compatible with other combined atmospheric blue- and redshifted components, as the observations at different transit phases have shown the existence of such components (see Sect. 2 and Nortmann et al., 2018). Thus, we further explored the - range by replacing that entire blueshift by other components similar to those observed at ingress and egress. In particular, we considered the case of including two blueshifted components, at 3.6 km s-1 and 10.7 km s-1 for respective fractions of 45% and 30% of the upper atmosphere (sectors of 0.9 and 0.6 rad, see Eq. 17 in Lampón et al., 2020), together with 15% (0.3 rad) of the atmosphere moving away from the observer at 1.4 km s-1. For this case the constrained - range (upright white triangles) is extended to lower temperatures and lower mass-loss rates. The reason is that the blue and red components significantly broaden the absorption line, and thus fitting the line requires lower gas radial velocities, that is, lower temperatures.
We repeated the analysis, but excluded the turbulence broadening. This resulted in - slightly larger (downward white triangles) since neglecting the turbulence broadening leads to narrower lines. Thus, overall, accounting for the lack of knowledge of these effects, we find a slightly extended range of the constrained - .
As we discuss in Sect. 1, the H/He concentration has a large impact on the mass-loss rates derived from He(23S) absorption measurements. Unfortunately, there are no available observations of the H0 lines for WASP-69 b. Khalafinejad et al. (2021) found a possible signature of H absorption, but they did not claim it as a significant detection. Thus, based on the fact that for most of the observed planets high H/He ratios have been derived (see Sect. 1), we assumed in our analysis a high H/He ratio of 98/2. In any case, we complemented the analysis by assuming a low H/He concentration of 90/10. This results, as expected, in significantly warmer temperatures and lower mass-loss rates (see Fig. 4b, black dotted line and symbols). These temperatures and mass-loss rates can be considered as extreme values, although we think, based on other planets results, that they are unlikely, and we propose the range described above for the nominal model.
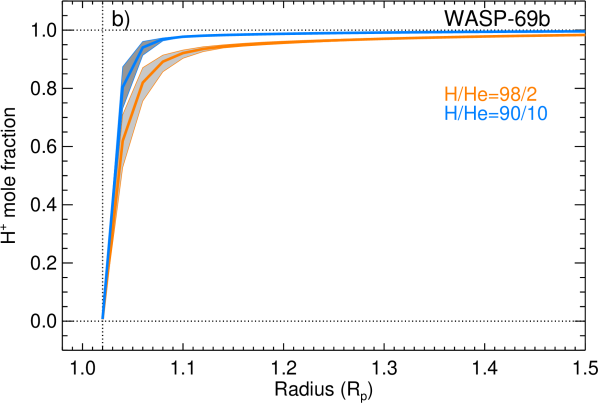
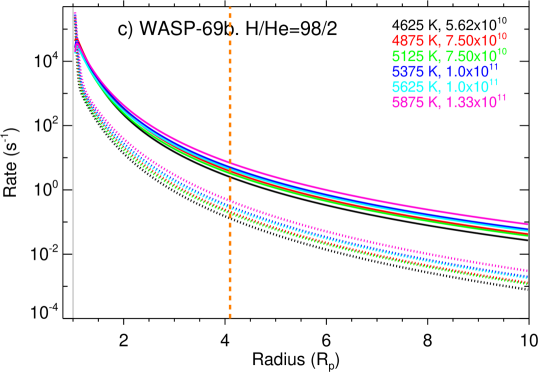
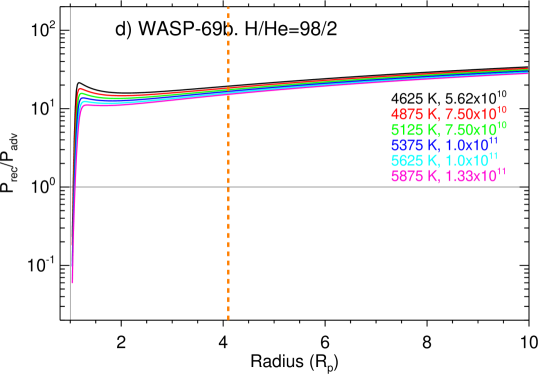
Our results show that the He(23S) density distribution of WASP-69 b is rather spatially confined, peaking at the lower boundary of the model (i.e. at the base of the upper atmosphere) and decreasing by about two orders of magnitude near 4 (see Fig. 16b). The outflow is almost completely ionised in the upper atmosphere, with a narrow ionization front (see Fig. 5b). The H0 production is dominated by recombination in practically the entire upper atmosphere (see second row of panels in Fig. 7), and the heating efficiency is very low, 0.02 0.01, which indicates a significant radiative cooling of the gas. Thus, we conclude that WASP-69 b is in the recombination-limited (RL) regime.
4.2.2 Discussion on WASP-69 b
In this section we compare our results with those derived from previous works. Vissapragada et al. (2020) observed the He(23S) absorption using ultra-narrow band photometry. From these observations, which agree well with those of Nortmann et al. (2018) analysed here, they constrained and using a 1D isothermal Parker wind model (Oklopčić & Hirata, 2018) and assuming a solar-like H/He ratio (90/10). For that H/He ratio, our mass-loss rates are about 30% higher than those derived by Vissapragada et al. (2020) for a given temperature in the range of 5000-10 000 K. Therefore, despite analysing different He(23S) measurements from different observational techniques (spectroscopic and photometric) and using different stellar fluxes, our results are in reasonable agreement. Vissapragada et al. (2020) did not constrain the - range; more recently, Vissapragada et al. (2022), still maintaining a H/He=90/10, imposed constraints by studying its maximum mass-loss efficiency. Our constrained - range is consistent with their estimations, as they found that the outflow must be cooler than 14 000 K and that 31011 g s-1. Interestingly, in contrast to Nortmann et al. (2018), Vissapragada et al. (2022) found no evidence of a tail in the post-transit, which is probably due to the wide bandpass they used. Our derived range of -, however, also accounts for this case of not having a tail.
Wang & Dai (2021) analysed the He(23S) measurements reported by Nortmann et al. (2018) and Vissapragada et al. (2020) using a 3D model. Assuming a H/He ratio of 91/9, they derived a mass-loss rate of 1011 g s-1 and a maximum temperature of 9000 K. Our results for a similar H/He yield a mass-loss rate of about half of their value. However, when we consider a H/He of 98/2 which, as discussed above, seems to be more likely, we obtain a very similar mass-loss rate. However, the temperature we obtain is lower. For a H/He ratio of 98/2 we found a temperature in the range 5000–6000 K and for H/He=90/10 we found 5500–7500 K, which are lower than their maximum temperature.
Khalafinejad et al. (2021), by combining low- and high-resolution measurements in the visible including the Na lines, obtained a thermospheric temperature of 60003000 K for this planet. Their analysis suggests that the Na lines are probing pressures lower than the millibar region, which is at the lower boundary of our hydrodynamic model. Their temperatures are thus consistent with the temperature range of 5250750 K obtained here.
In summary, we found that non-radial winds and turbulence significantly broaden the He(23S) absorption line in this planet. The H/He ratio cannot be constrained as H0 observations are not available for WASP-69 b. Nevertheless, we constrained in the range (0.9 0.5)1011 g s-1 and temperature in the range 5250 750 K, assuming a likely H/He ratio of 98/2.
4.3 GJ 1214 b
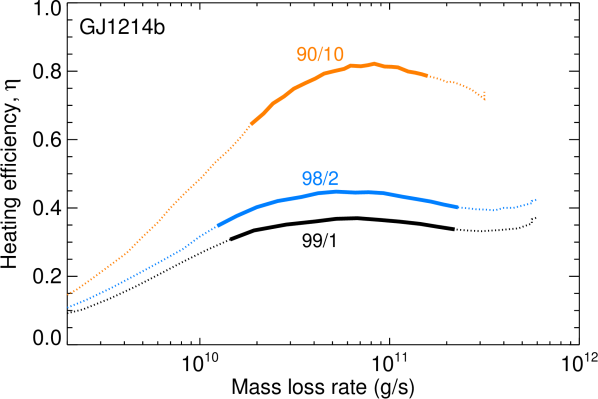
For most of the planets that we have studied so far (HD 209458 b, HD 189733 b, GJ 3470 b, and HAT-P-32 b), we determined the H/He ratio using the H0 distribution derived from either Ly or H observations. For this planet, no such observations are available. In this case we therefore tried to put some constraints on that ratio based on arguments of heating efficiency. We found that the outflows derived from the He(23S) absorption when considering a H/He ratio of 90/10 requires a very high heating efficiency, , while those obtained with higher H/He ratios require much more moderate values of . Figure 8 shows the heating efficiency of GJ 1214 b for H/He ratios of 90/10, 98/2, and 99/1 (see Sect. 3.5, Eq. 1), where it is worth noting that decreases when the H/He ratio increases. Then, by calculating the upper limit of we constrained the H/He ratio. The maximum heating efficiency, , is given by (see Appendix B)
| (2) |
where and E0 are respectively the ionisation frequency and the ionisation energy of hydrogen in the ground state (i.e. E0 = 13.6 eV); = ; and I() is the irradiation at the top of the upper atmosphere in photons s-1 cm-2 Hz-1 (calculated from Fig. 2). From Eq. 2 we obtained 0.53 and, by comparison with the values obtained for different H/He ratios (see Fig. 8), we conclude that H/He 98/2 for this planet. We note that including processes such as the He photo-ionisation energy loss and the radiative cooling and accounting for ionising photons not absorbed by the upper atmosphere, could reduce the value of (see Appendix B and e.g. Shematovich et al., 2014; Vissapragada et al., 2022). However, to constrain the H/He ratio, we prefer to be conservative and use a higher upper limit, only dependent on ().
As the atmosphere of GJ 1214 b is very extended (see Fig. 16), we conducted a test by extending the upper boundary of the model from the nominal value of 20 to 40 . We found, however, no significant changes in our constrained - range, as the extra absorption produced is negligible. Furthermore, for this planet, the turbulence does not significantly broaden the He(23S) line, as the widening introduced by the high gas radial outflow velocities clearly dominates. Therefore, this parameter does not help to constrain the - degeneracy in GJ 1214 b.
The temperature and mass-loss rates obtained for GJ 1214 b are shown in Fig. 4c. We derived temperatures in the range of 3000–4500 K and in the interval of (0.2–2.4) 1011 g s-1, which means that, due to the rather steep gradient of the derived - curve, the uncertainty in the mass-loss rate is rather large. We note that some of the reduced values obtained for this planet (and for WASP-76 b; see Sect. 4.4 and Fig. 4d) are smaller than unity. This is likely caused by a too conservative estimation of the absorption errors for these planets. We checked that rescaling the errors does not significantly change the derived temperatures and mass-loss rates. Regarding the potential effects of the SW for this planet, only assuming the fast solar wind would yield a significant change (a factor between four and two) in the range (0.8–4.0) 1011 g s-1.
As mentioned above, Orell-Miquel et al. (2022) reported a tentative detection of the He(23S) signal, and later Spake et al. (2022) could not confirm it, reporting an upper limit of 1.22% for the He triplet absorption. If we consider this upper limit we would derive a mass-loss rate of about 0.2 1011 g s-1 for a temperature of 3500 K, which is about a factor of two smaller. The escape regime, however, is not affected.
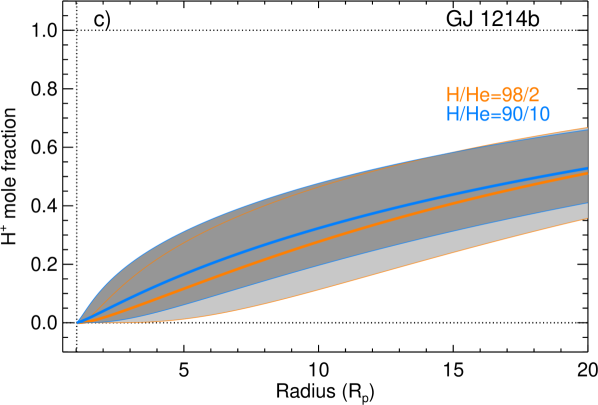
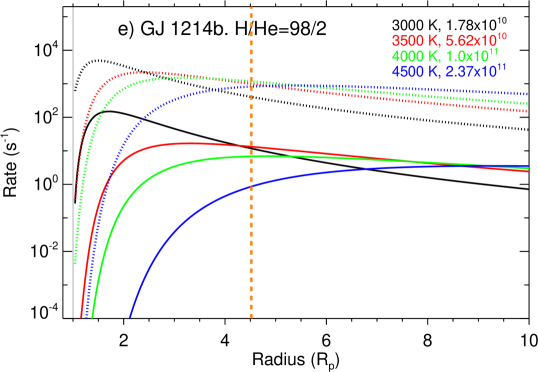
Figure 5c shows that the ionisation front of this planet is very extended, occupying the whole upper atmosphere. Advection dominates over recombination (see Fig. 7e and Fig. 7f) and the heating efficiency is 0.43 0.03 for a H/He range of 98/2 (see Fig. 8). We conclude that GJ 1214 b is in the photon-limited regime, which supports the result obtained by Orell-Miquel et al. (2022).
4.4 WASP-76 b
The He(23S) signal obtained by Casasayas-Barris et al. (2021) is rather weak and affected by telluric contamination close to the stronger He(23S) lines. The absorption of about 0.5% is to be considered an upper limit. In addition, the He(23S) signal was found to be redshifted, which is uncommon compared with the rest of He(23S) observations. Further, this planet is an ultra-hot Jupiter, strongly irradiated in the XUV. Hence, for all these reasons the analysis of the He(23S) signal is important in order to better understand the escape from gas giants.
As suggested from the observations, we included in the calculations of the line absorption a blueshifted component, at 33 km s-1 and a redshifted component at 12 km s-1 with respective fractions of 40% and 30% of the upper atmosphere (sectors of 0.8 and 0.6 rad, see Eq. 17 in Lampón et al., 2020). The results on the temperature and mass-loss rates obtained for WASP-76 b are shown in Fig. 4d. Because of the larger errors of the absorption (see Fig. 1d), the temperature and mass-loss rate are poorly constrained. Thus, the temperature is constrained from 6000 K to 17000 K, and the mass-loss rate spans from 2 to 45 1011 g s-1 (see Fig. 4d). If we consider confidence levels in the of 90% and 68% instead of 95%, the upper values are reduced to 15 000 K and 12 000 K for temperature and to 30 1011 g s-1 and 20 1011 g s-1 for , respectively. The H/He ratio for its atmosphere has not been determined. The analysis of H by Tabernero et al. (2021) was inconclusive. Here we used a H/He ratio of 98/2, in line with the values obtained for several other planets (see discussion in Sect. 3.5). Thus, because of the H/He uncertainty, the ranges of errors in the temperature and mass-loss rates reported above might be underestimated.
As described in Sect. 3.3, the stellar flux density used for this planet is an upper limit, and hence we tested how the derived temperatures and mass-loss rates would be affected by uncertainties in the flux density. According to our analysis (see Sanz-Forcada et al., 2022, in prep. for more details), a reasonably lower limit is given by a reduction by a factor of 4 with respect to the nominal irradiation. The use of the reduced flux has minor effects on the derived temperatures and mass loss rates (see red dots in Fig. 4d). The upper values have not changed and only the lower limit of the has been reduced from 2 to 1.5 1011 g s-1. It is interesting though to understand why the mass-loss rates are lower for the reduced flux. By inspection of the He(23S) concentration (Fig. 9) we observe that it is reduced at low altitudes, which is expected as for a lower flux density the electron and He+ densities are smaller. However, at larger radii the concentration is higher. This is a consequence of the higher density for the reduced flux. This means that for a fixed temperature and mass-loss rate, decreasing the irradiating flux leads to fewer ions and electrons, and hence to a higher mean molecular weight, which yields a lower velocity of the gas giving rise to a higher density, and hence to higher He and He(23S) concentrations. Overall, this effect dominates over the decrease in the concentration at low altitudes in the absorption, leading to the counterintuitive result of having a larger absorption for the weaker flux. Further, to compensate for the stronger absorption we require a lower mass-loss rate in Fig. 4d. We note that for HD 189733 b (see Sect. 4.5 below), a planet with a more compressed atmosphere, the opposite behaviour occurs, with the absorption in the inner layers dominating.
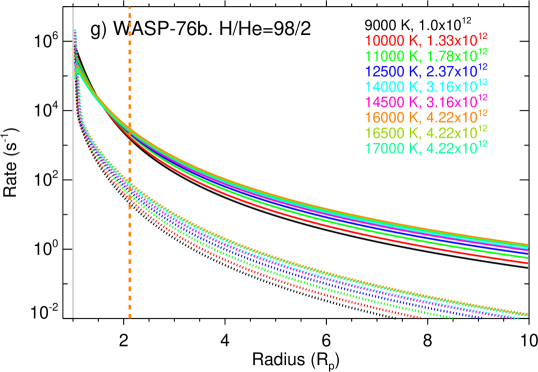
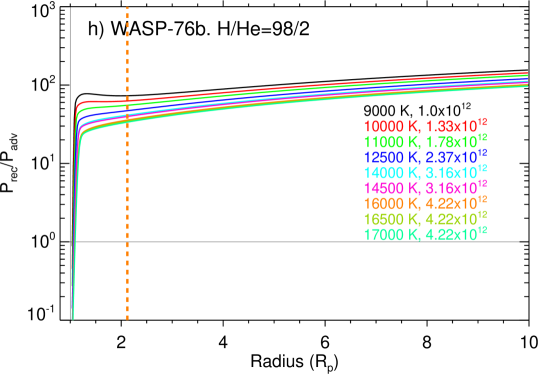
Although the mass-loss rate is poorly constrained, and temperature and H/He are essentially unconstrained, we can derive the hydrodynamic escape regime of WASP-76 b. Figures 5d, 7g and 7h, and 14 show that the upper atmosphere is strongly ionised; 1 in almost the entire upper atmosphere; and the heating efficiency is very low, 0.039 0.036, which shows that this planet is in the RL regime (see Sect. 3.6). We should note that for temperatures higher than 18 500 K the planet is between the RL and the EL regimes. For a H/He of 90/10, the results (not shown) are similar, and its hydrodynamic escape regime would not be altered.
4.5 Reanalysis of GJ 3470 b and HD 189733 b
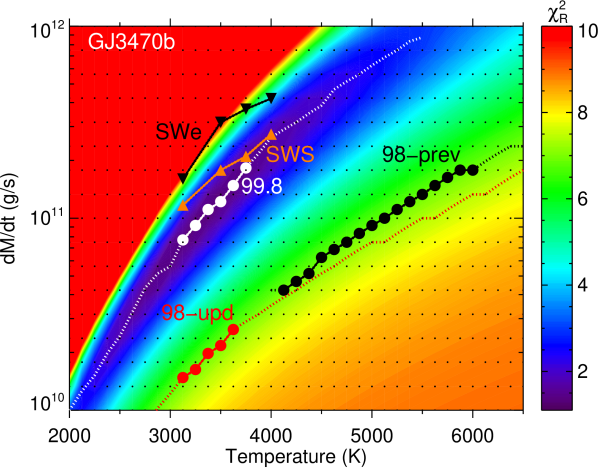
The He(23S) transmission absorption of GJ 3470 b observed by Pallé et al. (2020) was studied by Lampón et al. (2021a) assuming that the mid-transit transmission spectrum corresponds to the average from T2 to T3 contacts. This approximation, however, might not be accurate (see e.g. Dos Santos et al., 2022). This, together with the fact that the atmosphere of this planet is very extended, and that the XUV stellar flux has been revised (see Sect. 3.3 and Fig. 3), might significantly alter the constrained temperatures and mass-loss rates.
Here, we reanalysed GJ 3470 b using the same methods used by Lampón et al. (2021a), but considering that the measured spectrum is the average for the T2-T3 contacts and also by considering a more-extended atmosphere with an upper boundary of 30 . The latter was included in order to assure that it covers the whole stellar disc at any transit phase. Using higher upper boundaries does not significantly affect our results. The revision of the H/He concentration was also necessary in order to fit the H0 concentration obtained in the new calculations with that derived from Ly measurements.
Figure 10 shows the derived - range and the - range constrained by Lampón et al. (2021b). In the reanalysis, we found significantly colder temperatures, in the range of 3400350 K, although the mass-loss rate, in the range of (1.3 0.6)1011 g s-1, is practically the same. As mentioned before, in order to fit the H0 distribution in the revision we have to change the H/He concentration to 99.8/0.2, higher than that of 98/2 derived by Lampón et al. (2021b). In this revision we also evaluated the effects of the stellar winds (SW). Their impact on the – are small for the fast solar wind case; however, they are significant ( 2 times larger) when considering the scaled SW (see black and orange triangles in Fig. 10).
The heating efficiency, which is in the range of 0.11–0.12, is slightly lower. The hydrodynamic regime, however, did not change and our results still support that GJ 3470 b is in the photon-limited regime.
| Planet | HD 209458 b | HD 189733 b | GJ 3470 b | GJ 1214 b | WASP-69 b | WASP-76 b | HAT-P-32 b |
|---|---|---|---|---|---|---|---|
| Mass () | 0.685 | 1.162 | 0.036 | 0.026 | 0.260 | 0.894 | 0.585 |
| Radius () | 1.359 | 1.230 | 0.36 | 0.245 | 1.057 | 1.854 | 1.789 |
| () (a) | 0.504 | 0.944 | 0.100 | 0.105 | 0.246 | 0.482 | 0.327 |
| () (b) | 4.2 | 4.2 | 5.8 | 4.52 | 4.1 | 2.12 | 2.14 |
| (c) | 2.4 | 25.4 | 3.7 | 0.64 | 23.2 | 145.6 | 417.4 |
| EW (mÅ) (d) | 5.30.5 | 12.70.4 | 20.71.3 | 33.23.8 | 28.30.9 | 12.41.7 | 1144 |
| H/He | 98/2 | (99.2/0.8)0.1 | 99.8/0.2 | 98/2 | – | – | 99/1 |
| (1011g s-1) (e) | 0.7 0.3 | 1.4 0.5 | 1.3 0.6 | 1.3 1.1 | 0.9 0.5 | 23.5 21.5 | 130 70 |
| (K) (e) | 7600 500 | 12 700 900 | 3400 350 | 3750 750 | 5250 750 | 11 500 5500 | 12 400 2900 |
| (e) | 0.15 0.05 | 0.03 0.01 | 0.115 0.005 | 0.43 0.03 | 0.02 0.01 | 0.039 0.036 | 0.017 0.003 |
| (f) | 1.0 | 0.04 | 1.58 | 1.80 | 0.45 | 0.33 | 1.44 |
| HER (g) | EL | RL | PL | PL | RL | RL | RL |
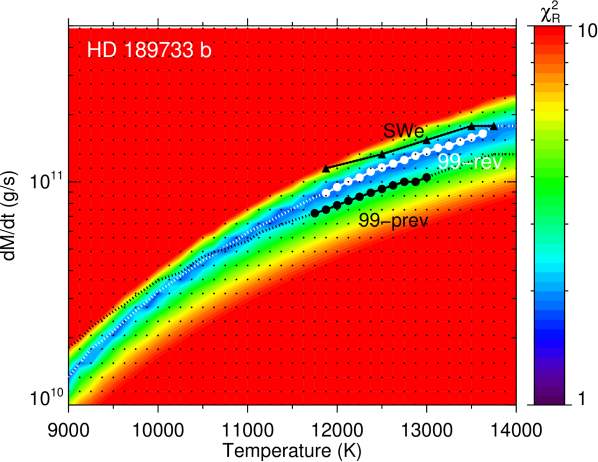
We studied HD 189733 b before (Lampón et al., 2021b), but since the XUV flux density of its host star has been recently revised (see Sect. 3.3 and Fig. 3), and we perform a homogeneous analysis of seven planets in Sect. 5, we redid the analysis. The revised flux is significantly lower, by a factor from two to three at wavelengths between 250 Å and 1200 Å. However, the effect of this change in the derived and temperature is of a different sign than for the case of WASP-76 b discussed above. HD 189733 b has a more compressed atmosphere and hence the effect of changing the flux on the absorption of the inner layers dominates over that in the outer layers (see Fig. 9). As a consequence, in this planet the derived mass-loss rate and temperature increase when considering the weaker XUV flux. The effects, however, are not large (see Fig. 11): the mass-loss rate has increased by a factor of 1.5 and the upper value of the temperature by about 500 K. Regarding the impact of the SW, only the more strongly scaled SW slightly shifts the towards slightly larger values (no more than a factor of 1.3) (see black triangles in Fig. 11).
5 Discussion
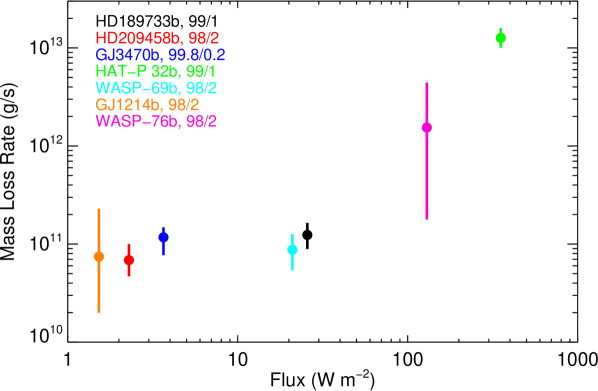
5.1 Mass-loss rates and temperatures
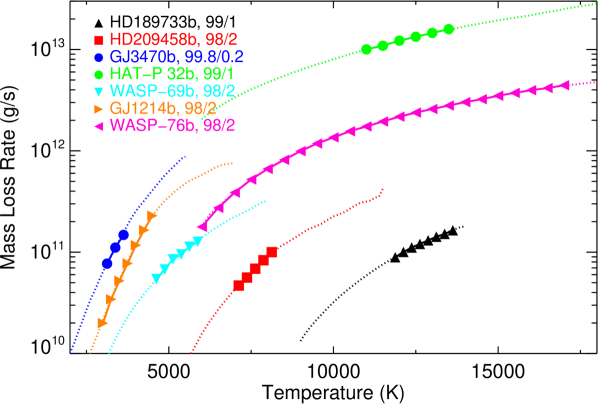
Figure 12 shows the – ranges derived for the planets we analysed, HD 209458 b, HD 189733 b, GJ 3470 b, HAT-P-32 b, WASP-69 b, WASP-76 b, and GJ 1214 b. On the one hand, five planets show very similar mass-loss rates around 1011 g s-1(GJ 3470 b, GJ 1214 b, WASP-69 b, HD 209458 b, and HD 189733 b), but with a wide range of temperatures; another two, WASP-76 b and HAT-P-32 b, have mass-loss rates about one and two orders of magnitude higher, respectively. The higher mass-loss rates of the latter seem to be caused by their high XUV irradiation (they received the highest fluxes, see Table 6 and Fig. 13), in line with Eq. 1. The former five planets received, however, significantly different XUV fluxes. HD 189733 b and WASP-69 b have the third and fourth highest XUV fluxes. Hence, it is reasonable that they also evaporate at a high , although not as high as WASP-76 b and HAT-P-32 b. GJ 3470 b, GJ 1214 b, and HD 209458 b seem to be the exceptions since they are irradiated at significantly lower XUV fluxes. However, GJ 3470 b and GJ 1214 b have the lowest gravitational potentials, which, following Eq. 1, could well explain their relatively high evaporation rates. With a low gravitational potential for retaining their expanding upper atmospheres, they exhibit anomalously high mass-loss rates for the XUV flux at which they are irradiated (see e.g. Salz et al., 2018). The archetypal planet HD 209458 b does not fit, however, in that reasoning. Its mass-loss rate is rather high, although it is irradiated with a very low XUV flux and its gravitational potential is relatively large. The reason seems to be that HD 209458 b has a relatively large , larger than GJ 3470 b and GJ 1214 b, which makes the absorption of the stellar radiation more efficient (the effective area is ), and thus compensates for its low XUV irradiation and stronger gravitational potential (see Eq. 1).
In extremely irradiated planets (i.e. HAT-P-32 b and WASP-76 b) the temperature is correlated with the flux density. However, for moderately irradiated planets (i.e. GJ 3470 b, GJ 1214 b, WASP-69 b, HD 209458 b, and HD 189733 b) it better correlates with the gravitational potential: the higher the gravitational potential, the higher the temperature maximum of the atmosphere (Figs. 12 and 13). We recall that the temperature we derived here is very close to the maximum of the thermospheric temperature obtained by more sophisticated hydrodynamic models that take into account the energy balance equation (see Sect. 3.1 in Lampón et al., 2020). Our results agree very well with those of Salz et al. (2016), who found that the level of irradiation affects the maximum temperature of the atmosphere only marginally. Instead, the temperature correlates well with the gravitational potential as a stronger adiabatic cooling is produced by a faster expansion of the outflow in a lower gravitational potential, and hence a lower maximum temperature.
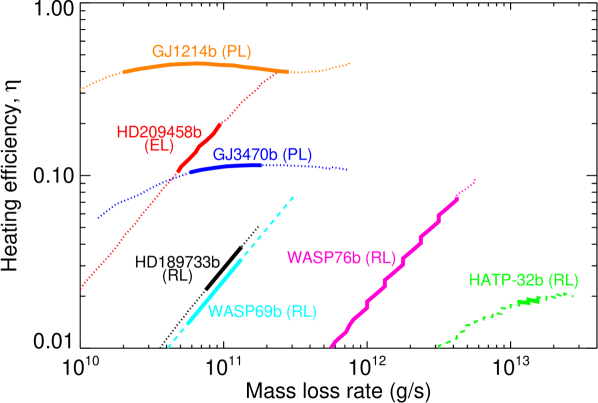
5.2 Heating efficiency and hydrodynamic regime
The heating efficiency is a very useful quantity for understanding the energy budget and the evaporation (including their hydrodynamic escape regime) of gaseous planets. In Fig. 14 we show the heating efficiencies, , for the seven studied planets using Eq. 1,
| (3) |
with their derived mass-loss rates. Four planets (HAT-P-32 b, WASP-76 b, WASP-69 b, and HD 189733 b) have low heating efficiencies, below 0.1, and all of them received high XUV fluxes (see Fig. 13). That is, planets that are strongly irradiated in the XUV tend to have low heating efficiencies (see Eq. 3). It may appear surprising that an external quantity such as the XUV flux can alter the planet’s heating efficiency. This can be understood by noting that the XUV irradiance can actually change the density structure of the planet’s upper atmosphere, and hence the location and slope of the ionisation fronts and, in consequence, the heating efficiency (see the discussion above for WASP-76 b in Sect. 4.4 and e.g. Murray-Clay et al., 2009, and Owen & Alvarez 2016). The other three planets, GJ 1214 b, HD 209458 b, and GJ 3470 b, are more weakly irradiated (see Fig. 13) and hence they are more efficient in thermalising the XUV flux.
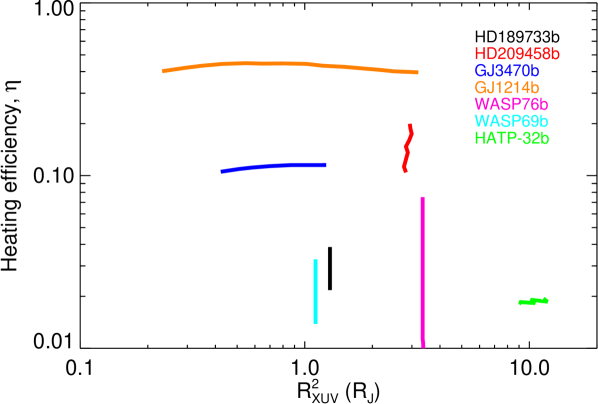
Another factor affecting the heating efficiency is , as is inversely proportional to its square (see Eq. 3). Thus, the planets with large , HAT-P-32 b and WASP-76 b, have low heating efficiencies, and those with smaller (GJ 3470 b, GJ 1214 b) have large efficiencies (see Fig. 15). HD 189733 b and WASP-69 b exhibit low heating efficiencies despite their smaller because of their still high irradiation levels (compared with HAT-P-32 b and WASP-76 b, see Fig. 13), just the opposite of HD 209458 b, which shows a high heating efficiency due to a low irradiation flux, despite its high .
The heating efficiency is also closely related to the hydrodynamic escape regime. As discussed above in Sect. 3.6, planets with very low heating efficiency, 0.1, are in the recombination-limited (RL) regime, and planets with 0.1 are in either the energy-limited (EL) or the photon-limited (PL) regimes. Further, a high , if nearly constant with , is indicative of the PL regime. Thus, HAT-P-32 b, WASP-76 b, WASP-69 b, and HD 189733 b, all highly irradiated, are in the RL regime (see Fig. 14). HD 209458 b, on one hand, and GJ 3470 b and GJ 1214 b, on the other, more moderately irradiated, are in the EL and PL regimes, respectively. Our results are in agreement with the predictions of Owen & Alvarez (2016). Generally, highly irradiated planets would be in the RL regime, while planets with low irradiation would be in the EL regime if their gravitational potential is deep and in the PL regime if their gravitational potential is shallow.
5.3 Relationship of the heating efficiency with H/He.
We also studied the dependence of the heating efficiency on the value of the H/He ratio. We found that for HD 189733 b, WASP-69 b, and WASP-76 b the heating efficiency increases with the H/He ratio, while it decreases for GJ 3470 b, GJ 1214 b, and HAT-P-32 b (see e.g. Fig. 8 for GJ1214 b). This can be explained by looking at the relationship between , , and the H/He ratio. For a given temperature, as the H/He ratio increases, increases for all planets (see e.g. Fig. 4). In HD 189733 b, WASP-69 b, and WASP-76 b, does not significantly change with the H/He ratio (see Fig. 5 for WASP-69 b and WASP-76 b, and Fig. 8 from Lampón et al. (2021b) for HD 189733 b). Thus, according to Eq. 3, where , increases with the H/He ratio for these planets. For GJ 3470 b, GJ 1214 b, and HAT-P-32 b, however, significantly increases with the H/He ratio (see Figs. 6 and 5 for HAT-P-32 b, and Fig. 8 from Lampón et al. (2021b) for GJ 3470 b), with increasing in higher proportion than the mass-loss rate, and hence decreases.
Thus, this - H/He relationship is useful for constraining the H/He ratio. Assuming an upper limit for the heating efficiency allows us to constrain the H/He ratio, as we did for GJ 1214 b (see Sect. 4.3). Constraining the H/He ratio with this approach is mainly relevant for planets in the PL and EL regimes as heating efficiencies are significantly higher than for those in the RL regime (see Fig. 14). Actually, we could not apply this approach to WASP-69 b and WASP-76 b (both in the RL regime).
6 Summary
In this work, we characterised the upper atmospheres of four exoplanets undergoing photo-evaporation, the hot Jupiters HAT-P-32 b and WASP-69 b, the warm sub-Neptune GJ 1214 b, and the ultra-hot Jupiter WASP-76 b, through high-resolution measurements of their He i triplet. In addition, we also reanalysed the warm Neptune GJ 3470 b and the hot Jupiter HD 189733 b.
We used a 1D spherically symmetric hydrodynamic model, suitable for performing an extensive parameter study. The hydrodynamic model is coupled with a non-LTE code for deriving the He triplet distribution of the escaping outflow. Our 1D model does not account for some parameters that might affect the strength of the He(23S) absorption signal, being the stellar wind the most important. In order to gauge its potential impact, we estimated its effect on the derived temperatures and mass-loss rate. Applying a radiative transfer model to the transit geometry, we computed the synthetic spectra. By comparing our calculations with observations, we constrained the main atmospheric parameters of the escape, namely the mass-loss rate, the thermospheric temperature, and the H/He ratio. Additionally, by studying the processes dominating the production of the neutral H and the heating efficiency in the outflow, we classified these planets by their hydrodynamic escape regimes: energy-limited (EL), recombination-limited (RL), or photon-limited (PL).
For HAT-P-32 b we analysed the He(23S) absorption together with the H measurements reported by Czesla et al. (2022). The H absorption helps to constrain the H/He ratio in addition to the temperature and mass-loss rate. Our results show that HAT-P-32 b photo-evaporates at (130 70)1011 g s-1 under a very high XUV irradiation, which considerably heats its upper atmosphere to 12 400 2900 K. As recombination dominates in almost its entire upper atmosphere, the derived heating efficiency is low (0.017 0.003) and the ionisation profile is very sharp, and hence we derived that HAT-P-32 b is in the recombination-limited (RL) regime. Further, we also constrained the H/He ratio of the outflow to the high value of (99.0/1.0).
We found that WASP-69 b is losing its atmosphere with a mass-loss rate of (0.9 0.5)1011 g s-1, at hot temperatures, 5250 750 K, assuming a likely H/He ratio of 98/2. As there are no observations of H0 lines for this planet, we could not constrain its H/He ratio. Therefore, we assumed such a high value based on the fact that most of the observed planets so far present large H/He ratios. In this planet recombination dominates over advection in practically the entire upper atmosphere, and hence it is in the RL regime. Further, we found a low heating efficiency of 0.02 0.01, in accordance with its regime.
The weak absorption of WASP-76 b prevents us from determining an accurate constraint of its temperature and mass-loss rate. Moreover, as for WASP-69 b, we could not constrain the H/He ratio. By assuming a H/He of 98/2, we obtained a constrained narrow region of related temperatures and mass-loss rates, although with rather broad ranges of both parameters, 6000-17 000 K and (2-45)1011 g s-1. As in HAT-P-32 b and WASP-69 b, this planet undergoes hydrodynamic escape in the RL regime, with a heating efficiency of 0.039 0.036.
As for WASP-69 b and WASP-76 b, there are no available measurements of H0 lines in GJ 1214 b. However, due to the strong variation in the heating efficiency with respect to the H/He ratio for this planet, we could constrain the H/He ratio by calculating an upper limit for the heating efficiency. This method is relevant for planets in the PL and EL regimes, as their heating efficiencies are significantly higher than those in the RL regime, and it is especially valuable when we have no observations of the H0 lines. When applied to this planet we found a H/He ratio in the range of 98/2–99/1. This planet has a light upper atmosphere that photo-evaporates at (1.3 1.1) 1011 g s-1; a relatively low temperature, 3750 750 K; and high heating efficiency, in the range of 0.43 0.03. In its outflow advection dominates over recombination in the entire upper atmosphere, and hence this planet is in the photon-limited (PL) regime.
We also reanalysed GJ 3470 b, for which a new stellar flux is available. We used the same methods as Lampón et al. (2021b), but took into account that the measured absorption spectrum is the average for the T2-T3 contacts, instead of the mid-transit spectrum, considering also a higher upper boundary and the new stellar flux. Comparing our results with Lampón et al. (2021b), we found lower temperatures, in the range of 3400 350 K. Nevertheless, the new mass-loss rate, in the range of (1.3 0.6)1011 g s-1, is practically the same. The H/He ratio of 99.8/0.2 is higher, and the heating efficiency, 0.115 0.005, is slightly lower. The hydrodynamic regime did not change; that is, GJ 3470 b is in the PL regime.
We also reanalysed HD 189733 b, as the XUV density flux has been updated. The effects are, however, relatively small (see Fig. 11). With respect to our previous analysis (Lampón et al., 2021b) its mass-loss rate increased by a factor of 1.5 and the temperature by about 500 K.
Our results from the homogeneous analysis of this sample of planets suggest that: (i) extremely irradiated planets, HAT-P-32 b and WASP-76 b, show very high mass-loss rates and temperatures; (ii) moderately irradiated planets, HD 209458 b, HD 189733 b, GJ 3470 b, WASP-69 b, and GJ 1214 b, show comparable mass-loss rates (for GJ 3470 b and GJ 1214 b their low XUV irradiations are compensated by their low gravitational potentials, while HD 209458 b with its high ); and (iii) moderately irradiated planets have very different temperatures that correlate with their gravitational potential. These findings are generally in line with the expected results of the current hydrodynamic escape models (e.g., Salz et al., 2016, 2018; Owen et al., 2020).
Including the results of this work, four exoplanets were found to be in the recombination-limited regime (the hot Jupiters HD 189733 b, HAT-P-32 b, and WASP-69 b, and the ultra-hot Jupiter WASP-76 b) (Lampón et al., 2021a; Czesla et al., 2022, and this work), four in the PL regime (the Neptune GJ 3470 b, and the sub-Neptunes GJ 1214 b, HD 63433 b, and HD 63433 c) (Lampón et al., 2021b; Orell-Miquel et al., 2022; Zhang et al., 2022b), and only one in the energy-limited regime (the hot Jupiter HD 209458 b) (Lampón et al., 2021b). Hot and ultra-hot Jupiters are mainly in the recombination-limited regime (with the exception of HD 209458 b, which is more weakly irradiated at XUV wavelengths), while warm Neptunes and sub-Neptunes, with XUV fluxes weaker than those of the hot and ultra-hot Jupiters, are in the photo-limited regime (see Table 6). These results are in good agreement with the predictions of Owen & Alvarez (2016). They predicted that the planets irradiated at low levels (3 W m-2) in the XUV are mostly in either the energy-limited (those with large gravitational potential) or in the photon-limited regime (those with weak gravitational potential). Here we found that of the three planets studied with low flux, one (HD 209458 b) is in EL and two (the Neptune GJ 3470 b and the sub-Neptune GJ 1214 b) are in PL; the former have a significantly larger gravitational potential than the latter. In addition, Murray-Clay et al. (2009) and Owen & Alvarez (2016) found that those planets irradiated at high levels (e.g. 300 W m-2) are mostly in the recombination-limited scenario, as we have found for the hot Jupiters HD 189733 b, HAT-P-32 b, and WASP-69 b and for the ultra-hot Jupiter WASP-76 b.
The H/He ratios derived in this work support the hypothesis that hydrodynamic escape outflows tend to have very low mean molecular weight, as suggested by Lampón et al. (2021a). The five planets for which we derived the H/He concentration, HD 209458 b, HD 189733 b, GJ 3470 b, HAT-P-32 b, and GJ 1214 b, all have a H/He ratio 98/2. In addition to these, WASP-52 b, HAT-P-11 b, and WASP-80 b, have also been reported with a high H/He ratio (Yan et al., 2022; Dos Santos et al., 2022; Fossati et al., 2022, respectively). Only WASP-107 b has been reported with a solar-like value (H/He in the range of 87/13-93/7, Khodachenko et al., 2021). There is no obvious reason (e.g. gravitational potential, XUV flux or age) why this planet should have such a different H/He ratio. Measurements of Ly, H, or studies of its heating efficiency such as those performed here for GJ 1214 b, would be very interesting for corroborating its low H/He ratio.
Future confirmation of He triplet observations in WASP-76 b and GJ 1214 b are crucial for supporting our conclusions about both exoplanets. On the other hand, as the H/He ratio is key for testing the trend of outflows with very low mean molecular weight, and for reducing the degeneracy in the mass-loss rate and temperature, future observations of H0 lines in WASP-69 b and WASP-76 b would be very valuable in order to constrain this parameter. Further, to fill the different scenarios of hydrodynamic escape regimes, it would be interesting to observe other massive planets () weakly irradiated in the XUV, which might prove to be in the recombination-limited regime, and Neptunes or sub-Neptunes with strong XUV flux densities, which are predicted to be in the energy-limited or recombination-limited regime (Owen & Alvarez, 2016).
Acknowledgements.
We thank the referee for very useful comments. We are grateful to Antonio García Muñoz for his very fruitful comments on the manuscript. CARMENES is an instrument for the Centro Astronómico Hispano-Alemán (CAHA) at Calar Alto (Almería, Spain), operated jointly by the Junta de Andalucía and the Instituto de Astrofísica de Andalucía (CSIC). CARMENES was funded by the Max-Planck-Gesellschaft (MPG), the Consejo Superior de Investigaciones Científicas (CSIC), the Ministerio de Economía y Competitividad (MINECO) and the European Regional Development Fund (ERDF) through projects FICTS-2011-02, ICTS-2017-07-CAHA-4, and CAHA16-CE-3978, and the members of the CARMENES Consortium (Max-Planck-Institut für Astronomie, Instituto de Astrofísica de Andalucía, Landessternwarte Königstuhl, Institut de Ciències de l’Espai, Institut für Astrophysik Göttingen, Universidad Complutense de Madrid, Thüringer Landessternwarte Tautenburg, Instituto de Astrofísica de Canarias, Hamburger Sternwarte, Centro de Astrobiología and Centro Astronómico Hispano-Alemán), with additional contributions by the MINECO, the Deutsche Forschungsgemeinschaft through the Major Research Instrumentation Programme and Research Unit FOR2544 “Blue Planets around Red Stars”, the Klaus Tschira Stiftung, the states of Baden-Württemberg and Niedersachsen, and by the Junta de Andalucía. We acknowledge financial support from the State Agency for Research of the Spanish MCIU and the ERDF through projects PGC2018-099425–B–I00, PID2019-109522GB-C51/2/3/4, PGC2018-098153-B-C33, PID2019-110689RB-I00/AEI/10.13039/501100011033, and the Centre of Excellence “Severo Ochoa” and “María de Maeztu” awards to the Instituto de Astrofísica de Andalucía (SEV-2017-0709), Instituto de Astrofísica de Canarias (SEV-2015-0548), and Centro de Astrobiología (MDM-2017-0737), and the Generalitat de Catalunya/CERCA programme. A.S.L. acknowledges funding from the European Research Council under the European Union’s Horizon 2020 research and innovation program under grant agreement No 694513. K.M. acknowledges funding by the Excellence Cluster ORIGINS, funded by the Deutsche Forschungsgemeinschaft (DFG, German Research Foundation) under Germany’s Excellence Strategy -EXC-2094-390783311. T.H. acknowledges support from the European Research Council under the Horizon 2020 Framework Program via the ERC Advanced Grant Origins 832428.References
- Allart et al. (2019) Allart, R., Bourrier, V., Lovis, C., et al. 2019, A&A, 623, A58
- Allart et al. (2018) Allart, R., Bourrier, V., Lovis, C., et al. 2018, Science, 362, 1384
- Alonso-Floriano et al. (2019) Alonso-Floriano, F. J., Snellen, I. A. G., Czesla, S., et al. 2019, A&A, 629, A110
- Anderson et al. (2014) Anderson, D. R., Collier Cameron, A., Delrez, L., et al. 2014, MNRAS, 445, 1114
- Ben-Jaffel & Ballester (2013) Ben-Jaffel, L. & Ballester, G. E. 2013, A&A, 553, A52
- Berta et al. (2011) Berta, Z. K., Charbonneau, D., Bean, J., et al. 2011, ApJ, 736, 12
- Bourrier et al. (2018) Bourrier, V., Lecavelier des Etangs, A., Ehrenreich, D., et al. 2018, A&A, 620, A147
- Casasayas-Barris et al. (2021) Casasayas-Barris, N., Orell-Miquel, J., Stangret, M., et al. 2021, A&A, 654, A163
- Casasayas-Barris et al. (2018) Casasayas-Barris, N., Pallé, E., Yan, F., et al. 2018, A&A, 616, A151
- Castelli & Kurucz (2003) Castelli, F. & Kurucz, R. 2003, in IAU Symposium 210, ed. N. Piskunov, W. Weiss, & D. Gray, Vol. ASP-S210
- Chadney et al. (2015) Chadney, J. M., Galand, M., Unruh, Y. C., Koskinen, T. T., & Sanz-Forcada, J. 2015, Icarus, 250, 357
- Cloutier et al. (2021) Cloutier, R., Charbonneau, D., Deming, D., Bonfils, X., & Astudillo-Defru, N. 2021, AJ, 162, 174
- Cubillos et al. (2020) Cubillos, P. E., Fossati, L., Koskinen, T., et al. 2020, The Astronomical Journal, 159, 111
- Czesla et al. (2022) Czesla, S., Lampón, M., Sanz-Forcada, J., et al. 2022, A&A, 657, A6
- Dos Santos et al. (2022) Dos Santos, L. A., Vidotto, A. A., Vissapragada, S., et al. 2022, A&A, 659, A62
- Eggleton (1983) Eggleton, P. P. 1983, ApJ, 268, 368
- Ehrenreich et al. (2011) Ehrenreich, D., Lecavelier Des Etangs, A., & Delfosse, X. 2011, A&A, 529, A80
- Ehrenreich et al. (2020) Ehrenreich, D., Lovis, C., Allart, R., et al. 2020, Nature, 580, 597
- Erkaev et al. (2007) Erkaev, N. V., Kulikov, Y. N., Lammer, H., et al. 2007, A&A, 472, 329
- Fossati et al. (2022) Fossati, L., Guilluy, G., Shaikhislamov, I. F., et al. 2022, A&A, 658, A136
- Fossati et al. (2010) Fossati, L., Haswell, C. A., Froning, C. S., et al. 2010, The Astrophysical Journal Letters, 714, L222
- Gaia Collaboration et al. (2021) Gaia Collaboration, Brown, A. G. A., Vallenari, A., et al. 2021, A&A, 649, A1
- García Muñoz et al. (2021) García Muñoz, A., Fossati, L., Youngblood, A., et al. 2021, ApJ, 907, L36
- García-Muñoz (2007) García-Muñoz, A. 2007, Planetary and Space Science, 55, 1426
- Guilluy et al. (2020) Guilluy, G., Andretta, V., Borsa, F., et al. 2020, A&A, 639, A49
- Harpsøe et al. (2013) Harpsøe, K. B. W., Hardis, S., Hinse, T. C., et al. 2013, A&A, 549, A10
- Hartman et al. (2011) Hartman, J. D., Bakos, G. Á., Torres, G., et al. 2011, ApJ, 742, 59
- Haswell et al. (2012) Haswell, C. A., Fossati, L., Ayres, T., et al. 2012, The Astrophysical Journal, 760, 79
- Hu et al. (2015) Hu, R., Seager, S., & Yung, Y. L. 2015, ApJ, 807, 8
- Jackson et al. (2012) Jackson, A. P., Davis, T. A., & Wheatley, P. J. 2012, MNRAS, 422, 2024
- Jin & Mordasini (2018) Jin, S. & Mordasini, C. 2018, ApJ, 853, 163
- Johnstone et al. (2015a) Johnstone, C. P., Güdel, M., Brott, I., & Lüftinger, T. 2015a, A&A, 577, A28
- Johnstone et al. (2015b) Johnstone, C. P., Güdel, M., Lüftinger, T., Toth, G., & Brott, I. 2015b, A&A, 577, A27
- Khalafinejad et al. (2021) Khalafinejad, S., Molaverdikhani, K., Blecic, J., et al. 2021, A&A, 656, A142
- Khodachenko et al. (2021) Khodachenko, M. L., Shaikhislamov, I. F., Fossati, L., et al. 2021, MNRAS, 503, L23
- Khodachenko et al. (2019) Khodachenko, M. L., Shaikhislamov, I. F., Lammer, H., et al. 2019, The Astrophysical Journal, 885, 67
- Khodachenko et al. (2021) Khodachenko, M. L., Shaikhislamov, I. F., Lammer, H., et al. 2021, MNRAS, 507, 3626
- Kirk et al. (2020) Kirk, J., Alam, M. K., López-Morales, M., & Zeng, L. 2020, AJ, 159, 115
- Kirk et al. (2022) Kirk, J., Santos, L. A. D., López-Morales, M., et al. 2022, AJ, 164, 24
- Kulow et al. (2014) Kulow, J. R., France, K., Linsky, J., & Parke Loyd, R. O. 2014, ApJ, 786, 132
- Lammer et al. (2020a) Lammer, H., Leitzinger, M., Scherf, M., et al. 2020a, Icarus, 339, 113551
- Lammer et al. (2020b) Lammer, H., Scherf, M., Kurokawa, H., et al. 2020b, Space Sci. Rev., 216, 74
- Lampón et al. (2020) Lampón, M., López-Puertas, M., Lara, L. M., et al. 2020, A&A, 636, A13
- Lampón et al. (2021a) Lampón, M., López-Puertas, M., Czesla, S., et al. 2021a, A&A, 648, L7
- Lampón et al. (2021b) Lampón, M., López-Puertas, M., Sanz-Forcada, J., et al. 2021b, A&A, 647, A129
- Lecavelier des Etangs et al. (2012) Lecavelier des Etangs, A., Bourrier, V., Wheatley, P. J., et al. 2012, A&A, 543, L4
- Lopez & Fortney (2013) Lopez, E. D. & Fortney, J. J. 2013, ApJ, 776, 2
- Malsky & Rogers (2020) Malsky, I. & Rogers, L. A. 2020, ApJ, 896, 48
- Mansfield et al. (2018) Mansfield, M., Bean, J. L., Oklopčić, A., et al. 2018, ApJ, 868, L34
- Mordasini (2020) Mordasini, C. 2020, A&A, 638, A52
- Muñoz & Schneider (2019) Muñoz, A. G. & Schneider, P. C. 2019, ApJ, 884, L43
- Murray-Clay et al. (2009) Murray-Clay, R. A., Chiang, E. I., & Murray, N. 2009, ApJ, 693, 23
- Ninan et al. (2020) Ninan, J. P., Stefansson, G., Mahadevan, S., et al. 2020, ApJ, 894, 97
- Nortmann et al. (2018) Nortmann, L., Palle, E., Salz, M., et al. 2018, Science, 362, 1388
- Oklopčić & Hirata (2018) Oklopčić, A. & Hirata, C. M. 2018, ApJ, 855, L11
- Orell-Miquel et al. (2022) Orell-Miquel, J., Murgas, F., Pallé, E., et al. 2022, A&A, 659, A55
- Owen & Alvarez (2016) Owen, J. E. & Alvarez, M. A. 2016, ApJ, 816, 34
- Owen et al. (2020) Owen, J. E., Shaikhislamov, I. F., Lammer, H., Fossati, L., & Khodachenko, M. L. 2020, Space Sci. Rev., 216, 129
- Owen & Wu (2013) Owen, J. E. & Wu, Y. 2013, ApJ, 775, 105
- Owen & Wu (2017) Owen, J. E. & Wu, Y. 2017, ApJ, 847, 29
- Pallé et al. (2020) Pallé, E., Nortmann, L., Casasayas-Barris, N., et al. 2020, A&A, 638, A61
- Paragas et al. (2021) Paragas, K., Vissapragada, S., Knutson, H. A., et al. 2021, ApJ Letters, 909, L10
- Quirrenbach et al. (2014) Quirrenbach, A., Amado, P. J., Caballero, J. A., et al. 2014, in Society of Photo-Optical Instrumentation Engineers (SPIE) Conference Series, Vol. 9147, Ground-based and Airborne Instrumentation for Astronomy V, ed. S. K. Ramsay, I. S. McLean, & H. Takami, 91471F
- Rumenskikh et al. (2022) Rumenskikh, M. S., Shaikhislamov, I. F., Khodachenko, M. L., et al. 2022, ApJ, 927, 238
- Salpeter (1973) Salpeter, E. E. 1973, ApJ, 181, L83
- Salz et al. (2018) Salz, M., Czesla, S., Schneider, P. C., et al. 2018, A&A, 620, A97
- Salz et al. (2016) Salz, M., Czesla, S., Schneider, P. C., & Schmitt, J. H. M. M. 2016, A&A, 586, A75
- Salz et al. (2015) Salz, M., Schneider, P. C., Czesla, S., & Schmitt, J. H. M. M. 2015, A&A, 585, L2
- Sanz-Forcada et al. (2011) Sanz-Forcada, J., Micela, G., Ribas, I., et al. 2011, A&A, 532, A6
- Seidel et al. (2020) Seidel, J. V., Ehrenreich, D., Pino, L., et al. 2020, A&A, 633, A86
- Shaikhislamov et al. (2021) Shaikhislamov, I. F., Khodachenko, M. L., Lammer, H., et al. 2021, MNRAS, 500, 1404
- Shematovich et al. (2014) Shematovich, V. I., Ionov, D. E., & Lammer, H. 2014, A&A, 571, A94
- Sing et al. (2019) Sing, D. K., Lavvas, P., Ballester, G. E., et al. 2019, The Astronomical Journal, 158, 91
- Smith et al. (2001) Smith, R. K., Brickhouse, N. S., Liedahl, D. A., & Raymond, J. C. 2001, ApJ, 556, L91
- Spake et al. (2021) Spake, J. J., Oklopčić, A., & Hillenbrand, L. A. 2021, AJ, 162, 284
- Spake et al. (2022) Spake, J. J., Oklopčić, A., Hillenbrand, L. A., et al. 2022, ApJL, 939, L11
- Spake et al. (2018) Spake, J. J., Sing, D. K., Evans, T. M., et al. 2018, Nature, 557, 68
- Stevenson (1975) Stevenson, D. J. 1975, Phys. Rev. B, 12, 3999
- Stevenson (1980) Stevenson, D. J. 1980, Science, 208, 746
- Stone & Proga (2009) Stone, J. M. & Proga, D. 2009, ApJ, 694, 205
- Tabernero et al. (2021) Tabernero, H. M., Osorio, M. R. Z., Allart, R., et al. 2021, A&A, 646, A158
- Tian et al. (2005) Tian, F., Toon, O. B., Pavlov, A. A., & De Sterck, H. 2005, ApJ, 621, 1049
- Tripathi et al. (2015) Tripathi, A., Kratter, K. M., Murray-Clay, R. A., & Krumholz, M. R. 2015, ApJ, 808, 173
- Vidal-Madjar et al. (2003) Vidal-Madjar, A., des Etangs, A. L., Désert, J.-M., et al. 2003, Nature, 422, 143
- Vidal-Madjar et al. (2004) Vidal-Madjar, A., Désert, J.-M., des Etangs, A. L., et al. 2004, ApJ, 604, 69
- Vidotto & Cleary (2020) Vidotto, A. A. & Cleary, A. 2020, Monthly Notices of the Royal Astronomical Society, 494, 2417
- Vissapragada et al. (2022) Vissapragada, S., Knutson, H. A., dos Santos, L. A., Wang, L., & Dai, F. 2022, ApJ, 927, 96
- Vissapragada et al. (2020) Vissapragada, S., Knutson, H. A., Jovanovic, N., et al. 2020, AJ, 159, 278
- Wang & Dai (2021) Wang, L. & Dai, F. 2021, ApJ, 914, 98
- Watson et al. (1981a) Watson, A. J., Donahue, T. M., & Walker, J. C. 1981a, Icarus, 48, 150
- Watson et al. (1981b) Watson, A. J., Donahue, T. M., & Walker, J. C. 1981b, Icarus, 48, 150
- West et al. (2016) West, R. G., Hellier, C., Almenara, J. M., et al. 2016, A&A, 585, A126
- Wilson & Militzer (2010) Wilson, H. F. & Militzer, B. 2010, Phys. Rev. Lett., 104, 121101
- Wyttenbach et al. (2020) Wyttenbach, A., Mollière, P., Ehrenreich, D., et al. 2020, A&A, 638, A87
- Yan et al. (2022) Yan, D., Seon, K.-i., Guo, J., Chen, G., & Li, L. 2022, ApJ, 936, 177
- Yan & Henning (2018) Yan, F. & Henning, T. 2018, Nature Astronomy, 2, 714
- Yelle (2004) Yelle, R. V. 2004, Icarus, 170, 167
- Zhang et al. (2023) Zhang, M., Knutson, H. A., Dai, F., et al. 2023, The Astronomical Journal, 165, 62
- Zhang et al. (2022a) Zhang, M., Knutson, H. A., Wang, L., Dai, F., & Barragán, O. 2022a, AJ, 163, 67
- Zhang et al. (2022b) Zhang, M., Knutson, H. A., Wang, L., et al. 2022b, AJ, 163, 68
- Zhao et al. (2014) Zhao, M., O'Rourke, J. G., Wright, J. T., et al. 2014, ApJ, 796, 115
Appendix A He(23S) concentration profiles and gas radial velocities for the different planets
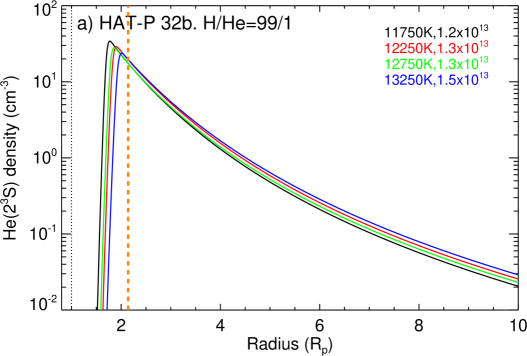

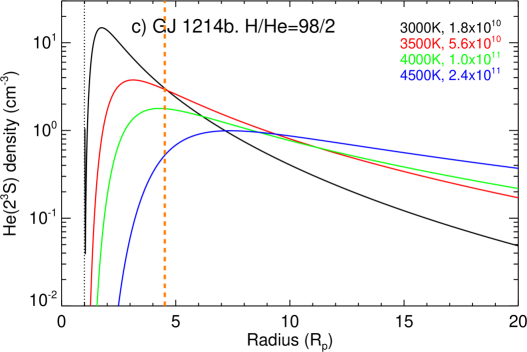
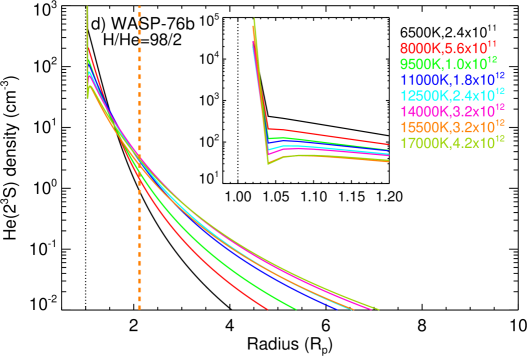
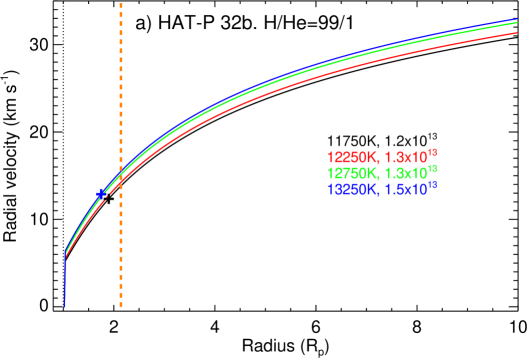

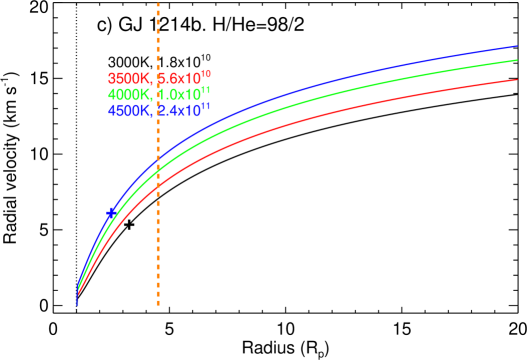
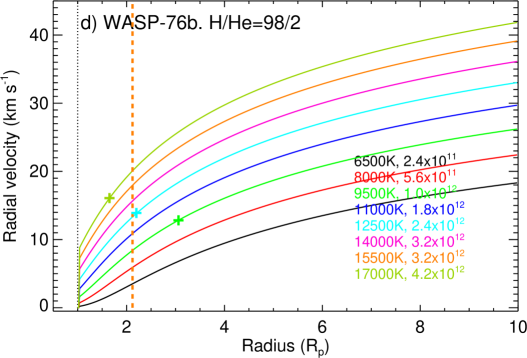
Appendix B Maximum heating efficiency
The heating efficiency can be defined as the fraction of the absorbed stellar radiative energy, W, which is converted into kinetic energy of the gas (see e.g. Lampón et al. 2021a; Shematovich et al. 2014):
| (4) |
Here is the rate of energy lost by photo-ionisation; W is the rate of energy lost by photo-electron impact processes (as excitation and ionisation of atoms by collisions with photo-electrons, see e.g. Shematovich et al. 2014); and W is the radiative cooling rate, mostly produced by Ly and free-free emissions (Salz et al. 2015). By neglecting W and W, Eq. 4 gives an upper limit of the heating efficiency:
| (5) |
Given an outflow with species and electronically excited states, W(r) can be expressed as (see Shematovich et al. 2014)
| (6) |
where is the neutral number density of species ; is the frequency corresponding to their ionisation potential; Ev is the energy of the photon at frequency ; Ek,l is the ionisation potential of the species in the excited state ; is the optical thickness; is the absorption cross-section of species ; and pk is the relative yield to form ions.
On the other hand, can be expressed as
| (7) |
where is the ionisation cross-section of species k-. Assuming every photon coming from the star ionises a ground-state hydrogen atom in the upper atmosphere, and integrating over distance (see e.g. Eq. 20 from Erkaev et al. 2007), we obtain
| (8) |
and Eq. 5 reduces to
| (9) |