Scheduling Dosage of Proton Pump Inhibitors Using Constrained Optimization With Gastric Acid Secretion Model
Abstract
Dosage schedule of the Proton Pump Inhibitors (PPIs) is critical for gastric acid disorder treatment. In this paper, we develop a constrained optimization based approach for scheduling the PPIs dosage. In particular, we exploit a mathematical prediction model describing the gastric acid secretion, and use it within the optimization algorithm to predict the acid level. The dosage of the PPIs which is used to enforce acid level constraints is computed by solving a constrained optimization problem. Simulation results show that the proposed approach can successfully suppress the gastric acid level with less PPIs intake compared with the conventional fixed PPIs dosage regimen, which may reduce the long-term side effects of the PPIs.
keywords:
Decision support and control; control of physiological and clinical variables1 Introduction
Over the last two decades, drug development and treatment of gastric acid related illnesses have become of interest as twenty million people suffer from the gastric acid disorder in the US, and 770,000 death cases of gastric cancer are reported globally in 2020 (Morgan et al., 2022). One class of drugs known as Proton Pump Inhibitors (PPIs) has been proven to be highly effective in treating gastric acid secretion disorders by raising stomach pH value Reimer (2013); Huang and Hunt (2001).
Although PPIs have been successfully used for gastric acid disorder treatment, how to optimize their dosage schedule is still a open question. This is important as overdose of the PPIs may cause long-term side effects on the gastric health. One route to design the PPIs dosage is through clinical trials (Shin and Kim, 2013; Lundell et al., 2015; Shin and Sachs, 2008). Another route is to use mathematical modeling to describe and analyze the gastric acid secretion process, and design the dosage schedule based on these prediction models De Beus et al. (1993); Ličko and Ekblad (1992); Joseph et al. (2003); Sud et al. (2004).
In this paper, we adopt the second route and develop a constrained optimization approach to enforce the gastric acid constraints. By exploiting the gastric acid secretion prediction model and online optimization techniques, a dynamic PPIs dosage schedule will be generated given the patient’s gastric state. This is different from the approach used in Sud et al. (2004), where the PPIs dosage schedule is fixed. A potential benefit of our approach is that our dynamic PPIs dosage schedule can reduce the total PPIs intake, which may alleviate their long-term side effect on gastric health. On the other hand, our approach is able to personalize the PPIs dosage schedule, which is achieved by adapting the prediction model parameters according to individual patient’s physical condition and disease symptoms.
The main contributions of this paper include: 1) establishing a constrained optimization based PPIs dosage scheduling approach, 2) comparing the effectiveness of the proposed approach with a fixed PPI dosage based approach, 3) demonstrating the capability of the proposed approach for personalized PPIs dosage scheduling.
2 The gastric acid secretion model
We adopt a dynamic model of gastric acid secretion with PPIs inputs from Sud et al. (2004), Joseph et al. (2003). The gastric acid secretion process is illustrated in Fig. 1. There are two main regions represented in the stomach model, namely corpus and antrum. After taking food, the activity levels of both Central Neural Stimuli (CNS) and Enteric Neural Stimuli (ENS) increase, which serve as the stimuli for gastric acid secretion. In the antrum, G cells are first stimulated by ENS to secrete gastrin. Gastrin is released to both the antral blood capillaries and the corpus. The gastrin released to the corpus will stimulate the parietal cells to secrete gastric acid. Enterochromaffin-like (ECL) cells are stimulated by both the gastrin and ENS, and release histamine. Histamine enhances acid secretion with gastrin in a paracrine manner, and also increases the stimulation intensity of gastrin for the parietal cells. To balance the acid secretion and maintain the gastric acid at a normal level, D cells in the corpus release the somatostatin, which is the inhibitor of the acid secretion. As shown in Fig. 1, PPIs inhibit the proton pumps in the membrane of parietal cells, and thus suppress the acid release.

2.1 Hormonal effectors dynamics
The model adopted in this paper is based on Michaelis-Menten kinetics to represent effector secretion in response to stimuli (Joseph et al., 2003; Sud et al., 2004; Johnson and Goody, 2011). In this model, the effector secretion is dependent on the corresponding stimuli in a dose-dependent manner. In general, this stimulated secretion can be represented by the term of the form , where is the maximal rate of secretion of due to stimulation with , is stimulator concentration and is the Michaelis constant of the effector, which equals to effector concentration level at which stimulator secretion rate is half maximal. On the other hand, the inhibitory dynamics of effector secretion is captured by the term of the general form , where is inhibitor concentration and is the dissociation constant of .
The model also represents the loss of effectors via transport and/or degradation as directly proportional to the effectors concentration. The dynamics of effectors are defined by using the following equations.
For antral gastrin ():
| (1) | ||||
For corpal gastrin ():
| (2) | ||||
For antral somatostatin ():
| (3) | ||||
For corpal somatostatin ():
| (4) | ||||
For histamine ():
| (5) | ||||
Here is the number of G cells, is the number of ECL cells, is the number of CNS cells, is the maximal secretion rate of gastrin per cell due to the stimulation by ENS, and are gastrin Michiaelis constants of ECL and parietal cells, respectively, is the dissociation constant of the somatostatin, is the degradation rate of the gastrin, and is the transport rate of the gastrin from anturm to corpus.
2.2 Acid and bicarbonate dynamics
The gastric acid is secreted from the parietal cells which are stimulated by gastrin, histamine, and central neural stimuli. The somatostatin acts as the inhibitor of the acid secretion. The gastric acid diffusion from the corpus region to the antral region occurs at a constant rate . Meanwhile, bicarbonate buffers the level of the acid leading to further loss of acid, which is represented by a mass action terms, and . In addition, the following term of is used to describe the potentiation of histamine on gastrin-mediated gastric acid secretion. The rate of change of gastric acid in the corpus and antrum are described as follows.
For corpal acid ():
| (6) | ||||
For antral acid ():
| (7) | ||||
Here is the number of parietal cells, is the maximal secretion rate of acid per cell due to the histamine, and are histamine and acid Michiaelis constants, respectively, is the dissociation constant of the somatostatin from receptors on parietal cells, is the transport rate of the acid from corpus to anturm, and is the wash out rate of the gastrin acid.
Note the is the factor that indicates the fraction of pumps in the parietal cells that are still active to secret acid into the stomach lumen. The dynamics of active proton pump cycling during treatment is given by
| (8) | ||||
where is the decay rate of proton pump, and is the bimolecular rate constant of PPIs. represents the PPIs blood concentration depending on PPIs dosing regimen, which is to be designed in the next section.
Bicarbonate secretion, which is stimulated by the CNS, is represented as follows.
For corpus bicarbonate ():
| (9) | ||||
For antral bicarbonate ():
| (10) | ||||
Here is the bicarbonate Michiaelis constant and is the wash out rate of the bicarbonate.
2.3 Central and enteric neural stimuli
The activities of central and enteric neural stimuli, and , which are evoked by food intake , are expressed as follows.
For central neural stimuli ():
| (11) | ||||
For enteric neural stimuli ():
| (12) | ||||
Here is the food intake profile, and are the CNS and ENS Michiaelis constant with respect to the food intake, and and are the basal neural activity constant of the CNS and ENS, respectively.
3 Constrained optimization Based PPIs Dosage scheduling
In this section, we develop a PPIs dosage scheduling approach based on constrained optimization techniques exploiting the gastric acid secretion model, to enforce gastric acid constraint with minimal PPIs intakes.
We adopt a recommended PPIs twice-daily dosing regimen (drug is administered twice a day at fixed times throughout the day) (Sud et al., 2004). The following equation is used to account for the accumulation of drug in the blood following PPIs administration:
| (13) | ||||
where and are the dosage and dosing time at the day’s administration (in our twice-daily dosing regimen, ), respectively, is the molecular weight of the PPIs, is the volume of distribution, and is the elimination constant, is the time since the first dosage is administrated.
Our objective is to enforce a specified the constraint on corpal acid levels by using minimal PPIs intakes as this reduces the risk of long-term side effects caused by the PPIs overdose. To achieve this, we formulate the following optimization problem to online compute the PPIs dosage at each dosing time ,
| (14) | ||||
| s.t. | ||||
The system state vector is defined as , and is the compact form of equations (1) - (13). The set , where is the maximum dosage for one-time PPIs intake. is the prediction horizon, which is chosen as the duration between current and next dosing time. For simplicity, we assume hours. is the food intake, which is modeled to represent a typical daily three meal profile as follows (Joseph et al., 2003):
| (15) | ||||
where .
Note that (14) can be extended to address more general problems, e.g., simultaneously optimize the PPIs dosage, dosing time and food intake profile. These are key effectors of the treatment plan, see e.g., Freedberg et al. (2017). The optimization problem formulated in (14) can also include data-driven gastric acid secretion prediction models. Within this paper, we aim at demonstrating the feasibility of using constrained optimization with mathematical prediction model for scheduling PPIs dosage. We restrict our problem formulation as in (14) and leave these extensions for the future work.
Algorithm 1 aims to find a feasible value between and that is as close to as possible through a bisection method. By administrating at each dosing time , we have , where . Taking a large dosage indeed leads to more suppression of the acid secretion, however, may increase the risk of PPIs long term side effects. Algorithm 1 aims to find the minimum volume of PPIs which is sufficient to enforce the acid level below the prescribed value.
We note that the parameters in the gastric acid secretion model could be estimated offline based on individual patient historical data, see e.g., Sud et al. (2004); Joseph et al. (2003). Then the proposed approach could be used for personalizing the treatment plan.
We also note that in practice, patient’s feedback can be included in the loop to dynamically adjust constraints to be enforced. For instance, after a certain treatment period, the symptoms alleviation extent can be evaluated by the patient. If the patient does not feel relief, we decrease the constraint value for in 14 until the patient feels better. By using the patient’s feedback in the loop, we could implement the proposed approach without additional measurements. We also note that the algorithm could be executed for several food intake scenarios (15), model parameter values and initial conditions with largest chosen as the solution. Details and scalability of such an approach are left to be addressed in the future work.
4 Simulation results
In this section, we report simulation results from applying the proposed constrained optimization approach to PPIs dosage scheduling to enforce gastric acid constraints in the simulation. We use the gastric acid secretion model in Section 2 as the plant model. The C++ Runge-Kutta solver odeint described in the paper by Ahnert and Mulansky (2011) is leveraged for integrating the ordinary differential equations (1)-(12).
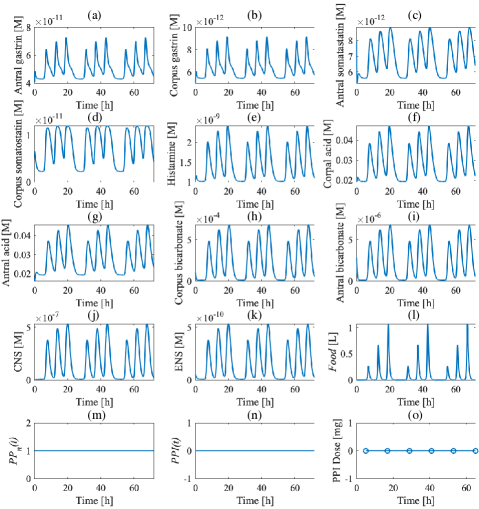
We first qualitatively evaluate the gastric acid secretion model in Section 2 by administrating no PPIs. This simulation result provides us the baseline condition of patient’s gastric activities only with the stimulation of food intakes. Simulations are performed over 3 days, and the results of effectors, acid, bicarbonate and neural stimuli are shown in Fig. 2.
A food intake in (15) is used to represent a typical daily three meal profile, which is shown in Fig. 2(l) and also used in Sud et al. (2004). Note that the PPIs dosage is set to zero, thus all pumps in a parietal cell are in active mode () and the PPIs concentration is zero (), as shown in Figs. 2(o), (m) and (n), respectively. We observe that the increases in neural activities as in Figs. 2(j) and (k), are closely correlated with the food intakes. Food ingestion together with the increasing neural activities promote the release of the antral gastrin (see (1)), which is transported to the corpus (see (2)). The model also reproduces a characteristic reciprocal behavior of gastrin and antral somatostatin that is observed in in vivo and in vitro systems (Zavros et al., 2002). This highlights the antagonistic relationship between the two effectors: gastrin release occurs first, followed by the somatostatin increase, which down-regulates gastrin secretion. This relationship is modeled in (3) and (4), and is verified with the simulation results shown in Figs. 2(c) and (d), where the delay between the release of gastrin and somatostatin can be observed. The simulation results qualitatively reproduce the ones in Sud et al. (2004) despite assumptions on the values of several parameters not reported in Sud et al. (2004).
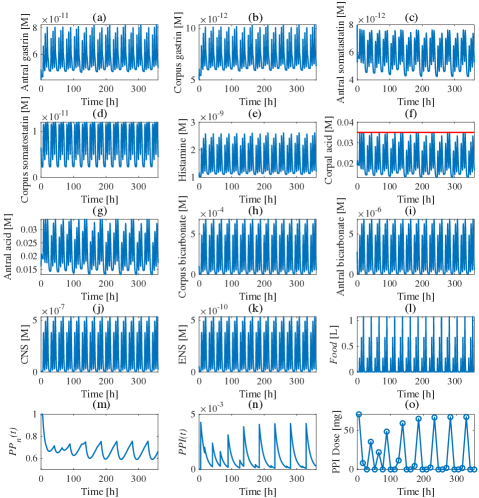
Next, we apply the proposed PPIs dosage scheduling approach in Section 3 (14) to the baseline model to enforce the corpal acid constraint of . Note that without PPIs intervention, the corpal acid reaches 0.048 [M] as shown in Fig. 2(f). In the simulation, we set the daily dosing time at day as and (Sud et al., 2004). The simulation results of a 15 days treatment are shown in Fig. 3. We observe in Fig. 3(f) that the corpal acid is below 0.035 [M] (red solid line) for all time, which means that the constraint in (14) is enforced. As shown in Fig. 3(o), the dosage of the PPIs is administrated dynamically according to the existing PPIs concentration in the body (in Fig. 3(n)). According to the objective of (14), we select the minimal PPIs dosage at each dosing time to enforce the constraint, thus the actual acid will ride on the constraint at some time but never violate it.
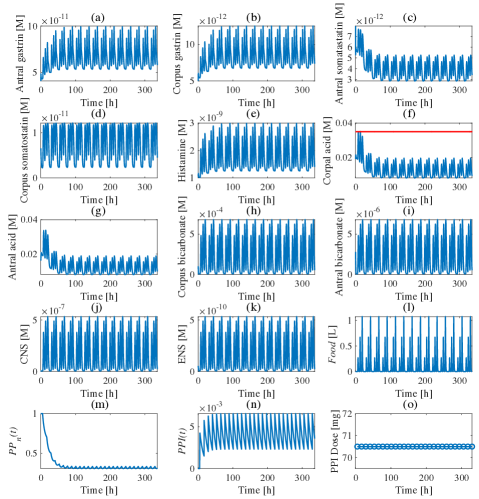
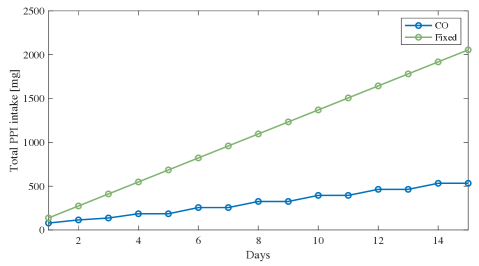
The simulation results of the dosing regimen with fixed dosage are shown in Fig. 4. Note that the PPIs dosage is selected as 70.5 mg per dosing time, which is the minimal value to enforce the acid level constraint for all time by using the fixed dosage schedule. Compared with the results from our proposed approach, unnecessary dosage is administrated by the fixed dosage regimen as a large dosage is needed at the beginning of the treatment to establish the PPIs concentration to the level of enforcing the acid constraint. At the same time, this large dosage is unnecessary in the later part of treatment when the existing PPIs concentration is high enough to suppress the acid secretion. The comparison of the total PPIs intake over a 15 days treatment with our constrained optimization based approach and fixed dosage approach is shown in Fig. 5. The proposed approach can reduce PPIs intake compared with the fixed dosage regimen by over 52% by dynamically scheduling PPIs dosage. This reduced PPIs intake may potentially reduce the patient risk of suffering PPIs long-term side effects.
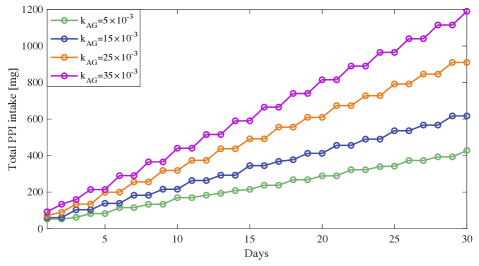
We next further illustrate the capability of the proposed method to determine personalized dosage regimen based on patient’s gastric characteristics, and severity of the illness. Note that in (1) is the key parameter representing the sensitivity level of gastrin secretion regarding stimulus, e.g., the neural activity and the food intake. Larger values of correspond to higher of severity of the patient’s acid over-secretion. Fig. 6 shows the different dosage regimen obtained by solving (14) for different patients.
One of the key observations is that for the more severe patient’s acid over-secretion (larger ), the dosage regimen has more tendency to converge to a periodic one, i.e., the dosing schedule changes from twice daily to every two days as shown in the cases of and in Fig. 6. This periodic dosage regimen does not occur in the cases with smaller . The reason for this is that for more severe patients, the acid level bounces back rapidly, resulting in a similar acid level (similar initial condition) for (14) at each time it is used to compute the PPIs dosage. Different from the severe patient cases, for less severe patients, it takes longer time for the acid to bounce back, which causes the optimization to start from different initial conditions at each time PPIs intervention is needed. This leads to an aperiodic dosage solution.
This observation provides a useful treatment guidance. Specifically, for the less severe patient, the dosage regimen needs to be more carefully designed compared to the ones for more severe patients, as the dosage for less severe patient varies day-to-day.
5 Conclusion
In this paper, we developed a constrained optimization based PPIs dosage scheduling approach to enforce the gastric acid constraint based on the gastric secretion prediction model. We illustrated the acid suppression effectiveness of using the proposed approach, and demonstrated its capability of personalizing acid disorder treatment. Future work will include investigation of the robustness of the proposed approaches, and extending the approach to handle data-driven prediction models.
References
- Ahnert and Mulansky (2011) Ahnert, K. and Mulansky, M. (2011). Odeint–solving ordinary differential equations in C++. In AIP Conference Proceedings, volume 1389, 1586–1589. American Institute of Physics.
- De Beus et al. (1993) De Beus, A., Fabry, T., and Lacker, H. (1993). A gastric acid secretion model. Biophysical journal, 65(1), 362–378.
- Freedberg et al. (2017) Freedberg, D.E., Kim, L.S., and Yang, Y.X. (2017). The risks and benefits of long-term use of proton pump inhibitors: expert review and best practice advice from the american gastroenterological association. Gastroenterology, 152(4), 706–715.
- Huang and Hunt (2001) Huang, J.Q. and Hunt, R.H. (2001). Pharmacological and pharmacodynamic essentials of h2-receptor antagonists and proton pump inhibitors for the practising physician. Best practice & research Clinical gastroenterology, 15(3), 355–370.
- Johnson and Goody (2011) Johnson, K.A. and Goody, R.S. (2011). The original michaelis constant: translation of the 1913 michaelis–menten paper. Biochemistry, 50(39), 8264–8269.
- Joseph et al. (2003) Joseph, I.M., Zavros, Y., Merchant, J.L., and Kirschner, D. (2003). A model for integrative study of human gastric acid secretion. Journal of applied physiology, 94(4), 1602–1618.
- Ličko and Ekblad (1992) Ličko, V. and Ekblad, E.M. (1992). What dual-action agents reveal about acid secretion: a combined experimental and modeling analysis. Biochimica et Biophysica Acta (BBA)-Molecular Cell Research, 1137(1), 19–28.
- Lundell et al. (2015) Lundell, L., Vieth, M., Gibson, F., Nagy, P., and Kahrilas, P. (2015). Systematic review: the effects of long-term proton pump inhibitor use on serum gastrin levels and gastric histology. Alimentary pharmacology & therapeutics, 42(6), 649–663.
- Morgan et al. (2022) Morgan, E., Arnold, M., Camargo, M.C., Gini, A., Kunzmann, A.T., Matsuda, T., Meheus, F., Verhoeven, R.H., Vignat, J., Laversanne, M., et al. (2022). The current and future incidence and mortality of gastric cancer in 185 countries, 2020–40: A population-based modelling study. EClinicalMedicine, 47, 101404.
- Reimer (2013) Reimer, C. (2013). Safety of long-term ppi therapy. Best Practice & Research Clinical Gastroenterology, 27(3), 443–454.
- Shin and Kim (2013) Shin, J.M. and Kim, N. (2013). Pharmacokinetics and pharmacodynamics of the proton pump inhibitors. Journal of neurogastroenterology and motility, 19(1), 25.
- Shin and Sachs (2008) Shin, J.M. and Sachs, G. (2008). Pharmacology of proton pump inhibitors. Current gastroenterology reports, 10(6), 528–534.
- Sud et al. (2004) Sud, D., Joseph, I.M., and Kirschner, D. (2004). Predicting efficacy of proton pump inhibitors in regulating gastric acid secretion. Journal of Biological Systems, 12(01), 1–34.
- Zavros et al. (2002) Zavros, Y., Rieder, G., Ferguson, A., and Merchant, J. (2002). Gastritis and hypergastrinemia due to acinetobacter lwoffii in mice. Infection and Immunity, 70(5), 2630–2639.