Milky Way globular clusters on cosmological timescales. I. Evolution of the orbital parameters in time-varying potentials
Abstract
Context. Recent observational data show that the Milky Way galaxy contains about globular clusters. A fraction of them is likely formed in dwarf galaxies accreted onto the Milky Way in the past, while the remaining of clusters are formed in-situ. Therefore, different parameters, including orbits, of the globular clusters is a valuable tool for studying the Milky Way evolution. However, since the evolution of the 3D mass distribution of the Milky Way is poorly constrained, the orbits of the clusters are usually calculated in static potentials.
Aims. In this work, we study the evolution of the globular clusters in several external potentials, where we aim to quantify the effects of the evolving galaxy potential on the orbits of the globular clusters.
Methods. For the orbits calculation we used five Milky Way-like potentials from IllustrisTNG-100 simulation. The orbits of 159 globular clusters were integrated using a high-order -body parallel dynamic code GPU, with initial conditions obtained from recent Gaia Data Release 3 catalogues.
Results. We provide a classification of the globular clusters orbits according to their 3D shapes and association with different components of the Milky Way (disk, halo, bulge). We also found that the globular clusters in the external potentials have roughly similar energy-angular momentum distributions at the present time. However, both total energy and total angular momentum of the globular clusters are not conserved due to time-varying nature of the potentials. In some extreme cases, the total energy can change up to 40% (18 objects) over the last 5 Gyr of evolution. We found that the in-situ formed globular clusters are less affected by the evolution of the TNG potentials as compared to the clusters which are likely formed ex-situ. Therefore, our results suggest that time-varying potentials significantly affect the orbits of the GC, thus making it vital for understanding the formation of the Milky Way.
Key Words.:
Methods: numerical - Galaxy: globular clusters: general - Galaxy: evolution – Galaxy: kinematics and dynamics1 Introduction
According to the CDM model, the Milky Way (MW) globular clusters (GCs) are the first stellar associations formed in the early Universe as gravitationally bound systems (Gratton et al., 2019). As the result their typical ages are Gyr (Marín-Franch et al., 2009; VandenBerg et al., 2013; Valcin et al., 2020) and the present masses (Harris et al., 2013; Kharchenko et al., 2013; Baumgardt et al., 2019; Baumgardt & Vasiliev, 2021). Many GCs’ survived over long galactic history and, thus, became relics from the earliest era of galaxy formation (Garro et al., 2022). Recent observations reveal the picture where the MW halo contains a large number of GCs’ (Harris, 2010; Vasiliev & Baumgardt, 2021), stellar streams (Ibata et al., 2021) and satellite galaxies (McConnachie, 2012; McConnachie et al., 2021). Most of the discovered and studied streams in the halo are the remnants of either GCs or dwarf galaxies destroyed in the process of “merging history” of our Galaxy (Mateu, 2023; Ibata et al., 2021; Ferrone et al., 2023). They undergo complete destruction (or mass loss) under the influence of the complex time-dependent gravitational field of our Galaxy. Study of kinematics and chemical abundances of the GCs captured by the MW is a very good tool for studying the past history of our Galaxy (Xiang & Rix, 2022), as well as searching possible progenitors for these GCs (Massari et al., 2019; Malhan et al., 2022).
Thanks to the publication of the Gaia (ESA) catalogues (Gaia Collaboration et al., 2021, 2018) full phase-space information is available for almost the entire population of the GCs, which makes possible to investigate their orbits. Several recent works studied the orbits of the GCs in the MW potential assuming its being axisymmetric and non-evolving in time (Massari et al., 2019; Myeong et al., 2019; Malhan et al., 2022). These two assumptions result in the conservation of the total energy and the -component of the angular momentum () of the GCs, which is being used to group some of the GCs and link these kinematically coherent groups with their galaxy-progenitors (either MW or accreted satellite). However, the above-mentioned assumptions are not fully correct because the MW galaxy contains the bar and boxy-peanut bulge in the center (Dwek et al., 1995; Wegg & Gerhard, 2013; Ness & Lang, 2016). In the outer parts, the axisymmetry of the MW potential is believed to be broken by the massive orbiting satellites (Laporte et al., 2018, 2020), including the LMC/SMC systems (Gómez et al., 2015; Petersen & Peñarrubia, 2021; Conroy et al., 2021). In the current picture, most of the mass of the disk is assembled from the smooth accretion of gas combined with the accretion along cold filaments (Katz & Gunn, 1991; Birnboim & Dekel, 2003; Kereš et al., 2005; Agertz et al., 2009). Although the mass evolution of the MW is still uncertain, different models suggest its rapid increase at early times (until 8 Gyr) followed by a slower evolution (Snaith et al., 2014) which is in agreement with the mass growth of the MW-like galaxies constrained via halo abundance matching (van Dokkum et al., 2013; Fattahi et al., 2019). While some models suggest that the mass-growth of the MW-type galaxies affects the coherency of accreted and in-situ stellar populations in the kinematic space (e.g., in Grand et al., 2019; Panithanpaisal et al., 2021; Khoperskov et al., 2022; Pagnini et al., 2022), the impact on the motions of the GCs remains unclear.
The main feature of our study of the MW GC subsystem phase space distributions is a time variable external potential. This feature significantly differs our investigation from other similar works (see for example Massari et al., 2019; Vasiliev, 2019; Bajkova & Bobylev, 2021; Bajkova et al., 2021; Malhan et al., 2022; Armstrong et al., 2021; Haghi et al., 2015), where the authors use the fixed or the analytically time-evolving MW potential. In series of articles about evolution of GC, and in particular this one, we aim to investigate how the evolution of the mass and spatial scales of both stellar and dark matter components of the MW affect the orbital parameters of the GCs. Since the evolution of the MW parameters is poorly constrained, we analyse the dynamics of the GCs in the MW-like evolving potentials directly obtained from IllustrisTNG cosmological simulations (Pillepich et al., 2018; Nelson et al., 2018).
The paper is organised as follows. In Section 2.1 we present the GCs selection with the error distribution from the Gaia data release 3 (DR3) catalogue. In Sections 2.2 and 2.3, we introduce the time-dependent gravitational potentials of the MW-type galaxies that were selected from IllustrisTNG-100 and shortly describe the numerical integrator. In Section 3, we present the individual orbits of the GCs in the evolving TNG potentials. In Section 4 we describe GCs phase space evolution. In Section 5 we summarise our results.
2 Methods
2.1 Globular Clusters sample
In our study, we used the recent catalogues of the GCs released by Vasiliev & Baumgardt (2021) and Baumgardt & Vasiliev (2021), which contain information about more than 160 individual objects. The catalogues include the complete 6D phase-space information required for the initial conditions of our simulations: right ascension (RA), declination (DEC), heliocentric distance (D⊙), proper motion in right ascension (PMRA), proper motion in declination (PMDEC), and the radial velocity (RV). Because of the dynamical simulation of the GCs, we use also the self-gravity of the clusters together with the Galaxy external potential. We exclude the Mercer 5 object since there is no mass information for this GC from the catalogues above.
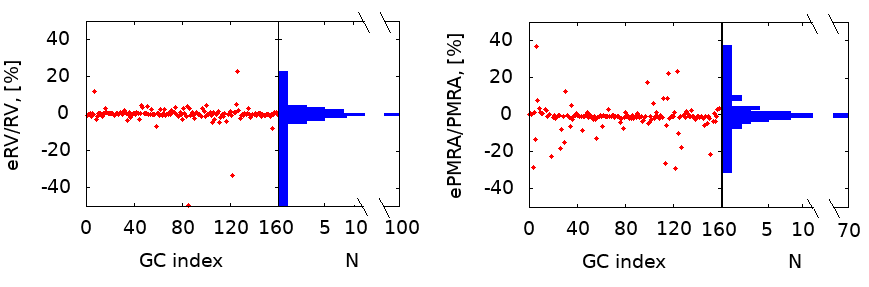
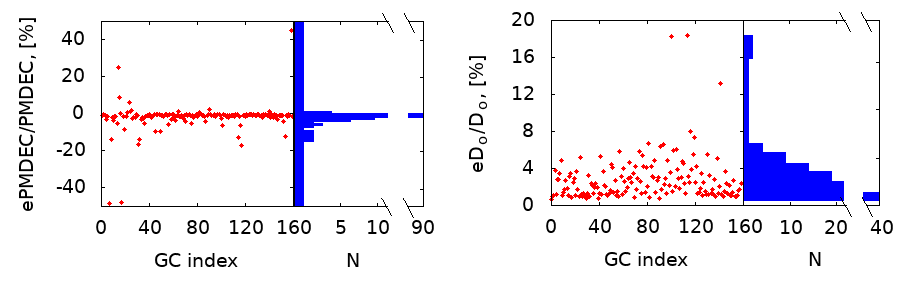
Before the orbital integration, we analysed the GCs Gaia measurement errors influence which may change the orbital shape during the orbital integration (see Bajkova & Bobylev, 2021). We analysed the errors in PMRA, PMDEC, RV and D⊙ for 159 GCs from the catalogue above and in Fig. 1 presented the distribution of the relative errors of listed parameters. As we see, the vast majority (up to 95%) of the errors are well below 5% but some GCs (Crater and Lae 3) have a quite large value in proper motion. Analysing the errors in the heliocentric distance we found only 18 objects that have relative errors larger than 5% and only three GCs with errors larger than 10% (namely: 2MASS-GC01, VVV-CL001, and Pal 10). The influence of the measurement errors on the orbital integration is presented in subsection 3.1.
For the transformation of the positions and velocities to the Cartesian Galactocentric rest-frame (see Johnson & Soderblom, 1987; Bovy, 2011, for the coordinate transformation equations), we assumed the Galactocentric distance of the Sun kpc (Gravity Collaboration et al., 2019; Reid & Brunthaler, 2004), a height above the Galactic plane pc (Bennett & Bovy, 2019) and the velocity of the Local Standard of Rest (LSR) km s-1 (Bovy et al., 2012; Drimmel & Poggio, 2018). Accordingly, the Sun is located at pc, pc and pc in our Cartesian Galactocentric coordinate system. For the peculiar velocity of the Sun we used the following values with respect to the LSR: km s-1, km s-1, km s-1 (Schönrich et al., 2010).
2.2 Time-variable gravitational potentials from Illustris simulation
Since the time evolution of the MW potential is poorly constrained from observations, for the GCs orbits integration, we have selected the MW-like galaxies from the most recent Illustris cosmological numerical simulations. For our purpose, we used the publicly available snapshot data from the IllustrisTNG-100 (Pillepich et al., 2018; Nelson et al., 2018; Springel et al., 2018; Marinacci et al., 2018; Naiman et al., 2018; Nelson et al., 2019). These simulations successfully reproduce the main scaling relations and evolution of galaxy sizes (Genel et al., 2018), including the formation of realistic disc galaxies (Pillepich et al., 2019), the gas-phase mass-metallicity relation (Torrey et al., 2019), and the range of MW-type galaxies observed kinematic properties (Lovell et al., 2018). The Illustris simulations were used to investigate various processes of galactic evolution, including the gas-stripping phenomena (Yun et al., 2019; Łokas, 2020), central black hole activity (Habouzit et al., 2019; Donnari et al., 2021), star formation quenching (Genel et al., 2018; Davies et al., 2020), and many others. These results ensure that the investigation of properties of different types of galaxies from the Illustris cosmological simulations allows us to study the GCs dynamics in an environment similar to the MW.
The IllustrisTNG-100 is characterised by a simulation box approximately 100 Mpc3. In a box of such size, one can resolve a sufficient number of the MW-mass disk galaxies (in our sample 54 object111MW-like potentials are presented on a web page of the project https://bit.ly/3b0lafw) with the mass resolution of for dark matter and for the baryonic particles, respectively. For our analysis, in the Illustris simulations, we identified the MW-like galaxy candidates with at least dark matter particles and at least baryonic particles (stars and gas) at redshift zero.
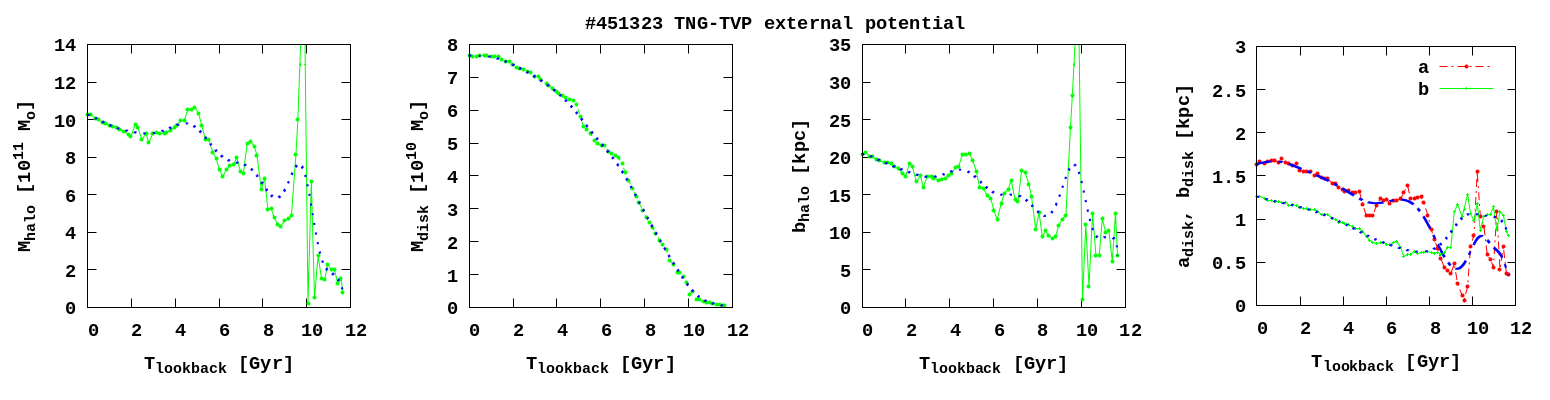
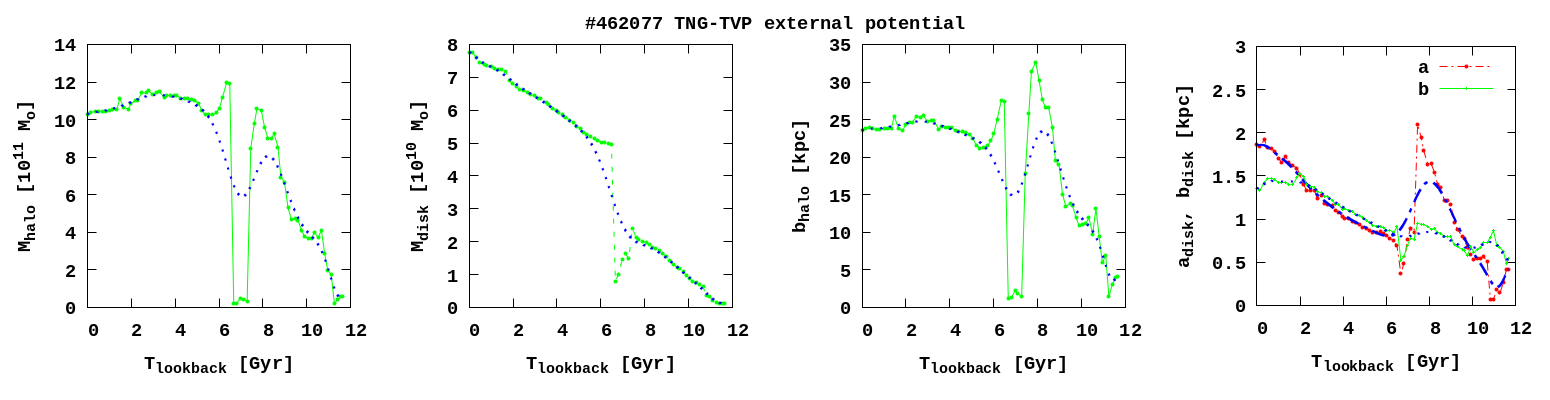
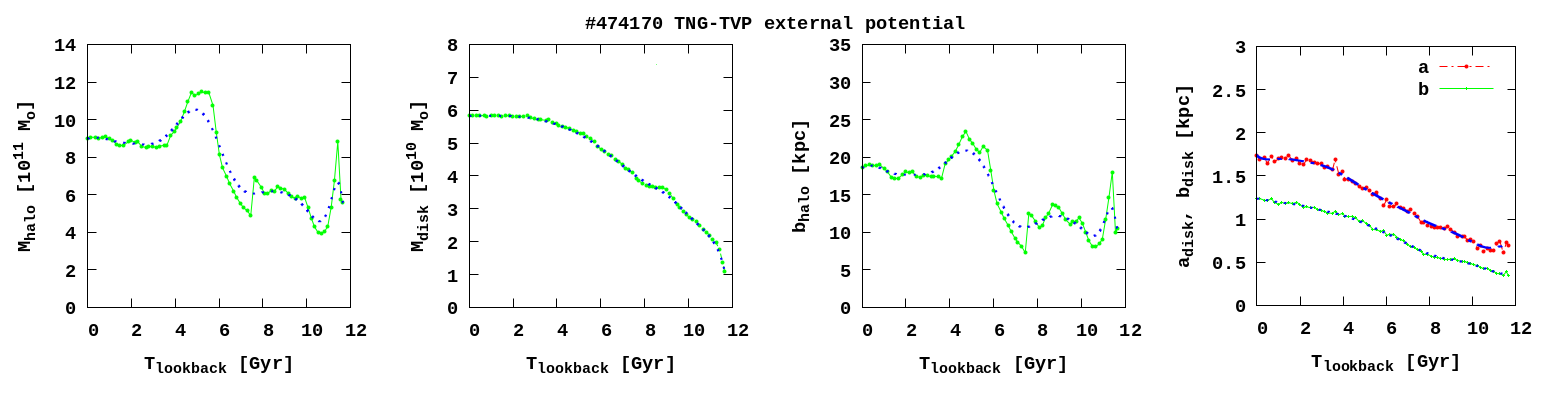
From the simulated galaxies in the IllustrisTNG-100, we selected our five galaxies (#411321, #441327, #451323, #462077, and #474170) that at redshift zero well reproduce MW parameters (disk and halo masses with the spatial scales) at present the best (see Table 1).
Due to the limited particle number of our selected TNG-TVPs, we cannot resolve a separate bulge component. This is mainly caused by the limited mass resolution of the IllustrisTNG-100, that is, simply we do not have enough particles to determine such a component as a separate bulge in our galaxy mass model.
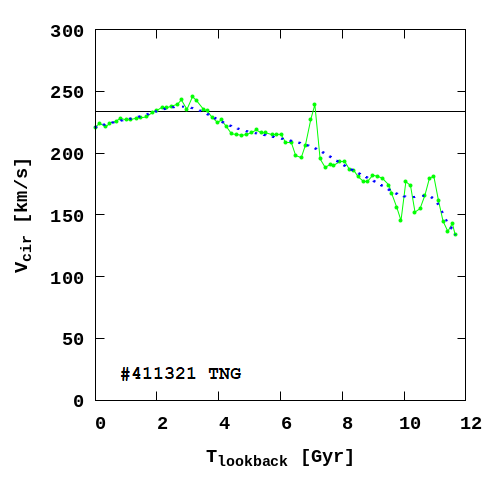
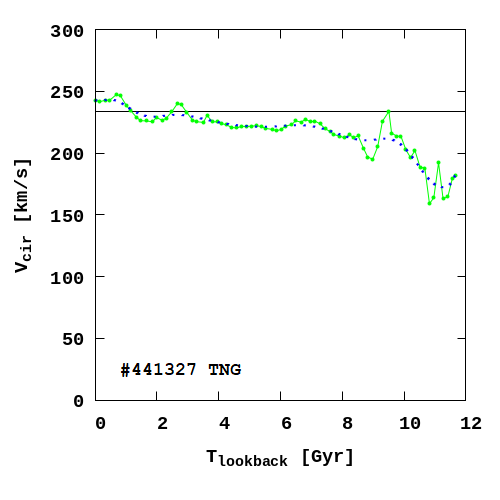
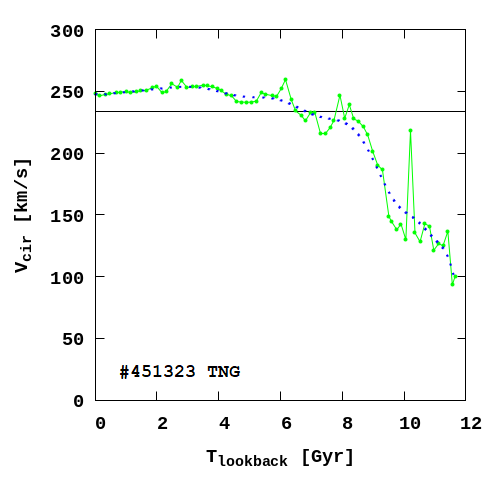
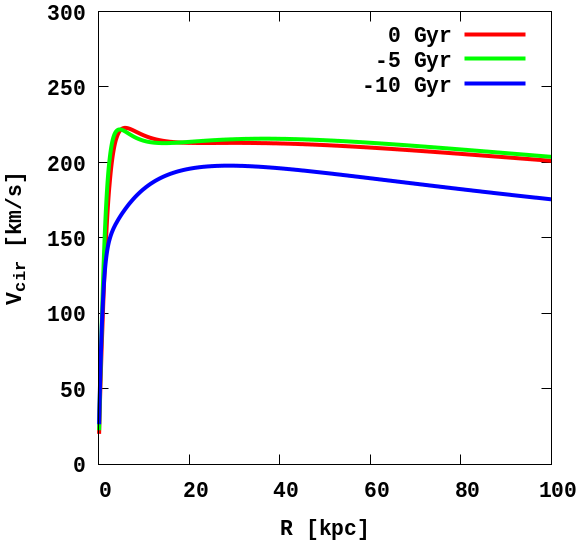
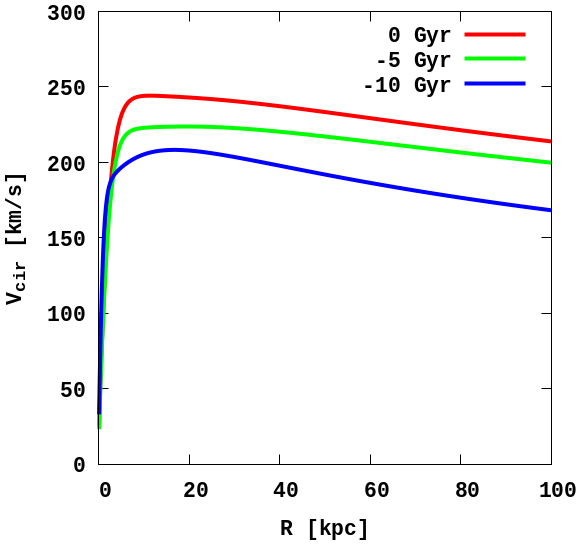
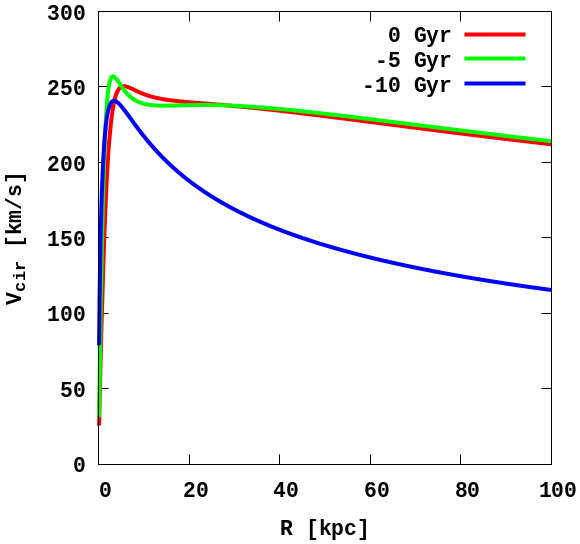
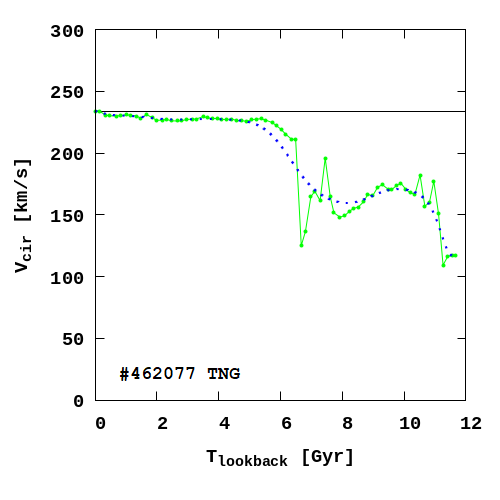
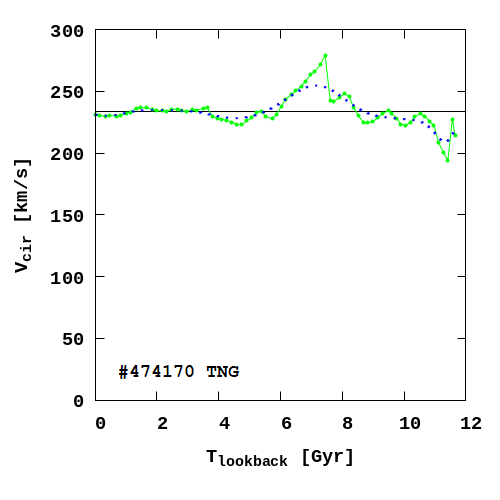
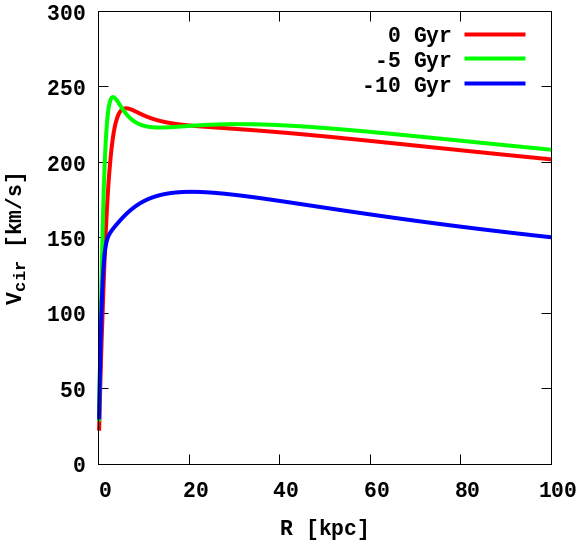
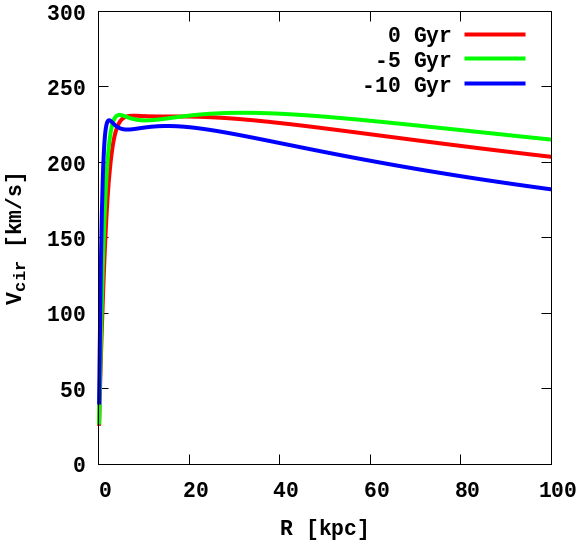
We also used a circular velocity value at the solar distance (8 kpc) in the model as an extra parameter to select the best TNG galaxies which represent the MW-type systems. This value indicates the position of the Sun at present. According to the age and chemical compositions of the stars in the solar neighbourhood, we know that over the past few billion years, there were no large changes in the radial motion of the masses. This means that the circular velocity at the distance of the Sun in the Galactic disk should remain approximately constant during the last few billion years near the km s-1 (Mardini et al., 2020). In Appendix A, we present the circular velocity evolution for the selected five TNG external potentials. In the same figures, we also present the time evolution of the selected TNG-TVP circular velocity radial distribution. These figures were obtained directly from the mass distribution of the corresponding IllustrisTNG-100 simulation snapshots for three different redshifts z = 0, -5 Gyr (z = 0.48) and -10 Gyr (z = 1.74). Due to the galaxy mass decrease as a function of lookback time, we clearly see the circular velocity decrease at all galactocentric radii.
To obtain the spatial scales of the disks and dark matter haloes, we decomposed the mass distribution using the Miyamoto-Nagai (MN) (Miyamoto & Nagai, 1975) and Navarro–Frenk–White (NFW) (Navarro et al., 1997) potentials:
| (1) |
where is the planar Galactocentric radius, is the distance above the plane of the disc, is the gravitational constant, is the disk scale length, are the disk and halo scale heights, respectively, and ( is the central mass density of the halo) are masses of the disk and halo, respectively.
In our case all these mass distribution parameters are functions of lookback time. We performed such a fit for each available snapshot in each of our selected galaxies. The code, which we use to find these parameters, is also publicly available at GitHub222The ORIENT:
https://github.com/Mohammad-Mardini/The-ORIENT.
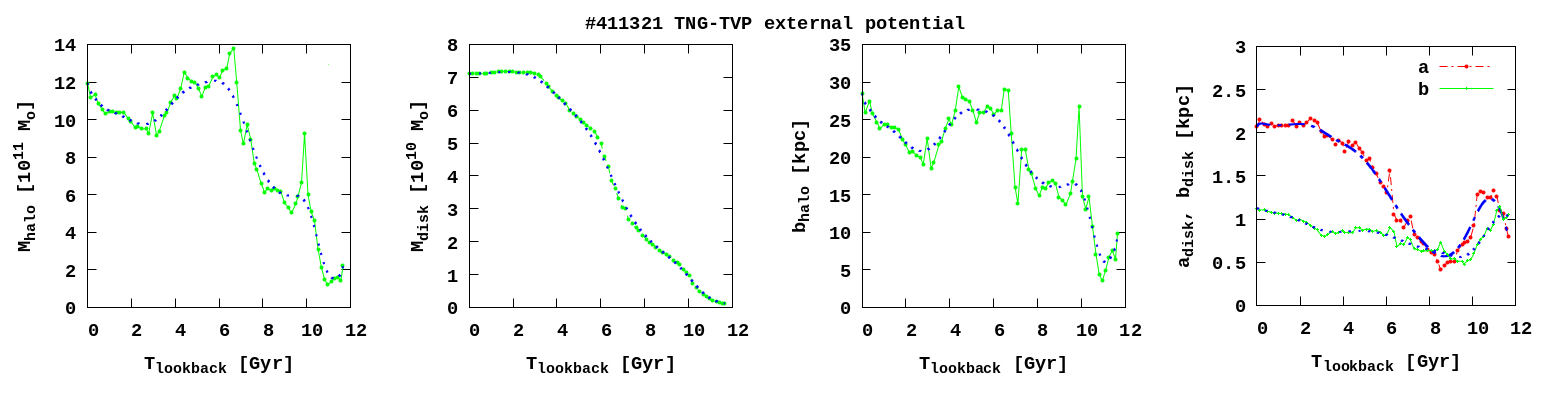
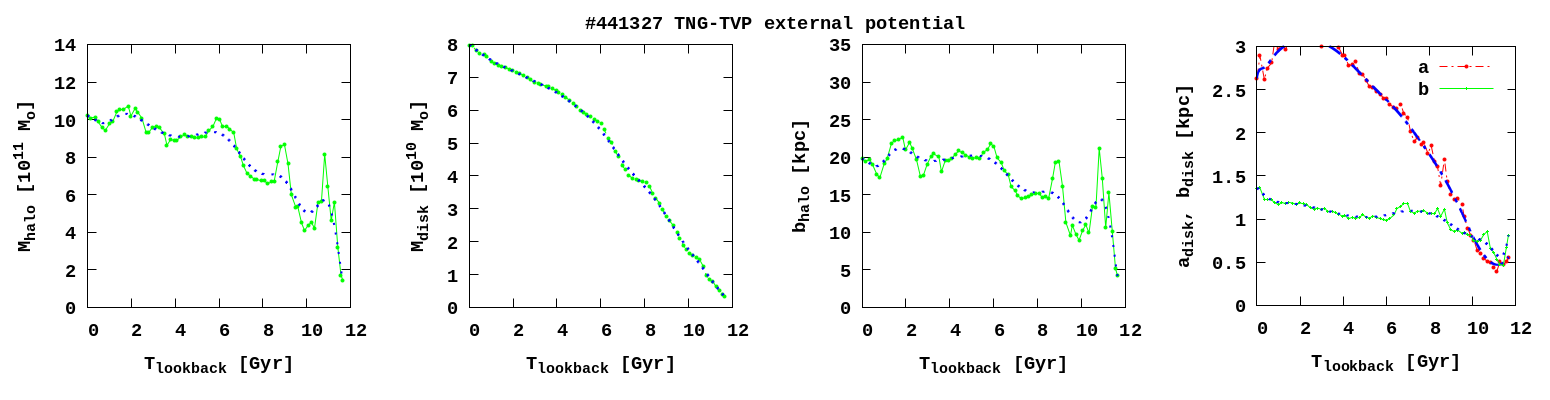
For each snapshot available in the IllustrisTNG database, we decomposed the mass distribution of each selected galaxy. Next, we interpolated the variation in masses and spatial scales of dark matter and stellar disk among the snapshots with the timestep of Myr. Finally, to avoid some short-time scale perturbations, likely linked to the mergers or errors in the galaxy identification, we additionally smoothed the evolution of the main galaxy parameters. The above procedure results are shown for our five time-variable potentials (TNG-TVPs) in Fig. 2.
| Parameter | Unit | #411321 | #441327 | #451323 | #462077 | #474170 | Milky Way |
|---|---|---|---|---|---|---|---|
| Disk mass, | 7.110 | 7.970 | 7.670 | 7.758 | 5.825 | 6.788 | |
| Halo mass, | 1.190 | 1.020 | 1.024 | 1.028 | 0.898 | 1.000 | |
| Disk scale length, | 1 kpc | 2.073 | 2.630 | 2.630 | 1.859 | 1.738 | 3.410 |
| Disk scale height, | 1 kpc | 1.126 | 1.356 | 1.258 | 1.359 | 1.359 | 0.320 |
| Halo scale height, | 10 kpc | 2.848 | 1.981 | 2.035 | 2.356 | 1.858 | 2.770 |
2.3 Integration procedure
For the GCs’ orbits integration we used a high-order parallel dynamical -body code GPU333-body code GPU:
https://github.com/berczik/phi-GPU-mole (Berczik
et al., 2011, 2013). The code is based on the fourth-order Hermite integration scheme with hierarchical individual block time steps.
For the force calculation, acting on the particles during the integration, we combine the particles self gravity with the time variable external potential described in the previous subsection. For the self gravity calculation (as a first order simplification) we apply the current mass of the individual GCs.
We applied the integration timestep parameter =0.01 (Makino &
Aarseth, 1992), which gives for our investigation the required integration accuracy.
As a test case, we run a typical simulation with the fixed for today (that is, for ) values of the external potential #411321 with up-to-date halo and disk masses and scale lengths. During this test case the total relative energy drift () over a 10 Gyr backward integration was below . For the production runs, we embedded our 159 GC into the selected five external TNG-TVPs as a point masses (set the masses of GC as for today). For each GC-point we set for position and velocity the central values from Baumgardt &
Vasiliev (2021) and Vasiliev &
Baumgardt (2021).
3 Characteristics of the individual Globular Clusters orbital evolution in five time-varying potentials
3.1 Influence of the measurement errors
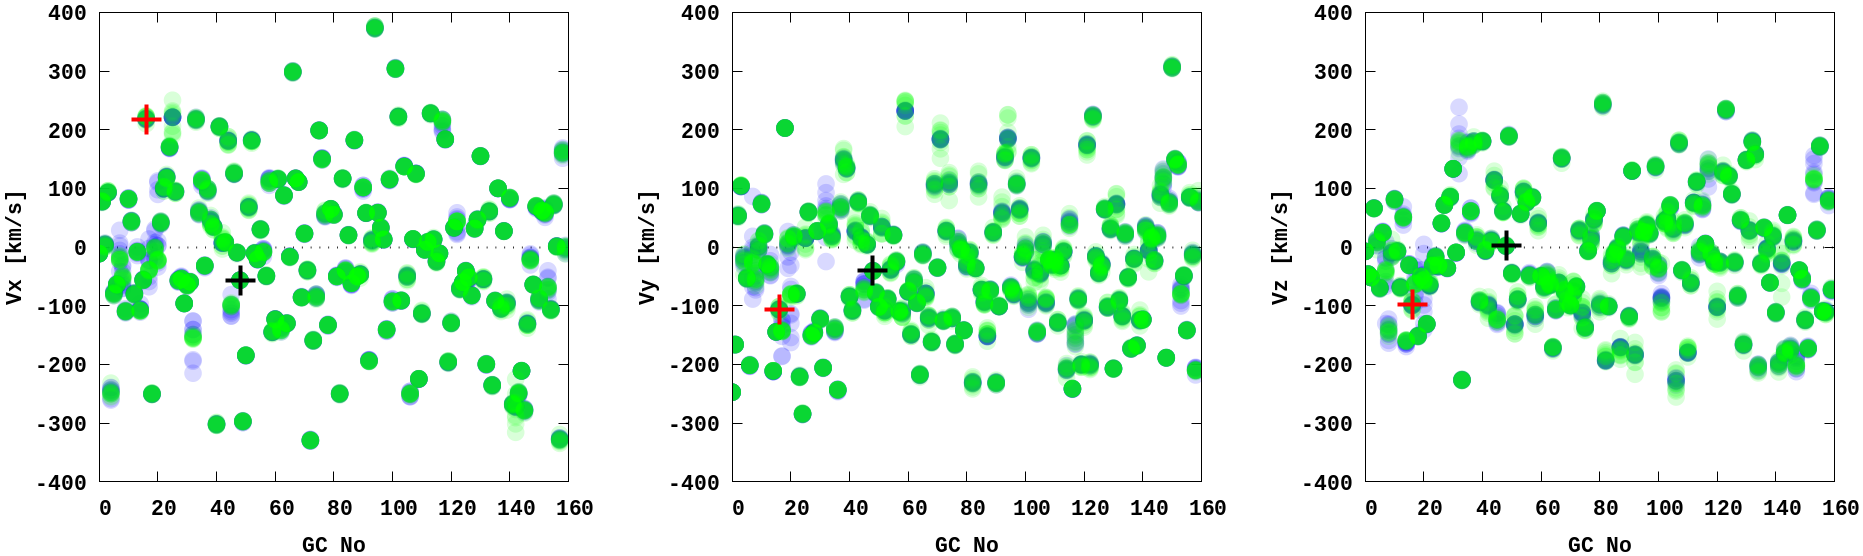
Prior to the analysis of the orbital types of the GCs, we investigate the impact of the initial conditions uncertainties on the initial velocities values and structure of the orbits. For each GC in our sample, we generated extra initial conditions where the initial velocities take into account the normal distribution of the errors for PMRA, PMDEC, RV (blue circles), and D⊙ (green circles) from Baumgardt & Vasiliev (2021)444Error values for PMRA, PMDEC, RV, and D⊙ from https://people.smp.uq.edu.au/HolgerBaumgardt/globular/orbits_table.txt, see Fig. 3. As we see, both randomisations have a similar effect on the GCs’ initial velocities. In general, the errors by velocities are even slightly dominated over the errors due to the distance determination. The effect from the velocity determination errors is even slightly larger for a few objects (six) with indexes below 30.
In Fig. 4 we illustrate the impact of the initial conditions uncertainties on the orbital evolution of two selected GCs: Crater (belongs to the with the largest velocity uncertainties: 211%, 100% and 0.4% for proper motions and radial velocity) as for the NGC 6121 (with the one of the smallest values: 0.1%, 0.12%, and 2% respectively). These two GCs are marked by crosses in Fig. 3. The velocity uncertainties significantly change the orbital characteristics in the case of Crater. In particular, the extension of the orbit along the principal axes, especially in the disk plane, is very different in various GCs realisations. At the same time, the vertical motions are less affected. In contrast, for the NGC 6121, which parameters are well measured, the orbits are less affected by the velocity uncertainties, as we can see on the bottom row of Fig. 4. Thus, since the velocity uncertainties for most of our GCs are similar to the NGC 6121, we assume that the orbits of the majority of the GCs are robust to the variations of the initial condition.
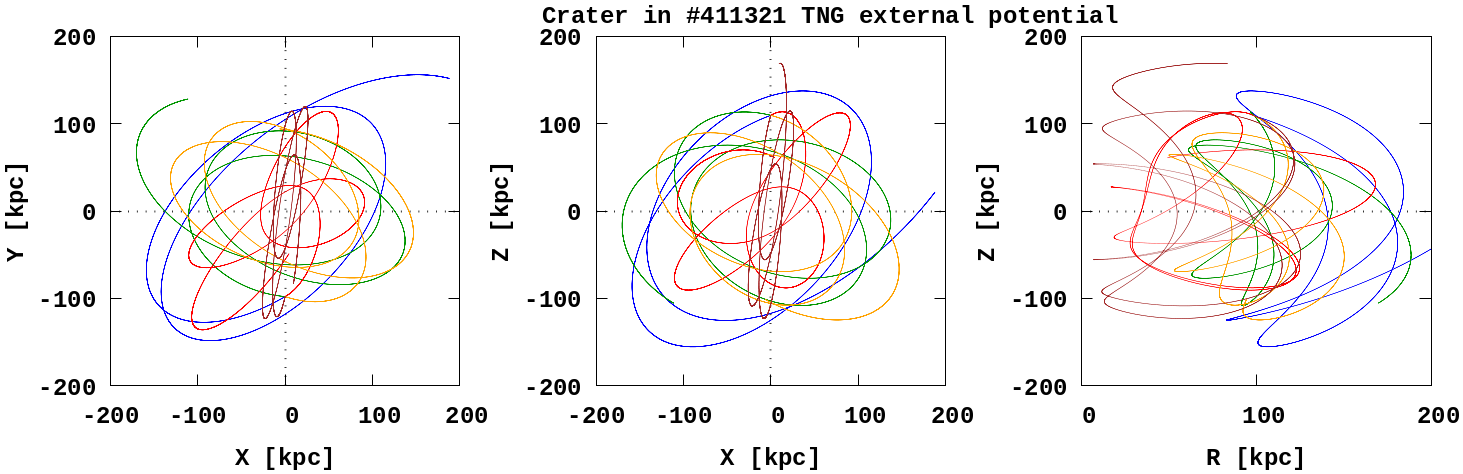
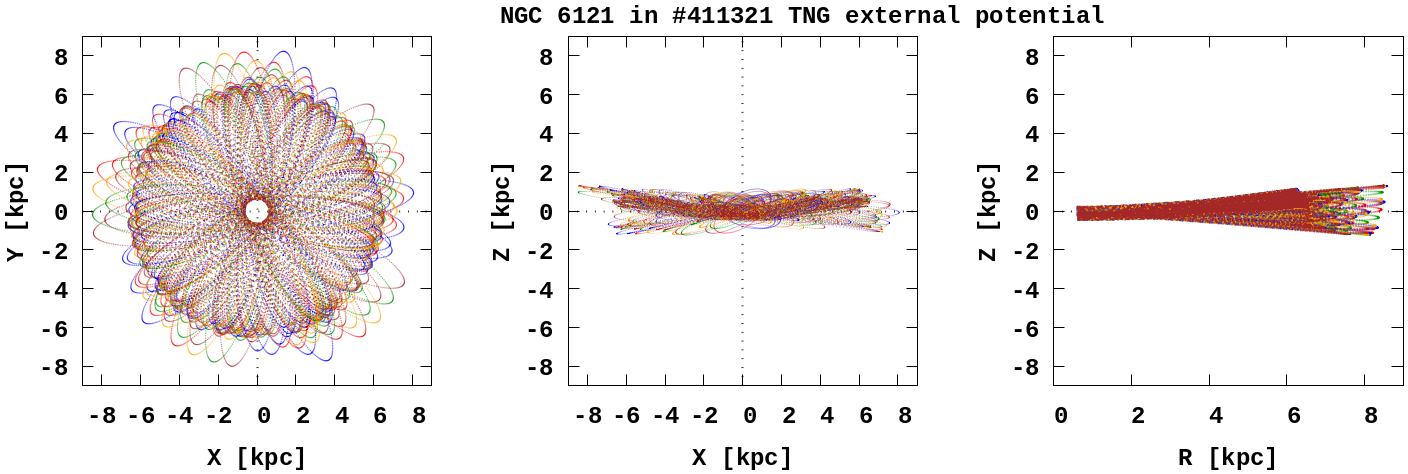
As we can see in Fig. 4 the influence of the relative errors of the heliocentric distances on the orbital shape of our GC sample is indeed less significant compared to the other relative errors. As an example, we present the orbits of two selected GC: Carter (largest heliocentric distance) and NGC 6121 (smallest heliocentric distance). As we can see, the effect from the relative distance error is significantly smaller compared to the effect from the proper motions and radial velocity errors, presented on the same plot. Next, we focus our attention only on the GC-point orbits obtained using the central values for positions and velocities from Baumgardt & Vasiliev (2021) and Vasiliev & Baumgardt (2021).
3.2 The evolution of the Globular Clusters orbital elements
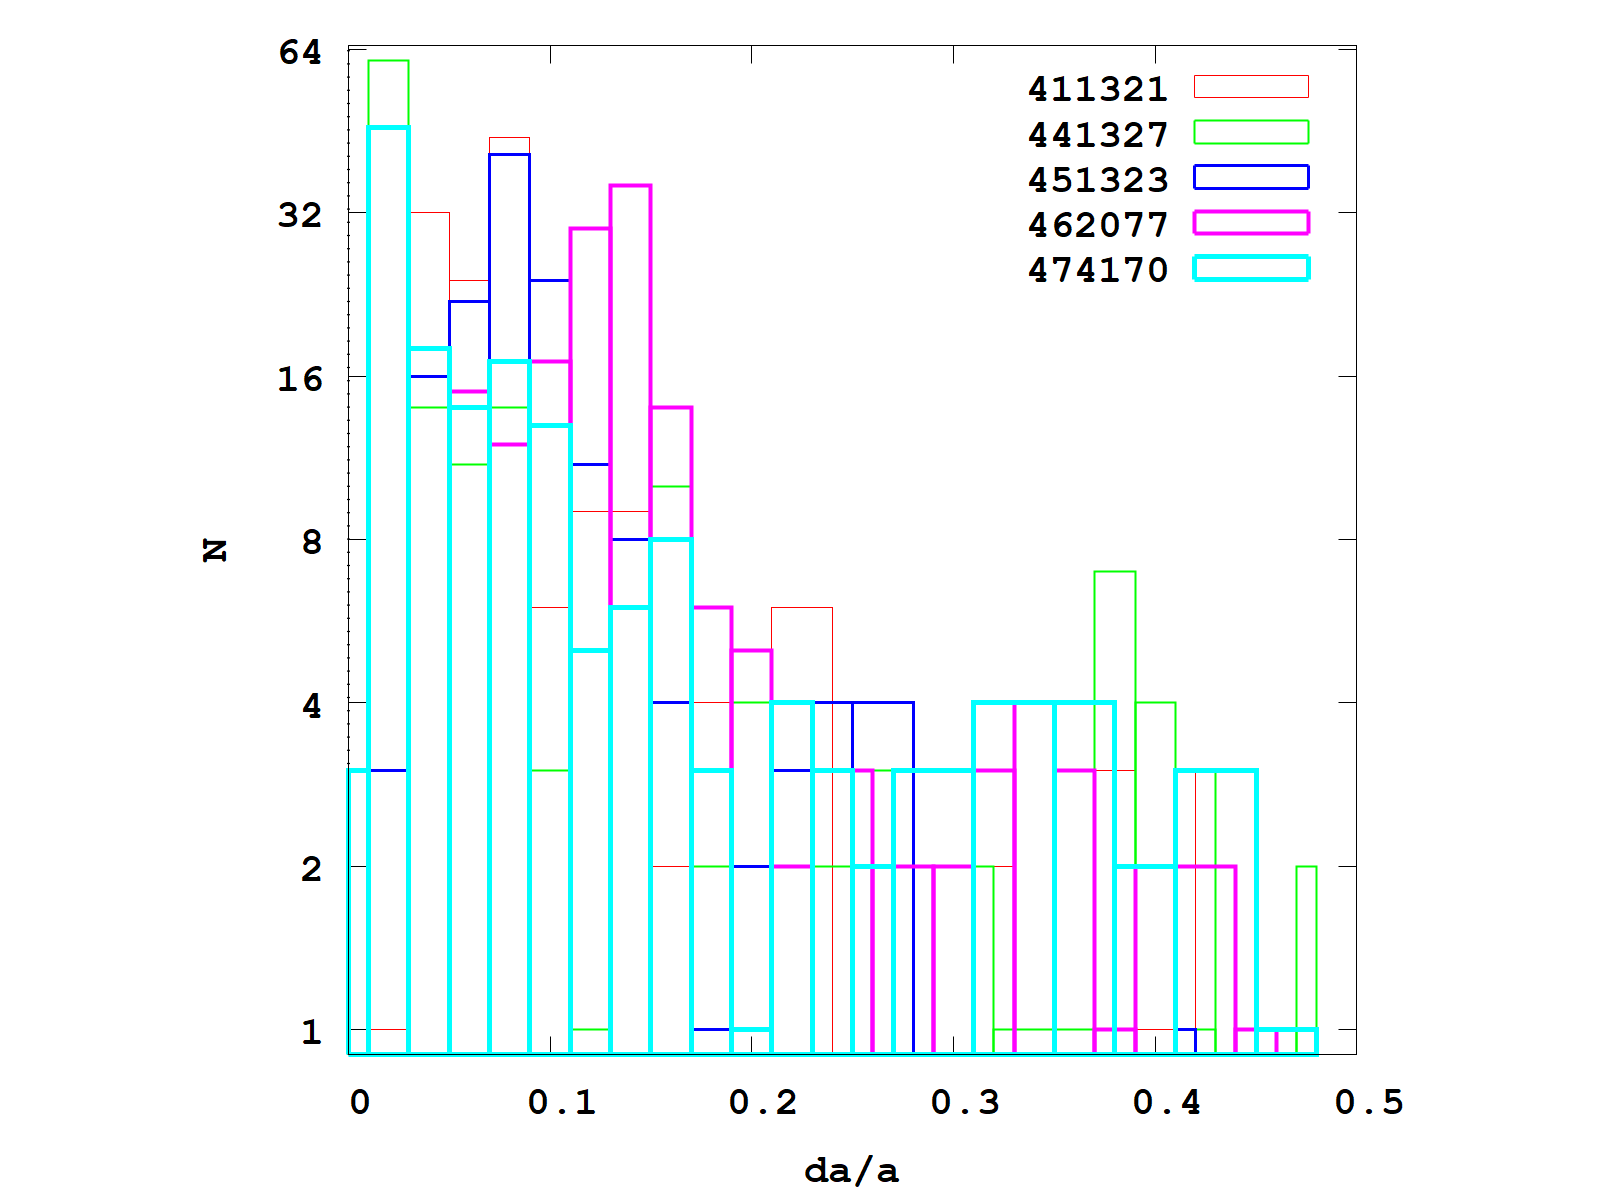
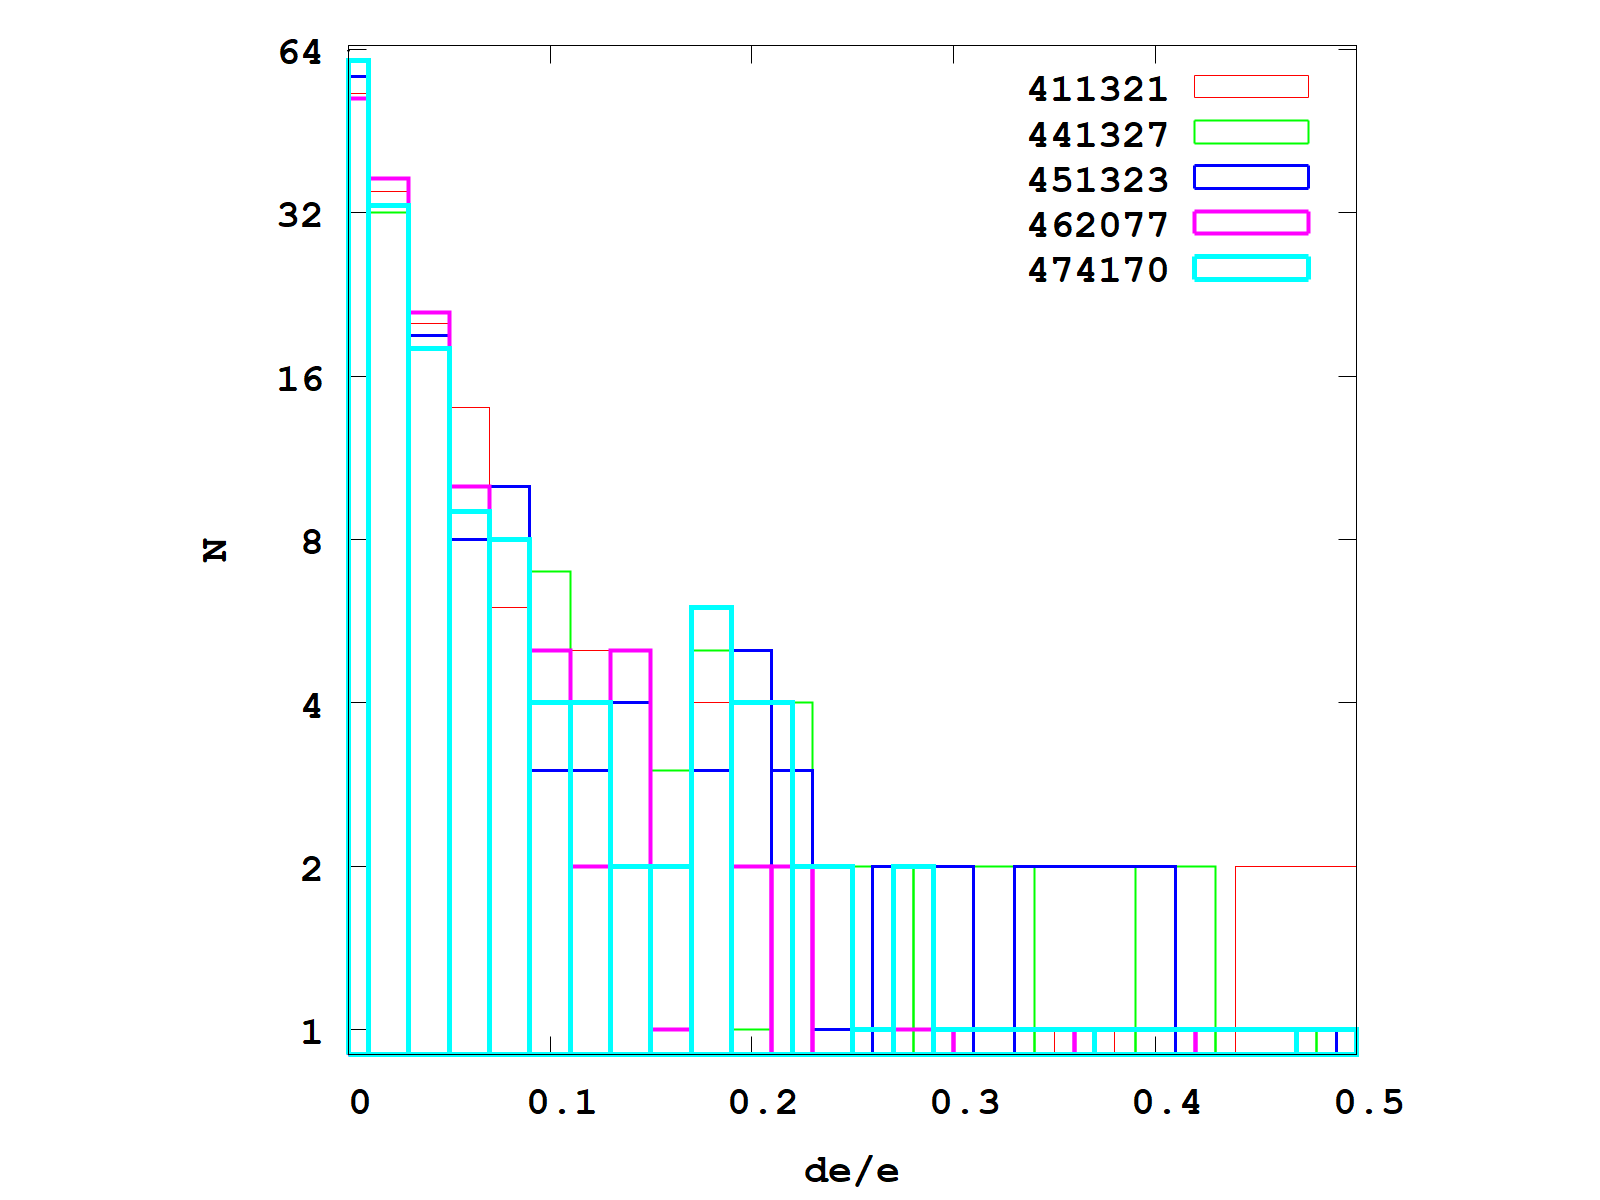
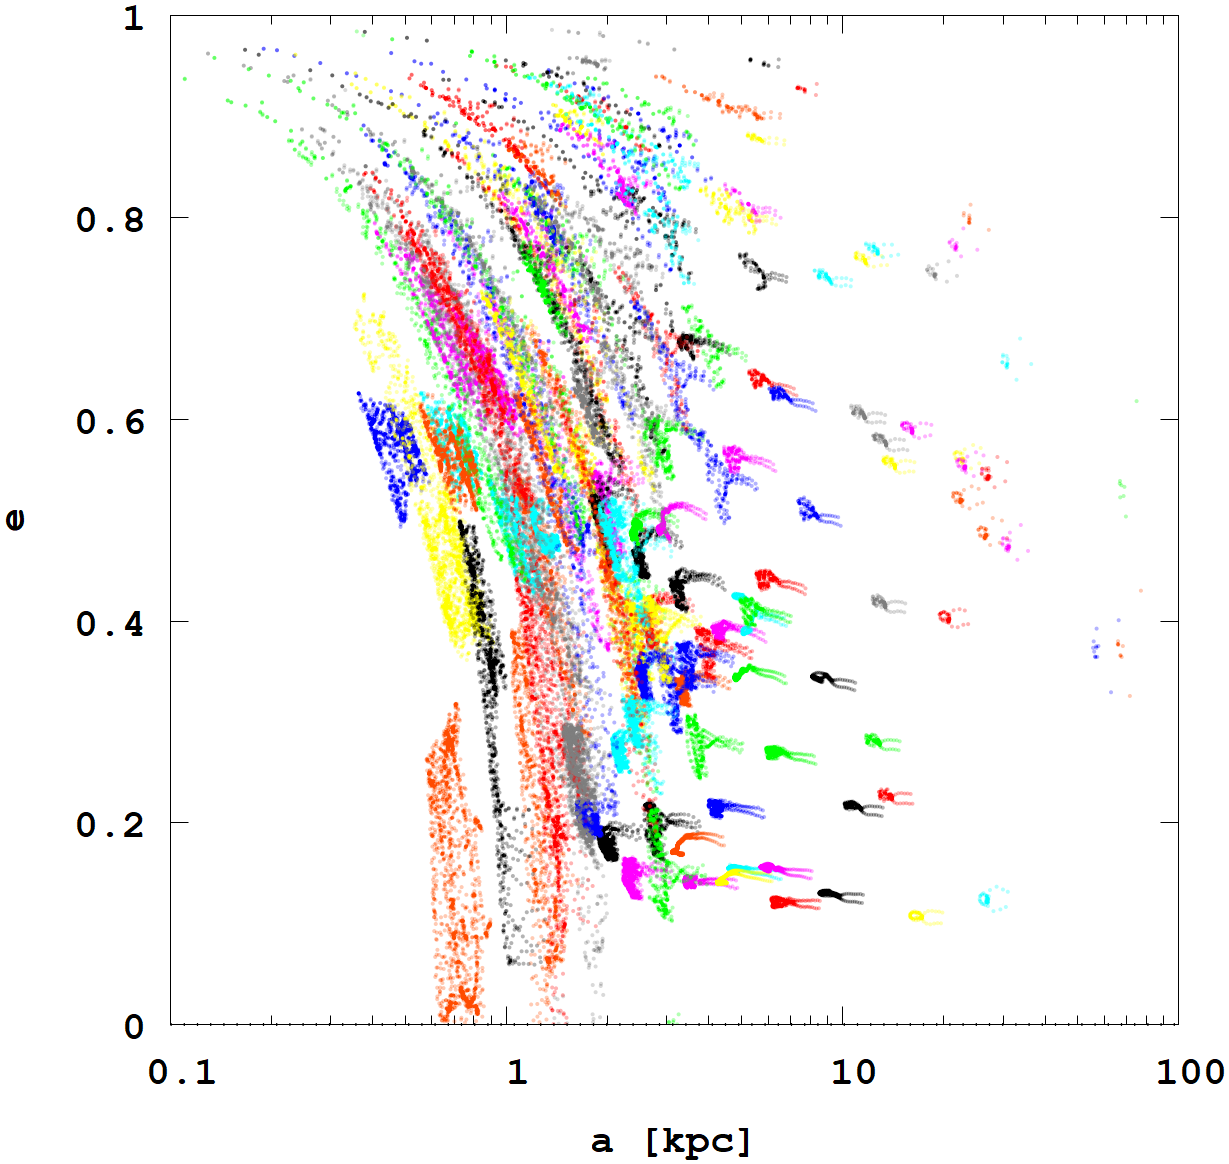
Assuming the cosmologically motivated time variable potential we automatically taking into account the possible influence of the Milky Way satellite galaxies on to the GCs subsystem. If we compare the individual GCs’ orbital elements (semi-major axis - a and eccentricity - ecc) variation over the whole integration time (sometimes over the hundreds or thousands of GCs’ orbital revelations). In Fig. 5 we present the orbital elements relative changes in five TNG-TVPs. In Fig. 6 we have shown the time evolution of the a and ecc. The strong influence on the GCs’ orbits have already discussed in details in the papers Garrow et al. (2020) and Boldrini & Bovy (2022). Our Fig. 5 and Fig. 6 are directly comparable with the Figures 1, 2 and 3 from the Garrow et al. (2020). As we can see the relative changes of a and ecc behave in a similar range. In our case the a evolution is even larger in a factor of two. We also notice a very similar distribution of the relative quantities for the different TNG-TVP potentials.
As a illustration of the time evolution of orbital elements of all GCs we have shown such a data for the #411321 TNG-TVP in Fig. 6. Here we can clearly see the separation between the ‘inner’ and ‘outer’ GCs. The ‘inner’ GCs (a 3 kpc) have a more regular and larger eccentricity changes during the evolution. The ‘outer’ GCs (a 3 kpc) have much smaller eccentricity changes during the whole backward integration time. This Fig. 6 can be directly compared with the Figure 3 from the Garrow et al. (2020). As we can see, our potential keep bound the individual GCs, even with large a during the whole time of integration – 10 Gyr.
For example, in the works of Garrow et al. (2020) and Boldrini & Bovy (2022) during their GCs orbit investigations the MW major satellites were added as an extra gravitational perturbation in the fixed MW potential approximation. In contrast in our case, the IllustrisTNG-100 mass assembling history of our theoretical MW-like galaxies (see Fig. 2) provides us with the same or even a larger scale of orbital perturbations for individual GCs during their time evolution.
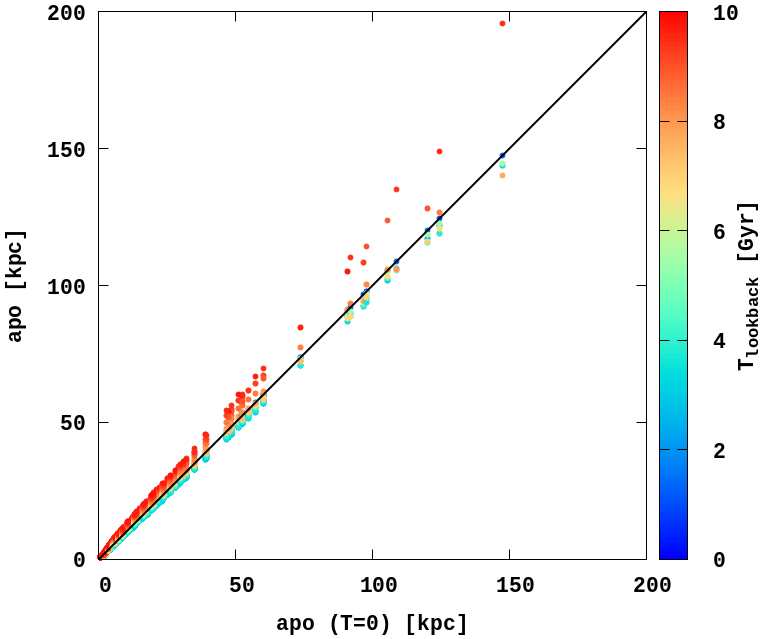
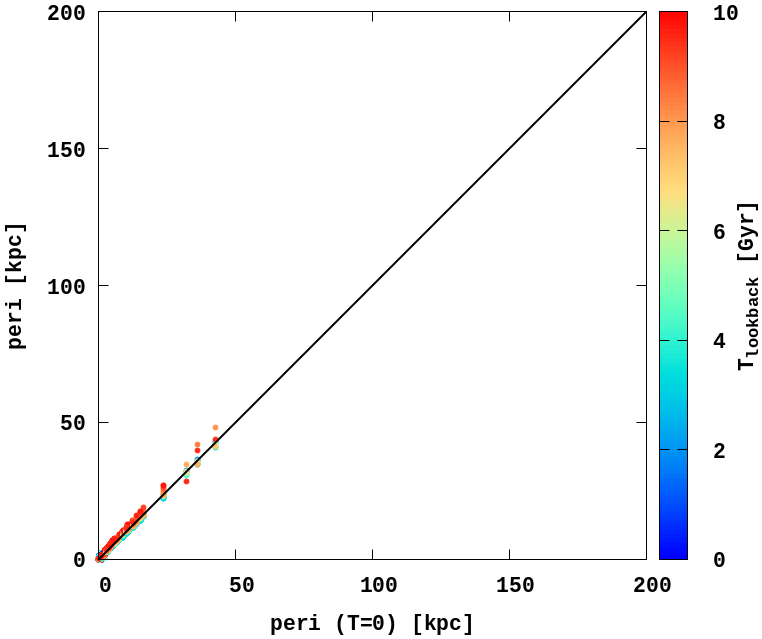
In Fig. 7 we present the GCs’ main orbital parameters evolution: apocenters and pericenters (as for a similar plot one can look of the work Bajkova et al. 2021, see Figure 9). On the -axis we plotted the apo and peri values of each GCs in the static (fixed) potential, that is, using the initial values of the #411321 IllustrisTNG-100 potential. The general behaviour of these quantities in our Fig. 7 and in the work of Bajkova et al. (2021) are quite similar. Up to roughly 5 Gyr lookback time we we did not notice significant changes in these quantities. But after approximately 8 Gyr the differences (especially in apocenters values) are become more significant (up to 25%).
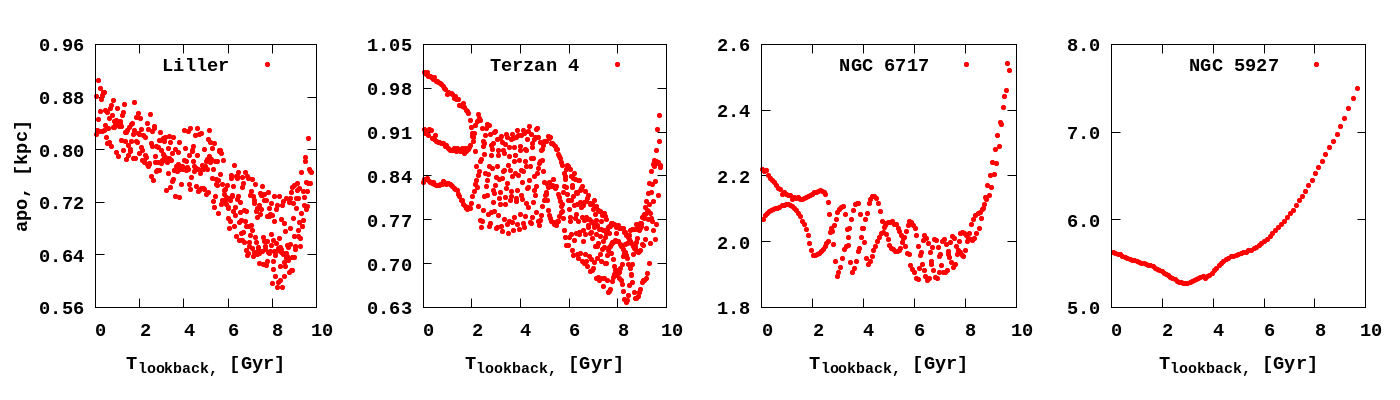
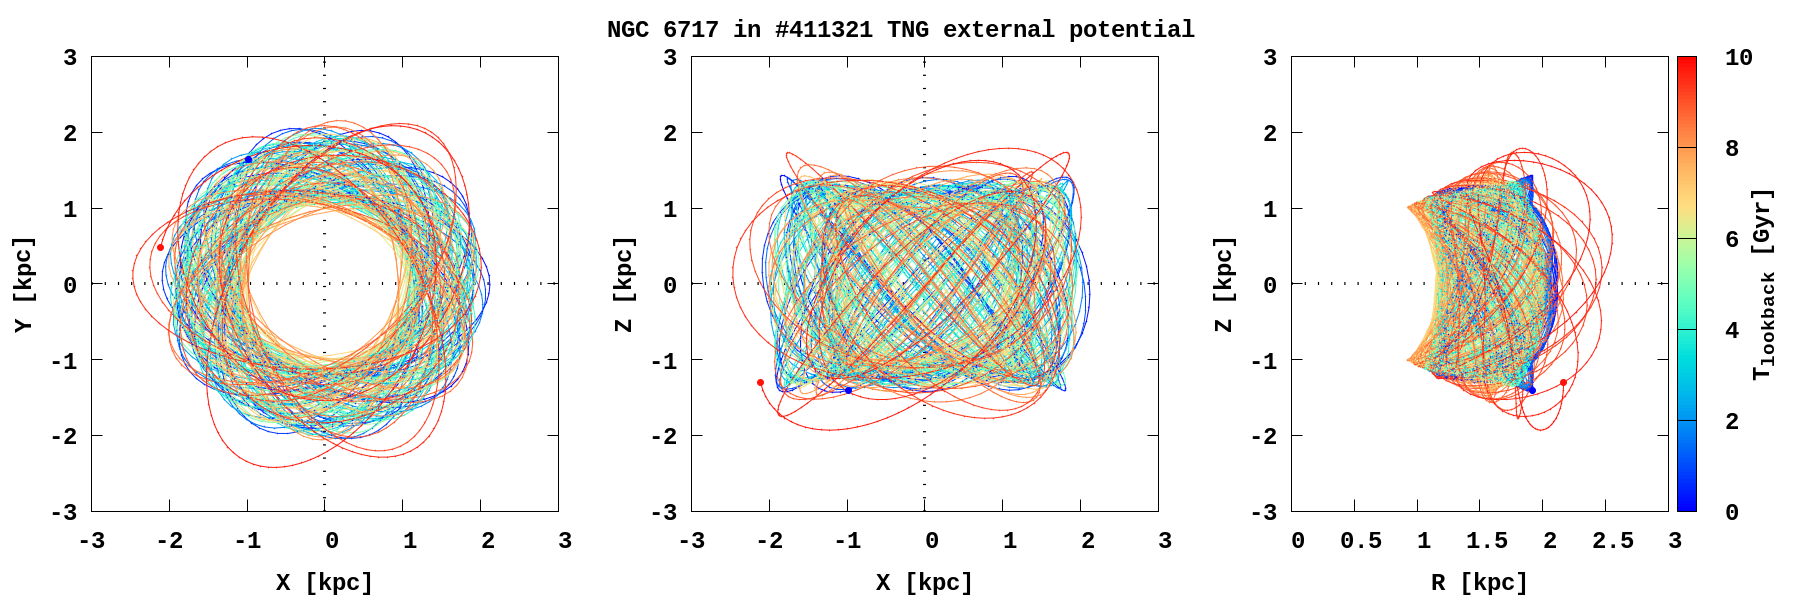
In Fig. 8 we present the evolution of the apocenters and pericenters during the full 10 Gyr lookback time integration in the #411321 TNG-TVP. For the visualisation, we selected several GCs with different heliocentric distances. In our representative sample, the Liller and Terzan 4 are the closest GCs to the Galactic centre.
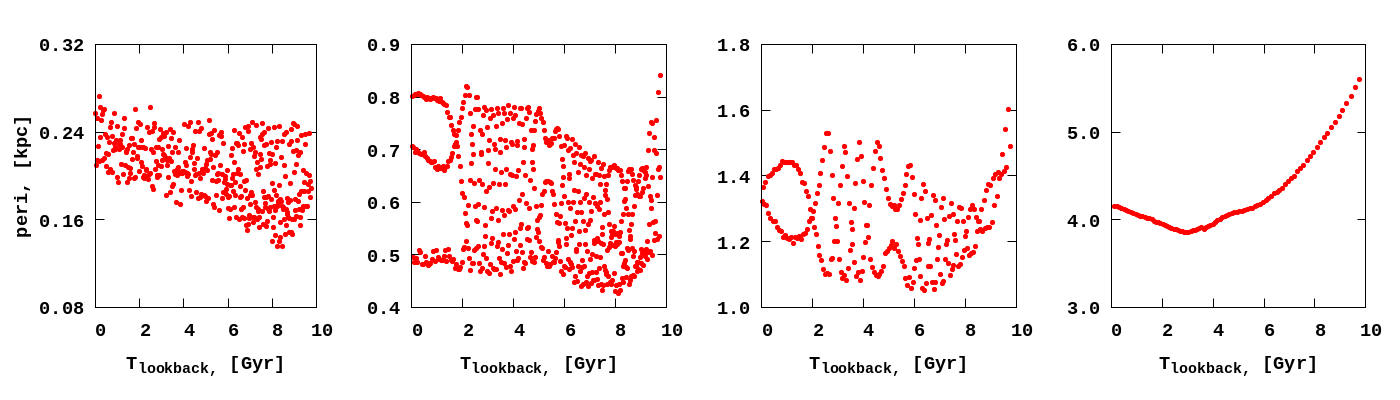
.
As we see in Fig. 8, the Liller and Terzan 4 as closest GCs have a clear decreasement of the apocenter with the minimum values at the 8 Gyr with further increasement. The NGC 6717 has a slow decline with the minimum at the same time. Meanwhile, we don’t see such a clear picture of pericenter evolution. Such a behaviour can be understood taking into account the more strong dependence of the apocenter value (compared to the pericenter) from the mass and size changes of our TNG-TVPs. At the same time, the GC 5927 apo- and pericenter changes are ‘synchronised’ and have a minimum value at 3 Gyr and after it starts to increase. The evolution of the apocenters and pericenters for all GCs we present on the web-sitefootnote 5, for all five TNG-TVPs and for each GC separately.
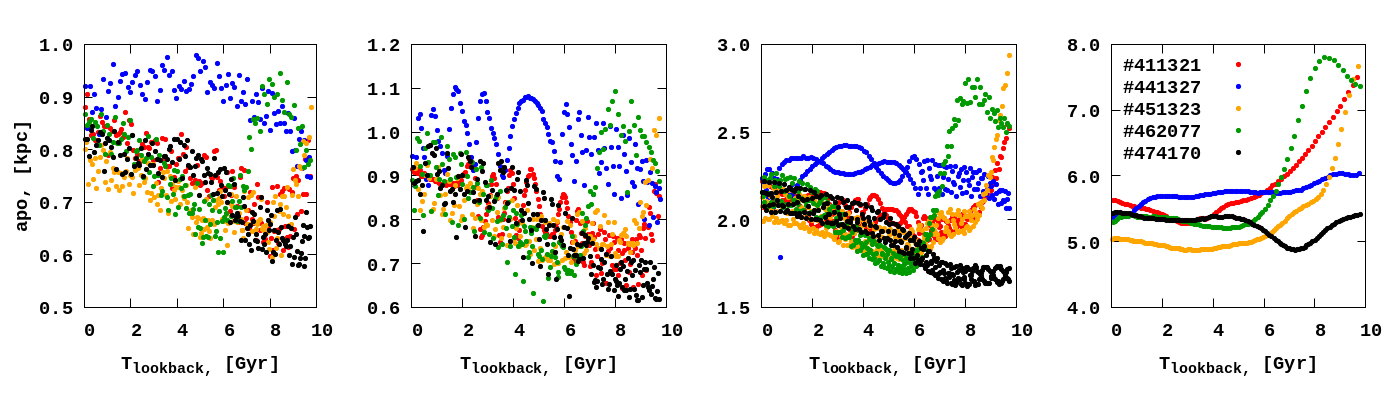
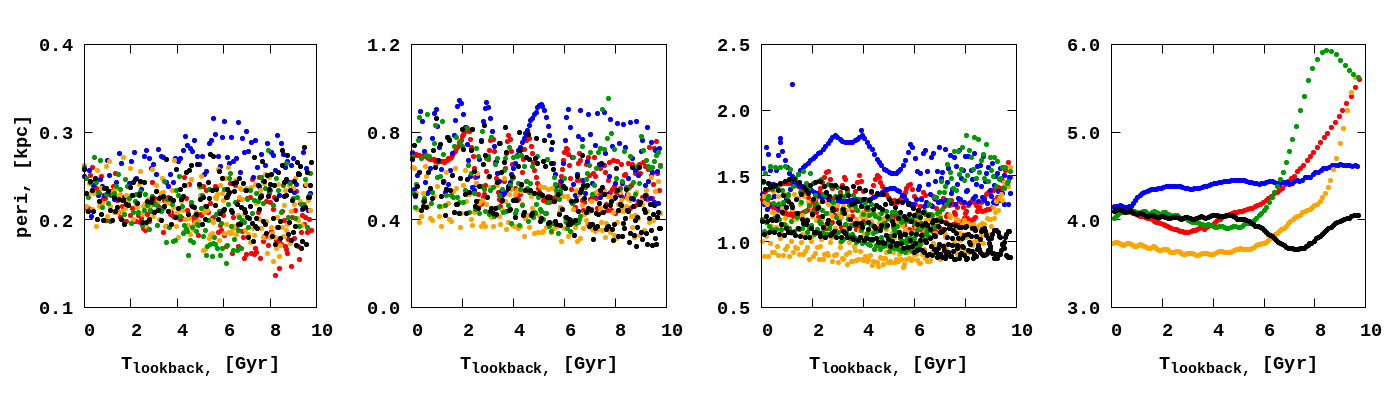
Also, we present in Fig. 9 the comparison of apocenters and pericenters of evolution for selected GCs in the five TNG-TVPs simultaneously. The pericenter evolution in all the five TNG-TVPs looks very similar. The apocenter evolution shows some differences for different potentials, which we can understand as a more strong influence of the time variable masses and sizes of MW-like potentials to the orbits.
3.3 Types of orbits
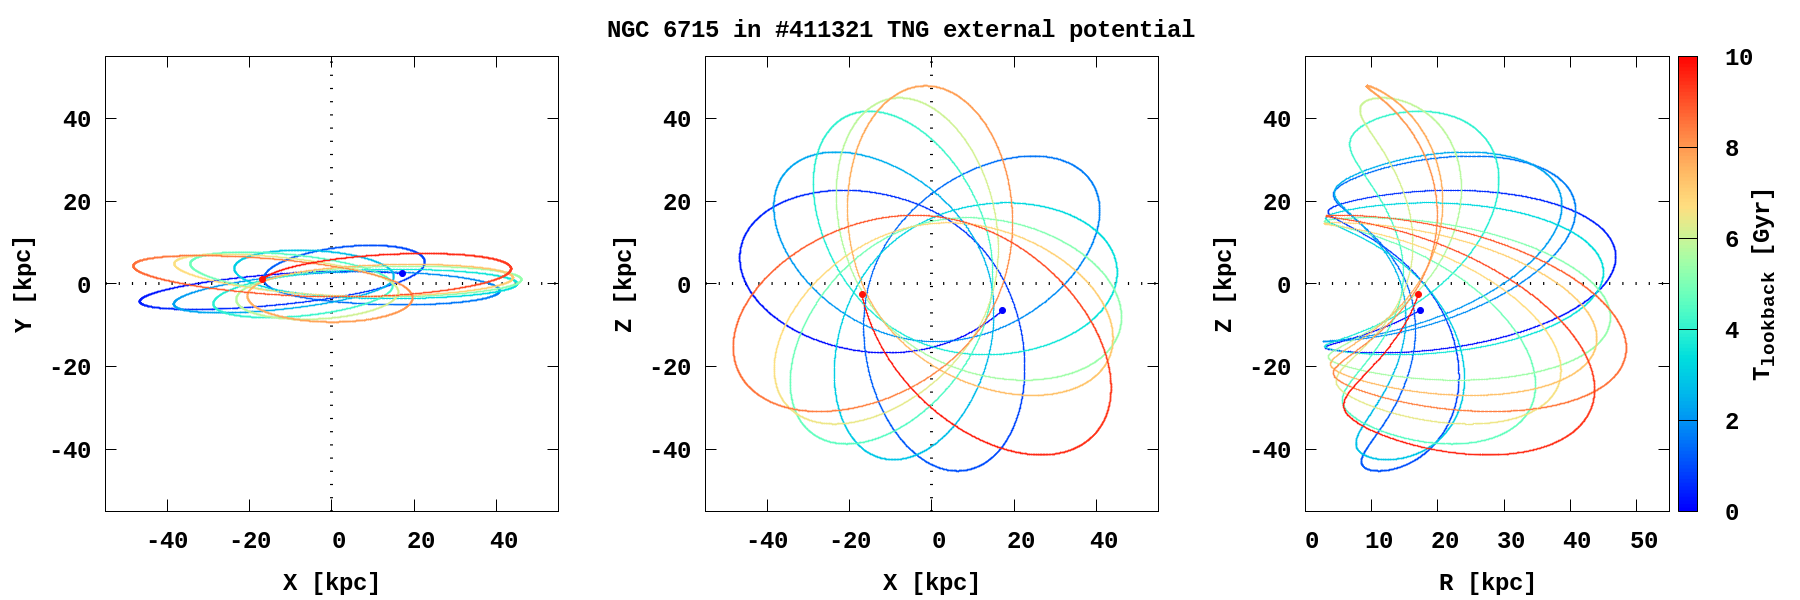
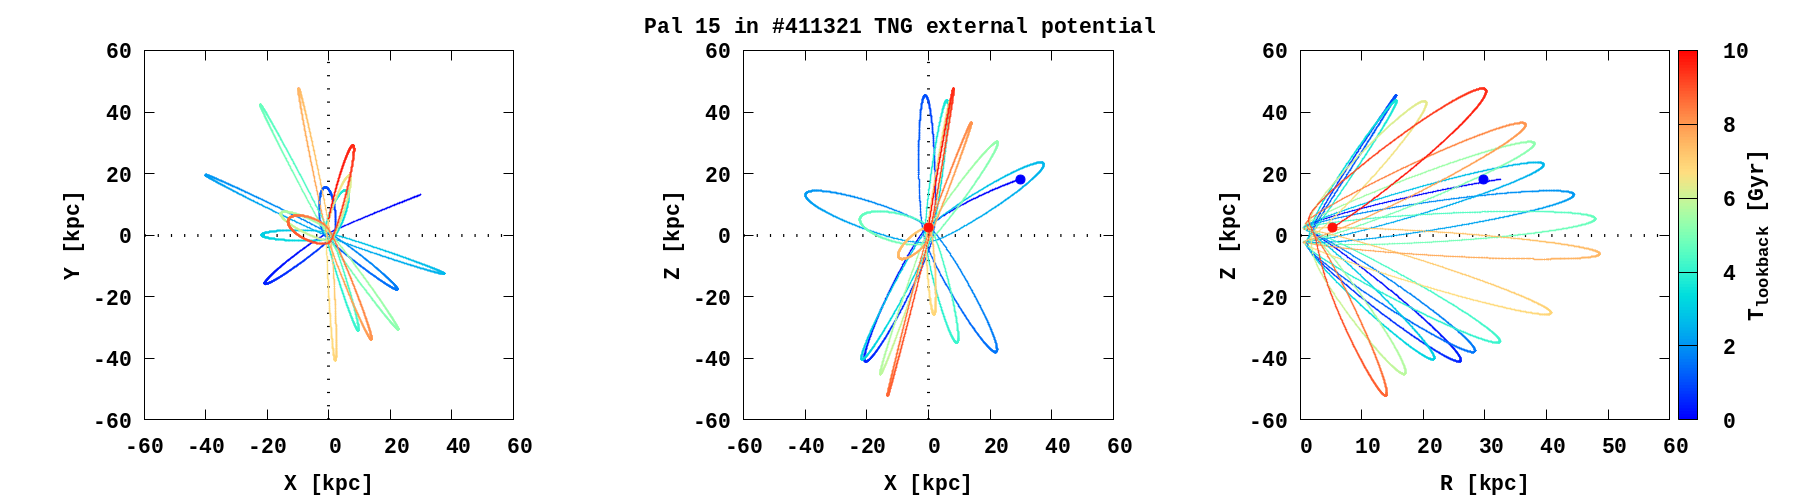
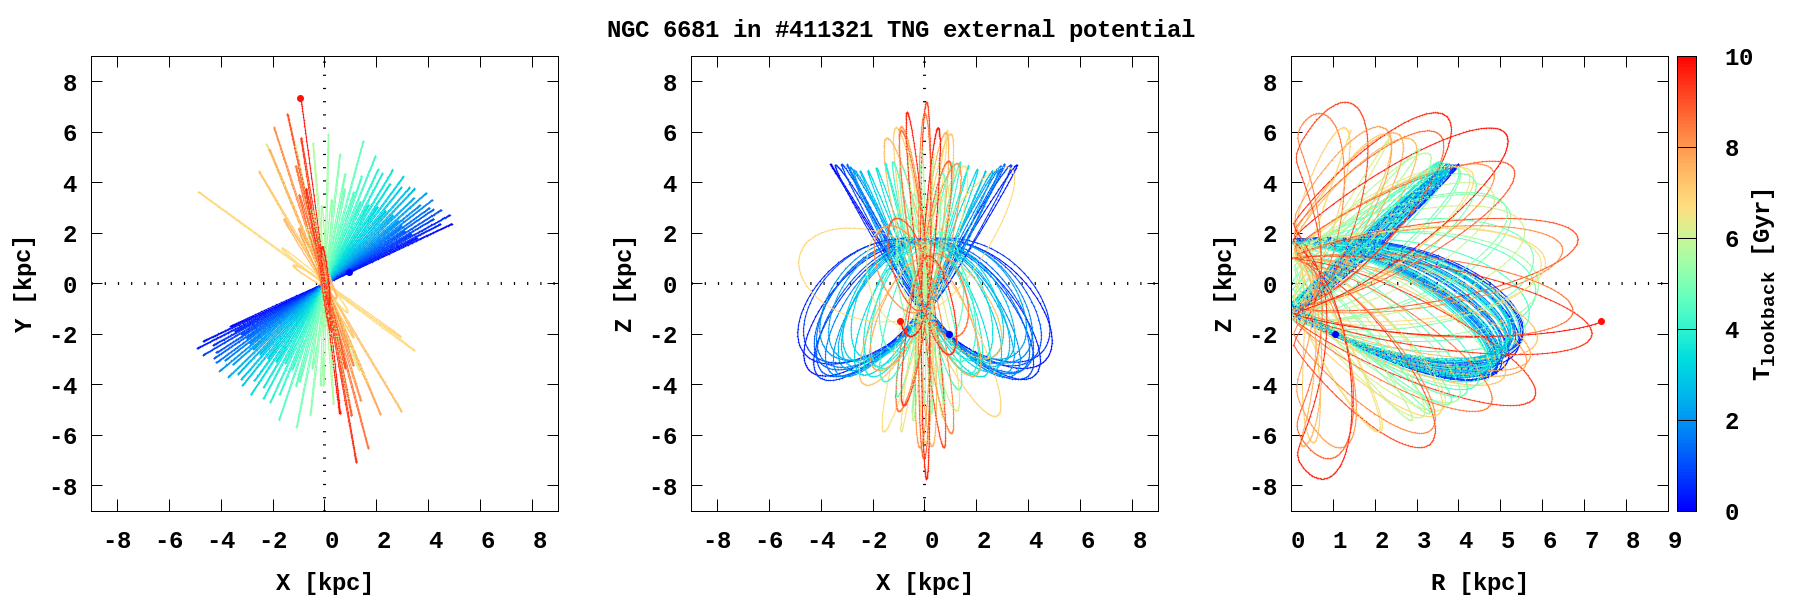
We calculated the orbits of 159 GCs lookback time for 10 Gyr in each of our TNG-TVP potentials. The orbital evolution for our GC sample is presented online555 We also presented orbits for all 159 GCs in TNG-TVP potentials on the web site of the project https://bit.ly/3b0lafw. The visualisation was carried out in three projections of the Cartesian Galactocentric rest-frame: (, ), (, ), and (, ), where is the planar Galactocentric radius. As we see, the orbits change in different potentials, but their general shape remains similar.
The shape filled by an orbit in an axisymmetric potential might be classified as a short-axis tube, thin tube, etc., depending on specifics of the potential (e.g., oblate/prolate) and the particular combination of integrals of motion the orbit possesses (Carpintero & Aguilar, 1998; Merritt, 1999). For our purposes, after a visual analysis of 159 orbits (in each of our TNG-TVP potentials), we divide them into four main types (categories):
-
•
Tube orbit (TB) – (69%) orbits. The orbit is mainly in the (, ) Galactic plane with a hole in the centre. The orbit in the (, ) plane has a boxy shape and in the () has a trapezoidal shape.
-
•
Perpendicular tube orbit (PT) – (5%) orbits. The orbital plane is close to the meridional, also contains a hole in the centre and in the (, ) plane has a trapezoidal shape.
-
•
Long radial orbit (LR) – (12%) orbits. These are long-period, near-hyperbolic orbits characterised by large eccentricity with no prominent hole in the centre.
-
•
Irregular orbit (IR) – (14%) orbits. The orbit can not be classified as one of the described above.
3.4 Association with the regions of the Galaxy
We assumed that Galaxy has several spatial components: bulge, thin disk, thick disk and main halo. Each GCs’ orbit can be associated predominantly with one of them (based on the distance criteria). Such associations weakly depend on orbits shape. We analysed the orbits of all 159 GCs in each potential to sort them by ownership to the different regions of the Galaxy at the past billion years. For this classification we used the following characteristic scales according to Bland-Hawthorn & Gerhard (2016) for orbital apocenter and pericenter of each GCs:
-
•
Bulge (BL). Scale height in directions - 0.2 kpc. Scale length in plane - 0.7 kpc. With such a scales we determine the boundary dimensions for the bulge as 2.1 0.6 kpc. We associated nine GCs.
-
•
Thin disk (TN). Scale height in directions - 0.3 kpc. Scale length in plane - 2.6 kpc. With such a scales we determine the boundary dimensions for the thin disk as 7.8 0.9 kpc. We associated ten GCs.
-
•
Thick disc (TH). Scale height in directions - 0.9 kpc. Scale length in plane - 2 kpc. With such a scales we determine the boundary dimensions for the thick disc as 6 2.7 kpc. We associated 47 GCs.
-
•
Halo (HL). Over then 2.7 kpc in direction and more than 7.8 kpc in plane. We associated 94 GCs.
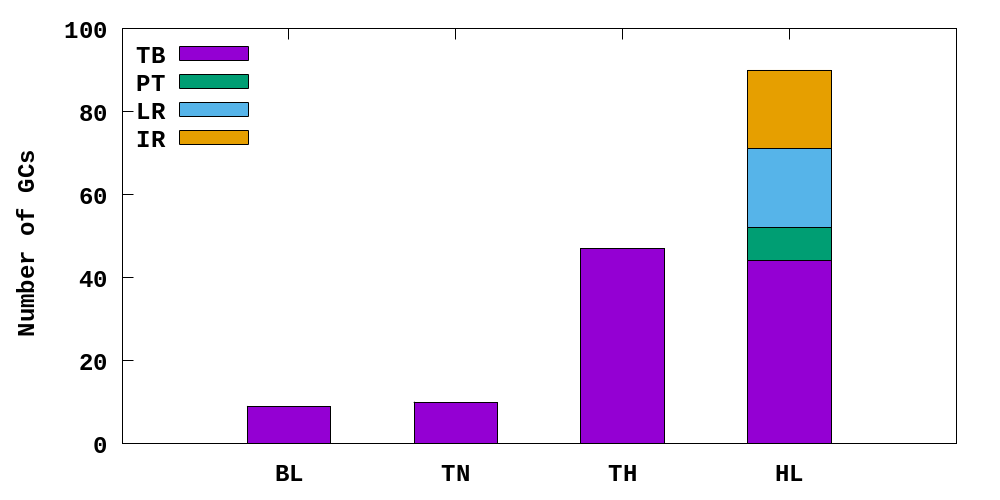
As we see from Fig. 10 most GCs at the present stage (last billion year) belong to the halo and thick disk, at 59% and 30%, respectively. The bulge and thin disk contain just 5% and 6% GCs. But in the distant past there is a high probability that some of the GCs belonged to other regions of the Galaxy (e.g. Bajkova et al., 2020; Sun et al., 2023). A possible explanation is that GCs survive better when they are far from the Galactic centre. We listed the associations with different Galaxy components for each GC in Table 6. This classification is also stable for each of the five different TNG-TVP, which made, in our point of view, these potentials quite representative.
The majority of the GCs from the bulge, thin and thick have tube orbits, see Table C. Possibly, it underwent extreme encounter(s) with another GC, which changed its orbit. In contrast, halo GCs display all types of orbits, with the most common being tube, irregular and long radial orbits. Also, the halo harbours objects with all GCs that have perpendicular tube orbits.
3.5 Energy changes of Globular Clusters during evolution
Since we consider the dynamics of the MW GCs in the evolving potentials, the integrals of motions (energy and angular momentum) are not conserved over time. In order to quantify this, we calculated the relative energy changes during the evolution of GCs over 10 Gyr. In Fig. 11 we present the relative energy changes of individual GCs during the orbit integration. In general, we see the effect of Galaxy mass changes in our selected TNG-TVPs (Fig. 2). We found that, the maximum relative energy changes are 45-50%. As an example, in Fig. 11 we highlighted five GCs in colour: BH 140 and VVV CL001 (red and blue colours) associated with the Galactic disk and likely formed in-situ; AM 4, Sagittarius II, and Lae 3 associated with the halo and likely born outside the Galaxy (see the definition of association Malhan et al., 2022; Fernández-Trincado et al., 2021). All other 154 GCs are marked with a grey colour. As we can see from Fig. 11, the in-situ GCs are less affected by the changes in the gravitational potential compared to the accreted clusters. This trend is especially visible on the last panel of the Fig. 11 for the #474170 TNG-TVP.
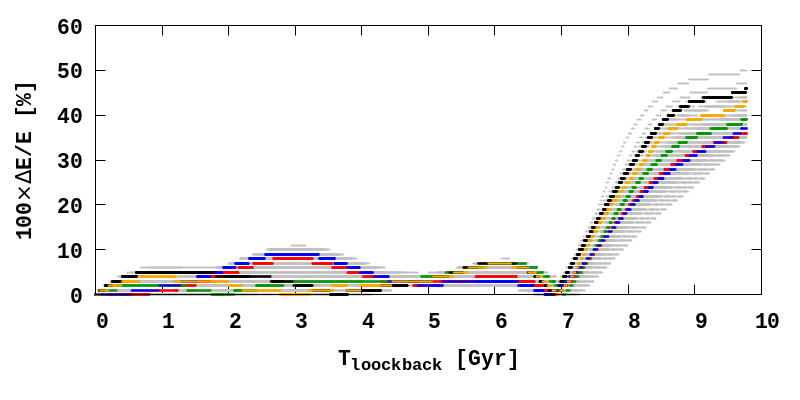
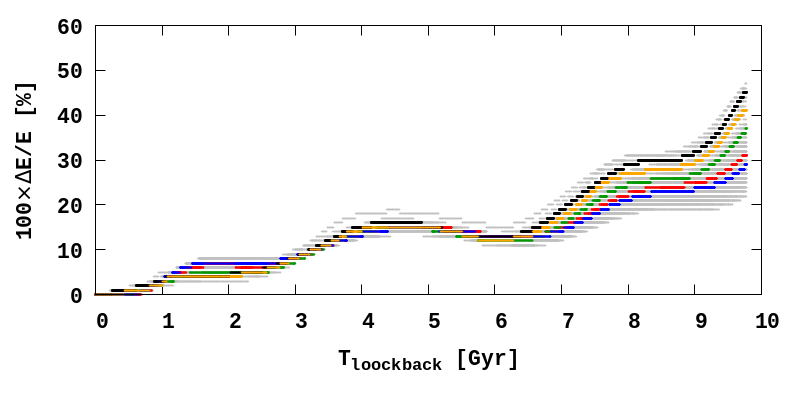
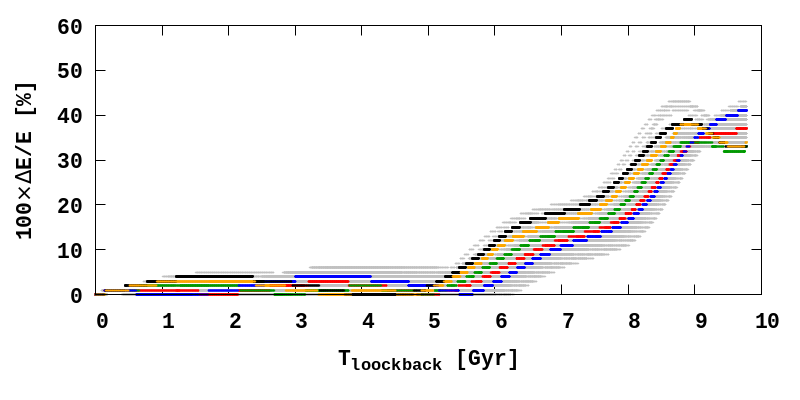
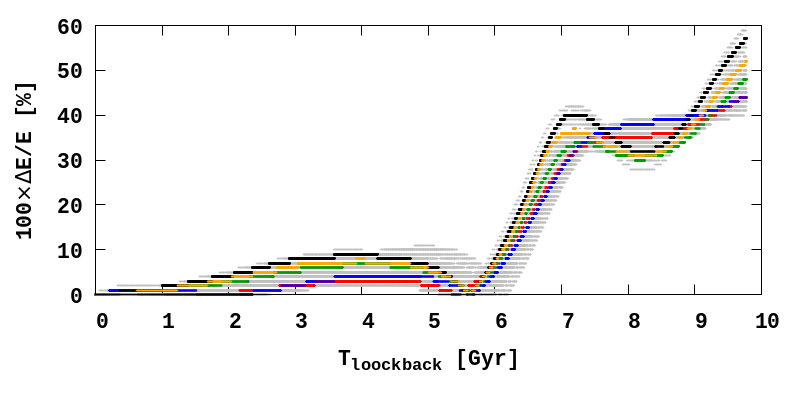
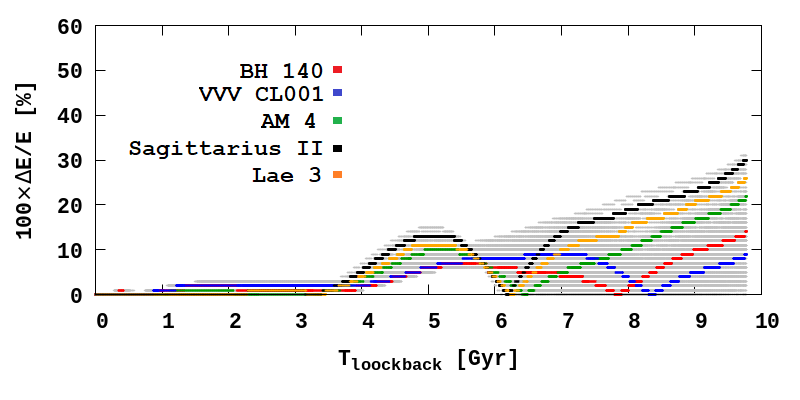
We also identified the list of GCs whose relative energy has changed by more than 40%. For simplicity, we present the list of GCs from the #411321 TNG-TVP only:
All of them belong to the halo (HL) and, in most cases they have either irregular (IR) or perpendicular tube-type (PT) of orbits, see Table 6.
4 Globular Clusters in phase spaces
4.1 Present-day properties of the Globular Clusters
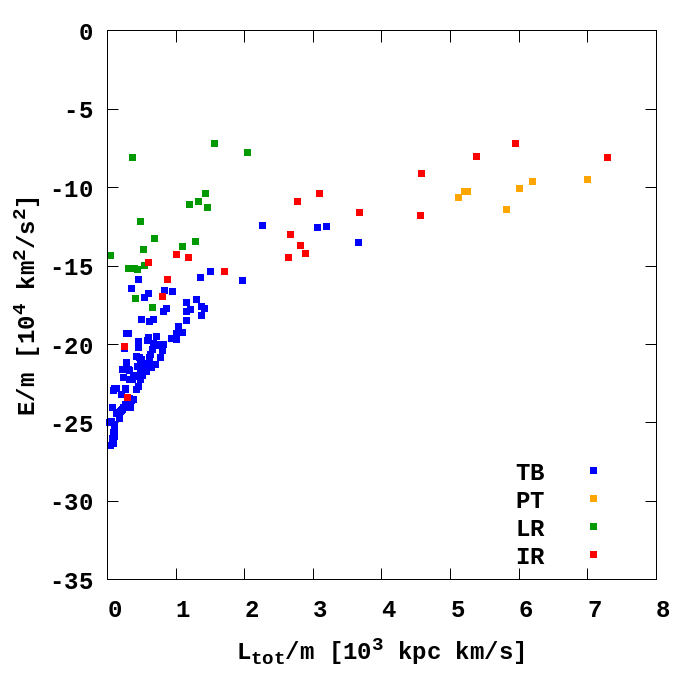
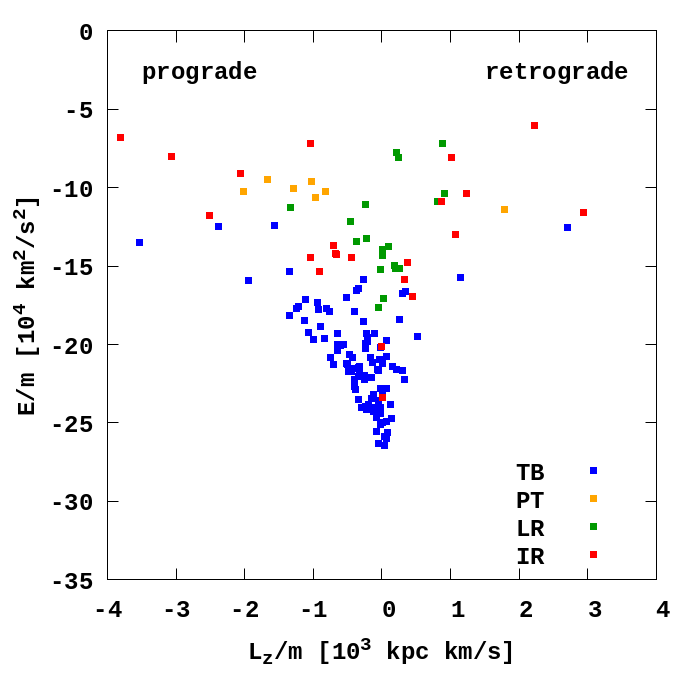
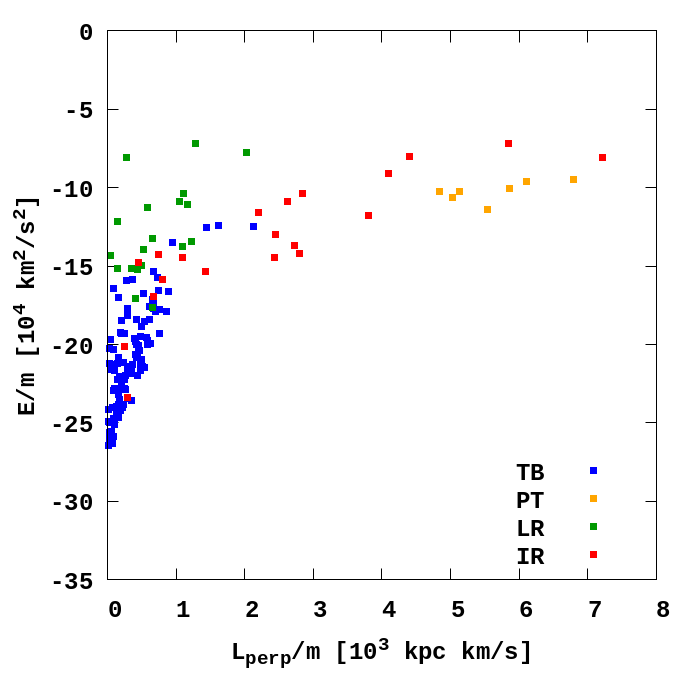
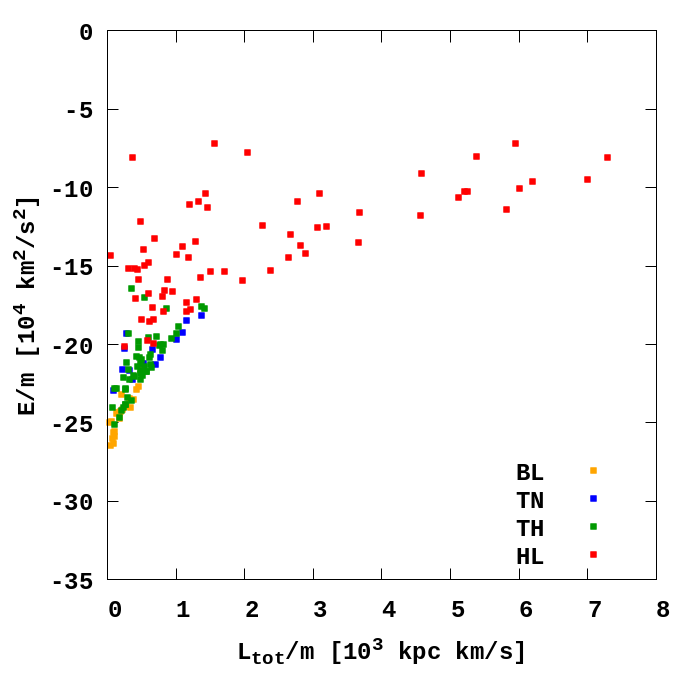
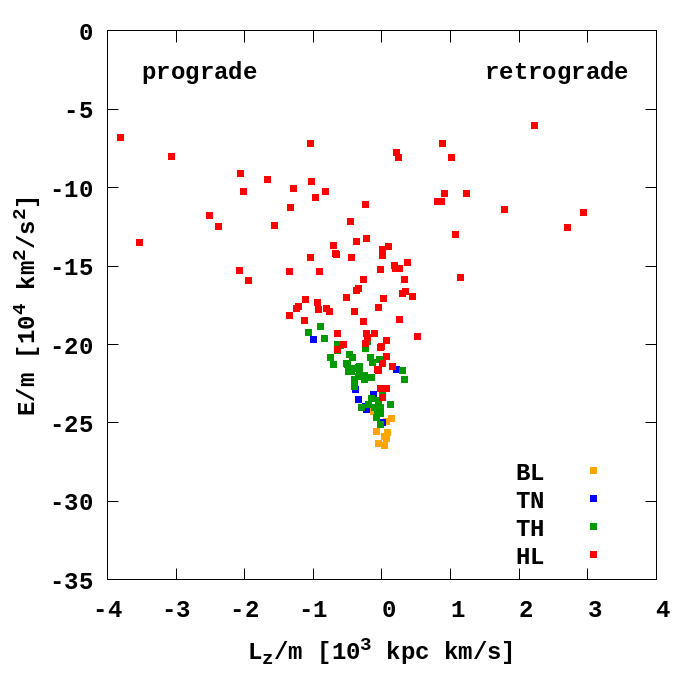
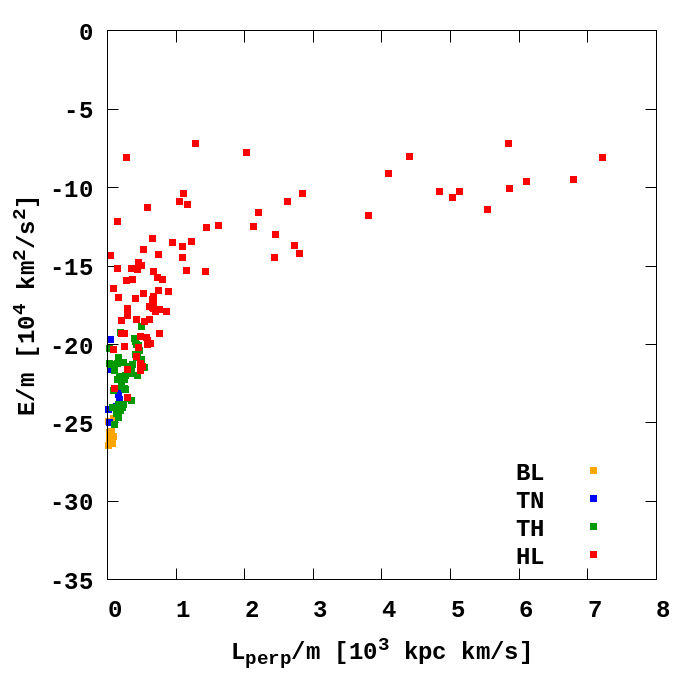
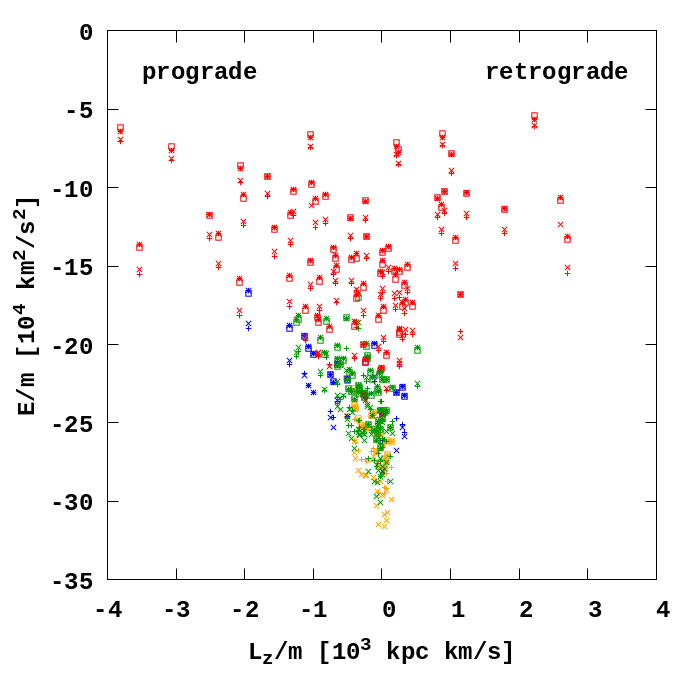
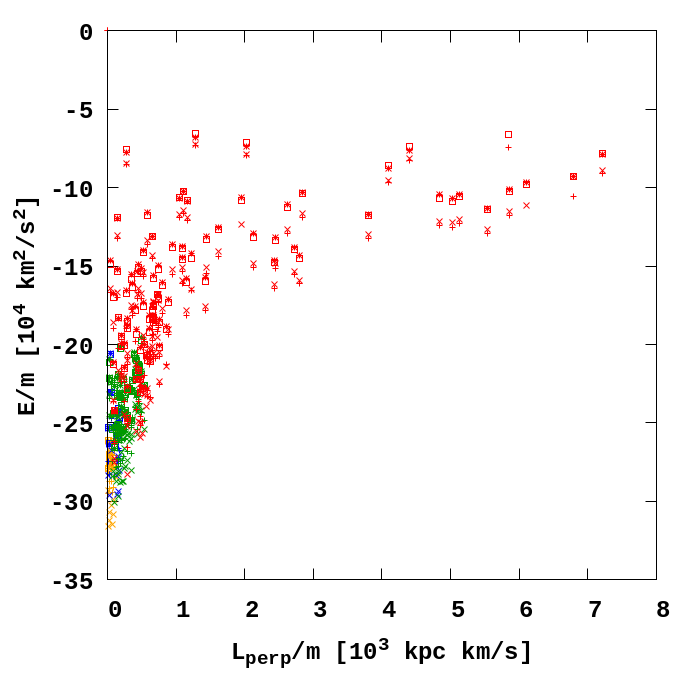
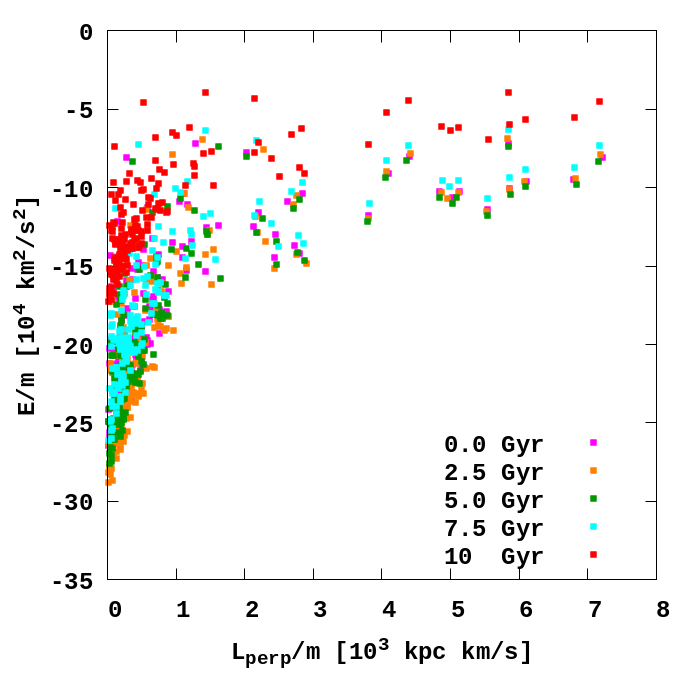
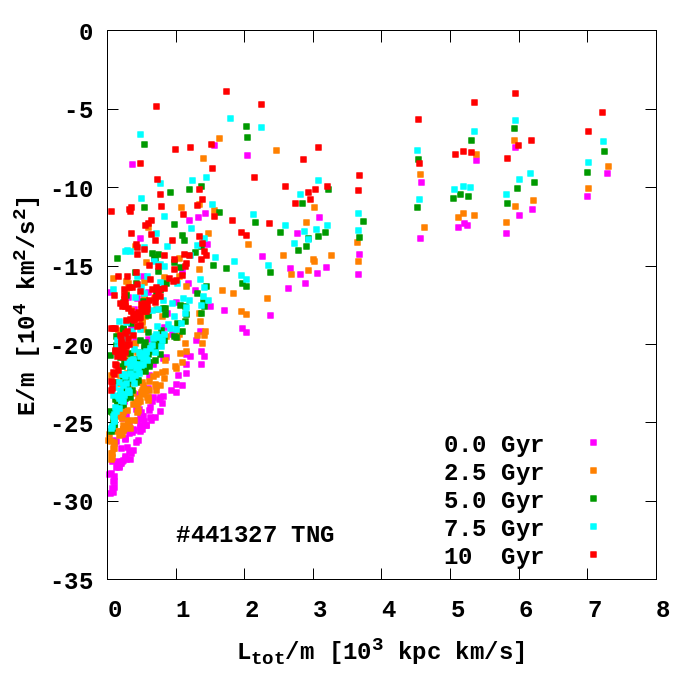
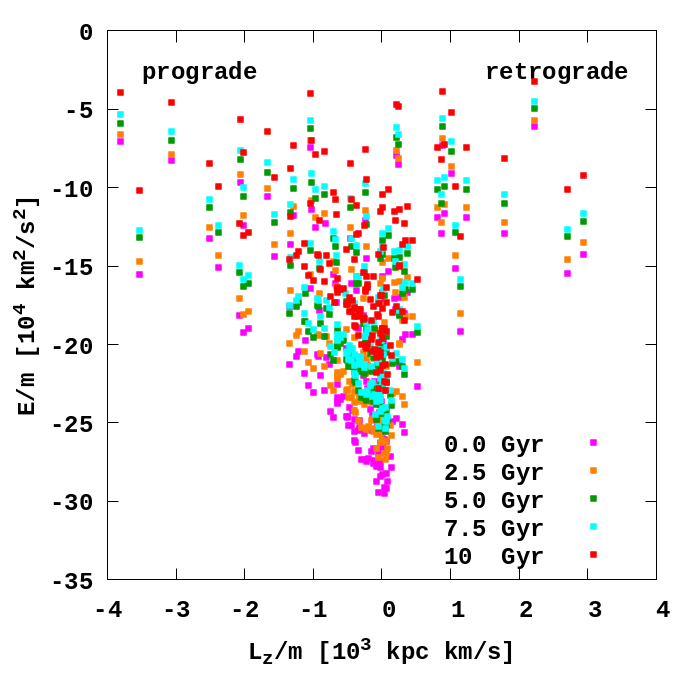
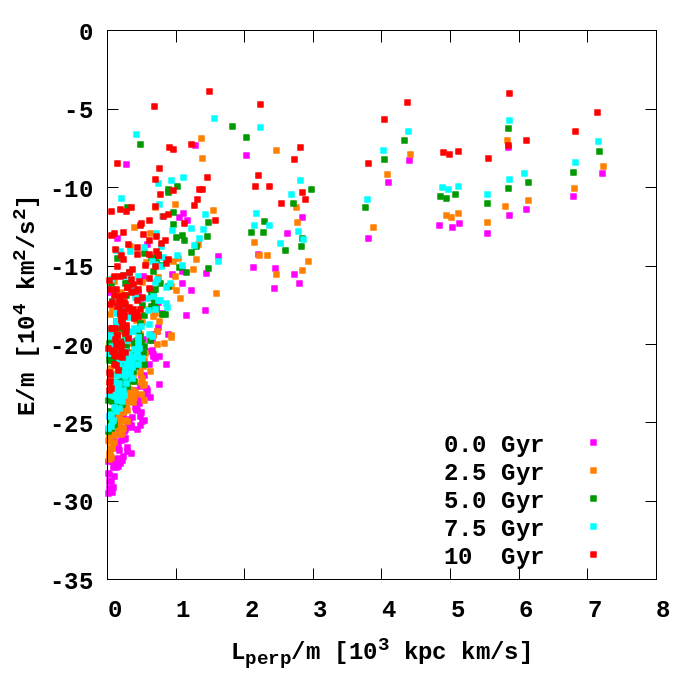
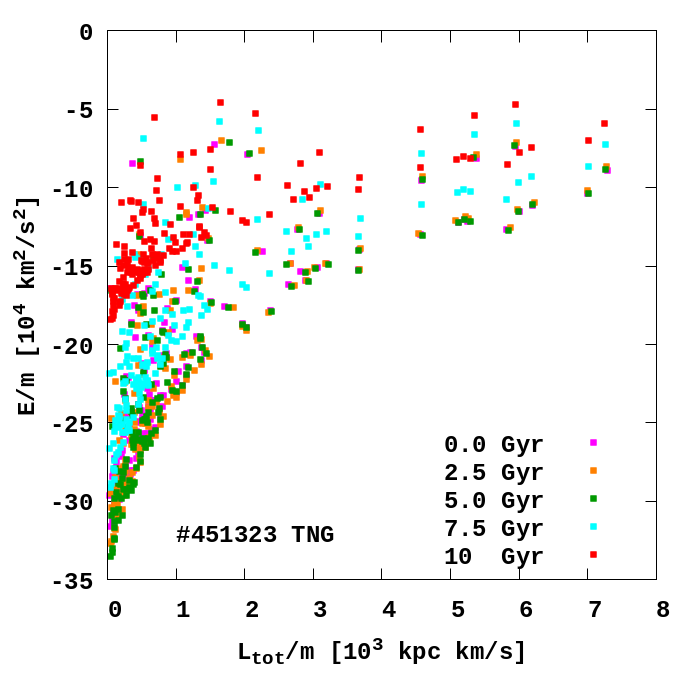
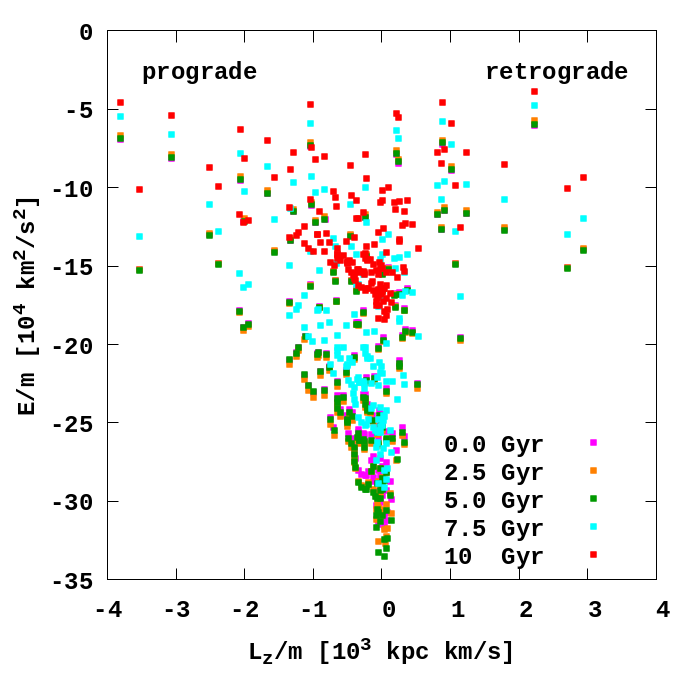
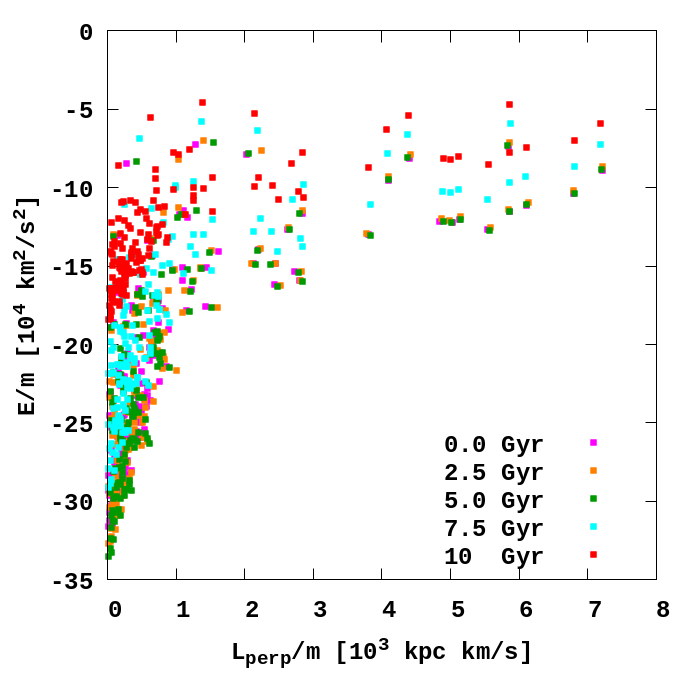
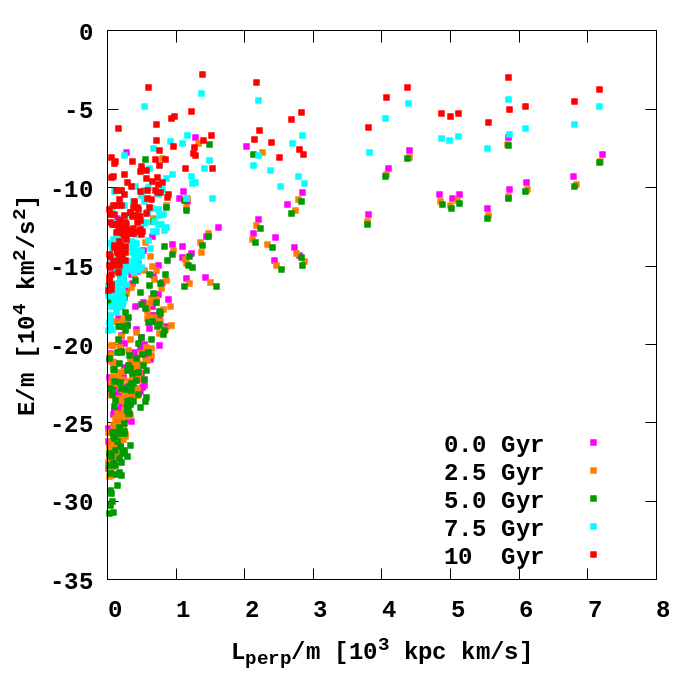
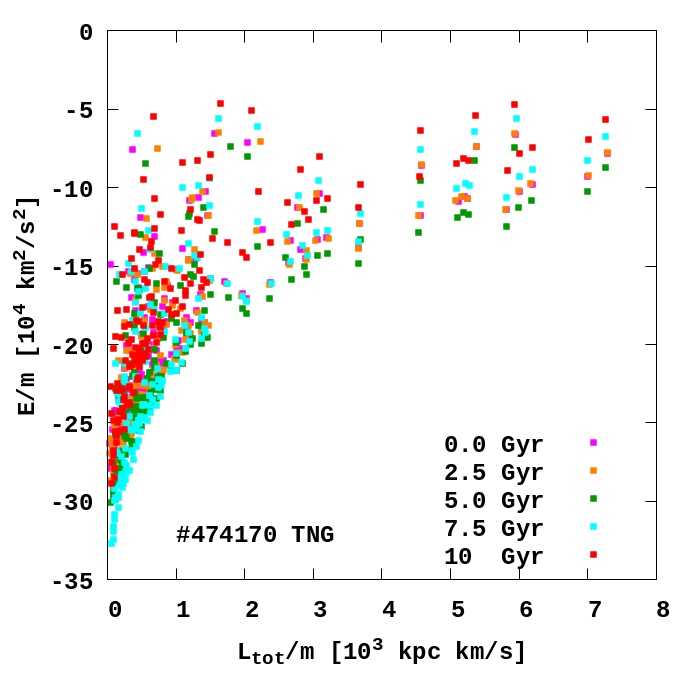
In our study we analyse the GCs’ phase space distributions in the energy-angular momentum coordinates for each of the TNG-TVPs. Below, we consider specific values of energy and angular momentum normalised by the GCs’ mass. In particular, we analyse the phase-space distribution of the GCs at present in three phase space coordinates combinations: total angular momentum () versus total energy (), -component of the angular momentum () versus total energy (), and the perpendicular component of the angular momentum () versus total energy (), where and . The orientation of the -axis in our Cartesian Galactocentric coordinates is directed towards to the Galactic South Pole. By this definition the angular momentum of the Sun is negative.
Next we discuss the main relations in the energy-angular momentum space for the GCs of different orbital types. In Fig. 12, the GCs are colour-coded according to the type of orbit in the #411321 potential. GCs with TB orbits have better GCs bounds, orbiting close to the Galactic center since their total energies are largest (by absolute value). Most of the GCs with TB obits show from zero to some prograde rotation with the smallest perpendicular angular momentum component. It can indicate their common dynamical origin or possible orbital evolution as a consequence of their similar angular momentum losses timescales.
Globular clusters with IR orbits show a wide range of the total energy and the angular momentum components and overlap with the GCs of other types of orbits. Their origin is unlikely the same based on the quite wide range of their angular momentum.
The GCs with LR orbits have a wide range of the total energies but tend to have smaller absolute values of the angular momentum. Interestingly these GCs have a relatively narrow range of with a weak trend to have a retrograde rotation.
The smallest group of the GCs with PT are grouped together in all the energy-angular momentum phase coordinates presented in Fig. 12. They have roughly the same total energy, substantial net rotation, and strong motions perpendicular to the disk plane. The large values of might suggest their common origin. As it was mentioned above, the GCs have the same type of orbits in different TNG-TVPs. Therefore, the described picture is quite similar in all external potentials considered in the paper.
Next, we show the association of the GCs with different Galaxy components presented in the energy-angular momentum phase coordinates. In Fig. 13, (top row), we colour-codded the GCs associated with bulge (BL, yellow), thin disk (TN, blue), thick disk (TH, green), and halo (HL, red) Galactic regions. For simplicity, we present the GCs’ parameters only in the #411321 TNG-TVP. As we can see from the top panel in Fig. 13, as expected, the GCs that belong to the bulge (BL) and thick disk (TH) have the maximum negative energy values in the entire sample. But the bulge GCs have a relatively narrow energy range compared to the thick disk GCs. The GCs associated with the halo form a system which is less bound with the Galaxy. They have wide energy and angular momentum ranges.
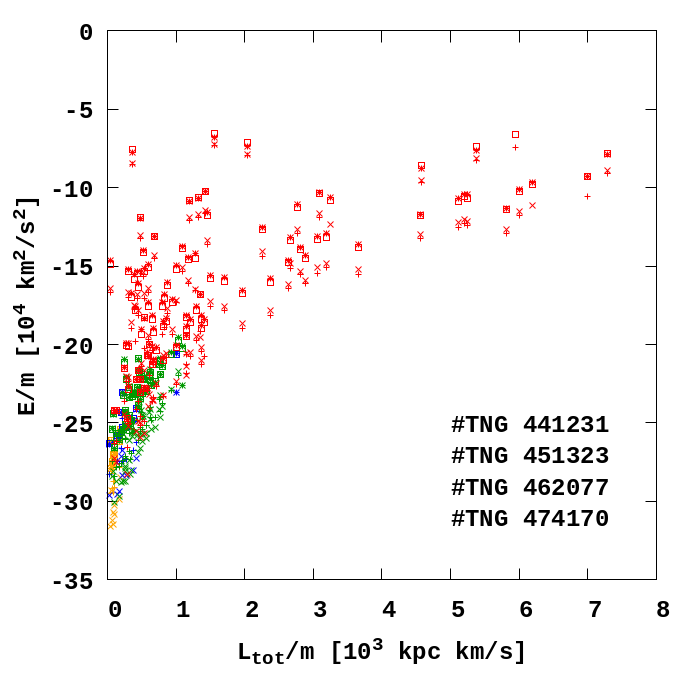
In Fig. 13 we present a comparison of the GCs’ positions in the phase space for other four #441327, #451323, #462077, and #474170 TNG-TVPs, bottom panel. The colours (as on the top panel) represent the associations with the different regions of the Galaxy. Different symbols correspond to different potentials. Comparing the GCs in different potentials at the present we can conclude that there are no significant differences in their values in the angular momentum space. The visible differences in energy values can be easily explained with different parameters of the galactic potentials (see Table 1) at the present. At the same time, we can note that our sample of external potentials does not give any strong mutual discrepancies.
4.2 The Globular Cluster subsystem phase space evolution in five time-varying potentials
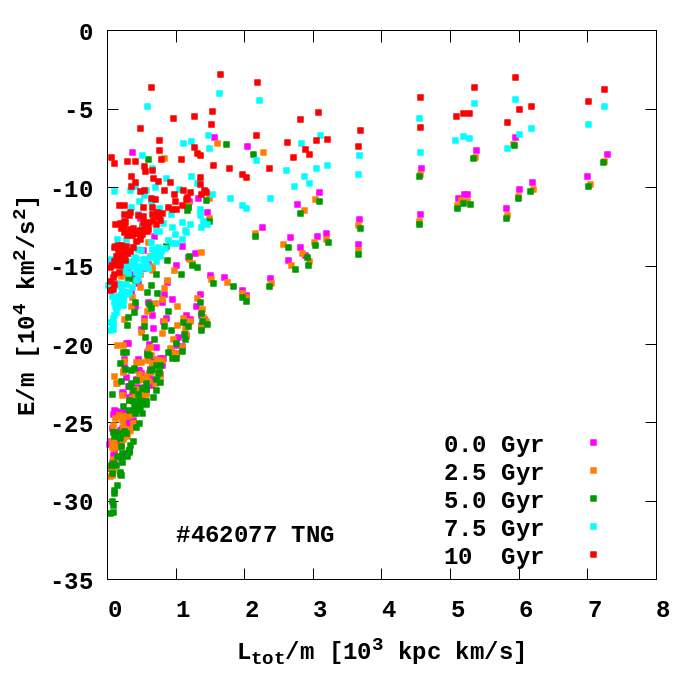
Using the time-evolving potentials, we can explore the effect of the Galactic parameters time-variation on the GCs’ phase space distributions in energy and angular momentum. In Figs. 14 and 15 we show the GC systems snapshots for different times (0.0, 2.5, 5.0, 7.5, and 10 Gyr lookback time) for each of our TNG-TVPs.
As we can see from Figs. 14 and 15, all our external potentials provide roughly similar phase space energy values for individual GCs. The difference between potentials becomes more defined during evolution. In general, we can expect that at the beginning of the backwards integration ( Gyr), the energies of the GCs are more negative (that is, their bounding energies are larger; magenta) and at the end of the simulation (10 Gyr, red) their energies are more positive – this would mean GCs are less bounded which is not the case. Our expectations are fully met by the potential #441327 (Fig. 14, second row). Other TNG-TVP external potentials show slightly different behaviour. For example, the #451323 – (Fig. 14, third row), #462077 – (Fig. 15, first row) external potentials have maximum bounding energies at 5 Gyr (green). We can explain such behaviour if we check the evolution of the mass and characteristic scales from Fig. 2. For these two MW-like potentials around 5 Gyr, we can observe higher mass and smaller scale sizes (as for the halo and disk).
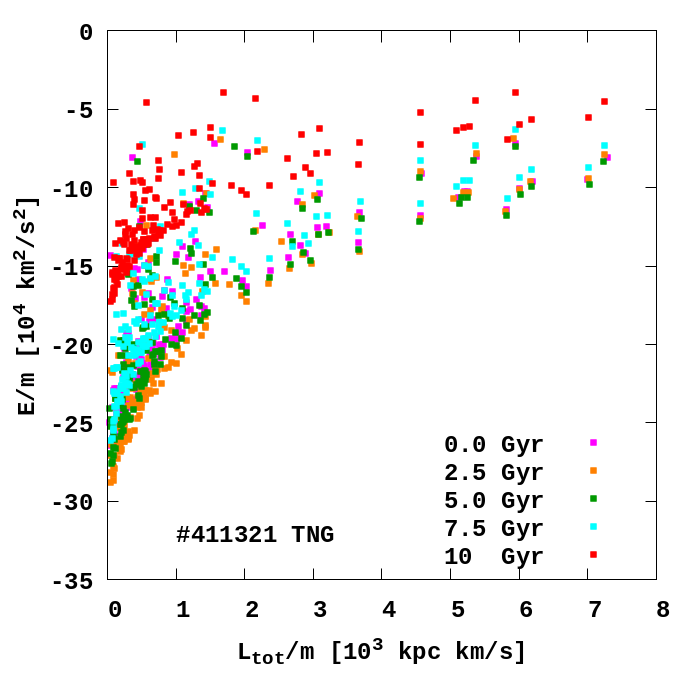
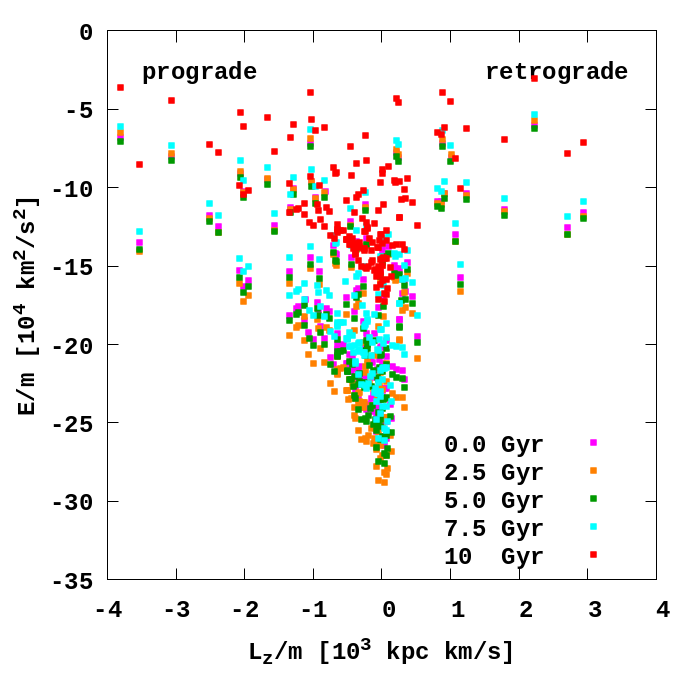
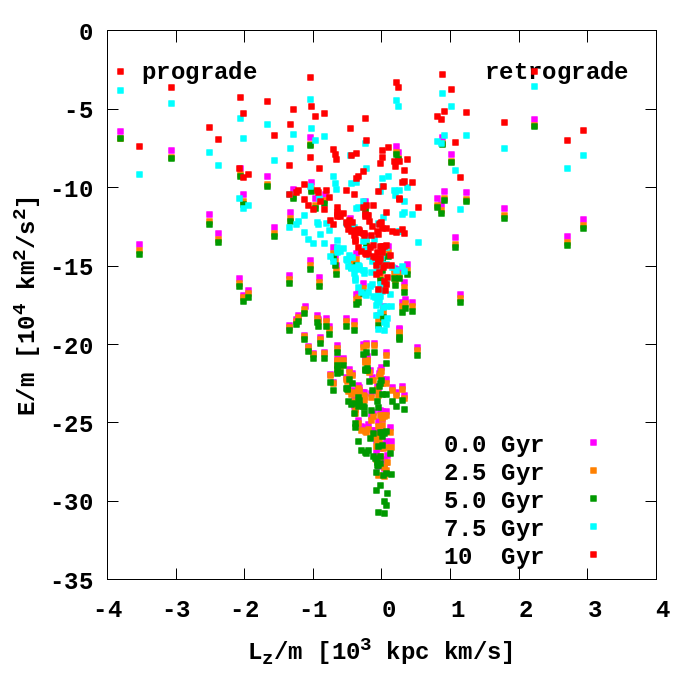
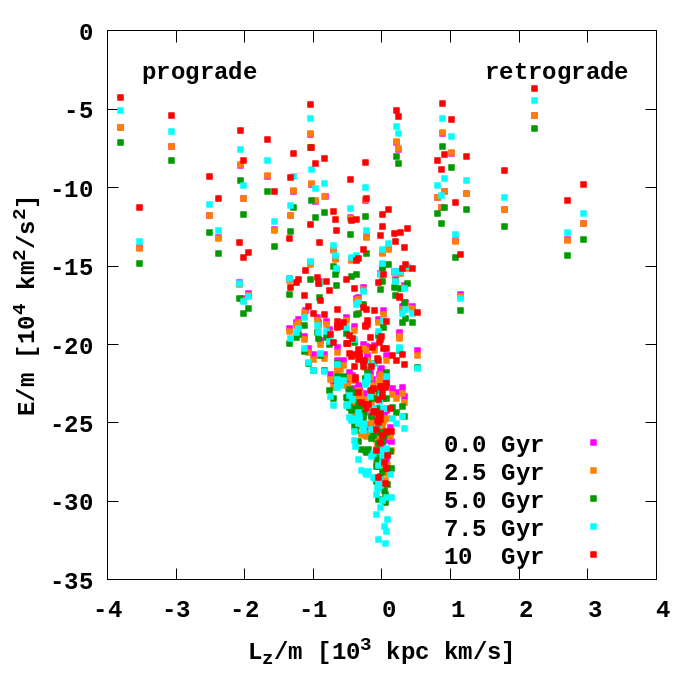
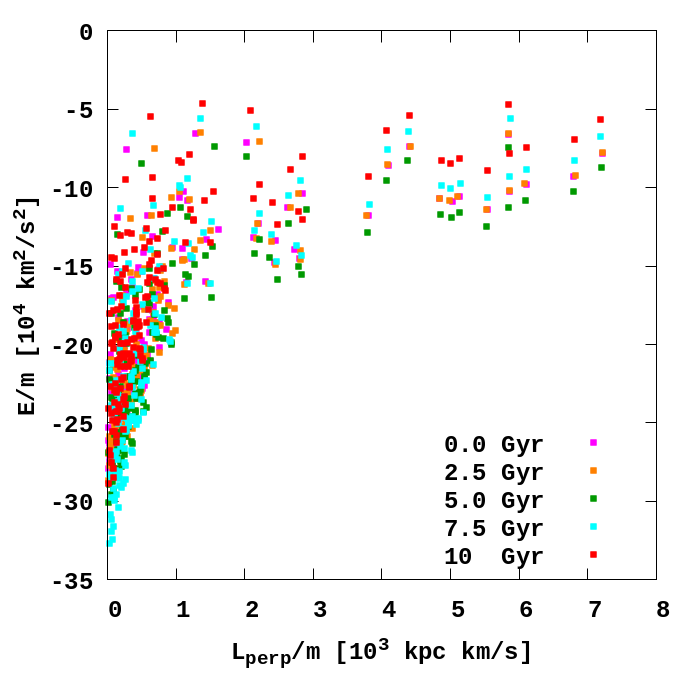
For the potential #411321 – (Fig. 14, first row) the energy evolution shows a more complex behaviour. First the energy values for GCs are going down (approximately 3 Gyr; orange and approximately 5 Gyr; green) and only after 7 Gyr (cyan) they starts to raise. Such a complex behaviour might be also understood based on the evolution of the halo and disk masses visible in Fig. 2 for this TNG-TVP.
In a case of the #474170 TNG-TVP (Fig. 15, second row). In contrast to the previous external potentials here in the beginning (up to approximately 3 Gyr; magenta–orange) we have almost a constant halo mass and characteristic scale.
In general, we conclude that the evolution of the GCs’ phase space distributions weakly varies in the five selected TNG-TVPs. The differences are obviously caused by slightly different accretion history, which originally come from the IllustrisTNG-100 simulation.
5 Conclusions
In this paper, we studied the orbital evolution of 159 Milky Way globular clusters up to 10 Gyr lookback time. For the initial positions, velocities and masses of each GCs, we used the values from the catalogues (Vasiliev & Baumgardt, 2021), which contain full 6D information from Gaia DR3. Analysing the errors and their distribution for the proper motions of right ascension and declination, heliocentric distances and radial velocities, we found that the vast majority (up to 95%) of the GCs have relative errors below 5% which allowed us to study the orbits with great precision.
For the orbital integration, we used a high-order parallel dynamical -body code GPU. To mimic the evolution of the MW mass distribution over time, we used the data from the IllustrisTNG-100 cosmological simulation. From the simulated subhaloes, we selected galaxies that best reproduce the Milky Way parameters at present. To obtain the spatial scales of the disks and dark matter halos, we decompose the mass distribution using the MN and NFW potentials. Also, to verify the similarity of the chosen TNG potentials to our Galaxy, we added an extra parameter - the observed circular velocity of rotation at the solar radius. Finally, we selected the five TNG galaxies #411321, #441327, #451323, #462077, and #474170 as time-variable external potentials for our study.
The main results of this study are as follows.
-
•
We integrated the orbits of 159 MW GCs up to 10 Gyr evolution in five external potentials. According to our results, we select a set of GCs which (at present time) belong to four main structural components of the Galaxy. We define nine GCs as currently belonging to the bulge (BL), ten – to the thin disk (TN), 47 – to the thick disc (TH), and 94 – to the halo (HL).
-
•
We also proposed the orbit classification according to the GCs’ orbital shapes in the , , and coordinate projections. Based on this classification, we found 110 GCs with tube orbits (TB), eight GCs with perpendicular tube orbits (PT), 19 GCs with long radial orbits (LR), and 22 GCs with irregular orbits (IR).
-
•
We analysed the evolution of orbital parameters of the GCs in all five external MW-like potentials. The relative individual changes of the semi-major axis and the eccentricities are quite significant (up to 50%). The time evolution of these orbital elements clearly shows the separation between the ‘inner’ and ‘outer’ GCs. The ‘inner’ GCs (3 kpc) have more regular and larger eccentricity changes during the evolution. The ‘outer’ GCs (3 kpc) have much smaller eccentricity changes during the whole backward integration time.
-
•
We analysed the evolution of the apocenters and pericenters for GCs and as a result, we can conclude the more prominent dependencies of the apocenter from the evolution of the MW-like potentials (masses and sizes). In case of pericenters, we don’t see such strong variations.
-
•
All our external potentials provide similar energy distributions for individual GCs. Comparing the GCs in different potentials at present, we can also conclude that there are no significant differences in the angular momentum space. Some differences were found in the energy distribution, which can be explained by different parameters of the galactic potentials (relative masses and spatial scales of stellar discs and DM halo). However, more differences (in GCs individual energies) appeared once we study the time evolution of the GC systems in the time-varying potentials.
-
•
We individually checked the relative energy changes during the orbital evolution of GCs up to 10 Gyr. Here we identified 18 GCs for which the change is more than 40%. Such a large change in the relative energies of these clusters also suggests their possible non-local origin (see also Malhan et al., 2022) (energy changes from 50% to 40% accordingly): Crater, Pal 3, Sagittarius II, Eridanus, AM 1, Pal 4, NGC 2419, Pyxis, Pal 14, Lae 3, Whiting 1, NGC 5694, Arp 2, Terzan 8, Terzan 7, NGC 7006, Pal 12, and Pal 13. We found that the in-situ formed GCs are less affected by the evolution of the TNG potentials as compared to the clusters, which are likely formed ex-situ.
Our study clearly shows that in order to constrain better the origin of the MW GCs it is vital to use time-variable Galactic potentials for the long-term ( Gyrs) analysis of the GC orbital evolution.
Acknowledgements.
The authors thank the anonymous referee for a very constructive report and suggestions that helped significantly improve the quality of the manuscript. MI, PB, CO and MM acknowledge support within the grant No. AP14869395 of the Science Committee of the Ministry of Science and Higher Education of Kazakhstan (‘Triune model of Galactic center dynamical evolution on cosmological time scale’). The work of MI was supported by the Grant of the National Academy of Sciences of Ukraine for young scientists. MS acknowledges the support under the Fellowship of the President of Ukraine for young scientists 2022-2024. The work of PB, MI and MS was also supported by the Volkswagen Foundation under the grant No. 97778. The work of PB was supported by the Volkswagen Foundation under the special stipend No. 9B870 (2022). PB and MI also acknowledge support from the National Academy of Sciences of Ukraine under the Main Astronomical Observatory GPU computing cluster project No. 13.2021.MM. This work has made use of data from the European Space Agency (ESA) mission Gaia (https://www.cosmos.esa.int/gaia), processed by the Gaia Data Processing and Analysis Consortium (DPAC, https://www.cosmos.esa.int/web/gaia/dpac/consortium). Funding for the DPAC has been provided by national institutions, in particular the institutions participating in the Gaia Multilateral Agreement.References
- Agertz et al. (2009) Agertz O., Teyssier R., Moore B., 2009, MNRAS, 397, L64
- Armstrong et al. (2021) Armstrong B. M., Bekki K., Ludlow A. D., 2021, MNRAS, 500, 2937
- Bajkova & Bobylev (2021) Bajkova A. T., Bobylev V. V., 2021, Research in Astronomy and Astrophysics, 21, 173
- Bajkova et al. (2020) Bajkova A. T., Carraro G., Korchagin V. I., Budanova N. O., Bobylev V. V., 2020, ApJ, 895, 69
- Bajkova et al. (2021) Bajkova A. T., Smirnov A. A., Bobylev V. V., 2021, Astronomy Letters, 47, 454
- Baumgardt & Vasiliev (2021) Baumgardt H., Vasiliev E., 2021, MNRAS, 505, 5957
- Baumgardt et al. (2019) Baumgardt H., Hilker M., Sollima A., Bellini A., 2019, MNRAS, 482, 5138
- Bennett & Bovy (2019) Bennett M., Bovy J., 2019, MNRAS, 482, 1417
- Bennett et al. (2022) Bennett M., Bovy J., Hunt J. A. S., 2022, ApJ, 927, 131
- Berczik et al. (2011) Berczik P., et al., 2011, in International conference on High Performance Computing, HPC-UA 2011. pp 8–18
- Berczik et al. (2013) Berczik P., Spurzem R., Wang L., 2013, in Third International Conference on High Performance Computing, HPC-UA 2013. pp 52–59 (arXiv:1312.1789)
- Birnboim & Dekel (2003) Birnboim Y., Dekel A., 2003, MNRAS, 345, 349
- Bland-Hawthorn & Gerhard (2016) Bland-Hawthorn J., Gerhard O., 2016, ARA&A, 54, 529
- Boldrini & Bovy (2022) Boldrini P., Bovy J., 2022, MNRAS, 516, 4560
- Bovy (2011) Bovy J., 2011, PhD thesis, New York University
- Bovy et al. (2012) Bovy J., et al., 2012, ApJ, 759, 131
- Carpintero & Aguilar (1998) Carpintero D. D., Aguilar L. A., 1998, Monthly Notices of the Royal Astronomical Society, 298, 1
- Chemerynska et al. (2022) Chemerynska I. V., Ishchenko M. V., Sobolenko M. O., Khoperskov S. A., Berczik P. P., 2022, Advances in Astronomy and Space Physics, 12, 18
- Conroy et al. (2021) Conroy C., Naidu R. P., Garavito-Camargo N., Besla G., Zaritsky D., Bonaca A., Johnson B. D., 2021, Nature, 592, 534
- Davies et al. (2020) Davies J. J., Crain R. A., Oppenheimer B. D., Schaye J., 2020, MNRAS, 491, 4462
- Donnari et al. (2021) Donnari M., et al., 2021, MNRAS, 500, 4004
- Drimmel & Poggio (2018) Drimmel R., Poggio E., 2018, Research Notes of the American Astronomical Society, 2, 210
- Dwek et al. (1995) Dwek E., et al., 1995, ApJ, 445, 716
- Fattahi et al. (2019) Fattahi A., et al., 2019, MNRAS, 484, 4471
- Fernández-Trincado et al. (2021) Fernández-Trincado J. G., et al., 2021, ApJ, 908, L42
- Ferrone et al. (2023) Ferrone S., Di Matteo P., Mastrobuono-Battisti A., Haywood M., Snaith O. N., Montouri M., Khoperskov S., Valls-Gabaud D., 2023, arXiv e-prints, p. arXiv:2301.05166
- Gaia Collaboration et al. (2018) Gaia Collaboration et al., 2018, A&A, 616, A1
- Gaia Collaboration et al. (2021) Gaia Collaboration et al., 2021, A&A, 649, A1
- Garro et al. (2022) Garro E. R., Minniti D., Gómez M., Alonso-García J., Ripepi V., Fernández-Trincado J. G., Vivanco Cádiz F., 2022, A&A, 658, A120
- Garrow et al. (2020) Garrow T., Webb J. J., Bovy J., 2020, MNRAS, 499, 804
- Genel et al. (2018) Genel S., et al., 2018, MNRAS, 474, 3976
- Gómez et al. (2015) Gómez F. A., Besla G., Carpintero D. D., Villalobos Á., O’Shea B. W., Bell E. F., 2015, ApJ, 802, 128
- Grand et al. (2019) Grand R. J. J., Deason A. J., White S. D. M., Simpson C. M., Gómez F. A., Marinacci F., Pakmor R., 2019, MNRAS, 487, L72
- Gratton et al. (2019) Gratton R., Bragaglia A., Carretta E., D’Orazi V., Lucatello S., Sollima A., 2019, A&A Rev., 27, 8
- Gravity Collaboration et al. (2019) Gravity Collaboration et al., 2019, A&A, 625, L10
- Habouzit et al. (2019) Habouzit M., et al., 2019, MNRAS, 484, 4413
- Haghi et al. (2015) Haghi H., Zonoozi A. H., Taghavi S., 2015, MNRAS, 450, 2812
- Harris (2010) Harris W. E., 2010, arXiv e-prints, p. arXiv:1012.3224
- Harris et al. (2013) Harris W. E., Harris G. L. H., Alessi M., 2013, ApJ, 772, 82
- Ibata et al. (2021) Ibata R., et al., 2021, ApJ, 914, 123
- Ishchenko et al. (2021) Ishchenko M. V., Sobolenko M. O., Kalambay M. T., Shukirgaliyev B. T., Berczik P. P., 2021, Reports of National Academy of Sciences of the Republic of Kazakhstan, 6, 94
- Johnson & Soderblom (1987) Johnson D. R. H., Soderblom D. R., 1987, AJ, 93, 864
- Katz & Gunn (1991) Katz N., Gunn J. E., 1991, ApJ, 377, 365
- Kereš et al. (2005) Kereš D., Katz N., Weinberg D. H., Davé R., 2005, MNRAS, 363, 2
- Kharchenko et al. (2013) Kharchenko N. V., Piskunov A. E., Schilbach E., Röser S., Scholz R. D., 2013, A&A, 558, A53
- Khoperskov et al. (2022) Khoperskov S., et al., 2022, arXiv e-prints, p. arXiv:2206.04522
- Laporte et al. (2018) Laporte C. F. P., Johnston K. V., Gómez F. A., Garavito-Camargo N., Besla G., 2018, MNRAS, 481, 286
- Laporte et al. (2020) Laporte C. F. P., Belokurov V., Koposov S. E., Smith M. C., Hill V., 2020, MNRAS, 492, L61
- Łokas (2020) Łokas E. L., 2020, A&A, 638, A133
- Lovell et al. (2018) Lovell M. R., et al., 2018, MNRAS, 481, 1950
- Makino & Aarseth (1992) Makino J., Aarseth S. J., 1992, PASJ, 44, 141
- Malhan et al. (2022) Malhan K., et al., 2022, ApJ, 926, 107
- Mardini et al. (2020) Mardini M. K., et al., 2020, ApJ, 903, 88
- Marín-Franch et al. (2009) Marín-Franch A., et al., 2009, ApJ, 694, 1498
- Marinacci et al. (2018) Marinacci F., et al., 2018, MNRAS, 480, 5113
- Massari et al. (2019) Massari D., Koppelman H. H., Helmi A., 2019, A&A, 630, L4
- Mateu (2023) Mateu C., 2023, MNRAS, 520, 5225
- McConnachie (2012) McConnachie A. W., 2012, AJ, 144, 4
- McConnachie et al. (2021) McConnachie A. W., Higgs C. R., Thomas G. F., Venn K. A., Côté P., Battaglia G., Lewis G. F., 2021, MNRAS, 501, 2363
- Merritt (1999) Merritt D., 1999, Publications of the Astronomical Society of the Pacific, 111, 129
- Miyamoto & Nagai (1975) Miyamoto M., Nagai R., 1975, PASJ, 27, 533
- Myeong et al. (2019) Myeong G. C., Vasiliev E., Iorio G., Evans N. W., Belokurov V., 2019, MNRAS, 488, 1235
- Naiman et al. (2018) Naiman J. P., et al., 2018, MNRAS, 477, 1206
- Navarro et al. (1997) Navarro J. F., Frenk C. S., White S. D. M., 1997, ApJ, 490, 493
- Nelson et al. (2018) Nelson D., et al., 2018, MNRAS, 475, 624
- Nelson et al. (2019) Nelson D., et al., 2019, Computational Astrophysics and Cosmology, 6, 2
- Ness & Lang (2016) Ness M., Lang D., 2016, AJ, 152, 14
- Pagnini et al. (2022) Pagnini G., Di Matteo P., Khoperskov S., Mastrobuono-Battisti A., Haywood M., Renaud F., Combes F., 2022, arXiv e-prints, p. arXiv:2210.04245
- Panithanpaisal et al. (2021) Panithanpaisal N., Sanderson R. E., Wetzel A., Cunningham E. C., Bailin J., Faucher-Giguère C.-A., 2021, ApJ, 920, 10
- Petersen & Peñarrubia (2021) Petersen M. S., Peñarrubia J., 2021, Nature Astronomy, 5, 251
- Pillepich et al. (2018) Pillepich A., et al., 2018, MNRAS, 473, 4077
- Pillepich et al. (2019) Pillepich A., et al., 2019, MNRAS, 490, 3196
- Reid & Brunthaler (2004) Reid M. J., Brunthaler A., 2004, ApJ, 616, 872
- Schönrich et al. (2010) Schönrich R., Binney J., Dehnen W., 2010, MNRAS, 403, 1829
- Snaith et al. (2014) Snaith O. N., Haywood M., Di Matteo P., Lehnert M. D., Combes F., Katz D., Gómez A., 2014, ApJ, 781, L31
- Springel et al. (2018) Springel V., et al., 2018, MNRAS, 475, 676
- Sun et al. (2023) Sun G., Wang Y., Liu C., Long R. J., Chen X., Gao Q., 2023, Research in Astronomy and Astrophysics, 23, 015013
- Torrey et al. (2019) Torrey P., et al., 2019, MNRAS, 484, 5587
- Valcin et al. (2020) Valcin D., Bernal J. L., Jimenez R., Verde L., Wandelt B. D., 2020, J. Cosmology Astropart. Phys., 2020, 002
- VandenBerg et al. (2013) VandenBerg D. A., Brogaard K., Leaman R., Casagrande L., 2013, ApJ, 775, 134
- Vasiliev (2019) Vasiliev E., 2019, MNRAS, 484, 2832
- Vasiliev & Baumgardt (2021) Vasiliev E., Baumgardt H., 2021, MNRAS, 505, 5978
- Wegg & Gerhard (2013) Wegg C., Gerhard O., 2013, MNRAS, 435, 1874
- Xiang & Rix (2022) Xiang M., Rix H.-W., 2022, Nature, 603, 599
- Yun et al. (2019) Yun K., et al., 2019, MNRAS, 483, 1042
- van Dokkum et al. (2013) van Dokkum P. G., et al., 2013, ApJ, 771, L35
Appendix A Evolution of the circular velocity at the distance of the Sun for TNG-TVPs.
Appendix B Types of orbits.
Appendix C Globular clusters from Gaia DR3 catalogue.
| ID | Name | TO | GR | ID | Name | TO | GR | ID | Name | TO | GR | ID | Name | TO | GR |
|---|---|---|---|---|---|---|---|---|---|---|---|---|---|---|---|
| (1) | (2) | (3) | (4) | (5) | (6) | (7) | (8) | (9) | (10) | (11) | (12) | (13) | (14) | (15) | (16) |
| 1 | NGC 104 | TB | HL | 41 | NGC 5927 | TB | TH | 81 | HP 1c | IR | HL | 121 | NGC 6569 | TB | TH |
| 2 | NGC 288 | IR | HL | 42 | NGC 5946 | TB | TH | 82 | FSR 1758 | TB | HL | 122 | BH 261 | TB | TH |
| 3 | NGC 362 | LR | HL | 43 | NGC 5986 | TB | TH | 83 | NGC 6362 | TB | HL | 123 | NGC 6584 | IR | HL |
| 4 | Whiting 1 | PT | HL | 44 | FSR 1716 | TB | TH | 84 | Liller 1 | TB | BL | 124 | NGC 6624 | TB | TH |
| 5 | NGC 1261 | IR | HL | 45 | Pal 14 | LR | HL | 85 | NGC 6380 | TB | BL | 125 | NGC 6626 | TB | TH |
| 6 | Pal 1 | TB | HL | 46 | Lynga 7b | TB | TH | 86 | Terzan 1 | TB | TN | 126 | NGC 6638 | TB | TH |
| 7 | AM 1a | LR | HL | 47 | NGC 6093 | TB | HL | 87 | Ton 2 | TB | TH | 127 | NGC 6637 | TB | TH |
| 8 | Eridanus | IR | HL | 48 | NGC 6121 | TB | TH | 88 | NGC 6388 | TB | TH | 128 | NGC 6642 | TB | TN |
| 9 | Pal 2 | LR | HL | 49 | NGC 6101 | IR | HL | 89 | NGC 6402 | TB | TH | 129 | NGC 6652 | TB | HL |
| 10 | NGC 1851 | LR | HL | 50 | NGC 6144 | TB | HL | 90 | NGC 6401 | TB | TH | 130 | NGC 6656 | TB | HL |
| 11 | NGC 1904 | LR | HL | 51 | NGC 6139 | TB | TH | 91 | NGC 6397 | TB | HL | 131 | Pal 8 | TB | TH |
| 12 | NGC 2298 | IR | HL | 52 | Terzan 3 | TB | TH | 92 | Pal 6 | TB | TH | 132 | NGC 6681 | IR | HL |
| 13 | NGC 2419 | IR | HL | 53 | NGC 6171 | TB | TH | 93 | NGC 6426 | TB | HL | 133 | NGC 6712 | TB | HL |
| 14 | Pyxis | IR | HL | 54 | ESO 452-11 | TB | TH | 94 | Djorg 1 | TB | HL | 134 | NGC 6715 | PT | HL |
| 15 | NGC 2808 | TB | HL | 55 | NGC 6205 | TB | HL | 95 | Terzan 5 | TB | BL | 135 | NGC 6717 | TB | TH |
| 16 | E 3 | TB | HL | 56 | NGC 6229 | LR | HL | 96 | NGC 6440 | TB | BL | 136 | NGC 6723 | TB | HL |
| 17 | Pal 3 | IR | HL | 57 | NGC 6218 | TB | TH | 97 | NGC 6441 | TB | TH | 137 | NGC 6749 | TB | TH |
| 18 | NGC 3201 | TB | HL | 58 | FSR 1735 | TB | TH | 98 | Terzan 6 | TB | BL | 138 | NGC 6752 | TB | TH |
| 19 | Pal 4 | LR | HL | 59 | NGC 6235 | TB | HL | 99 | NGC 6453 | TB | TH | 139 | NGC 6760 | TB | HL |
| 20 | Crater | IR | HL | 60 | NGC 6254 | TB | TH | 100 | UKS 1 | TB | HL | 140 | NGC 6779 | TB | HL |
| 21 | NGC 4147 | LR | HL | 61 | NGC 6256 | TB | TN | 101 | VVV CL001 | TB | TN | 141 | Terzan 7 | PT | HL |
| 22 | NGC 4372 | TB | TH | 62 | Pal 15 | LR | HL | 102 | NGC 6496 | TB | TH | 142 | Pal 10 | TB | HL |
| 23 | Rup 106 | TB | HL | 63 | NGC 6266 | TB | TN | 103 | Terzan 9 | TB | BL | 143 | Arp 2 | PT | HL |
| 24 | NGC 4590 | TB | HL | 64 | NGC 6273 | TB | HL | 104 | Djorg 2 | TB | BL | 144 | NGC 6809 | TB | HL |
| 25 | BH 140 | TB | HL | 65 | NGC 6284 | TB | HL | 105 | NGC 6517 | TB | TN | 145 | Terzan 8 | PT | HL |
| 26 | NGC 4833 | TB | HL | 66 | NGC 6287 | TB | HL | 106 | Terzan 10 | TB | HL | 146 | Pal 11 | TB | HL |
| 27 | NGC 5024 | IR | HL | 67 | NGC 6293 | TB | HL | 107 | NGC 6522 | TB | TH | 147 | Sagittarius II | PT | HL |
| 28 | NGC 5053 | IR | HL | 68 | NGC 6304 | TB | TN | 108 | NGC 6535 | TB | TH | 148 | NGC 6838 | TB | HL |
| 29 | NGC 5139 | TB | HL | 69 | NGC 6316 | TB | TH | 109 | NGC 6528 | TB | TN | 149 | NGC 6864 | TB | HL |
| 30 | NGC 5272 | IR | HL | 70 | NGC 6341 | LR | HL | 110 | NGC 6539 | TB | TH | 150 | NGC 6934 | LR | HL |
| 31 | NGC 5286 | TB | HL | 71 | NGC 6325 | TB | TH | 111 | NGC 6540 | TB | TH | 151 | NGC 6981 | LR | HL |
| 32 | AM 4 | PT | HL | 72 | NGC 6333 | TB | HL | 112 | NGC 6544 | TB | TH | 152 | NGC 7006 | LR | HL |
| 33 | NGC 5466 | IR | HL | 73 | NGC 6342 | TB | TH | 113 | NGC 6541 | TB | TH | 153 | Laevens 3 | IR | HL |
| 34 | NGC 5634 | IR | HL | 74 | NGC 6356 | TB | HL | 114 | 2MASS-GC01 | TB | TN | 154 | NGC 7078 | TB | HL |
| 35 | NGC 5694 | LR | HL | 75 | NGC 6355 | TB | TH | 115 | ESO 280-06 | TB | HL | 155 | NGC 7089 | LR | HL |
| 36 | IC 4499 | IR | HL | 76 | NGC 6352 | TB | TH | 116 | NGC 6553 | TB | TH | 156 | NGC 7099 | TB | HL |
| 37 | NGC 5824 | IR | HL | 77 | IC 1257 | LR | HL | 117 | 2MASS-GC02 | TB | TH | 157 | Pal 12 | PT | HL |
| 38 | Pal 5 | IR | HL | 78 | Terzan 2 | TB | BL | 118 | NGC 6558 | TB | TN | 158 | Pal 13 | IR | HL |
| 39 | NGC 5897 | TB | HL | 79 | NGC 6366 | TB | TH | 119 | IC 1276d | TB | HL | 159 | NGC 7492 | LR | HL |
| 40 | NGC 5904 | LR | HL | 80 | Terzan 4 | TB | BL | 120 | Terzan 12 | TB | TH |