Clique Densification in Networks
Abstract
Real-world networks are rarely static. Recently, there has been increasing interest in both network growth and network densification, in which the number of edges scales superlinearly with the number of nodes. Less studied but equally important, however, are scaling laws of higher-order cliques, which can drive clustering and network redundancy. In this paper, we study how cliques grow with network size, by analyzing several empirical networks from emails to Wikipedia interactions. Our results show superlinear scaling laws whose exponents increase with clique size, in contrast to predictions from a previous model. We then show that these results are in qualitative agreement with a new model that we propose, the Local Preferential Attachment Model, where an incoming node links not only to a target node but also to its higher-degree neighbors. Our results provide new insights into how networks grow and where network redundancy occurs.
pacs:
Valid PACS appear hereI Introduction
Networks underlie a wide variety of social phenomena, from the spread of disease and information Holme and Saramäki (2012) to the formation of collaborations Burghardt et al. (2021); Leskovec et al. (2007). The evolution of networks has been a popular research topic since the Barabasi-Albert model demonstrated that growth through preferential attachment can explain a fundamental property of networks—their heavy-tailed degree distributions Barabási and Albert (1999); Jeong et al. (2003). More recent research has studied another fundamental aspect of network growth, known as densification, where the number of links increases super-linearly with the number of nodes Leskovec et al. (2007). Densification can create advantages for larger systems: for instance, in collaboration networks, it provides more opportunities for researchers at larger institutions over smaller ones Burghardt et al. (2021). Several network growth models have been developed to help explain mechanisms of specific networks, such as gene regulatory networks Teichmann and Babu (2004); Foster et al. (2006), or provide general mechanisms of patterns seen in empirical data, such as fitness Bell et al. (2017), graph spectra Kunegis et al. (2010), or copying mechanisms Bhat et al. (2016); Lambiotte et al. (2016); Burghardt et al. (2021), among others Zadorozhnyi and Yudin (2014); Zalányi et al. (2003); Paranjape et al. (2017); Leskovec et al. (2008).
Growth of higher-order structures in networks is a less studied aspect of network growth. Although some higher-order structures, such as triangles Watts and Strogatz (1998), have long been known to play an important role in network phenomena, less attention has been devoted to how these and higher-order motifs form in growing networks. Recent research, notably by Bhat et al. Bhat et al. (2016) and Lambiotte et al. Lambiotte et al. (2016), has offered potential mechanisms that predict how edges and larger cliques will scale as a function of network size. (For clarity, a clique of size is a fully connected subgraph, with nodes and edges). The mechanism of clique formation proposed by Lambiotte et al., however, has not been tested empirically before.
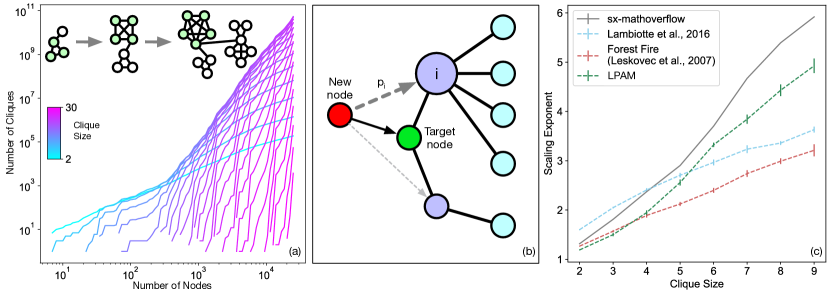
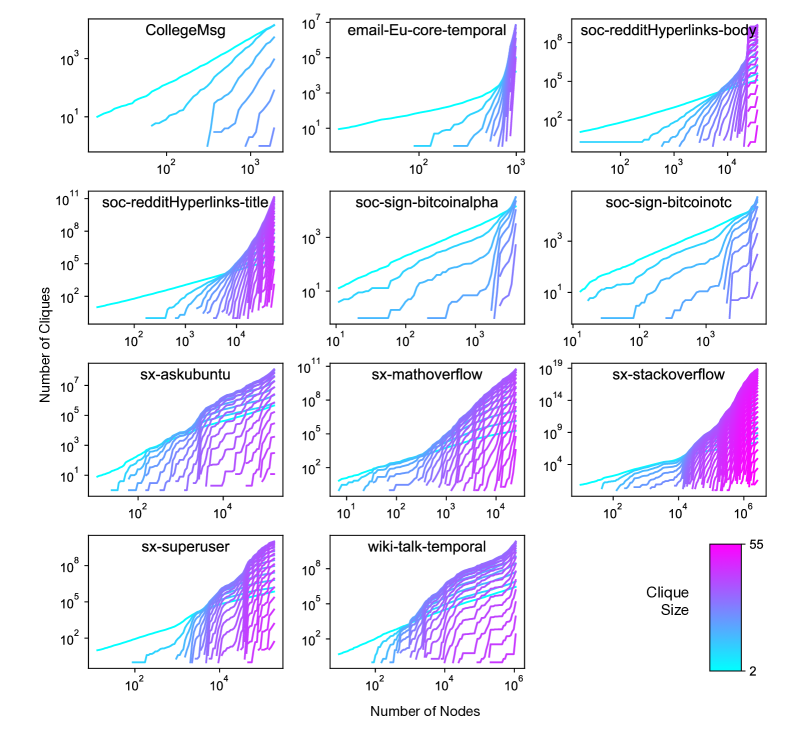
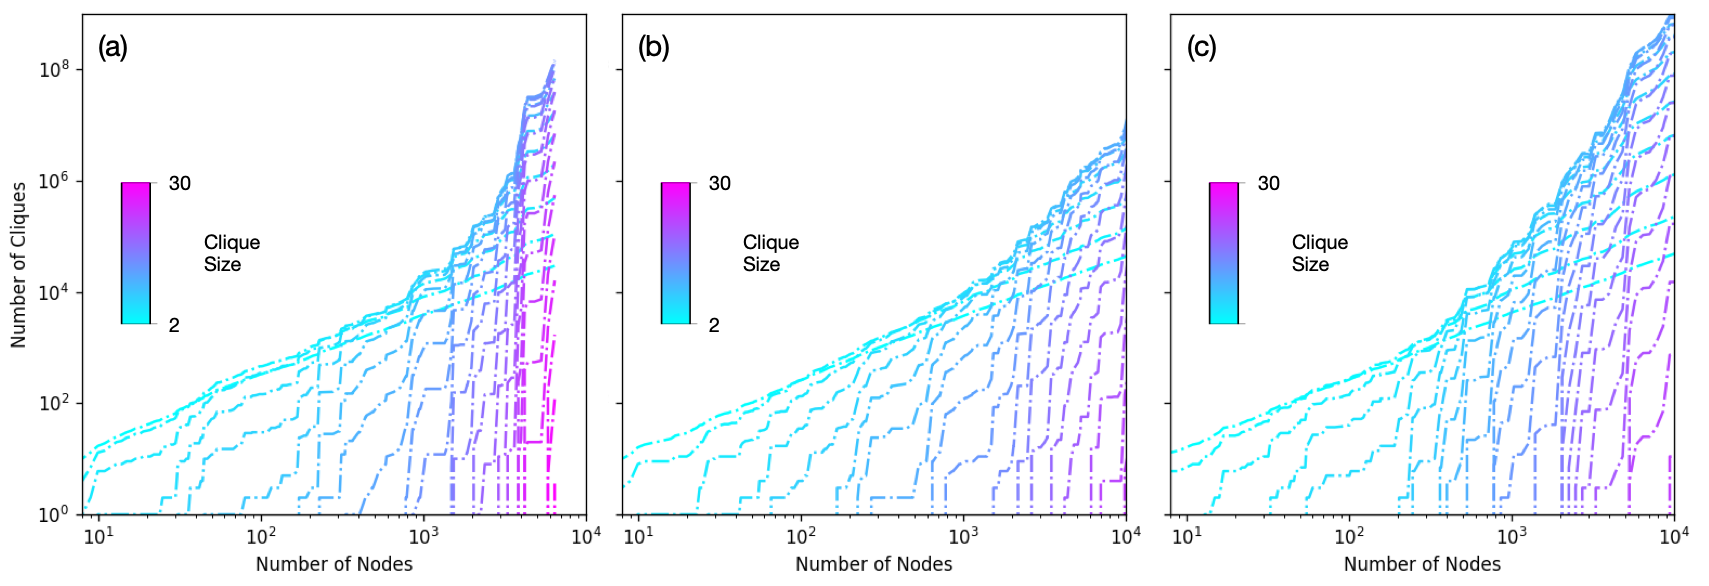
In this paper, we study clique formation in growing networks. Fig. 1a considers the case of an empirical network of user interactions on the question-answer website known as Math Overflow Paranjape et al. (2017) (answers to questions, comments to questions, and comments to answers). Plotting the number of cliques of differing size as a function of network size (measured by the number of nodes), we see that the number of edges () grows super-linearly with network size. Network degree therefore increases with network size, consistent with previous results Lambiotte et al. (2016); Bhat et al. (2016); Burghardt et al. (2021); Leskovec et al. (2007). But crucially, we observe that the number of triangles () and larger cliques grows even faster, leading to an increased level of redundant connections in the network. This effect, which we call clique densification, is found in many empirical networks (see also Supplementary Figure S1). We also find that these networks form links locally, i.e., between nearby nodes, and preferentially connect to high-degree nodes. Furthermore, the effect of 2-cliques being overtaken by increasingly large clique sizes in Fig. 1a gives rise to an intriguing envelope structure that itself appears to follow a power law.
In order to explain our findings, we propose the Local Preferential Attachment Model (LPAM) that combines two prevalent mechanisms in networks: copying (linking not only to a target but also to some of its neighbors) Krapivsky and Redner (2005), and preferential attachment (linking preferentially to higher-degree nodes). While copying alone can explain some network densification, it does not explain why the representation of large cliques grows so rapidly in networks. Similarly, preferential attachment cannot explain densification at all. The two mechanisms together, however, are key to understanding how such dense substructures arise in networks. These substructures can be useful, for example, when links are removed because they provide redundancy that maintains network connectivity. This may help us understand seeming inefficiencies in network formation, as the density of these subgraphs may preserve the giant connected component of a network. Moreover, the copying and preferential attachment mechanisms could assist in explaining the formation of dense subcommunities in networks Chen and Saad (2012). Our work provides a new understanding of how network structure evolves and can help account for these behaviors.
II Methods
In this section, we describe how cliques in a network are counted. We define our model that better explains how cliques scale super-linearly with network size, and we discuss how we fit this and other models to data.
II.1 Empirical Networks
The empirical datasets we use are freely available from the SNAP library Leskovec and Krevl (2014). We take 11 graphs that contain temporal information, ignoring weights and edge direction: College Messages Panzarasa et al. (2009) (nodes are users, and edges are messages between individuals), an email network at a large European institution Paranjape et al. (2017) (nodes are users and edges are emails between users), Reddit hyperlinks within the body and within the title of posts Kumar et al. (2018a) (nodes are users and edges are links to comments between users), Bitcoin Alpha and Bitcoin OTC trust weighted signed networks Kumar et al. (2016, 2018b) (nodes are users and edges represent degree of trust, where we ignore the edge sign), and conversations on Ask Ubuntu, Math Overflow, Stack Overflow, Stack Exchange Super User boards (nodes are users and edges represent comments to questions or answers, or answers to questions between users) Paranjape et al. (2017), and Wikipedia’s talk pages (nodes are users and edges are comments between users) Paranjape et al. (2017). Data are captured cumulatively, such that links and nodes will appear but not disappear from the first to the last timestamp.
II.2 Counting Cliques
It is typically a challenge to analyze high-order network properties, such as cliques, in part because finding the largest clique in a network is NP-hard Rossi et al. (2014). Pivoter Jain and Seshadhri (2020), however, helps speed up clique counting, allowing clique densification to be studied. Pivoter is based on the Succinct Clique Tree, which efficiently stores a representation of all cliques in the network. This is built via an algorithm called pivoting, which reduces the recursion tree used to find the cliques. We use this method to study all empirical networks. Code used to model and analyze data is available at https://github.com/haochenpi314/Clique-Densification.
II.3 Local Preferential Attachment Model
We find three attributes of growing networks that we aim to capture within a single mechanistic model: (a) the number of cliques scaling super-linearly with the network size, (b) nodes forming new links with nearby nodes, and (c) nodes preferentially connecting to high-degree nodes. One theoretically grounded mechanistic model is by Lambiotte et al. Lambiotte et al. (2016), in which nodes enter the network, find a random target node to connect with, and then also connect to random neighbors of that target node. Their model provides theoretical predictions on the scaling laws of edges and higher-order cliques versus network size, but does not assume any preferential attachment mechanism.
We therefore expand on this model with LPAM, shown in Fig. 1b. Consider a process where, at each time step, a new node (red node) enters the network. It connects to an existing target node (green node) chosen uniformly at random, and also connects to some number of neighbors (purple nodes) of the target, with preference given to higher-degree nodes (larger-sized nodes in Fig. 1b).
LPAM is characterized by two parameters, and . For a target node of degree , the marginal probability of establishing a connection to a given one of its neighbors is , such that the expected number of new connections is . However, conditional on the neighbor’s own degree, this probability depends on . The parameter interpolates linearly between the case of no preferential attachment at all (), corresponding to the Lambiotte et al. model Lambiotte et al. (2016), and the case of strong preferential attachment (). Specifically, for the th neighbor of the target node, we define the initial scaled probability
| (1) |
where is the degree of the th neighbor. If exceeds a threshold level , then the “excess” probability is spread over the probabilities of connecting to other neighbors of the target node, giving new probabilities . As this may result in certain probabilities exceeding , the process is iterated until all probabilities fall below that threshold. The end result is an expectation value independent of : we continue to connect to nodes on average, but with a preferential attachment to higher-degree nodes. The threshold level allows us to smoothly transition between strictly preferential attachment () and the Lambiotte et al. node copying model Lambiotte et al. (2016).
For a network with nodes and links, the network growth mechanism implies, as in Lambiotte et al. (2016),
| (2) |
Following the same theory as in Bhat et al. Bhat et al. (2016), this results in
| (3) |
i.e., the number of links scales superlinearly for , where . Sadly, because depends on the other neighbor degrees , higher-order dependencies are not solvable, such as the number of triangles as a function of . We instead calculate scaling laws numerically by taking a linear fit of the log of the number of cliques versus log of the network size (see Fig. 1a) for different realizations of this model.
II.4 Fitting Models
Another methodological contribution of our work is fitting a clique densification model to empirical data of clique scaling. We measure the distribution of clique sizes for a given network size and compare this distribution to our model’s prediction (see an example of this distribution in Supplementary Figure S2). We find the parameters that fit the empirical distributions best across several network sizes, which can be characterized by maximizing the likelihood function averaged over the network sizes, . We call this metric MeanMLE. Each are log-spaced steps between which the network grows 10% until we reach the maximum network size. MeanMLE allows us to find parameters and models with the best overall fit to data, rather than the best at an arbitrary time point.
When fitting data, we discard model instances that will yield low likelihoods and remove models that time out computationally (take more than a few hours to run). We show in Supplementary Figure S8 that each realization can have clique frequencies vary wildly for LPAM, and the wide variance can in turn can sometimes make calculating cliques computationally infeasible. This occurs rarely, however. For example, out of 150,000 instances across the three models used to fit Math Overflow, only 135 instances (0.09%) are discarded.
The LPAM, Forest Fire Leskovec et al. (2007), and copying (Lambiotte et al., Lambiotte et al. (2016)) models all have parameters constrained to lie between 0 and 1. The entire parameter range is taken when models are fit and the parameters are randomly realized and rounded to the nearest 0.01, with 5 realizations on average for each parameter value. For the Forest Fire and LPAM, there are two parameters whose range is between 0 and 1, therefore there are or approximately 50,000 realizations for each dataset. In contrast, for the copying model, there is only 1 parameter and therefore realizations.
III Results
We compare the statistics of several empirical graphs against all candidate models: the Forest Fire model Leskovec et al. (2007), which was the first of two models to explain densification, the copying model Lambiotte et al. (2016), which provides theoretical predictions for clique scaling, and LPAM. While there are many other potential models one could compare against Zadorozhnyi and Yudin (2014); Zalányi et al. (2003); Paranjape et al. (2017); Leskovec et al. (2008), our results show that LPAM captures basic aspects of network growth with a simple theoretically-grounded mechanism.
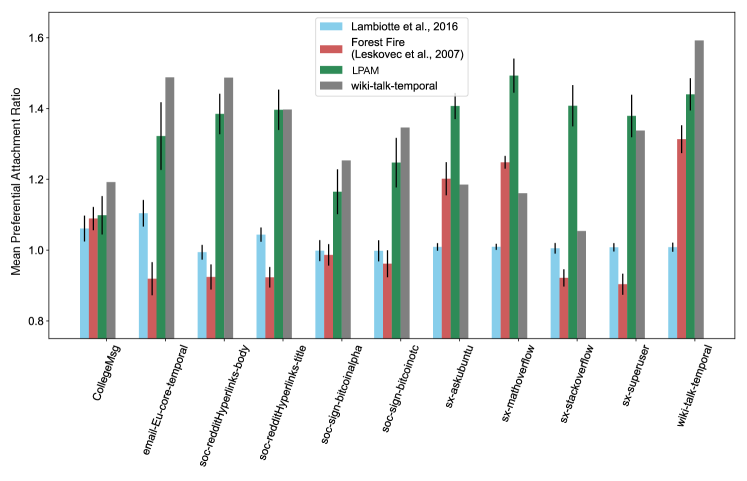
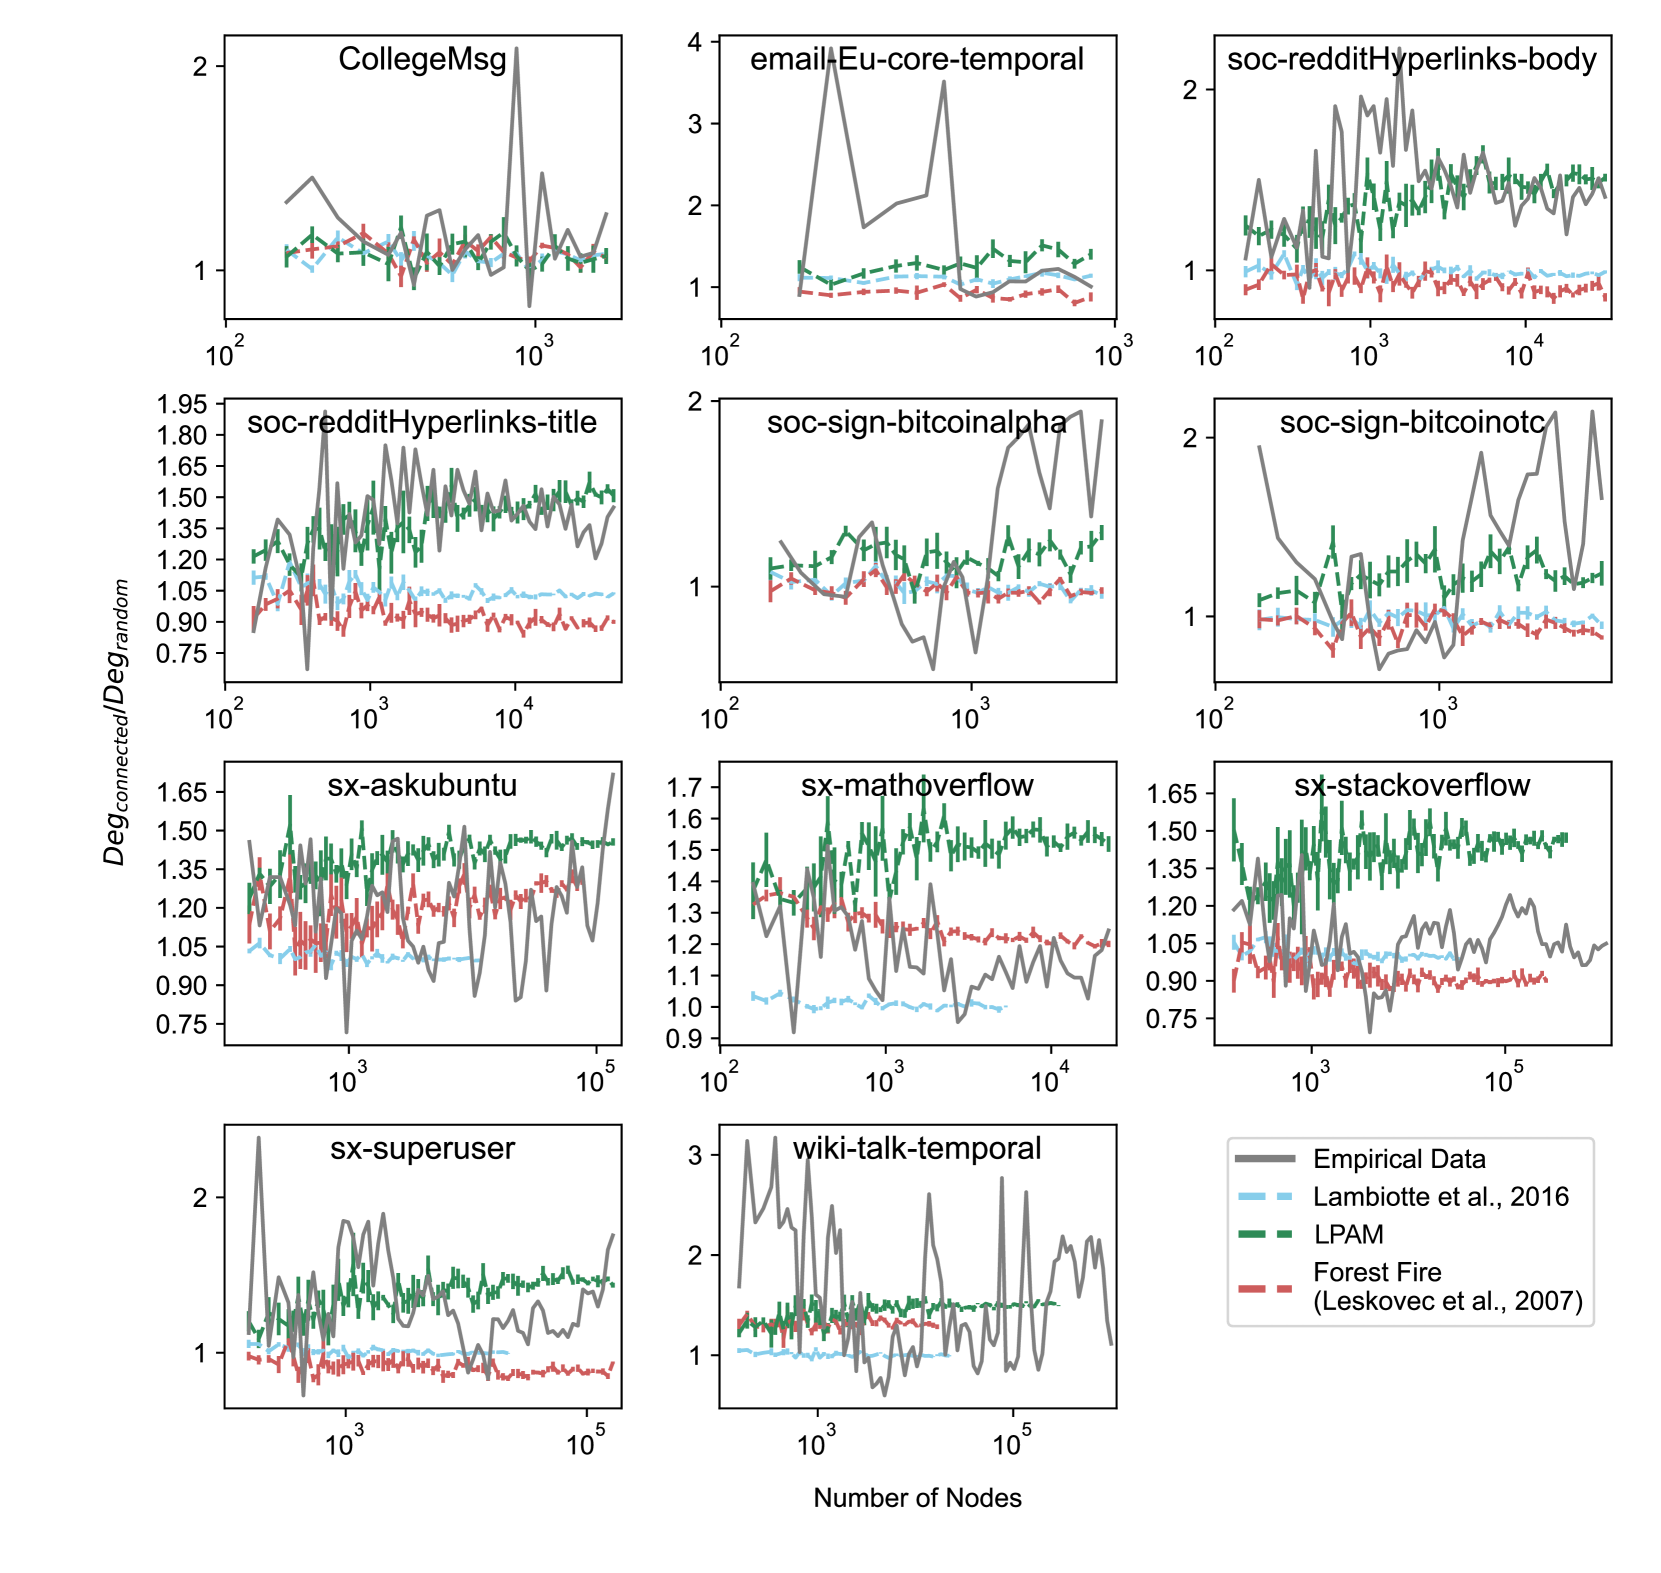
To test the importance of preferential attachment Barabási and Albert (1999), we measure the mean degree of the target node’s neighbors to which a new node connects, divided by the mean degree of all the target node’s neighbors, averaged over all network sizes sampled. Preferential attachment would imply that this ratio is greater than one. In Fig. 2, we show our findings for all networks studied. While the copying model has a ratio of nearly one, implying no significant preferential attachment, the empirical data show a ratio significantly greater than one (strong preferential attachment) which is better captured with LPAM. See Supplementary Figure S4 for further support of the consistency of these results across different empirical datasets.
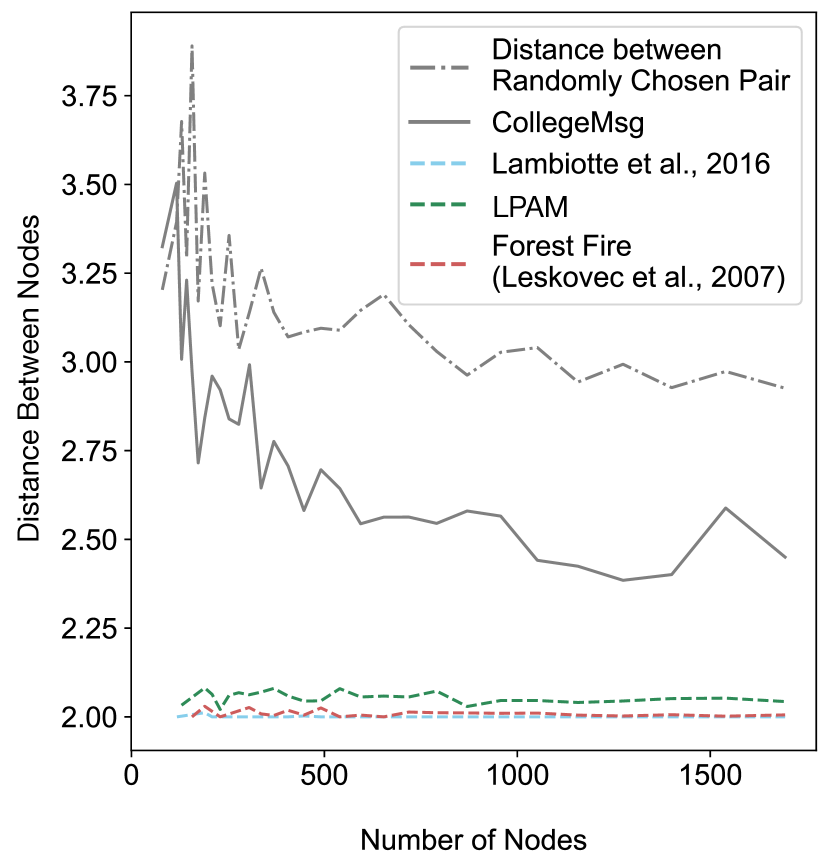
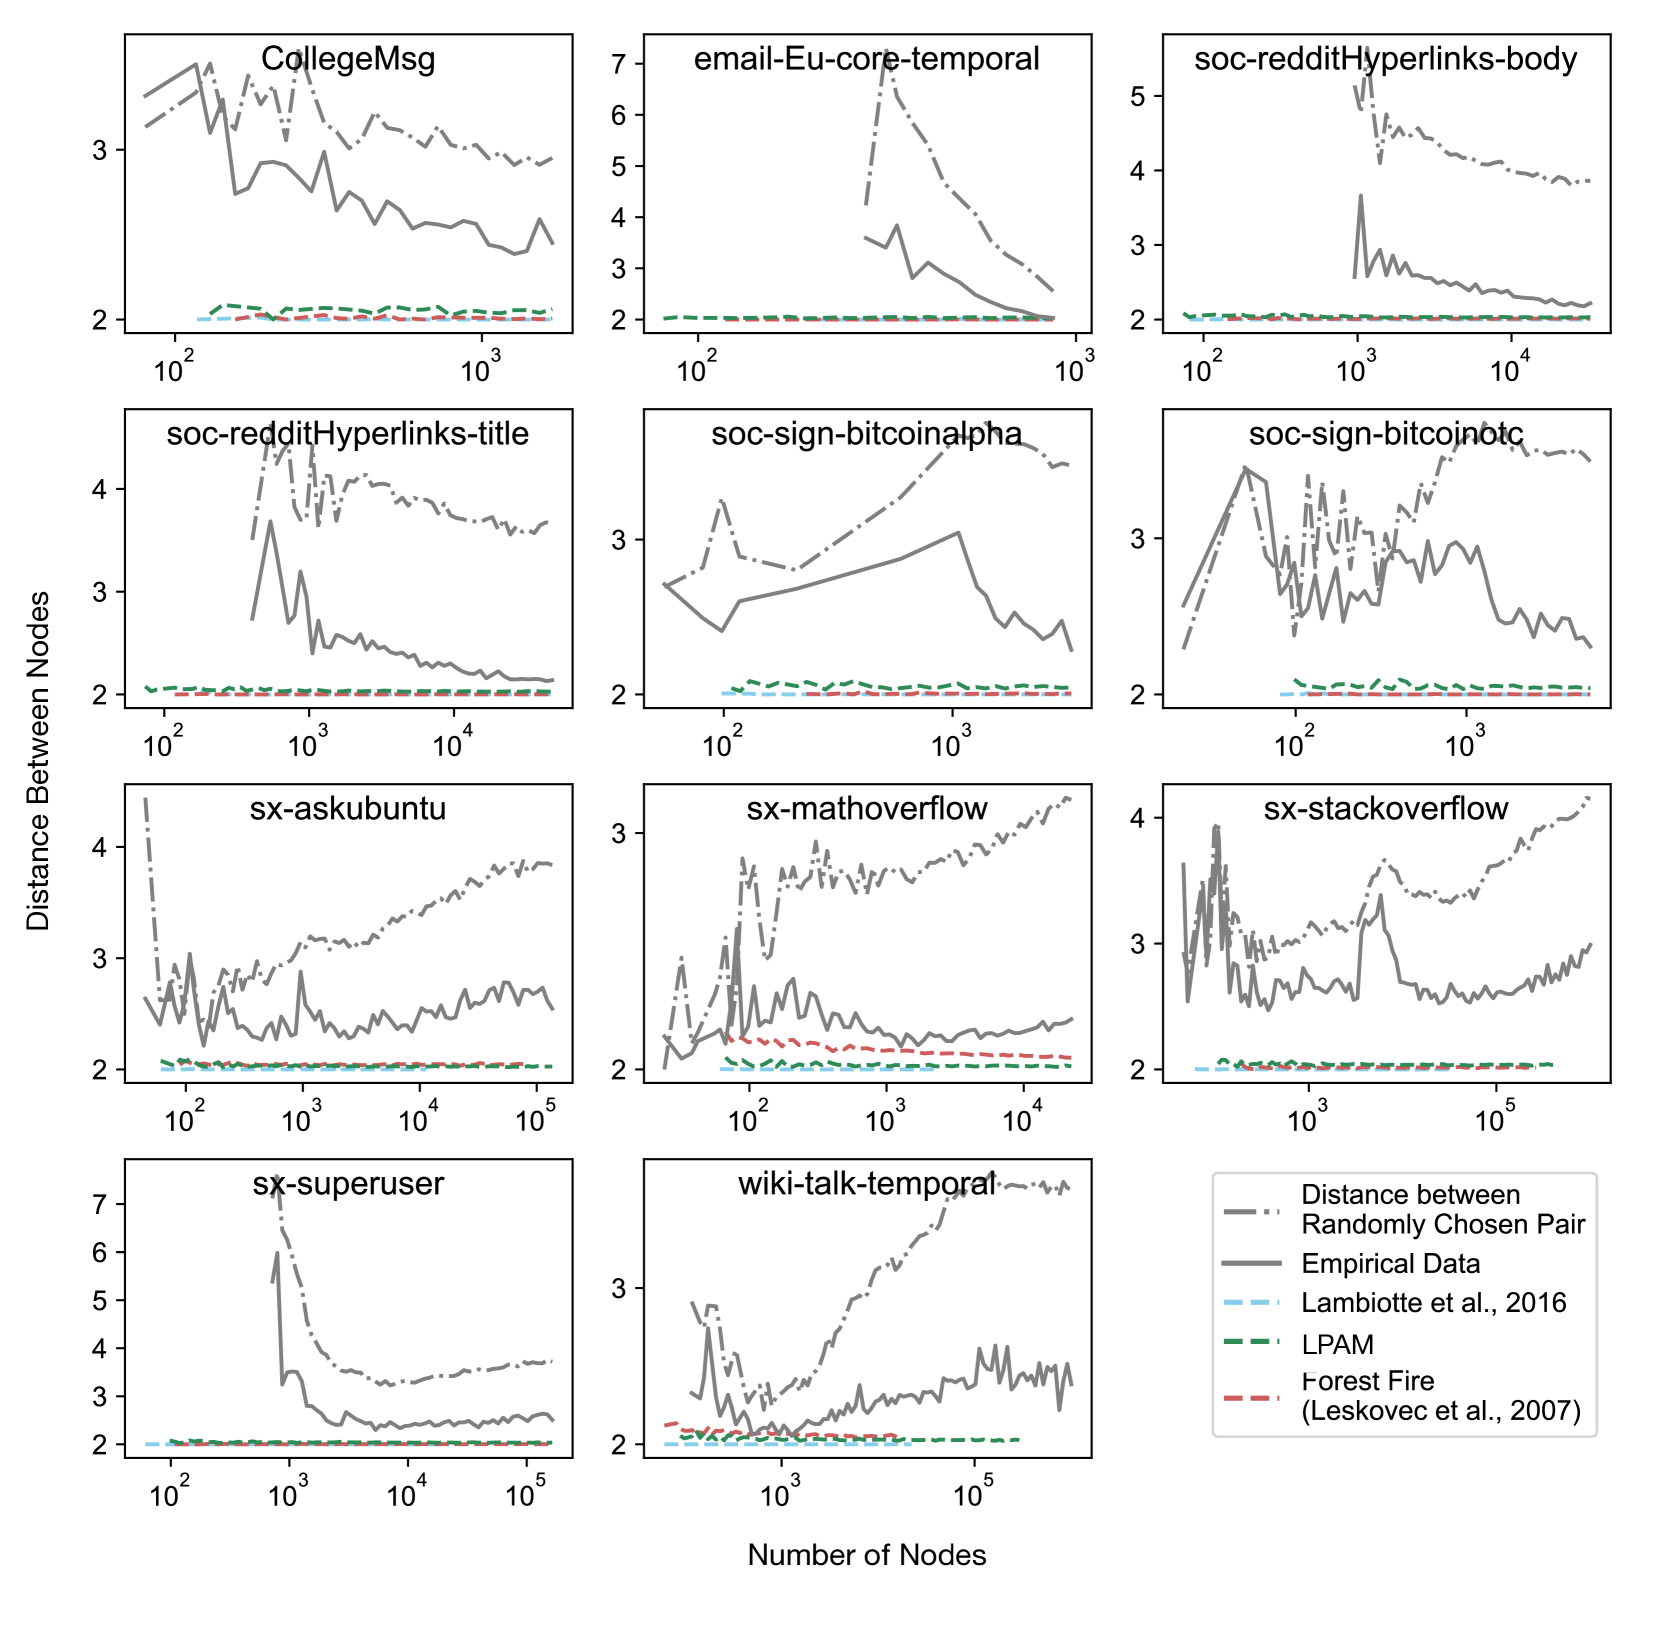
We also plot the mean distance between nodes before they connect to each other, and compare this distance to a null model (connecting between random nodes) as well as to the candidate models, shown in Fig. 3 (similar plots are seen for other datasets in Supplementary Figure S5). We find that nodes form links to nearby nodes (the distance is smaller than the null model), while the models assume even closer distances - neighbors of neighbors, implying a distance of 2. We therefore qualitatively capture the closeness of link formation, although the models tested do not fully address the links that are formed at a distance greater than 2. Capturing these nuances are left for future work.
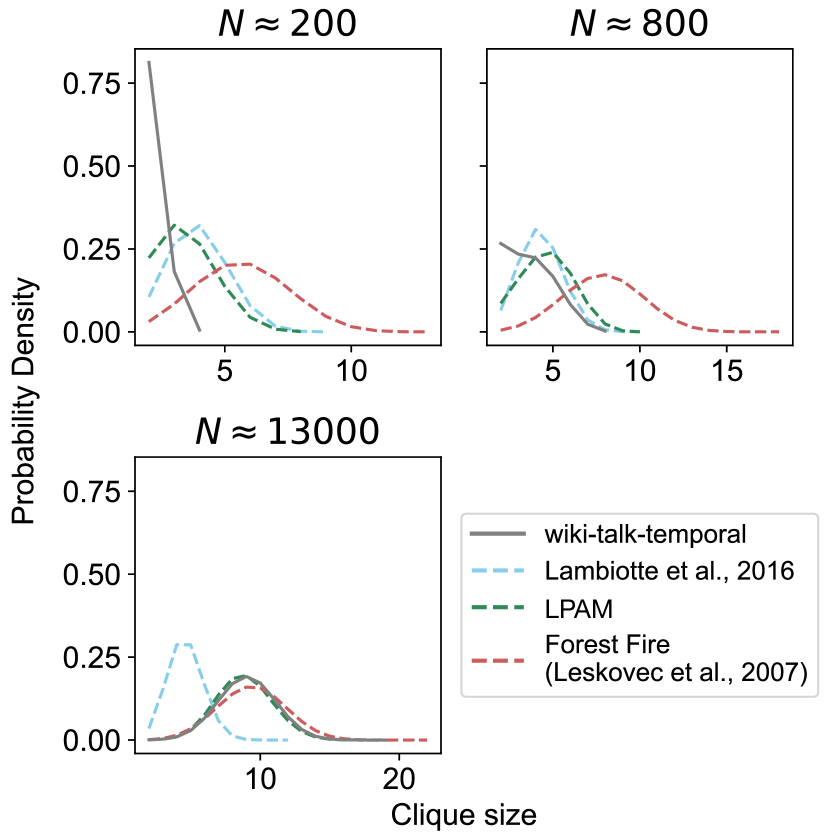
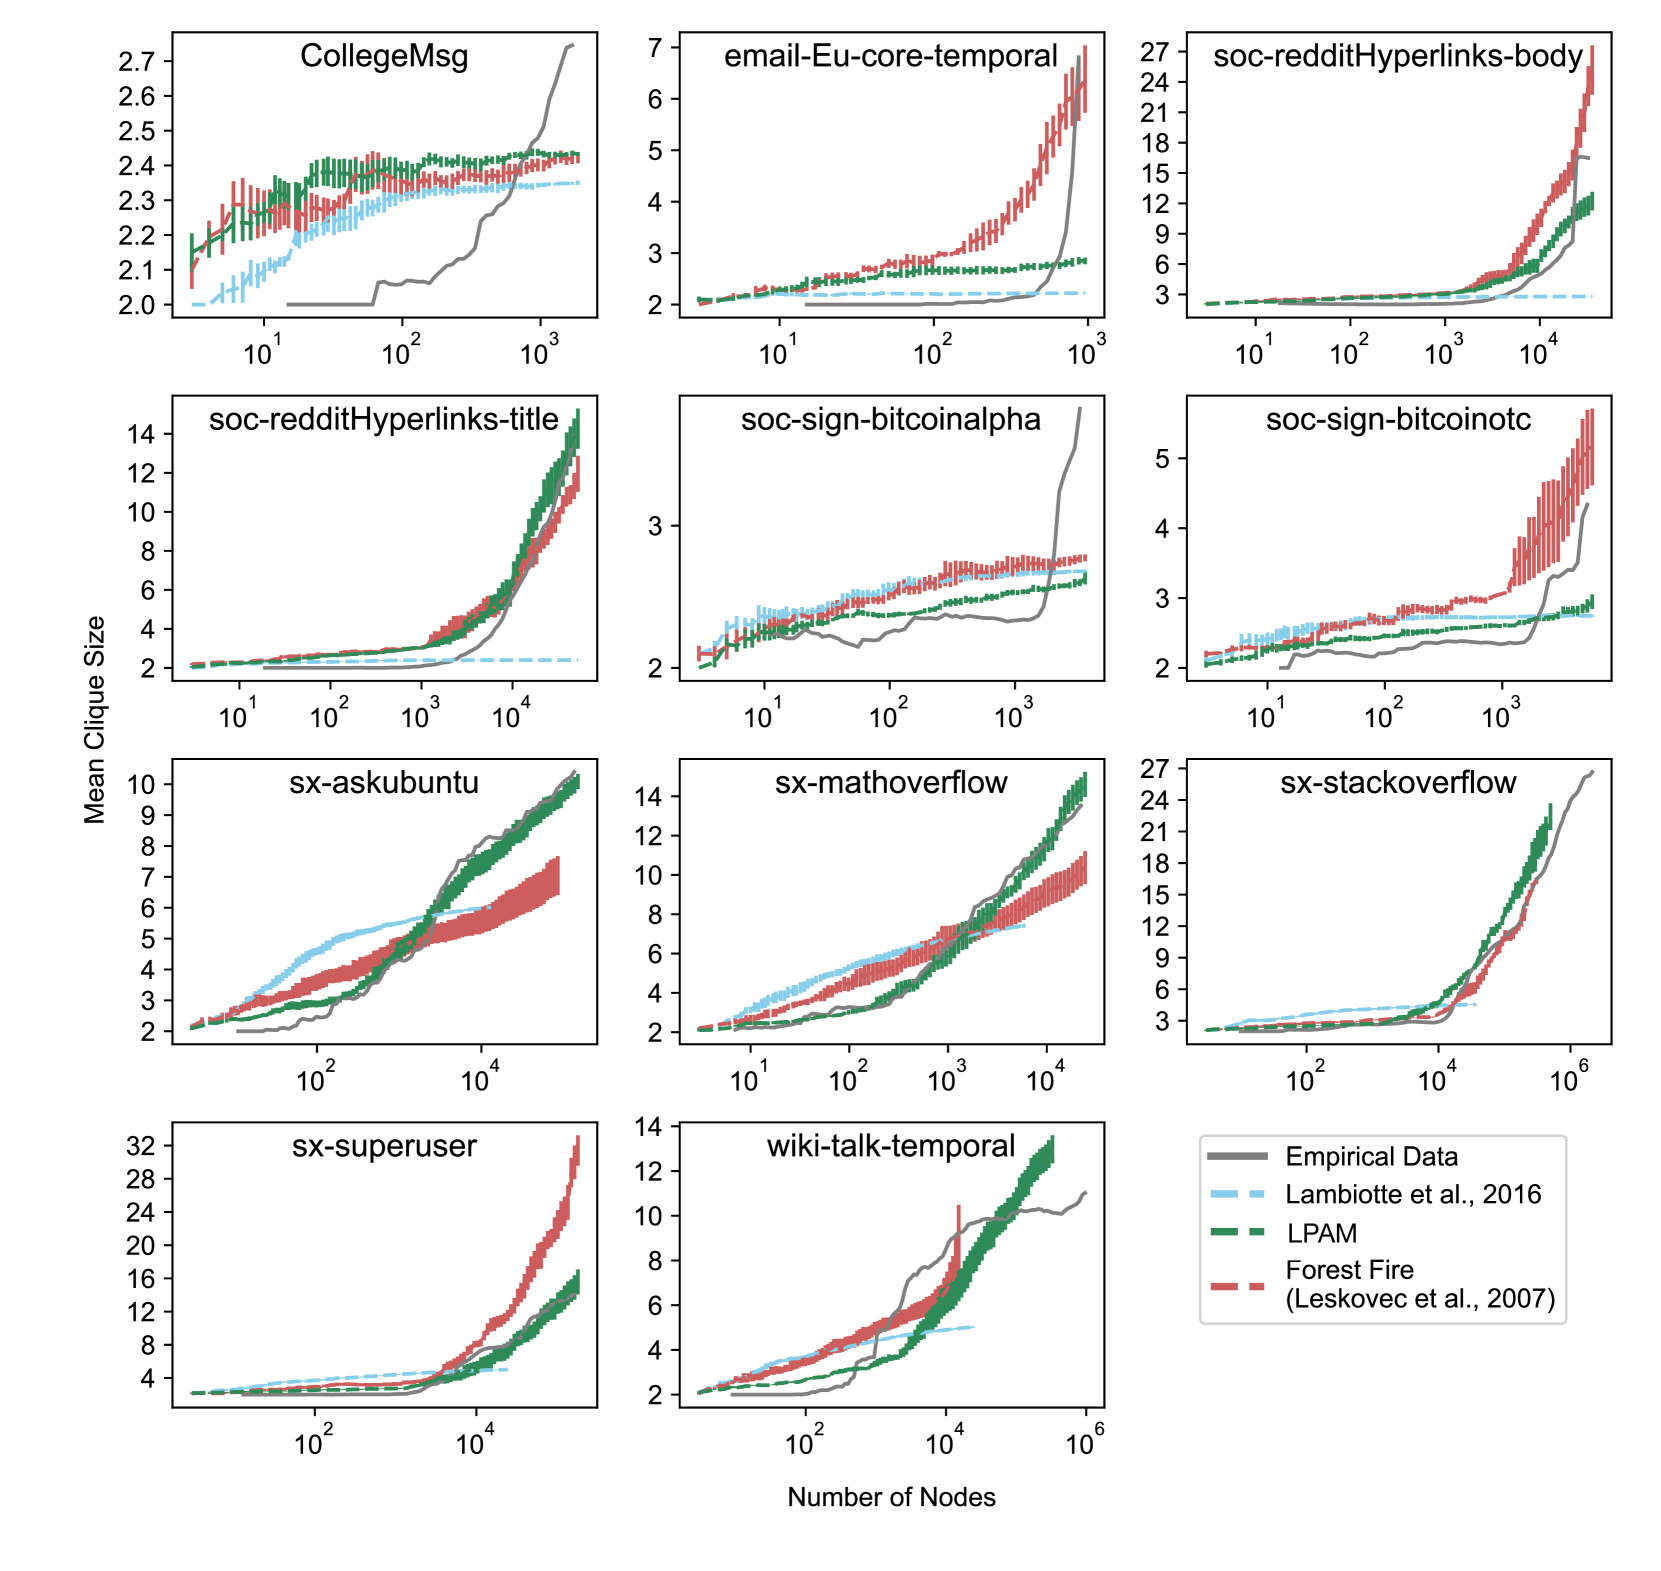
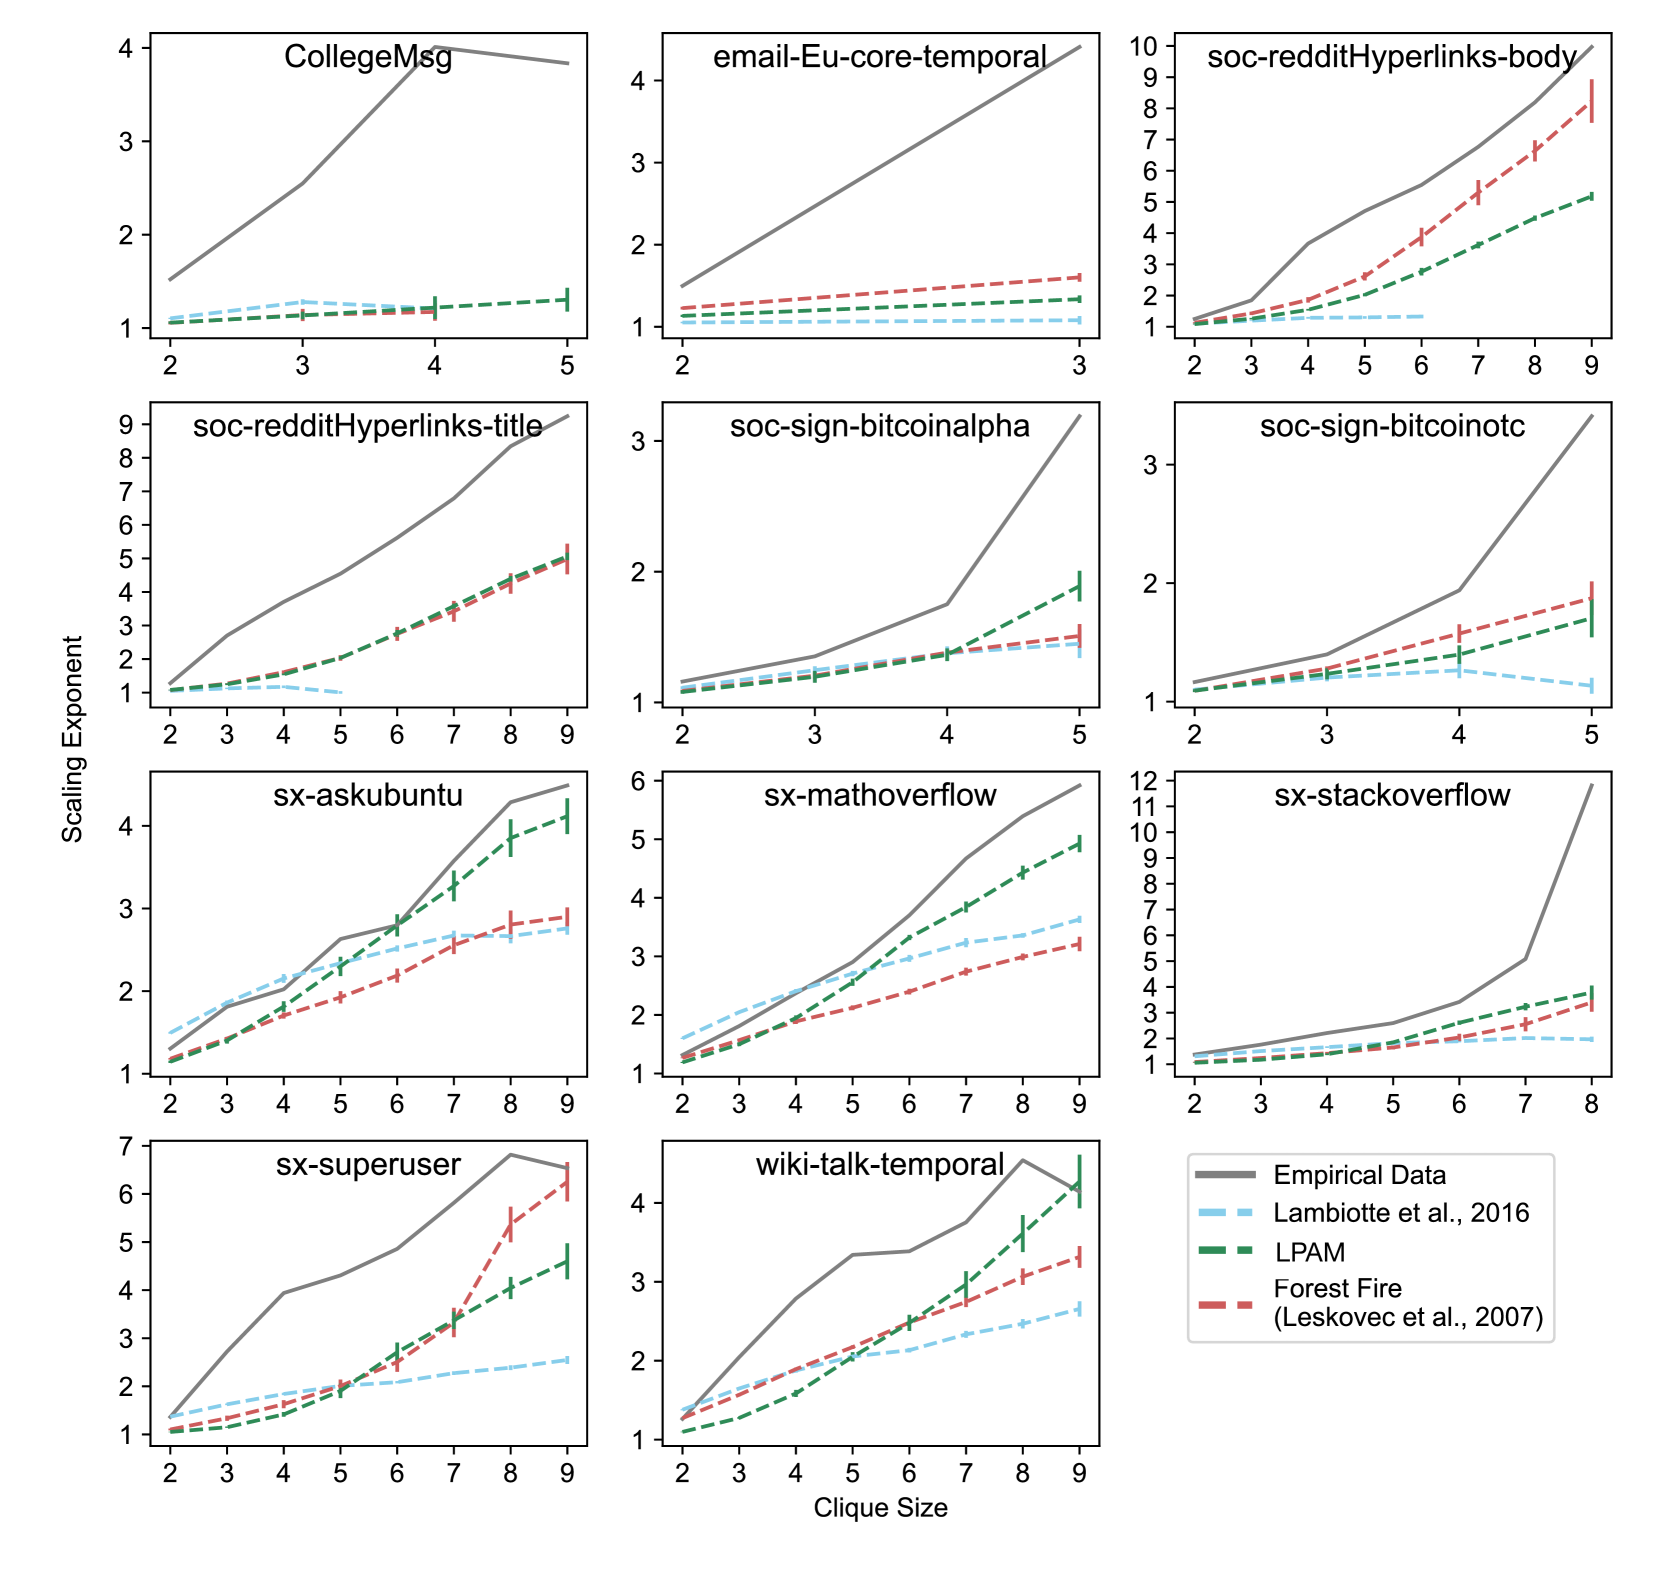
Furthermore, we explore how the different mechanisms capture the scaling exponents of different clique sizes. We show in Fig. 1c that exponents increase significantly with clique size, which is qualitatively captured from the copying mechanism Bhat et al. (2016); Lambiotte et al. (2016) but this model has a lower exponent than what we find empirically. (This is also consistent with what we find in other datasets, shown in Supplementary Figure S6.) LPAM, however, can better capture the scaling law exponents, and therefore help us understand why extremely dense cliques are unusually common in large networks. While the performance is comparable with the forest fire model, LPAM provides a clearer mechanism to explain this behavior. We also show in Supplementary Figure S3 that LPAM captures the mean clique size better than the competing models.
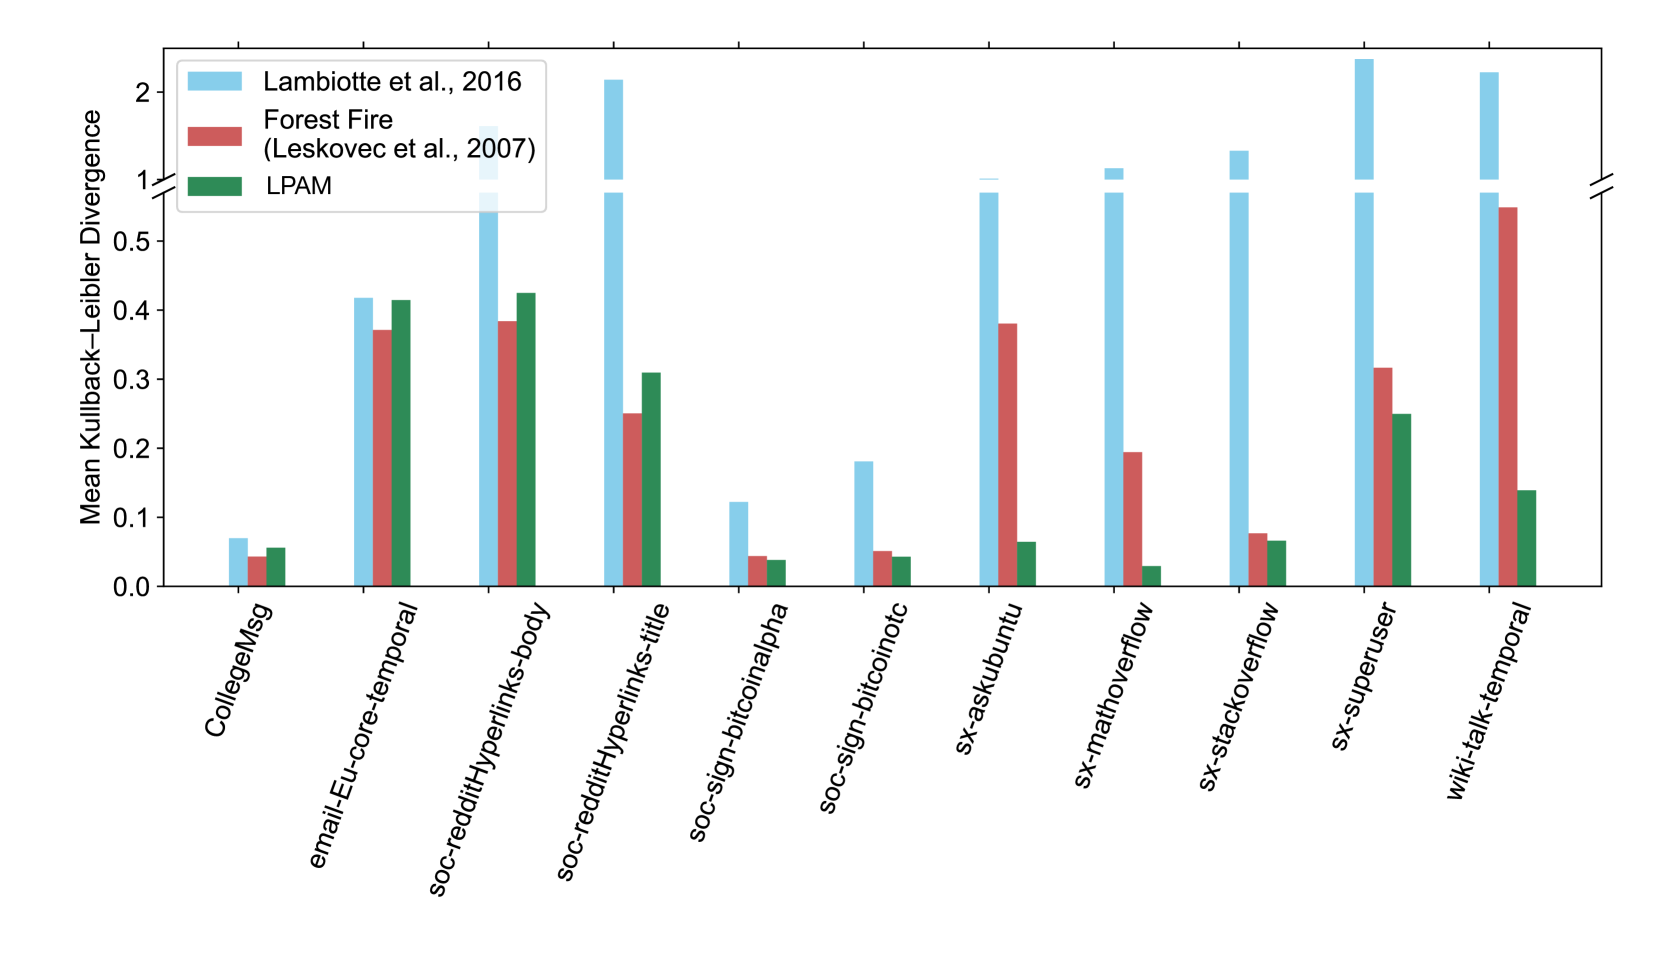
In order to determine the best overall model among these three, we take the mean Kullback-Leibler (KL) divergence Kullback and Leibler (1951) between model and empirical clique size distributions (details in Supplementary Figure S7). We find that LPAM and the Forest Fire model have less error (lower KL divergence) than the copying model of Lambiotte et al. Lambiotte et al. (2016), which suggests that the Lambiotte et al. model may not fully capture how networks grow. Although LPAM can sometimes outperform the other models, we do not claim that another model cannot fit data even better. The main goal of our paper is to instead provide a theoretically-motivated mechanism beyond the copying model.
Finally, we can study ablation of LPAM either by removing node-copying or removing preferential attachment. Setting , we remove traditional preferential attachment, and the model simplifies to the node copying model of Lambiotte et al. Lambiotte et al. (2016), a poorer-fitting model. Alternatively, we can remove node copying and have nodes connect to other nodes preferentially based on degree. This simplifies LPAM to the Barabasi-Albert model Barabási and Albert (1999), whose degree is fixed independent of network size. Because neither simplification fits data as well, LPAM is an effective mechanism to reproduce the results we observe.
IV Conclusion
We observe that cliques scale super-linearly with network size, therefore we observe strong patterns in the higher-order structure of networks. Moreover, we observe that scaling exponents vary significantly for large and small cliques in a growing network. We further observe nodes connect locally (e.g., to neighbors of neighbors) and confirm previous analysis that nodes have preferential attachment. We develop a new mechanism, LPAM, to explain these patterns. LPAM is an extension of previous mechanisms in which a new node attaches to a target node and preferentially to the target node’s higher-degree neighbors. We carried out an ablation study to show this is one of the simplest mechanisms to explain the empirical patterns we measure.
There are a number of ways this method could be improved in future work. First, the mechanism is not theoretically grounded for cliques of order . Next, LPAM does not fully match empirical data, which is both a disadvantage and an advantage in that it greatly simplifies the rich complex patterns that each observational network encodes. We notice in Supplementary Figure S7, for example, that LPAM performs worse than or similarly to the competing Forest Fire model for small networks, such as the College Messages or cryptocurrency networks. This points to finite size effects that our model overlooks. Even when the model performs well, LPAM’s exponents are often lower than the empirical data (Supplementary Figure S6), and the simulated nodes connect to closer neighbors than in empirical data. This motivates extensions of LPAM to address finite size effects and the strong relation between clique size and scaling exponent. One way to improve this model, which might address some of its limitations, includes having new edges connect between two old nodes in the network with some probability, which is similar to the Newman-Watts small world model Newman and Watts (1999). Another way to improve the model could be to seed the model with a real network as an initial condition. Finally, we assume that the fitted scaling laws are asymptotic, but this needs to be tested with more networks, especially with sizes in the hundreds of millions to billions (which our current computing power cannot tolerate).
V Code Availability
The code is available at the following URL: https://github.com/haochenpi314/Clique-Densification.
VI Supplementary Materials
Below we show the robustness of our results across a range of datasets.
References
- Holme and Saramäki (2012) P. Holme and J. Saramäki, Physics Reports 519, 97 (2012), temporal Networks.
- Burghardt et al. (2021) K. A. Burghardt, Z. He, A. G. Percus, and K. Lerman, Communications Physics 4, 189 (2021).
- Leskovec et al. (2007) J. Leskovec, J. Kleinberg, and C. Faloutsos, ACM Trans. Knowl. Discov. Data 1 (2007), 10.1145/1217299.1217301.
- Barabási and Albert (1999) A. Barabási and R. Albert, Science 286, 509 (1999).
- Jeong et al. (2003) H. Jeong, Z. Néda, and A. L. Barabási, Europhysics Letters (EPL) 61, 567 (2003).
- Teichmann and Babu (2004) S. A. Teichmann and M. M. Babu, Nature Genetics 36, 492 (2004).
- Foster et al. (2006) D. V. Foster, S. A. Kauffman, and J. E. S. Socolar, Phys. Rev. E 73, 031912 (2006).
- Bell et al. (2017) M. Bell, S. Perera, M. Piraveenan, M. Bliemer, T. Latty, and C. Reid, Scientific Reports 7, 42431 (2017).
- Kunegis et al. (2010) J. Kunegis, D. Fay, and C. Bauckhage, in Proceedings of the 19th ACM International Conference on Information and Knowledge Management, CIKM ’10 (Association for Computing Machinery, New York, NY, USA, 2010) p. 739–748.
- Bhat et al. (2016) U. Bhat, P. L. Krapivsky, R. Lambiotte, and S. Redner, Phys. Rev. E 94, 062302 (2016).
- Lambiotte et al. (2016) R. Lambiotte, P. L. Krapivsky, U. Bhat, and S. Redner, Phys. Rev. Lett. 117, 218301 (2016).
- Zadorozhnyi and Yudin (2014) V. Zadorozhnyi and E. Yudin, in Information Technologies and Mathematical Modelling, edited by A. Dudin, A. Nazarov, R. Yakupov, and A. Gortsev (Springer International Publishing, Cham, 2014) pp. 432–439.
- Zalányi et al. (2003) L. Zalányi, G. Csárdi, T. Kiss, M. Lengyel, R. Warner, J. Tobochnik, and P. Érdi, Physical Review E 68, 066104 (2003).
- Paranjape et al. (2017) A. Paranjape, A. R. Benson, and J. Leskovec, in Proceedings of the Tenth ACM International Conference on Web Search and Data Mining (ACM, Cambridge United Kingdom, 2017) pp. 601–610.
- Leskovec et al. (2008) J. Leskovec, L. Backstrom, R. Kumar, and A. Tomkins, in Proceeding of the 14th ACM SIGKDD international conference on Knowledge discovery and data mining - KDD 08 (ACM Press, Las Vegas, Nevada, USA, 2008) p. 462.
- Watts and Strogatz (1998) D. J. Watts and S. H. Strogatz, Nature 393, 440 (1998).
- Krapivsky and Redner (2005) P. L. Krapivsky and S. Redner, Phys. Rev. E 71, 036118 (2005).
- Chen and Saad (2012) J. Chen and Y. Saad, IEEE Transactions on Knowledge and Data Engineering 24, 1216 (2012).
- Leskovec and Krevl (2014) J. Leskovec and A. Krevl, “SNAP Datasets: Stanford large network dataset collection,” http://snap.stanford.edu/data (2014).
- Panzarasa et al. (2009) P. Panzarasa, T. Opsahl, and K. M. Carley, Journal of the American Society for Information Science and Technology 60, 911 (2009), https://asistdl.onlinelibrary.wiley.com/doi/pdf/10.1002/asi.21015 .
- Kumar et al. (2018a) S. Kumar, W. L. Hamilton, J. Leskovec, and D. Jurafsky, in Proceedings of the 2018 World Wide Web Conference on World Wide Web (International World Wide Web Conferences Steering Committee, 2018) pp. 933–943.
- Kumar et al. (2016) S. Kumar, F. Spezzano, V. Subrahmanian, and C. Faloutsos, in Data Mining (ICDM), 2016 IEEE 16th International Conference on (IEEE, 2016) pp. 221–230.
- Kumar et al. (2018b) S. Kumar, B. Hooi, D. Makhija, M. Kumar, C. Faloutsos, and V. Subrahmanian, in Proceedings of the Eleventh ACM International Conference on Web Search and Data Mining (ACM, 2018) pp. 333–341.
- Rossi et al. (2014) R. A. Rossi, D. F. Gleich, A. H. Gebremedhin, and M. M. A. Patwary, in Proceedings of the 23rd International Conference on World Wide Web, WWW ’14 Companion (Association for Computing Machinery, New York, NY, USA, 2014) p. 365–366.
- Jain and Seshadhri (2020) S. Jain and C. Seshadhri, “The power of pivoting for exact clique counting,” in Proceedings of the 13th International Conference on Web Search and Data Mining (Association for Computing Machinery, New York, NY, USA, 2020) p. 268–276.
- Kullback and Leibler (1951) S. Kullback and R. A. Leibler, Ann. Math. Statist. 22, 79 (1951).
- Newman and Watts (1999) M. Newman and D. Watts, Physics Letters A 263, 341 (1999).