Uncurated Image-Text Datasets: Shedding Light on Demographic Bias
Abstract
The increasing tendency to collect large and uncurated datasets to train vision-and-language models has raised concerns about fair representations. It is known that even small but manually annotated datasets, such as MSCOCO, are affected by societal bias. This problem, far from being solved, may be getting worse with data crawled from the Internet without much control. In addition, the lack of tools to analyze societal bias in big collections of images makes addressing the problem extremely challenging.
Our first contribution is to annotate part of the Google Conceptual Captions dataset, widely used for training vision-and-language models, with four demographic and two contextual attributes. Our second contribution is to conduct a comprehensive analysis of the annotations, focusing on how different demographic groups are represented. Our last contribution lies in evaluating three prevailing vision-and-language tasks: image captioning, text-image CLIP embeddings, and text-to-image generation, showing that societal bias is a persistent problem in all of them.
1 Introduction
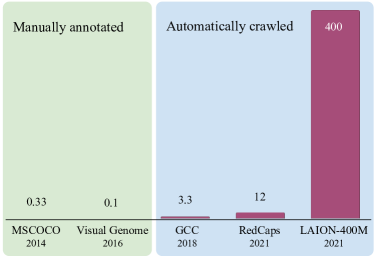
The training paradigm in vision-and-language models has shifted from manually annotated collections, such as MS-COCO [30] and Visual Genome [27], to massive datasets with little-to-none curation automatically crawled from the Internet [43, 17, 42]. Figure 1 illustrates this tendency by comparing the size of paired image-text datasets over time. Whereas manually annotated datasets, widely used in the last decade, contained a few hundred thousand images each, the latest automatically crawled collections are composed of several million samples. This large amount of data has led to training some disruptive models in the field, such as CLIP [37] trained on 400 million image-text pairs; Imagen [41] trained on 860 million image-text pairs; Flamingo [1] trained on 2.3 billion images and short videos paired with text; DALL-E 2 [38] trained on 650 million images; or Stable Diffusion [39], trained on 600 million captioned images. Those models have been shown to learn visual and language representations that outperform the previous state-of-the-art on tasks such as zero-shot classification [37] or text-to-image generation [38, 39].
Despite the impressive results on controlled benchmarks, a critical drawback arises: the larger the training set, the less control over the data. With toxic content easily accessible on the Internet, models trained under uncurated collections are more prone to learn harmful representations of the world, including societal bias, which results in models performing differently for different sociodemographic groups [57]. The risk of obtaining unfair representations is high, as not only do models trained on biased datasets learn to reproduce bias but also amplify it by making predictions more biased than the original data [56, 53, 22]. This turns out to be harmful when, far from controlled research environments, models are used in the real-world [10].
| Dataset | Image source | Annotation process | Labels | Images | Regions | Attributes |
|---|---|---|---|---|---|---|
| Zhao et al. \NoHyper[61]\endNoHyper | MSCOCO \NoHyper[30]\endNoHyper | automatic (captions) | image | - | gender | |
| Zhao et al. \NoHyper[60]\endNoHyper | MSCOCO \NoHyper[30]\endNoHyper (val) | crowd-sourcing | region |
gender
skin-tone |
||
| PHASE \scalerel* |
GCC \NoHyper[43]\endNoHyper | crowd-sourcing | region |
age
gender skin-tone ethnicity emotion activity |
Manually annotated datasets [16, 30] have been shown to be affected by societal bias [61, 60, 21, 32], but the problem gets worse in automatically crawled datasets [8, 9]. To overcome societal bias, fairness protocols must be included both in the dataset and in the model development phase. Data analysis [8, 52, 58, 9, 32, 21], evaluation metrics [53, 40, 22], and mitigation techniques [11, 54, 5, 23] are essential tools for developing fairer models, however, they require demographic attributes, such as gender or skin-tone, to be available. These annotations are currently scarce, and only exist for a few datasets and attributes [61, 60].
In this paper, we contribute to the analysis, evaluation, and mitigation of bias in vision-and-language tasks by annotating six types of demographic111Demographic attributes: age, gender, skin-tone, ethnicity. and contextual222Contextual attributes: emotion, activity. attributes in a large dataset: the Google Conceptual Captions (GCC) [43], which was one of the first automatically crawled datasets with 3.3 million image-caption pairs. We name our annotations PHASE \scalerel*![]() X (Perceived Human Annotations for Social Evaluation), and we use them to conduct a comprehensive analysis of the distribution of demographic attributes on the GCC dataset. We complement our findings with experiments on three main vision-and-language tasks: image captioning, text-image embeddings, and text-to-image generation. Overall, we found that a dataset crawled from the internet like GCC presents big unbalances on all the demographic attributes under analysis. Moreover, when compared against the demographic annotations in MSCOCO by Zhao et al. [60], GCC has bigger representation gaps in gender and skin-tone. As for the downstream tasks, the three of them show evidence of different performance for different demographic groups.
X (Perceived Human Annotations for Social Evaluation), and we use them to conduct a comprehensive analysis of the distribution of demographic attributes on the GCC dataset. We complement our findings with experiments on three main vision-and-language tasks: image captioning, text-image embeddings, and text-to-image generation. Overall, we found that a dataset crawled from the internet like GCC presents big unbalances on all the demographic attributes under analysis. Moreover, when compared against the demographic annotations in MSCOCO by Zhao et al. [60], GCC has bigger representation gaps in gender and skin-tone. As for the downstream tasks, the three of them show evidence of different performance for different demographic groups.
2 Related work
Bias in vision-and-language
Vision-and-language are a set of tasks that deal with data in image and text format. This includes image captioning [50], visual question answering [4], or visual grounding [36]. In terms of societal bias, Burns et al. [11] showed that captions in the standard MSCOCO dataset [13] were gender imbalanced, and proposed an equalizer to mitigate the problem. Since then, gender bias has been found not only in image captioning [2, 46, 22, 51] but also in text-to-image search [54], pretrained vision-and-language models [44, 5], multimodal embeddings [40], visual question answering [21], and multimodal datasets [9]. Zhao et al. [60] showed that gender is not the only attribute affected by bias; skin-tone also contributes to getting differences in captions. As the problem is far from being solved, tools to study and mitigate models’ different demographic representations are essential.
Bias detection datasets
Annotations for studying societal bias in vision-and-language tasks are scarce. Without enough data, it is unfeasible to analyze and propose solutions to overcome the problem. Previous work [61, 60] annotated samples from the MSCOCO dataset [30] with the perceived attributes of the people in the images. First, [61] automatically assigned a binary gender class to images by using the gender words from the captions, excluding images whose captions contained multiple genders. Alternatively, [60] annotated gender and skin-tone via crowd-sourcing. In this case, the annotations were conducted at the person-level, as opposed to the whole image, allowing images with multiple people to have multiple annotations. To increase diversity in images other than MSCOCO and attributes other than gender and skin-tone, we annotate PHASE \scalerel*![]() X from GCC with six attributes, four demographic and two contextual. Image-text datasets with annotations for bias detection are summarised in Table 1.
X from GCC with six attributes, four demographic and two contextual. Image-text datasets with annotations for bias detection are summarised in Table 1.
3 PHASE \scalerel*![[Uncaptioned image]](/html/2304.02828/assets/x5.png) X annotations
X annotations
Manually annotating demographic attributes from images poses many challenges, as discussed in detail in [3]. The attributes perceived by external observers may not correspond with the real attributes of the annotated person. Moreover, the definition of some attributes, such as the ones related to race or ethnicity, is ambiguous and subjective [20]. Even so, demographic annotations are essential to measuring how imbalanced a dataset or a model’s output is. We attempt to mitigate those problems by first, clarifying to both annotators and potential users that the annotations do not correspond to real attributes, but perceived ones; and second, mitigating the effects of subjectivity by collecting multiple annotations per sample, using two race-related attributes instead of one, and sharing the attributes of the anonymized annotators for uncovering potential correlations between annotators background and their perception.
3.1 Image source
The GCC dataset [43] contains about 3.3 million samples from the Internet paired with alt-text captions. Originally, images were filtered to remove pornography while captions were post-processed to transform named-entities into hypernyms, e.g. Harrison Ford actor. Other than that, no filters were applied to remove toxicity or balance the representations. Due to its large size, GCC has been used for pre-training several vision-and-language models, including VilBERT [31], VLBERT [45], Unicoder-VL [28], UNITER [14], OSCAR [29], or ERNIE-VL [59]. This makes it an ideal testbed for studying how the representation of different demographic attributes affects downstream tasks.
3.2 Attributes
Following [60], we annotate people in images via crowd-sourcing. Details on the annotation process are provided in Section 3.3. For each person, we use Amazon Mechanical Turk333https://www.mturk.com/ (AMT) to get four demographic and two contextual attributes. With up to six attributes per person, our goal is to analyze bias from an intersectional perspective.
Demographic attributes
We denote demographic attributes as characteristics of people that are intrinsic to their being and cannot be easily changed. We annotate four attributes with the following categorization:444Demographic categorization systems cannot represent all the different identities, and thus, it should only be seen as a rough and non-inclusive approximation to different social groups in order to analyze disparities.
-
•
Age with five classes: Baby (0-2 years-old), Child (3-14 years-old), Young adult (15-29 years-old), Adult (30-64 years-old), Senior (65 years-old or more).
-
•
Gender with two classes: Man and Woman.
-
•
Skin-tone with six types, Type 1 to Type 6, according to the Fitzpatrick scale [18].
-
•
Ethnicity with eight classes from the FairFace dataset [26]: Black, East Asian, Indian, Latino, Middle Eastern, Southeast Asian, White plus an extra Other class.
Contextual attributes
We denote contextual attributes as temporary states captured in an image. We annotate two:
-
•
Emotion with five classes: Happiness, Sadness, Fear, Anger, Neutral.
-
•
Activity with ten groups adapted from the ActivityNet taxonomy [12] to fit static images: Helping and Caring, Eating, Household, Dance and Music, Personal Care, Posing, Sports, Transportation, Work, and Other.
All the attributes also include an unsure class.
3.3 Annotation process
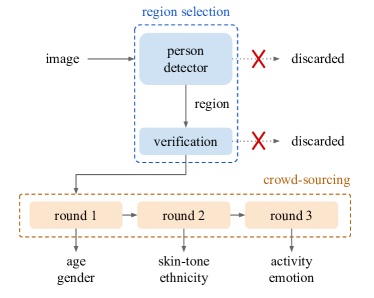
Due to the large size of the GCC dataset, we annotate all the validation set ( images with people) and a random subset of the training set ( images with people). The annotation process555Annotation process approved by the Institutional Review Board (IRB). consists of two parts, region selection and crowd-sourcing, summarized in Figure 2.
Region selection
Unlike MSCOCO, GCC does not have object region annotations. There are machine-generated labels for a subset of the training images. We do not rely on these labels, as they are not associated with bounding boxes and are not available for the validation set. Instead, we conduct a region selection process semi-automatically in two phases. In the first phase, we run the object detector YOLOv5 [25] to detect regions with objects. For each detected region, YOLOv5 returns an object class, a confidence score, and a bounding box. We keep regions whose object label is person, the confidence score is higher than , and the pixel area is larger than . As the detected regions are relatively noisy, in the second phase, we conduct a manual verification. We discard regions without a person, depicting multiple people, or not photographs.
Crowd-sourcing
The selected regions are annotated via AMT crowd-sourcing in three rounds. In the first round, we collect the demographic attributes of age and gender. In the second round, the ones related to race, i.e. skin-tone and ethnicity. Lastly, we collect the contextual attributes of emotion and activity. Splitting the annotation process into different rounds allows us to have better control of the quality. For the first two rounds, we expose workers to the cropped regions, to avoid the context being used to predict demographic attributes [6]. For the last round, as the context is essential, we show workers the full image with a bounding box around the person of interest. We ask them to select the perceived attributes from a given list. For all rounds, three different workers annotate each region. To ensure quality, we conduct random verifications of the annotated samples.
Workers must fulfill three conditions: 1) to be Masters, which is a qualification granted by the platform to workers with high-quality work, 2) to agree to a consent form as per our Institutional Review Board approval, and 3) to conduct a survey for collecting workers’ demographics. As the perception of attributes may be affected by the own workers’ attributes [15], we anonymize workers’ survey and release it with the rest of the annotations.
4 Annotator statistics
Annotator demographics
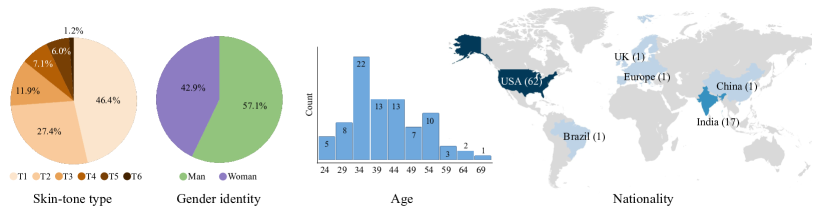
The workers’ survey has the following questions: age as an input text box; gender as a multiple choice form with options man, woman, non-binary, others; nationality as an input text box; and skin-tone type as a multiple choice form with six options according to the Fitzpatrick scale. Statistics are shown in Figure 3. In total, workers answered the survey. From these, reported to be less then year-old, between and year-old, and more than 65 year-old. With respect to gender, workers reported to be women, and men, with no other genders reported. Skin-tone is predominantly light (Types 1, 2, and 3), with only skin-tone Types 4, 5, or 6. Most of the workers are from the United States of America () followed by India (). Other nationalities include Brazil, the United Kingdom, Europe, and China, with a worker each.
| Attribute | Labels | 3+ | 2+ | Agreement | |
|---|---|---|---|---|---|
| age | moderate | ||||
| gender | almost perfect | ||||
| skin-tone | fair | ||||
| skin-tone (binary) | moderate | ||||
| ethnicity | moderate | ||||
| emotion | fair | ||||
| activity | substantial |
Inter-annotator agreement
We measure to what extent attributes are equally perceived by different people by computing the inter-annotator agreement. We use two metrics: a consensus ratio and the Fleiss’ kappa [19]. Consensus ratio, , indicates the percentage of regions in which or more workers give the same class, and Fleiss’ kappa, , measures whether the annotations agree with a probability above chance. Results are in Table 2. According to , gender has an almost perfect agreement, with of the regions with a consensus of three workers. Activity shows a substantial agreement, whereas age and ethnicity have a moderate agreement. Considering that ethnicity is known to be a subjective attribute[20], the relatively high agreement may be due to workers having a similar background (e.g. most workers are from the United States of America). In contrast, skin-tone and emotion have the lowest ( and , respectively) but are still well above chance (). Note that skin-tone can be affected by image illumination and the annotator’s own perception of color, making consecutive skin-tone types (e.g. Type 2 and Type 3) difficult to distinguish. Thus, we additionally check agreement in binary skin-tone classification, i.e. lighter skin-tone (Types 1, 2, 3) and darker skin-tone (Types 4, 5, 6). increases from (fair) to (moderate), so from now on we preferably use binary skin-tone unless otherwise stated.
5 PHASE \scalerel*![[Uncaptioned image]](/html/2304.02828/assets/x8.png) X analysis
X analysis
We annotated the whole validation set and a random portion of the training set. We downloaded and validation and training images, respectively; from those, and validation and training images had detected human regions by YOLOv5; from those, all the validation () and a random subset of the training images (), were annotated; only and validation and training images passed the manual verification and their human-detected regions were annotated with the six demographic and contextual attributes. Overall, regions were annotated: in the validation set and in the training set.
We publicly share the data in two formats: raw, in which each region has up to three annotations, and region-level, in which each region is assigned to a class by majority vote. If there is no consensus, the region is labeled as disagreement.
Attribute analysis
Full statistics per attribute and class are reported in the supplementary material. Overall, all the attributes are imbalanced, with one or two predominant classes per attribute. For age, the predominant class is adult, appearing in of the region-level annotations, while for gender, the gap between man () and woman () is points. The gap is bigger in skin-tone and ethnicity: skin-tone Type 2 is annotated in of the regions, while Types 4, 5, and 6 together only in . Similarly, in ethnicity, White class is over-represented with regions, while the rest of the classes appear from to regions each. When conducting an intersectional analysis, big differences arise. For example, the classes man and White appear together in regions, whereas woman and Black in only .
As per the contextual attributes, the most represented emotion is neutral () followed by happy (), whereas negative-associated emotions (sad, fear, anger) are just in total. For activity, the most common classes are posing () and other ().
| Age | Gender | Skin-tone (binary) | Ethnicity | |||||||||
|---|---|---|---|---|---|---|---|---|---|---|---|---|
| LICM | LIC | LICM | LIC | Error | LICM | LIC | LICM | LIC | ||||
| Unbiased | 25.0 | 0.0 | 50.0 | 0.0 | 0.0 | 50.0 | 0.0 | 14.3 | 0.0 | |||
| OFA [55] | 61.1 3.7 | 7.9 | 74.7 3.7 | 2.0 | 4.3 | 60.6 4.9 | -2.4 | 22.6 5.4 | 0.9 | |||
| ClipCap [33] | 57.4 3.7 | 6.2 | 76.7 1.8 | 2.7 | 7.9 | 68.0 6.5 | 6.2 | 24.8 7.5 | 2.9 | |||
Gender and context
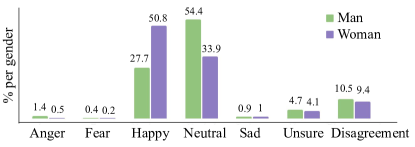
We cross-check gender with contextual attributes. Region-level emotion statistics per gender are shown in Figure 4, where it can be seen that women tend to appear Happy whereas men tend to appear Neutral. This aligns with the gender stereotyping of emotions, which is a well-documented phenomenon in psychology [35]. We also detect disparities in activities per gender, especially in the classes posing and sports: in woman regions, there are posing and sports annotations, while in man regions, are posing and are sports.
GCC vs MSCOCO
We compare gender and skin-tone annotations in GCC against the annotations in MSCOCO by Zhao et al. [60]. In MSCOCO, gender was reported as man regions and woman regions, which is a gap of points, smaller than the points gap in GCC. With respect to skin-tone, the gap in MSCOCO between lighter skin-tone (Types 1, 2, and 3) and darker skin-tone (Types 4, 5, and 6) was reported to be (from to ), whereas the gap in GCC is (from to ). This shows that GCC, an automatically crawled dataset, is more unbalanced than MSCOCO, a manually annotated dataset, both in gender and skin-tone attributes.
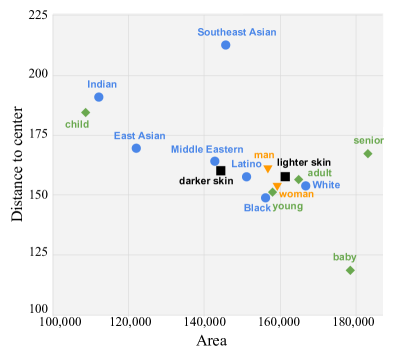
Region analysis
We analyze how the regions of the different demographic classes are presented in the GCC dataset. In particular, in Figure 5, we show an average of the area and the distance to the image center per class. The most noticeable disparities are in the attribute age, with senior and baby being the larger regions from all the classes and child the smaller. The class baby also tends to be more centered than people in other ages. In contrast, gender regions do not present big differences in size and position. With respect to skin-tone and ethnicity, the area for lighter class is bigger than for darker skin-tone, whereas ethnicity presents a large variance, with the Southeast Asian class being the most faraway from the center and the White class the largest one.
6 Downstream bias evaluation
With PHASE \scalerel*![]() X annotations we can evaluate societal bias in vision-and-language tasks. We explore image captioning, text-image embeddings, and text-to-image generation.
X annotations we can evaluate societal bias in vision-and-language tasks. We explore image captioning, text-image embeddings, and text-to-image generation.
Image annotations
The annotations in PHASE \scalerel*![]() X correspond to regions, but the three tasks analyzed in this section use the full image as a whole. To deal with this discrepancy, we transform the region-level annotations into image-level annotations. To that end, we only use images in which all the region-level annotations belong to the same class. For example, an image is labeled as woman if all the region-level annotations of gender are woman. Images containing different classes for a specific attribute are not used. Note that this approach is not unique and other methods can be used according to the type of evaluation to be conducted. In addition, to deal with the low number of annotations, we merge baby and child into a single class baby & child.
X correspond to regions, but the three tasks analyzed in this section use the full image as a whole. To deal with this discrepancy, we transform the region-level annotations into image-level annotations. To that end, we only use images in which all the region-level annotations belong to the same class. For example, an image is labeled as woman if all the region-level annotations of gender are woman. Images containing different classes for a specific attribute are not used. Note that this approach is not unique and other methods can be used according to the type of evaluation to be conducted. In addition, to deal with the low number of annotations, we merge baby and child into a single class baby & child.
6.1 Image captioning
Image captioning is one of the reference tasks in vision-and-language research. Given an image, a captioning model generates a sentence describing its contents. Multiple image captioning models trained on the MSCOCO dataset have been shown to be biased with respect to gender [11] and skin-tone [60]. In this section, we evaluate two of the latest models trained on GCC, OFA [55] and ClipCap [33], in the four demographic attributes in our annotations. While OFA is a state-of-the-art model based on vision-and-language Transformers [48], ClipCap leverages CLIP embeddings [37], which are also analyzed in terms of bias in the next section.
Metrics
We evaluate image captioning models on societal bias and bias amplification with LICM and LIC metrics [22], respectively. LICM corresponds to the accuracy of a caption classifier that predicts the class of a demographic attribute after masking class-revealing words.666Gender-revealing words: actor, actress, aunt, boy, boyfriend, brother, chairman, chairwoman, cowboy, daughter, dude, emperor, father, female, gentleman, girl, girlfriend, guy, he, her, hers, herself, him, himself, his, husband, lady, male, man, mother, policeman, policewoman, pregnant, prince, princess, queen, king, she, sister, son, uncle, waiter, waitress, wife, woman (and their plurals).777Age-revealing words: adult, aged, baby, child, elderly, infant, kid, teenager, toddler, young (and their plurals). If the caption classifier is more accurate than random chance, it means that captions of people from different classes are semantically different. The classifier is trained times with different random seeds, and results are reported as average and standard deviation. On the other hand, measures bias amplification by comparing the accuracy of the caption classifier trained on the human captions, LICD, against the model-generated captions, LICM. If , the generated captions are more biased than the original ones and the model amplifies the bias.
Additionally, for the gender attribute, we compute Error [11], which measures the percentage of captions in which gender is misclassified. Error can only be computed if attributes are explicitly mentioned in the generated captions, which is the case for gender, but not for e.g. skin-tone.
Results
Results are shown in Table 3. Both OFA and ClipCap have a LICM score well above the unbiased case for the four attributes. When trained on GCC, except OFA in skin-tone, both models amplify bias with respect to the original dataset. This highlights the urgency of incorporating bias mitigation techniques, such as the model-agnostic method in [23]. Although age is an attribute that is not often analyzed, results show that it is the one with the highest bias, both on LICM and LIC metrics. This highlights the urgency to consider age in representation fairness. Results on gender and skin-tone also reveal important biases in the models’ outputs, while the large standard deviation in ethnicity, which may be due to the higher number of classes () and the smaller number of samples per class (), makes it difficult to extract reliable conclusions.
6.2 Text-image CLIP embeddings
| Attribute | Samples | R@1 | R@5 | R@10 | |
|---|---|---|---|---|---|
| age | baby & child | ||||
| young | |||||
| adult | |||||
| senior | |||||
| gender | man | ||||
| woman | |||||
| skin-tone | lighter | ||||
| darker | |||||
| ethnicity | Black | ||||
| East Asian | |||||
| Indian | |||||
| Latino | |||||
| Middle Eastern | |||||
| Southeast Asian | |||||
| White |
Next, we evaluate the performance of pre-trained text-image CLIP embeddings [37] for the different demographic attributes. CLIP is a dual architecture with a text encoder and an image encoder that learns image and text embeddings by predicting matching pairs. Due to the large amount of data used for training ( million image-text pairs), the two encoders learn the correspondences of high-level semantics in the language and the visual modalities. The goal of our evaluation is to check whether the demographic attributes of people in the images have an impact on the accuracy of the embeddings. To conduct this evaluation, we extract image and text embeddings with the pre-trained CLIP encoders. For each of the images in the validation set, we rank the validation captions according to the cosine similarity between their embeddings and analyze the accuracy of the ranked list.
Metrics
We evaluate accuracy of image-text embeddings as recall at (R@) with . R@ indicates the percentage of images whose matching caption is ranked within the top- positions. We compare the difference in R@ for classes in the same attribute to check whether CLIP embeddings perform differently. In the ideal scenario of unbiased representations, R@ performance in different class attributes should be alike.
Results
Results are shown in Table 4. Within each of the four demographic attributes, noticeable differences in performance can be observed. Note that the number of samples in each class is different, which could influence the results. In the supplementary material, we report an evaluation when using the same number of samples per class, in which we verify that the conclusions are not affected. We summarize the main findings as follows:
-
•
For the age attribute, baby & child and senior have the best R@, while young and adult fall well behind with a difference of up to in R@10. The big differences in the age classes are consistent with the results of the region analysis (Section 5) and the image captioning (Section 6.1), being the attribute with the highest class variance.
-
•
In gender, man samples perform consistently better than woman samples.
- •
-
•
Ethnicity is not consistent. For R@1, the highest classes are Eastern Asian and Indian, but for R@5 and R@10 is Middle Eastern. The lowest classes are Latino, Southeast Asian, and Black. The lack of consistency, together with the low inter-annotator agreement (Section 4), shows that ethnicity annotations are highly subjective.
-
•
More samples do not ensure a better recall, which means that the number of samples is not the (only) source for difference in performance. For example, in age, although adult and young classes are the most common, their performance is the worst. The same happens in skin-tone; despite the predominance of lighter, R@ is higher for darker samples. In contrast, in gender, man outperforms woman both in the number of samples and in R@.
6.3 Text-to-image generation
Lastly, we analyze the demographic representation on Stable Diffusion [39], one of the latest text-to-image generation models. Text-to-image generation, which can be seen as the reverse operation of image captioning, consists on creating an image from a text sentence, also known as prompt. In particular, Stable Diffusion relies on pre-trained CLIP embeddings and Diffusion Models [24] to generate an image in the latent space whose embedding is close to the input prompt embedding. In our evaluation, we use the captions in the validation set as prompts to generate an image per caption. We use the demographic annotations of the original images associated with the captions to study Stable Diffusion representations.
Metrics
The official code for Stable Diffusion v1.4888https://github.com/CompVis/stable-diffusion includes a Safety Checker module that raises a flag when the generated images are considered to be NSFW.999Not safe for work, a tag commonly used for pornographic, violent, or otherwise inappropriate content. The module is pre-trained and used off-the-shelf by the community. We check whether there are patterns in the output of the Safety Checker according to the demographic attributes of the input caption. Additionally, we compare the demographics of the generated images against the demographics of the original images associated with the captions.
Results
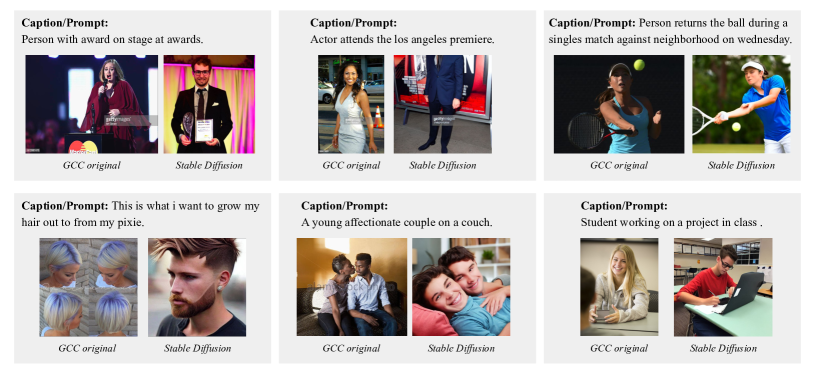
Out of generated images, are flagged as unsafe by the Safety Checker module. From these, we do not find prominent differences between the distribution of classes in the original images and the unsafe images for age, skin-tone, and ethnicity attributes. We do find, however, the distribution of gender unusual: despite woman only being validation images, it raises unsafe images. This indicates that gender, especially woman, has an important contribution to the Safety Checker. With the current experiments, we cannot clarify whether this is due to Stable Diffusion being more prone to generate NSFW images from prompts from women images, or due to the Safety Checker being more prone to detect NSFW in woman-generated images. A table with the results can be found in the supplementary material. Additionally, in Figure 6, we show some examples of Stable Diffusion generated images and compare them against the original images in GCC. We observe that when the prompt refers to people in a neutral language (e.g. person), the generated images tend to represent White men. To verify this observation, we manually annotate 100 generated images. For neutral language prompts, we observe men vs. women; and lighter vs. darker skin-tone. These results are consistent with concurrent work on text-to-image generation bias [7].
7 Limitations
Although we argued that demographic annotations are necessary to address societal bias in vision-and-language models, we acknowledge that they pose some risks.
Perceived attributes
The annotations are conducted by external observers, meaning they reflect perceived attributes. Perceived attributes may not correspond to the real person’s attributes. As per dataset construction, GCC in this case but computer vision datasets in general, it is not possible to ask people depicted in the images about their self-perceived attributes. Annotations should not be considered real, objective, or trustworthy labels, but an approximation of how observers classify people in images.
Subjectivity
The annotations are subjective and not universal. Many demographic attributes, especially the ones related to race, ethnicity, or emotion, have different classification systems according to different contexts and cultures.
Malicious uses
The intended use of the annotations is for research on societal bias and fairness. Although we cannot control who, when, and how will use the annotations once they are publicly available, the use for malicious applications is strictly prohibited.
8 Conclusion
We studied social bias in large and uncurated vision-and-language datasets. Specifically, we annotated part of the GCC dataset with four demographic and two contextual attributes. With annotations on age, gender, skin-tone, ethnicity, emotion, and activity, we conducted a comprehensive analysis of the representation diversity of the dataset. We found all six attributes to be highly unbalanced. When compared against manually annotated datasets such as MSCOCO, GCC presented bigger gaps in gender and skin-tone, with an overrepresentation of man and lighter skin-tones. Additionally, we evaluated three downstream tasks: image captioning, image-text CLIP embeddings, and text-to-image generation. In all the tasks, we found differences in performance for images in different demographic classes, highlighting the need for resources and solutions.101010This work is partly supported by JST CREST Grant No. JPMJCR20D3, JST FOREST Grant No. JPMJFR216O, JSPS KAKENHI No. JP22K12091, and Grant-in-Aid for Scientific Research (A).
References
- [1] Jean-Baptiste Alayrac, Jeff Donahue, Pauline Luc, Antoine Miech, Iain Barr, Yana Hasson, Karel Lenc, Arthur Mensch, Katie Millican, Malcolm Reynolds, et al. Flamingo: a visual language model for few-shot learning. arXiv preprint arXiv:2204.14198, 2022.
- [2] Jack J Amend, Albatool Wazzan, and Richard Souvenir. Evaluating gender-neutral training data for automated image captioning. In International Conference on Big Data, 2021.
- [3] Jerone TA Andrews, Dora Zhao, William Thong, Apostolos Modas, Orestis Papakyriakopoulos, Shruti Nagpal, and Alice Xiang. Ethical considerations for collecting human-centric image datasets. arXiv preprint arXiv:2302.03629, 2023.
- [4] Stanislaw Antol, Aishwarya Agrawal, Jiasen Lu, Margaret Mitchell, Dhruv Batra, C Lawrence Zitnick, and Devi Parikh. VQA: Visual question answering. In ICCV, 2015.
- [5] Hugo Berg, Siobhan Hall, Yash Bhalgat, Hannah Kirk, Aleksandar Shtedritski, and Max Bain. A prompt array keeps the bias away: Debiasing vision-language models with adversarial learning. In AACL-IJCNLP, 2022.
- [6] Shruti Bhargava and David Forsyth. Exposing and correcting the gender bias in image captioning datasets and models. arXiv preprint arXiv:1912.00578, 2019.
- [7] Federico Bianchi, Pratyusha Kalluri, Esin Durmus, Faisal Ladhak, Myra Cheng, Debora Nozza, Tatsunori Hashimoto, Dan Jurafsky, James Zou, and Aylin Caliskan. Easily accessible text-to-image generation amplifies demographic stereotypes at large scale. arXiv preprint arXiv:2211.03759, 2022.
- [8] Abeba Birhane and Vinay Uday Prabhu. Large image datasets: A pyrrhic win for computer vision? In WACV, 2021.
- [9] Abeba Birhane, Vinay Uday Prabhu, and Emmanuel Kahembwe. Multimodal datasets: Misogyny, pornography, and malignant stereotypes. arXiv preprint arXiv:2110.01963, 2021.
- [10] Joy Buolamwini and Timnit Gebru. Gender shades: Intersectional accuracy disparities in commercial gender classification. In FAccT, 2018.
- [11] Kaylee Burns, Lisa Anne Hendricks, Kate Saenko, Trevor Darrell, and Anna Rohrbach. Women also snowboard: Overcoming bias in captioning models. In ECCV, 2018.
- [12] Fabian Caba Heilbron, Victor Escorcia, Bernard Ghanem, and Juan Carlos Niebles. ActivityNet: A large-scale video benchmark for human activity understanding. In CVPR, 2015.
- [13] Xinlei Chen, Hao Fang, Tsung-Yi Lin, Ramakrishna Vedantam, Saurabh Gupta, Piotr Dollár, and C Lawrence Zitnick. Microsoft COCO captions: Data collection and evaluation server. arXiv preprint arXiv:1504.00325, 2015.
- [14] Yen-Chun Chen, Linjie Li, Licheng Yu, Ahmed El Kholy, Faisal Ahmed, Zhe Gan, Yu Cheng, and Jingjing Liu. Uniter: Universal image-text representation learning. In ECCV, 2020.
- [15] Aida Mostafazadeh Davani, Mark Díaz, and Vinodkumar Prabhakaran. Dealing with disagreements: Looking beyond the majority vote in subjective annotations. Trans. ACL, 2022.
- [16] Jia Deng, Wei Dong, Richard Socher, Li-Jia Li, Kai Li, and Li Fei-Fei. ImageNet: A large-scale hierarchical image database. In CVPR, 2009.
- [17] Karan Desai, Gaurav Kaul, Zubin Trivadi Aysola, and Justin Johnson. Redcaps: Web-curated image-text data created by the people, for the people. In NeurIPS Datasets and Benchmarks Track, 2021.
- [18] Thomas B Fitzpatrick. The validity and practicality of sun-reactive skin types I through VI. Archives of dermatology, 124(6):869–871, 1988.
- [19] J. L. Fleiss. Measuring nominal scale agreement among many raters. Psychological Bulletin, 76(5):378 – 382, 1971.
- [20] Alex Hanna, Emily Denton, Andrew Smart, and Jamila Smith-Loud. Towards a critical race methodology in algorithmic fairness. In FAccT, 2020.
- [21] Yusuke Hirota, Yuta Nakashima, and Noa Garcia. Gender and racial bias in visual question answering datasets. In FAccT, 2022.
- [22] Yusuke Hirota, Yuta Nakashima, and Noa Garcia. Quantifying societal bias amplification in image captioning. In CVPR, 2022.
- [23] Yusuke Hirota, Yuta Nakashima, and Noa Garcia. Model-agnostic gender debiased image captioning. In CVPR, 2023.
- [24] Jonathan Ho, Ajay Jain, and Pieter Abbeel. Denoising diffusion probabilistic models. NeurIPS, 2020.
- [25] Glenn Jocher, Ayush Chaurasia, Alex Stoken, Jirka Borovec, NanoCode012, Yonghye Kwon, TaoXie, Kalen Michael, Jiacong Fang, imyhxy, Lorna, Colin Wong, Zeng Yifu, Abhiram V, Diego Montes, Zhiqiang Wang, Cristi Fati, Jebastin Nadar, Laughing, UnglvKitDe, tkianai, yxNONG, Piotr Skalski, Adam Hogan, Max Strobel, Mrinal Jain, Lorenzo Mammana, and xylieong. ultralytics/yolov5: v6.2 - YOLOv5 Classification Models, Apple M1, Reproducibility, ClearML and Deci.ai integrations, Aug. 2022.
- [26] Kimmo Karkkainen and Jungseock Joo. FairFace: Face attribute dataset for balanced race, gender, and age for bias measurement and mitigation. In WACV, 2021.
- [27] Ranjay Krishna, Yuke Zhu, Oliver Groth, Justin Johnson, Kenji Hata, Joshua Kravitz, Stephanie Chen, Yannis Kalantidis, Li-Jia Li, David A Shamma, et al. Visual Genome: Connecting language and vision using crowdsourced dense image annotations. Trans. IJCV, 123(1):32–73, 2017.
- [28] Gen Li, N. Duan, Yuejian Fang, Daxin Jiang, and M. Zhou. Unicoder-VL: A universal encoder for vision and language by cross-modal pre-training. In AAAI, 2020.
- [29] Xiujun Li, Xi Yin, Chunyuan Li, Pengchuan Zhang, Xiaowei Hu, Lei Zhang, Lijuan Wang, Houdong Hu, Li Dong, Furu Wei, et al. Oscar: Object-semantics aligned pre-training for vision-language tasks. In ECCV, 2020.
- [30] Tsung-Yi Lin, Michael Maire, Serge Belongie, James Hays, Pietro Perona, Deva Ramanan, Piotr Dollár, and C Lawrence Zitnick. Microsoft COCO: Common objects in context. In ECCV, 2014.
- [31] Jiasen Lu, Dhruv Batra, Devi Parikh, and Stefan Lee. Vilbert: Pretraining task-agnostic visiolinguistic representations for vision-and-language tasks. NeurIPS, 2019.
- [32] Nicole Meister, Dora Zhao, Angelina Wang, Vikram V Ramaswamy, Ruth Fong, and Olga Russakovsky. Gender artifacts in visual datasets. arXiv preprint arXiv:2206.09191, 2022.
- [33] Ron Mokady, Amir Hertz, and Amit H Bermano. ClipCap: Clip prefix for image captioning. arXiv preprint arXiv:2111.09734, 2021.
- [34] Jahna Otterbacher, Pınar Barlas, Styliani Kleanthous, and Kyriakos Kyriakou. How do we talk about other people? Group (un) fairness in natural language image descriptions. In AAAI HCOMP, 2019.
- [35] E Ashby Plant, Janet Shibley Hyde, Dacher Keltner, and Patricia G Devine. The gender stereotyping of emotions. Psychology of women quarterly, 24(1):81–92, 2000.
- [36] Bryan A Plummer, Liwei Wang, Chris M Cervantes, Juan C Caicedo, Julia Hockenmaier, and Svetlana Lazebnik. Flickr30k entities: Collecting region-to-phrase correspondences for richer image-to-sentence models. In ICCV, 2015.
- [37] Alec Radford, Jong Wook Kim, Chris Hallacy, Aditya Ramesh, Gabriel Goh, Sandhini Agarwal, Girish Sastry, Amanda Askell, Pamela Mishkin, Jack Clark, et al. Learning transferable visual models from natural language supervision. In ICML, 2021.
- [38] Aditya Ramesh, Prafulla Dhariwal, Alex Nichol, Casey Chu, and Mark Chen. Hierarchical text-conditional image generation with clip latents. arXiv preprint arXiv:2204.06125, 2022.
- [39] Robin Rombach, Andreas Blattmann, Dominik Lorenz, Patrick Esser, and Björn Ommer. High-resolution image synthesis with latent diffusion models. In CVPR, 2022.
- [40] Candace Ross, Boris Katz, and Andrei Barbu. Measuring social biases in grounded vision and language embeddings. In NAACL, 2021.
- [41] Chitwan Saharia, William Chan, Saurabh Saxena, Lala Li, Jay Whang, Emily Denton, Seyed Kamyar Seyed Ghasemipour, Burcu Karagol Ayan, S Sara Mahdavi, Rapha Gontijo Lopes, et al. Photorealistic text-to-image diffusion models with deep language understanding. In NeurIPS, 2022.
- [42] Christoph Schuhmann, Robert Kaczmarczyk, Aran Komatsuzaki, Aarush Katta, Richard Vencu, Romain Beaumont, Jenia Jitsev, Theo Coombes, and Clayton Mullis. LAION-400M: Open dataset of clip-filtered 400 million image-text pairs. In NeurIPS Workshop Datacentric AI, 2021.
- [43] Piyush Sharma, Nan Ding, Sebastian Goodman, and Radu Soricut. Conceptual captions: A cleaned, hypernymed, image alt-text dataset for automatic image captioning. In ACL, 2018.
- [44] Tejas Srinivasan and Yonatan Bisk. Worst of both worlds: Biases compound in pre-trained vision-and-language models. In Workshop on Gender Bias in Natural Language Processing, 2022.
- [45] Weijie Su, Xizhou Zhu, Yue Cao, Bin Li, Lewei Lu, Furu Wei, and Jifeng Dai. Vl-bert: Pre-training of generic visual-linguistic representations. In ICLR, 2019.
- [46] Ruixiang Tang, Mengnan Du, Yuening Li, Zirui Liu, Na Zou, and Xia Hu. Mitigating gender bias in captioning systems. In WWW, 2021.
- [47] Emiel Van Miltenburg. Stereotyping and bias in the Flickr30k dataset. In Workshop on Multimodal Corpora, 2016.
- [48] Ashish Vaswani, Noam Shazeer, Niki Parmar, Jakob Uszkoreit, Llion Jones, Aidan N Gomez, Łukasz Kaiser, and Illia Polosukhin. Attention is all you need. In NeurIPS, 2017.
- [49] Anthony J Viera, Joanne M Garrett, et al. Understanding interobserver agreement: the kappa statistic. Fam med, 37(5):360–363, 2005.
- [50] Oriol Vinyals, Alexander Toshev, Samy Bengio, and Dumitru Erhan. Show and tell: A neural image caption generator. In CVPR, 2015.
- [51] Angelina Wang, Solon Barocas, Kristen Laird, and Hanna Wallach. Measuring representational harms in image captioning. In FAccT, 2022.
- [52] Angelina Wang, Arvind Narayanan, and Olga Russakovsky. Revise: A tool for measuring and mitigating bias in visual datasets. In ECCV, 2020.
- [53] Angelina Wang and Olga Russakovsky. Directional bias amplification. In ICML, 2021.
- [54] Jialu Wang, Yang Liu, and Xin Wang. Are gender-neutral queries really gender-neutral? mitigating gender bias in image search. In EMNLP, 2021.
- [55] Peng Wang, An Yang, Rui Men, Junyang Lin, Shuai Bai, Zhikang Li, Jianxin Ma, Chang Zhou, Jingren Zhou, and Hongxia Yang. OFA: unifying architectures, tasks, and modalities through a simple sequence-to-sequence learning framework. In ICML, 2022.
- [56] Tianlu Wang, Jieyu Zhao, Mark Yatskar, Kai-Wei Chang, and Vicente Ordonez. Balanced datasets are not enough: Estimating and mitigating gender bias in deep image representations. In ICCV, 2019.
- [57] Laura Weidinger, Jonathan Uesato, Maribeth Rauh, Conor Griffin, Po-Sen Huang, John Mellor, Amelia Glaese, Myra Cheng, Borja Balle, Atoosa Kasirzadeh, et al. Taxonomy of risks posed by language models. In FAccT, 2022.
- [58] Kaiyu Yang, Klint Qinami, Li Fei-Fei, Jia Deng, and Olga Russakovsky. Towards fairer datasets: Filtering and balancing the distribution of the people subtree in the ImageNet hierarchy. In FAccT, 2020.
- [59] Fei Yu, Jiji Tang, Weichong Yin, Yu Sun, Hao Tian, Hua Wu, and Haifeng Wang. Ernie-vil: Knowledge enhanced vision-language representations through scene graphs. In AAAI, 2021.
- [60] Dora Zhao, Angelina Wang, and Olga Russakovsky. Understanding and evaluating racial biases in image captioning. In ICCV, 2021.
- [61] Jieyu Zhao, Tianlu Wang, Mark Yatskar, Vicente Ordonez, and Kai-Wei Chang. Men also like shopping: Reducing gender bias amplification using corpus-level constraints. In EMNLP, 2017.
Appendix A PHASE \scalerel*![[Uncaptioned image]](/html/2304.02828/assets/x18.png) X statistics
X statistics
Statistics about the number of annotations per attribute and class are reported in Table 7. For each class, we show the number of annotations as the raw annotations for the given class, the number of regions as the region-level annotations reached after annotator majority voting, and the number of images as the images with at least one region-level annotation with the class of interest.
Appendix B YOLOv5 bias evaluation
We evaluate YOLOv5 in terms of skin-tone bias to check whether the use of this model can be a contributing factor to the representation discrepancies in PHASE \scalerel*![]() X annotations. We detect people in MSCOCO and compare accuracy per skin-tone using [60] annotations. Results are reported as follows: darker skin-tone recall is , and lighter skin-tone recall is . This shows that there is, indeed, a difference in performance according to skin-tone. However, we believe that it is not as big as to justify the representation gap that was found in the GCC dataset and the conclusions of our analysis still stand.
X annotations. We detect people in MSCOCO and compare accuracy per skin-tone using [60] annotations. Results are reported as follows: darker skin-tone recall is , and lighter skin-tone recall is . This shows that there is, indeed, a difference in performance according to skin-tone. However, we believe that it is not as big as to justify the representation gap that was found in the GCC dataset and the conclusions of our analysis still stand.
| Attribute | Samples | R@1 | R@5 | R@10 | |
|---|---|---|---|---|---|
| age | baby & child | ||||
| young | |||||
| adult | |||||
| senior | |||||
| gender | man | ||||
| woman | |||||
| skin-tone | lighter | ||||
| darker | |||||
| ethnicity | Black | ||||
| East Asian | |||||
| Indian | |||||
| Latino | |||||
| Middle Eastern | |||||
| Southeast Asian | |||||
| White |
Appendix C CLIP evaluation results
We report the results of the CLIP evaluation when balancing the number of samples per class and attribute. Table 8 compares CLIP performance in R@ for when using all the samples in the validation set (Unbalanced), and when using the same number of samples per class and attribute (Balanced). For the balanced results, we use the number of samples in the smallest class in each attribute. Results are reported as mean and standard deviation over runs with different random samples per class.
| Attribute | Validation set () | Unsafe label () | |
|---|---|---|---|
| age | |||
| baby | |||
| child | |||
| young | |||
| adult | |||
| senior | |||
| unsure | 1.11 | 0.00 | |
| multiple | 26.59 | 16.13 | |
| gender | |||
| man | |||
| woman | |||
| unsure | 0.98 | ||
| multiple | 21.72 | ||
| skin-tone (binary) | |||
| lighter | |||
| darker | |||
| unsure | 5.66 | 3.23 | |
| multiple | 18.83 | 12.90 | |
| ethnicity | |||
| Black | |||
| East Asian | |||
| Indian | |||
| Latino | |||
| Middle Eastern | |||
| Southeast Asian | |||
| White | |||
| unsure | 5.52 | 3.23 | |
| multiple | 37.41 | 25.81 | |
CLIP with occlusions
To better understand what about the image leads to differing performances, we occlude the detected bounding boxes and repeat the evaluation process. We find that masking people bounding boxes makes CLIP’s R@1 drop from about 30% to 8% for all the attributes, which means that relevant information is contained in person regions. Moreover, as shown in Table 5, the conclusions are maintained, e.g. recall for man is higher than for woman, which suggests that part of the bias is from the language.
Appendix D Stable Diffusion results
Table 6 reports the statistics of Stable Diffusion’s Safety Checker per attribute and class. We compare the percentage of samples per class in the image annotations, with the percentage of samples per class labeled as unsafe by the Safety Checker. It stands out that the class woman raises of the unsafe labels whereas only accounts for of the original images. Lighter skin-tone and White ethnicity also show big increases in the percentage of samples raised as unsafe, but differently from the woman class, both of them are the predominant class in their respective attributes.
| Attribute | Annotations | Regions | Images | Attribute | Annotations | Regions | Images | |||
| age | skin-tone type | - | - | |||||||
| baby | type 1 | - | - | |||||||
| child | type 2 | 49,821 | - | - | ||||||
| young adult | type 3 | - | - | |||||||
| adult | 48,604 | 16,117 | 10,631 | type 4 | - | - | ||||
| senior | type 5 | - | - | |||||||
| unsure | 3,623 | 653 | 525 | type 6 | - | - | ||||
| gender | unsure | 3,949 | - | - | ||||||
| man | 67,122 | 22,491 | 13,511 | skin-tone (binary) | - | |||||
| woman | lighter | - | 28,187 | 16,245 | ||||||
| unsure | 1,983 | 285 | 241 | darker | - | |||||
| ethnicity | unsure | - | 922 | 730 | ||||||
| Black | activity | |||||||||
| East Asian | caring | |||||||||
| Indian | music | |||||||||
| Latino | eating | |||||||||
| Middle Eastern | household | |||||||||
| Southeast Asian | personal | |||||||||
| White | 63,253 | 22,098 | 13,698 | posing | 30,409 | 10,121 | 6,619 | |||
| unsure | 5,578 | 1,289 | 1,021 | sports | ||||||
| emotion | transportation | |||||||||
| happy | work | |||||||||
| sad | sports | |||||||||
| fear | other | |||||||||
| anger | unsure | 1,080 | 164 | 149 | ||||||
| neutral | 47,367 | 16,646 | 10,473 | |||||||
| unsure | 6,005 | 1,663 | 1,224 | |||||||
| Unbalanced | Balanced | ||||||||||
|---|---|---|---|---|---|---|---|---|---|---|---|
| Attribute | Class | Size | R@1 | R@5 | R@10 | Size | R@1 | R@5 | R@10 | ||
| age | baby & child | ||||||||||
| young | |||||||||||
| adult | |||||||||||
| senior | |||||||||||
| gender | man | ||||||||||
| woman | |||||||||||
| skin-tone | lighter | ||||||||||
| darker | |||||||||||
| ethnicity | Black | ||||||||||
| East Asian | |||||||||||
| Indian | |||||||||||
| Latino | |||||||||||
| Middle Eastern | |||||||||||
| Southeast Asian | |||||||||||
| White | |||||||||||