Non-equilibrium antigen recognition in acute infections
Abstract
The immune response to an acute primary infection is a coupled process of antigen proliferation, molecular recognition by naive B cells, and their subsequent proliferation and antibody shedding. This process contains a fundamental problem: the recognition of an exponentially time-dependent antigen signal. Here we show that B cells can efficiently recognise new antigens by a tuned kinetic proofreading mechanism, where the molecular recognition machinery is adapted to the complexity of the immune repertoire. This process produces potent, specific and fast recognition of antigens, maintaining a spectrum of genetically distinct B cell lineages as input for affinity maturation. We show that the proliferation-recognition dynamics of a primary infection is a generalised Luria-Delbrück process, akin to the dynamics of the classic fluctuation experiment. This map establishes a link between signal recognition dynamics and evolution. We derive the resulting statistics of the activated immune repertoire: antigen binding affinity, expected size, and frequency of active B cell clones are related by power laws. Their exponents define the class of generalised Luria-Delbrück processes; they depend on the antigen and B cell proliferation rate, the number of proofreading steps, and the lineage density of the naive repertoire. Empirical data of mouse immune repertoires are found to be consistent with activation involving at least three proofreading steps. Our model predicts key clinical characteristics of acute infections, including the emergence of elite neutralisers and the effects of immune ageing. More broadly, our results establish acute infections as a new probe into the global architecture and functional principles of immune repertoires.
I Introduction
B cells are a central part of the human adaptive immune system. These cells recognise pathogens by specific binding: B cell receptors (BCRs) located in the cellular membrane bind to antigenic epitopes, which are cognate binding loci on the surface of pathogens. To capture a wide range of a priori unknown pathogens, humans produce a large and diverse naive B cell repertoire, estimated to contain about lineages with distinct BCR genotypes [1, 2, 3] and a comparable number of circulating naive cells [4]. An acute infection is characterised by rapid, initially exponential growth of the pathogen population. This often starts with few particles and reaches peak densities of order within a few days [5, 6, 7, 8]. At some stage of this process, free antigens start to bind to B cells in lineages of sufficiently high binding affinity. Antigen binding can activate B cells, triggering rapid proliferation and shedding of free antibodies (membrane-detached BCRs) that eventually clear the pathogen. Activated B cells also form germinal centres and create immunological memory [9, 10]. Primary infections are estimated to generate multiple activated B cell lineages, [11].
The exponential growth of pathogens, together with a large number of circulating B cell lineages, presents a formidable real-time specificity problem for recognition. Consider an antigen that activates a high-affinity B cell lineage at a given point of time. One day later, at a fold higher population density, the antigen can potentially activate a large number of low-affinity lineages, generating a poor overall response of the immune repertoire. The actual process activates only a tiny fraction of the pre-infection repertoire. Previous work has established upper bounds of order [12, 13], and a lower bound follows from recent data, [11]. How is such highly specific immune response possible? At its core, this is a fundamental problem of signal recognition: how to process an exponentially increasing signal, here of a growing antigen population, for a fast and specific response. Molecular recognition problems, in and outside the context of immunology, have so far been studied mostly for steady-state signals [14, 15, 16, 17, 18]. In this paper, we show that optimal recognition of an exponential signal depends on three a priori unrelated factors: the signal processing mechanism, the growth rates of signal and response, and the complexity of the recognition repertoire.
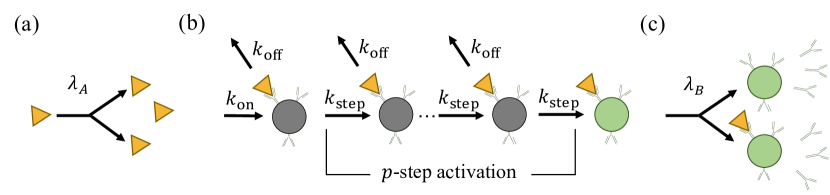
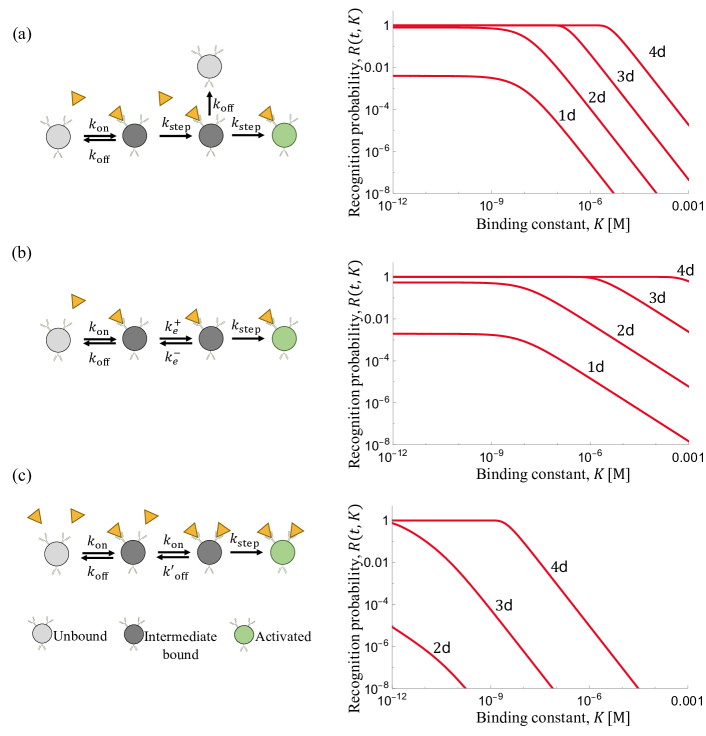
Our analysis is based on a model for the recognition dynamics with three steps: antigen proliferation, molecular activation, and subsequent proliferation of activated B cells [see Fig. 1]. The B cell activation process contains kinetic proofreading: a series of multiple, thermodynamically irreversible steps [14, 15]. In an appropriate regime of rate parameters, processes with kinetic proofreading are known to increase the affinity discrimination of their output compared to near-equilibrium processes. For the activation process of Fig. 1, we show that the activation rate of weak binding B cells depends on the antigen-BCR binding constant and on the number of activation steps, .
Kinetic proofreading has been recognised as a key step in the activation of T cell immunity [16, 19, 20, 21]. For B cells, evidence for proofreading comes from experimental observations of characteristic time lags in activation, but little is known about the underlying molecular mechanism [22]. Observed mechanisms of immune cell activation by membrane-bound antigens include BCR clustering, membrane spreading-contraction, quorum sensing, and molecular tug-of-war extraction forces [23, 24, 25]. Such mechanisms may contribute to proofreading, but their relevance for the specificity of initial antigen recognition addressed in this article remains unclear. Here we use a minimal -step model of activation to show that proofreading is essential for specific and timely recognition of an exponential antigen signal in acute primary infections. This result complements previous work on steady-state signal recognition by kinetic proofreading [14, 15, 16, 17, 18].
To understand how activation and proofreading act in the face of an exponentially increasing input signal, we treat the recognition dynamics as a generalised Luria-Delbrück process. This process resembles the proliferation-mutation dynamics of the classical Luria-Delbrück experiment [26]: the antigen corresponds to the wild-type, activation to mutation, and B cell lineages to mutant cell lineages. The new feature of the infection dynamics, which has no analogue in the original Luria-Delbrück process, is that each B cell lineage has a specific antigen binding constant . This sets the density of B cell lineages available for activation, , and modulates their activation rate.
In the first part of the paper, we develop the theory of generalised Luria-Delbrück processes for antigen recognition, and we compute the distribution of lineages in activated B cell repertoires. In the second part, we turn to biological implications of the recognition dynamics. Our model predicts optimal immune responses to an exponentially increasing pathogen population, tuned to a balance between speed and potency, at an intermediate number of proofreading steps. Recent data of mouse immune repertoires [11] are shown to be consistent with this prediction. The model further predicts that activated immune repertoires of different hosts responding to the same antigen show giant fluctuations, similar to mutant populations in a classical fluctuation experiment. Such fluctuations are a hallmark of Luria-Delbrück processes [26, 27, 28, 29, 30]. In a primary immune response, giant fluctuations are generated by “jackpot” clones of large size and high antigen affinity. We derive the underlying statistics of activated repertoires and infer clinically important characteristics of acute primary infections.
II Theory of exponential antigen recognition
Antigen-BCR binding.
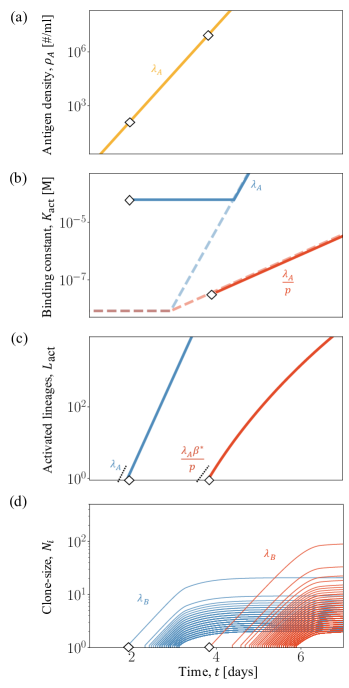
In the initial phase of an infection, the antigen population grows exponentially with a rate [see Figs. 1(a) and 2(a)]. For viral pathogens, this process starts with few antigen copies and reaches densities of order within about 5 days, which implies replication factors /d [5, 6, 7, 8]. Free antigens bind to circulating naive B cells with rate per cell, where is the number of BCR per cell and is the association rate [see Fig. 1(b)]. Association is known to be diffusion-limited with typical rates [31] and B cells are known to have up to BCRs in their membrane [1]. Therefore, differences in antigen binding affinity between different B cell lineages result primarily from differences in the dissociation rate . Human B cells have dissociation rates in the range [1]. The corresponding equilibrium binding constant, , varies in the range . This constant is related to the lineage-specific energy gap between the bound and the unbound state, , where is a normalisation constant and all energies are measured in units of [see Appendix A]. Importantly, with these parameters, the fraction of antigen-bound B cells remains small throughout the infection process.
B cell activation.
Upon binding, we assume that B cells undergo a series of thermodynamically irreversible steps to activation [see Fig. 1(b)]. That is, cells in each intermediate state transform to the next state (with rate ) or unbind from the antigen (with rate ), but do not revert to the previous state. The stepwise, stochastic activation dynamics is an inhomogeneous Poisson process with an output activation rate . In the relevant regime of low antigen concentration, this rate takes the form
| (1) |
with . In the low-affinity regime, the activation rate has the asymptotic form , which can be read off from Fig. 1(b): each activation step generates a factor relating the thermodynamic weights of consecutive intermediate states.
Next, we compute the activation probability of a B cell lineage up to time , . For exponential antigen growth, we find
| (2) |
[see Appendix A]. This equation describes a moving front of deterministic activation, , where reaches values of order 1 [see Fig. S1]. The front starts at affinity and time , where is Avogadro’s number. With increasing antigen concentration, it moves towards lineages of decreasing antigen affinity at a -dependent speed [see Fig. 2(b)]. Ahead of the front, for , activation of individual lineages is a rare stochastic event. For , activation is asymptotically proportional to the inverse equilibrium constant, or Boltzmann factor, . For , the non-equilibrium dynamics of kinetic proofreading generate stronger suppression of activation for weak binders, [14, 15]. Kinetic proofreading appears to be the simplest mechanism to generate deterministic activation of high-affinity lineages together with strong suppression of low-affinity lineages; mechanisms with reversible antigen-receptor binding have or remain in the stochastic regime () under the physiological conditions of an early primary infection [see Fig. S1 and Appendix A].
Lineage activation marks the onset of the immune response to a new antigen. Activated cells proliferate exponentially with an initial rate that is comparable to [32] and shed free antibodies that can neutralise antigens [see Fig. 1(c)]. As the activated repertoire grows, cells start to compete for space and resources, including T cell help [33]. Here we model the clone dynamics as logistic growth,
| (3) |
where is the number of activated cells in clone and [32] is a carrying capacity for the total size of the activated repertoire [see Fig. 2(d)]; here and below, overbars refer to the repertoire statistics at carrying capacity.
Repertoire response to a given antigen.
To characterise the immune repertoire available for primary response against a given antigen, we grade naive B cell lineages by their affinity to the antigen’s binding locus (epitope). We use a simple sequence-specific binding energy model, where epitopes and their cognate BCR are sequence segments, and . Binding aligns these segments and couples pairs of aligned amino acids, and the binding energy gap is additive,
| (4) |
For a given antigen, this model defines the density of naive lineages available for activation, , where is the expected number of lineages in an individual with binding constant to the epitope [see Fig. 3 and Appendix B]. Here we assume that naive repertoires are randomly sampled from an underlying amino acid distribution [3]. Hence, most lineages bind only weakly to a new antigen (). The expected minimum binding constant in an individual, , is given by the condition . This point is to be distinguished from the global minimum for a given antigen, , which often corresponds to a unique BCR genotype (called the Master sequence). Because individual repertoires cover only a small fraction of the BCR genotype space, the expected maximum antigen affinity remains substantially below the Master sequence (). To characterise the strong-binding tail of the lineage spectrum, we define the micro-canonical entropy, , and the associated inverse reduced temperature,
| (5) |
This function measures the exponential increase in lineage density with binding energy, , in the vicinity of a given point . As we will show below, the inverse temperature at maximum binding, , is a key determinant of the activation dynamics.
Repertoire response to diverse antigens.
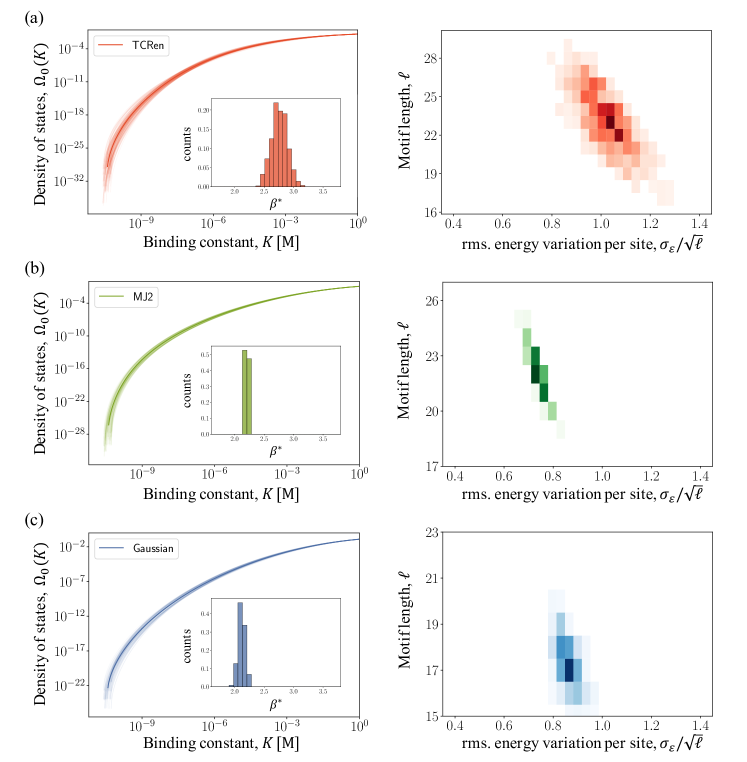
How comparable are the response repertoires of different antigens? To address this question, we evaluate the lineage spectrum for a random sample of antigenic epitopes [see Fig. S2]. The interaction energy matrix of our main analysis is proportional to the TCRec matrix originally inferred for T cell receptors [34]; similar spectra are obtained from the Miyazawa-Jernigan matrix [35] and from normally distributed random energies. For a given antigen, the spectral density depends on broad statistical features of the energy matrix, including the binding length and the variance of interaction energies, [see Appendix B]. Here we determine these parameters from observed binding constants M and M of high-affinity antibodies generated in primary infections and of ultra-potent antibodies, respectively [36, 1].
Remarkably, these physiological constraints generate a consistent ensemble of response repertoires. First, the distributions of inferred binding lengths and of the rms. energy variation per site are strongly peaked around values and , respectively, which are in tune with known examples [see Fig. S2]. Second, the lineage densities depend only weakly on the antigen sequence and have a nearly universal shape [see Fig. S2]. In other words, the antigen-averaged spectral density captures the response repertoire available in a typical primary infection. In particular, response repertoires of different antigens with similar and have similar inverse activation temperatures, .
Repertoire activation.
The spectral density of naive lineages and the recognition function determine the time-dependent density of activated lineages,
| (6) |
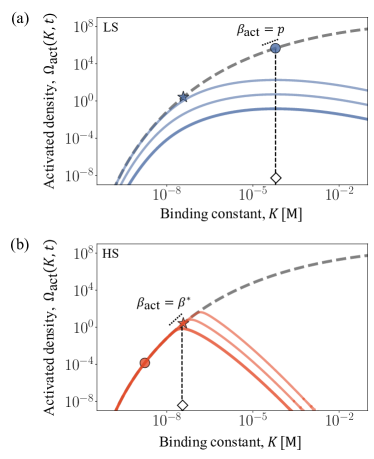
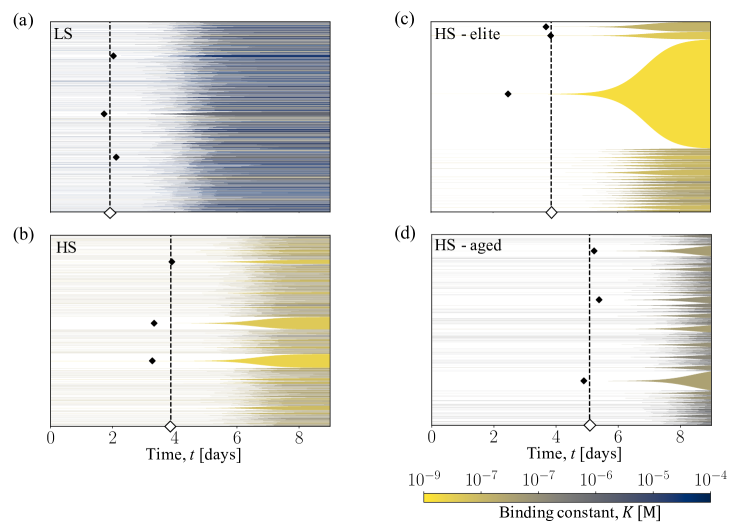
In Fig. 3, we plot at subsequent times for two different numbers of activation steps, with and without proofreading (). The spectral density of activated lineages is strongly peaked; its high-affinity flank is given by the density of naive lineages, its low-affinity flank by the proofreading-dependent activation dynamics. This function determines two repertoire summary statistics: the expected number of activated lineages, , and their average binding constant . Activation starts at an expected time given by the condition . This sets the initial binding constant [marked by diamonds in Fig. 3] and the inverse activation temperature [marked by a tangent dotted line in Fig. 3]. Importantly, activation has two dynamical regimes.
In the low-specificity (LS) regime, for small values of , activation is peaked on the low-affinity flank of the spectral function [see Fig. 3(a)]. The starting point is determined by the condition , which follows from the asymptotic form given by Eq. (2). In this regime, the number of activation steps, , determines the specificity of recognition; the activation probability and clone size of individual lineages remains small. The LS activation dynamics is characterised by
| (7) |
as shown in Fig. 2(b) and 2(c) [see Appendix B]. This regime ends at a crossover point , where reaches the expected minimum binding constant, .
In the high-specificity (HS) regime, for , activation starts at and , then follows the deterministic front (Fig. 3B). Hence, lineages are activated deterministically and in order of decreasing antigen affinity. In this regime, the spectral density of the naive B cell repertoire determines the specificity of recognition; high-affinity lineages reach substantial clone size. We find in the HS activation dynamics
| (8) |
as shown in Fig. 2(b) and 2(c) [see Appendix B]. In the next section, we will show that these regimes generate drastically different immune responses.
Clone size and affinity statistics.
B cell immune repertoires are known to have broad variation of clone sizes, which can be described by power-law distributions [37, 38, 39]. The proliferation-activation process of acute infections provides a simple explanation for such power laws: it relates observables that depend exponentially on time [see Fig. 2]. First, consider the relation between clone size and probability of occurrence in an individual’s repertoire. More lineages are activated later (), but these clones reach smaller size (). This relates clone size to rank,
| (9) |
with
| (10) |
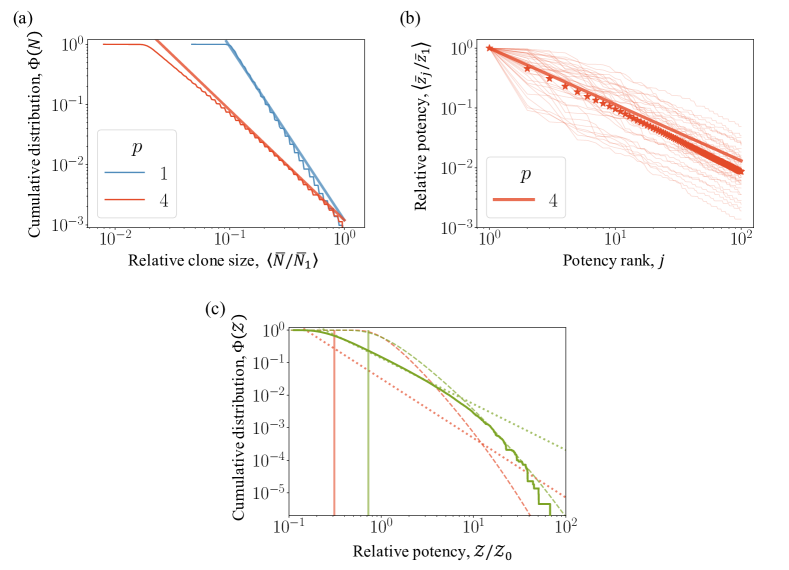
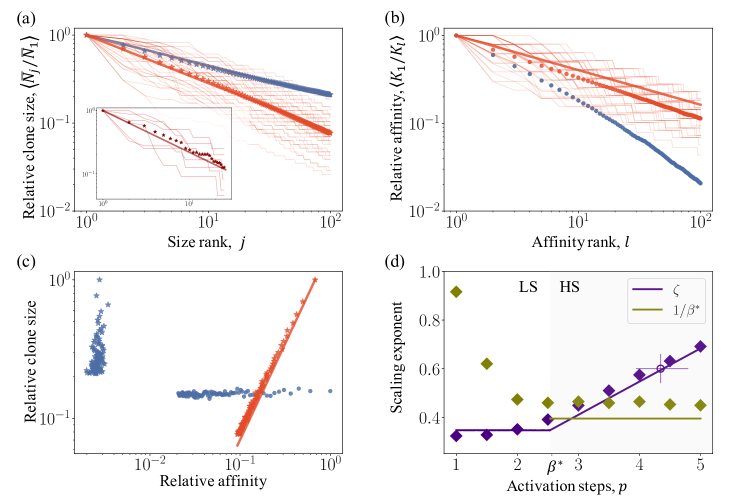
and [see Appendix B]. In what follows, we refer to and as the size exponent and the phenotype exponent of the recognition dynamics, respectively. The index again orders the clones in an individual’s repertoire by size. The cumulative distribution aggregated over individuals has the form , which is equivalent to Eq. (9), and spans 3 orders of magnitude in size [see Fig. S3 and Appendix B]. Simulations confirm these power laws; the clone-rank statistics in a set of randomly chosen individuals follows the same pattern [see Fig. 4(a) and S3]. In the HS regime, the exponent increases monotonically as a function of , reflecting the increasing bias to large clone size generated by proofreading [see Fig. 4(d)].
The activation dynamics of a primary infection include a recognition phenotype (here, antigen affinity), generating additional power laws observable in repertoire data. In the HS regime, activation occurs on a moving front, as given by Eq. (8). This relates affinity to rank,
| (11) |
where the index orders clones by decreasing affinity [see Fig. 4(b) and Appendix B]. Equation (11) is again equivalent to a power law in the spectral density, , and is consistent with the affinity-rank statistics in randomly sampled individuals. The exponent equals the activation temperature of the naive repertoire, as given by Eq. (5). By combining Eqs. (9) and (11), we obtain a power-law relation between size and affinity,
| (12) |
as shown in Fig. 4(c). In the HS regime, the size and affinity rankings coincide up to fluctuations, because both are related to time: high-affinity clones get activated before low-affinity clones. In the LS regime, the size-affinity correlation is lost. Large clones have affinities of order , high-affinity clones have small size and show a faster decline of affinity with rank than in the HS regime [see Fig. 3(a), 4(b) and 4(c)]. Hence, empirical observations of this correlation can provide specific evidence for activation by proofreading in the HS regime.
Generalised Luria-Delbrück processes.
The antigen recognition statistics of a primary infection, as given by Eqs. (9) to (12), is characterised by two independent exponents, the size exponent and the phenotype exponent . These statistics define a specific class of exponential processes, where growth is mediated by a recognition phenotype. We argue this class to be relevant for recognition of exponential signals, and refer to it as generalised Luria-Delbrück processes. The analogy becomes clear by comparison with the proliferation-mutation statistics of a classical Luria-Delbrück fluctuation experiment, where a wild-type cell population grows exponentially with rate , cells mutate with a constant rate , and mutant clones grow with rate . This process produces a power-law clone size statistics of the form (9) with size exponent
| (13) |
[see Appendix B and ref. [30]]. In the LS regime (), the clone size statistics of activated B cells follows the classical Luria-Delbrück form, . In the HS regime (), however, the B cell size exponent takes a different form, , the correction factor reflecting the correlation between clone size and recognition phenotype (antigen affinity). The exponent , which governs the statistics of the recognition phenotype given by Eq. (11), has no analogue in a classical Luria-Delbrück process. This exponent enters the number of activated B cell clones, [see Fig. 2(c)], which corresponds to the number of mutant clones in a classical Luria-Delbrück process. Given a constant molecular clock of mutations, this number always grows with rate , proportionally to the wild-type population size.
III Biological consequences
Efficient immune response by kinetic proofreading.
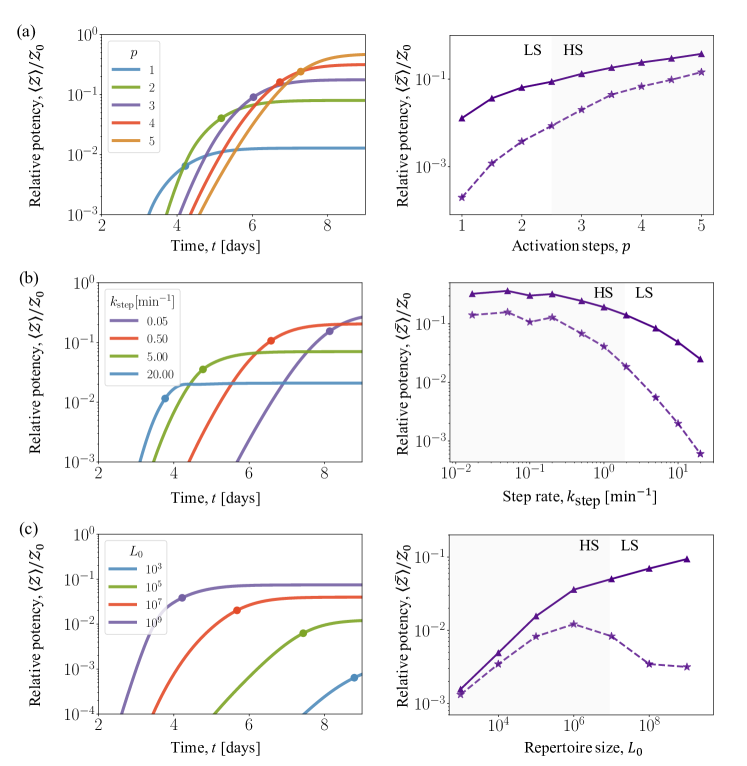
In Figs. 5(a) and 5(b), we show simulation results for primary B cell activation in typical individuals without proofreading () and with proofreading at an intermediate number of steps (). Three differences are immediately recognizable: proofreading reduces the number of activated clones, increases the binding affinity of typical clones, and delays the onset of activation. These differences reflect the effects of proofreading in the HS regime derived in the previous section: deterministic activation of high-affinity lineages is coupled to strong suppression of low-affinity lineages. To quantify the impact of the activation dynamics on immune function, we evaluate the antiserum potency
| (14) |
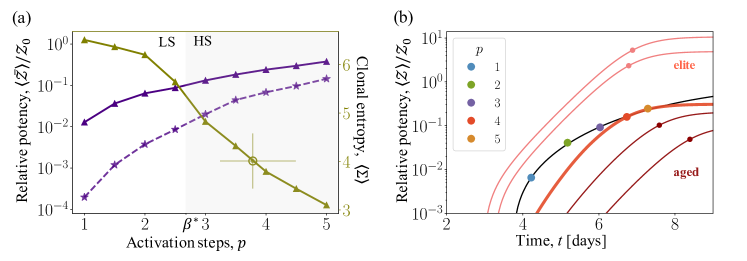
as well as the contributions of individual lineages, (the index orders clones by decreasing size). The function sums the antigen affinities of all activated cells and determines the fraction of neutralised virions; it reaches a saturation value at carrying capacity of the activated repertoire. We measure potency relative to a reference value describing a hypothetical repertoire with homogeneous binding constant . In Fig. 6(a), we plot the population average as a function of the number of proofreading steps (here and below, population averages are denoted by brackets). Potency comes close to the reference value in the HS regime, but quickly drops with decreasing in the LS regime. Without proofreading (), is about 20fold lower than at , argued below to be the approximate number of proofreading steps in human B cell activation. The difference between activation regimes is even more pronounced for the potency contribution of the largest clone, [see Fig. 6(a)]. In the HS regime, where the largest clone is likely also the clone of highest affinity, contributes a substantial fraction of the total potency; the HS potency-rank relation predicted by our model is shown in Fig. S3. There is again a rapid drop in the LS regime; without proofreading, is about 1000fold lower than at .
Another striking difference between the activation regime is in the activation probability of individual lineages, as given by the recognition function . In the HS regime, almost all high-affinity lineages get activated ( reaches values close to 1); in the LS regime, most available high-affinity lineages do not get activated and are waisted for pathogen suppression (). Together, we conclude that the lineage activation profile generated by kinetic proofreading in the HS regime is a prerequisite for a potent, specific, and efficient primary immune response.
Repertoire-tuned proofreading.
Fig. 5(a) and 5(b) show two further functional differences between the activation regimes. In the LS regime, a large number of lineages gets activated, but these clones reach only small population frequencies at carrying capacity, . In the HS regime, activation gets increasingly focused on few high-frequency and high-affinity lineages. We can describe the diversity of activated repertoires by the Shannon entropy . In the LS regime, the population average is large and varies only weakly; in the HS regime, drops substantially with increasing [see Fig. 6(a)]. Subsequent to activation, a part of the B cells undergoes affinity maturation in germinal centers. This mutation-selection process produces high-affinity plasma B cells, as well as a diverse set of memory B cells. In the HS regime, the larger repertoire diversity found close to the crossover point () serves both channels of affinity maturation: it facilitates the search for mutational paths towards high-affinity BCR genotypes in plasma cells, and it provides diverse input for memory cell formation [40].
In Fig. 6(b) we plot the time-dependent, population-averaged potency for different values of . The response time , where reaches the half-saturation point , is marked by dots. The -dependent increase in potency is coupled to an increased time delay of activation, caused by the sequence of intermediate steps and by the constraint to high-affinity lineages. In the HS regime, increasing yields a diminishing return of potency, while continues to increase proportionally to . Similarly, efficient proofreading requires a sufficiently small activation rate. In the HS regime, for , decreasing yields a diminishing return of potency, while continues to increase proportionally to [see Fig. S4]. The tradeoff between potency and speed of immune response defines a Pareto surface. This tradeoff, together with the entropy pattern, suggests that optimal immune response is tuned to the spectral density of the naive repertoire: the number and rate of proofreading steps are in the HS regime close to the crossover point and , respectively.
Activated B cell repertoires in mice.
While there is no direct evidence of proofreading in B cell activation to date, available data suggests that immune response is in the tuned regime. Specifically, using recent data of clonal B cell populations in early germinal centres of mice [11], we infer a repertoire entropy [circle in Fig. 6(a); see Appendix B], which is consistent with proofreading in the range .
A more stringent test of our model is the size distribution of activated clones. As predicted by Eq. (9), the empirical rank-size relation obtained from the data of ref. [11] can be fit to a power law with exponent [insert in Fig. 4(a)]. The resulting estimate [see Fig. 4(d)] is consistent with the value inferred from the clonal entropy, confirming our inference of proofreading at an intermediate number of steps. Remarkably, clone size distributions extracted from data of human memory B cell repertoires [41] show power laws with a similar exponent, [39]. Given that memory cells are in the same affinity range than activated naive cells [42], this may point to a common dynamical origin; however, our present model contains only the primary activation dynamics and is not directly applicable to memory cells. In refs. [38, 39], the power laws of memory repertoires have been attributed to long-term selection by recurrent infections.
Elite neutralisers.
Generalised Luria-Delbrück immune activation shows particularly pronounced variation between hosts. In the HS regime, a subset of elite neutralisers is distinguished by early activation of a single high-affinity clone. This jackpot clone dominates the activated immune repertoire and generates exceptionally high potency. Fig. 5(c) shows an example of the activation dynamics that occurs in one of individuals, which is to be compared with the pattern in typical individuals [see Fig. 5(b)]. Such elite neutralisers are ahead of the Pareto surface of typical immune responses [see Fig. 6(b)]. The cumulative distribution , which gives the fraction of responders with saturation potency , displays two regimes of elite neutralisers [see Fig. S3]. In the pre-asymptotic regime, the jackpot clone takes a large part but not all of the repertoire (). The pre-asymptotic potency distribution turns out to be dominated by clone size fluctuations, which implies [see Appendix B]. In the asymptotic regime, the jackpot clone dominates the repertoire (); hence, is proportional to the naive density of high-affinity clones, . For example, one in individuals has a primary response with potency 100x above average, comparable to a memory immune response carried by affinity maturated B cell lineages.
Immune ageing.
Recent results indicate that the most prominent effect of immune ageing is a decrease in the overall size and diversity of the repertoire [43, 44, 45, 46]. Our model predicts two effects of this decrease: primary immune responses come later and with reduced potency. Simulations of the activation dynamics in an aged repertoire in the HS regime show that the activation is delayed and antigen affinities are reduced compared to a full-size repertoire [see Fig. 5(d), to be compared with Fig. 5(b)]. The time-dependent potency remains behind the Pareto line and reaches a reduced value at carrying capacity [see Fig. 6(b)]. For a 10fold decrease in repertoire size, increases by about 1d and drops to half of its full-size value. Fig. S4 shows the full dependence of potency on repertoire size. Given a reference point in the HS regime, a reduction of size always has a sizeable effect, while an increase eventually induces a cross-over to the LS regime and a diminishing return of potency.
IV Discussion
A potent adaptive immune response to a new antigen requires the specific activation of immune cells with high affinity to the antigen. Here we have developed a minimal, biophysical model for immune recognition by naive B cells in a primary infection [see Fig. 1]. We have shown that active processes of antigen-receptor binding – kinetic proofreading – are an essential part of the initial recognition dynamics: a highly specific real-time response to a new antigen requires proofreading with depth above a threshold value, . Available data of mouse B cell repertoires are consistent with proofreading close to the specificity threshold, , which amounts to at least 3 consecutive proofreading steps [see Figs. 4 and 6]. As shown by our model, immune responses tuned to this point are close to a functional optimum: they balance potency and speed, and they generate a diverse set of activated clones for subsequent affinity maturation.
Our model treats the proliferation-activation dynamics of a primary infection as a generalised Luria-Delbrück process [see Fig. 2]. This class of processes is argued to be relevant for the molecular recognition of exponential signals. It is characterised by fluctuations coupled to recognition function: jackpot clones have large size and high affinity to the recognition target, here the exponentially growing antigen population [see Fig. 5(c) and 6(b)]. The underlying statistics of activated immune repertoires is characterised by statistical power laws with two basic exponents: the size exponent and the phenotype exponent . These exponents characterise the proofreading-dependent specificity of activated immune repertoires, as given by Eqs. (9) and (11). Importantly, our model predicts and in terms of independently measurable quantities and without fit parameters. The statistics of activated B cell repertoires shape clinically important characteristics of primary infections, including the potency drop of aged responders and the increased response of elite neutralisers [see Fig. 6].
Power-law statistics of lineages and the occurrence of elite neutralisers are commonly ascribed to antigen-mediated selection on immune repertoires, often through multiple exposures [47, 38, 48, 49, 39]. Here we have shown that similar features can already emerge in the primary immune response to an acute infection, prior to any antigen-mediated selection effects. Following an acute infection, a part of the activated B cell repertoire is further processed by affinity maturation. This step is again driven by non-equilibrium antigen recognition processes [25].
Repertoire sequencing combined with neutralisation assays can test our model and probe adaptive immune systems in new ways. By recording the power-law rank-size relation of linages in early post-infection B cell repertoires and measuring the antigen binding constant of these clones, we can extract the corresponding power laws and infer the central parameters of our model: the specificity threshold, and the number of proofreading steps, [see Fig. 4]. The parameter measures the density of B cell lineages close to the maximum-affinity lineage. This density is set by the global architecture of B cell immunity: the size of the naive repertoire and the complexity of the antigen-receptor binding motif. Both quantities emerge as key determinants of primary immune responses. In contrast, the parameter characterises the molecular dynamics of antigen recognition. As we have shown, -step proofreading generates an effective inverse temperature that measures the specificity gain in a dense repertoire. At the point of optimal recognition, , antigen recognition dynamics matches repertoire complexity. From this point, increasing at a constant repertoire size produces a diminishing return of proofreading; conversely, increasing at constant produces a diminishing return of repertoire size.
The link between repertoire size and antigen recognition machinery has implications for the macro-evolution of adaptive immune systems. The size of the total B cell repertoire varies drastically across vertebrates, ranging from cells in zebrafish [37] to in humans [1, 2, 3]. Because potency and timeliness of immune responses are likely to be under strong selection, the functional balance of tuned proofreading, , is also expected to be a maximum of fitness. Evolutionary changes of the repertoire size are then predicted to occur together with changes of the recognition machinery, which includes number and rate of proofreading steps. Tracing these co-evolutionary dynamics by comparative cross-species studies may provide a new avenue to understand the evolution of complex immune systems.
Acknowledgements.
We thank D. Valenzano and A. Ryabova for discussions, M. Karmakar and M. Meijers for a careful reading of the manuscript, and all members of the Lässig lab for input. This work was partially supported by Deutsche Forschungsgemeinschaft (grant CRC 1310, to ML).Appendix A Antigen recognition dynamics
Antigen-receptor interaction models.
Here we model the binding (free) energy between an antigen with epitope sequence and a B cell receptor (BCR) sequence as an additive function,
| (15) |
This function includes entropy contributions of non-translational degrees of freedom; i.e., rotations and elastic deformations of the molecules involved. We use three established models of amino acid interactions : the TCRec model originally inferred for T cell receptors [34], the Miyazawa-Jernigan matrix [35], and normally distributed random energies. In each case, we introduce a scale factor that is inferred from measured BCR-antigen binding energies (see below). The zero point of , by definition, corresponds to a reference antigen-BCR pair with equilibrium binding constant M. In this gauge, the binding energy and the dissociation constant of an arbitrary pair are related by
| (16) |
where is Boltzmann’s constant. In the main text and below, we express all energies in units of at a fixed, physiological temperature .
Activation of B cells by kinetic proofreading.
An early infection is characterised by low densities of antigens and B cells. Accordingly, we model the activation of individual B cells upon functional binding with a single antigen. We assume that activation of antigen-bound cells requires a chain of irreversible steps with characteristic rate [see Fig. 1]. Hence, the B cell activation rate takes the form
| (17) |
Here, the association rate per B cell, is proportional to the number of receptors per cell, , the diffusion-limited association rate to a single B cell receptor, , and the antigen density, . The probability of activation after association is given by
| (18) |
where and . At each intermediate state, the antigen can dissociate or undergo the next activation step; these alternatives are independent Poisson processes with rates and , respectively. Hence, the next activation step occurs before dissociation with probability .
The probability that a lineage gets activated up to time is
| (19) | |||||
as given by Eq. (2) of the main text. Here we have used that antigens proliferate exponentially, . At early times, activation is association-limited and rare for all ,
| (20) | |||||
| (21) |
where
| (22) |
and is Avogadro’s number. For , we have
| (23) |
with
| (24) |
That is, deterministic activation of B cell lineages occurs along a moving front, . Ahead of the front, activation is strongly suppressed by proofreading.
Alternative models of B cell activation.
To highlight the specific role of kinetic proofreading in the activation of naive B cells, we compare the proposed activation mechanism to alternative mechanisms with reversible binding kinetics [see Fig. S1]. The corresponding rates govern transitions between unbound and intermediate antigen-bound B cell states [marked by grey shading in Fig. 1 and Fig. S1]. We note that all activation mechanisms have at least one irreversible step: the last transition to exponential proliferation and antibody production (marked by green shading).
In an early primary infection, the activation of B cells takes place under specific physiological conditions: (i) The antigen density and, hence, the equilibrium occupancy of B cells remains low (, given M and M). These conditions differ drastically from the densities in confined spaces, e.g., lymph nodes and germinal centers, which are relevant for the binding kinetics of presented antigens. (ii) The association kinetics of virions and plasma B cells is believed to be diffusion-limited; i.e., it takes place at a homogeneous rate [50]. This excludes mechanisms for specific recognition by formation of immunological synapses, which have been proposed for presented antigen and operate by modulation of an activation-limited rate [51, 52, 53, 19, 54]. (iii) For efficient activation, the rate cannot be smaller than all other transition rates, as it is usually assumed in models of kinetic proofreading [14, 15]. Tuned rates discussed in the main text are of order , which implies for high-affinity B cell lineages. In this regime, the activation dynamics at a given antigen density is close to a non-equilibrium steady state, even if the binding kinetics satisfies detailed balance. We consider two specific classes of models with diffusion-limited association and reversible binding kinetics:
Activation via an excited intermediate state.
This process is a reversible analogue of the proofreading dynamics discussed in the main text. Allowed transitions are between the unbound state and the primary bound state (with rates ) and between the primary bound state and the excited intermediate state (with rates ), as shown in Fig. S1. Using detailed balance, the antigen-bound states have reduced binding energies and respectively, where and . Like the proofreading model, this reversible model has a deterministic activation front given by Eqs. (22) and (24). However, the activation probability is asymptotically proportional to the equilibrium occupancy of the intermediate state,
| (25) | |||||
leading to weak suppression of low-affinity lineages [14, 15].
Activation by cooperative binding.
In this process, activation requires binding of two or more virions to receptors of the same B cell, which has been observed for antigens actively transported to lymph nodes and presented to B cells [52, 53, 55]. A bound state of virions has the reduced binding energy , where is the single-particle binding energy and is the contribution of cooperative binding. Fig. S1 shows the case , where . In the cooperative binding model with detailed balance, the asymptotic activation probability is proportional to the equilibrium occupancy of the -virion bound state,
| (26) | |||||
with . For , this model leads to stronger suppression of low-affinity lineages; however, at the low antigen concentrations of an early infection, even high-affinity naive lineages do not reach deterministic activation ( for ).
We conclude that the kinetic proofreading mechanism of B cell activation introduced in the main text is the simplest model to generate deterministic activation of high-affinity lineages together with strong suppression of low-affinity lineages under the physiological conditions of an early primary infection.
Appendix B Antigen recognition statistics
Density of BCR states.
To characterise the naive B cell repertoire available for response to a given antigen , we use the density of lineage states defined by a unique BCR sequence ,
| (27) |
where is the expected number of lineages in an individual with binding constant to the epitope (we suppress the dependence on in this paragraph). By Eq. (16), this form is equivalent to the definition given in the main text, . We further define the micro-canonical entropy
| (28) |
and the associated micro-canonical inverse temperature,
| (29) |
a parameter that is independent of the physiological temperature appearing in Eq. (16). Because we measure energies in units of , the parameter gives the inverse temperature in units of . To compute these micro-canonical quantities, we evaluate the canonical partition function,
| (30) | |||||
which depends on as an independent parameter. This function defines the canonical binding energy,
| (31) |
which is an expectation value in the ensemble (30), and the associated entropy,
| (32) |
We invert the relation (31) to write the inverse temperature as a function of the binding energy, , and we substitute this function into Eq. (32) to obtain . Upon equating , these functions provide an excellent approximation to their micro-canonical counterparts and , as given by Eqs. (28) and (29). Thus, the canonical formalism provides an efficient way to compute the density of states, , for the system at hand.
Antigen-receptor ensembles.
To compare the response repertoires for different antigens, we evaluate the BCR lineage density for a random sample of epitope sequences . For a given amino acid interaction matrix and a given antigen, our energy model has two free parameters, the binding length and the scale factor of the energy, which sets the energy variance . Here we calibrate these parameters by tuning the minimum binding constant expected in an individual repertoire and the global minimum binding constant to observed values of typical high-affinity antibodies generated in primary infections and of ultra-potent antibodies, M and M [36, 1]
The resulting ensemble of response repertoires has the following properties [see Fig. S2]: (i) The distributions of inferred binding lengths and of the rms. energy variation per site are strongly peaked around values and . (ii) A higher energy variance per site can be traded for a shorter binding length, consistent with a constraint on the total energy variance . (iii) The lineage densities depend only weakly on the antigen sequence and have similar inverse activation temperatures, .
Activation statistics of B cell repertoires.
Given the density of naive B cell lineages, , and the activation probability , we can evaluate the density of activated lineages,
| (33) |
and the total number of activated lineages, . Two activation regimes emerge:
Low-specificity (LS) regime.
In this regime, the specificity of activation is limited by the number of proofreading steps. According to Eq. (20), the function is strongly peaked at a value defined by the condition [see Fig. 3(a)]. Integrating this function yields the expected number of activated lineages at time ,
| (34) | |||||
where is given by the condition .
High-specificity (HS) regime.
In this regime, the specificity of activation is limited by the complexity of the naive repertoire. According to Eq. (23), the function is peaked around the moving front, [see Fig. 3(b)]. In this case, we obtain
| (35) | |||||
| (36) |
Here we use Eqs. (28) and (24), and we note that the integrand in (35) has a peak value of order 1 and depends only weakly on .
These results are given in Eqs. (7) and (8) of the main text. In the activation dynamics discussed here, we assume that genetically distinct B cell lineages are also distinguishable in terms of their antigen binding affinity. Specifically, in our energy models, random mutations generate a binding energy change of order . If the sequence-energy map is highly degenerate, multiple activations occurring in sequence clusters of very similar antigen affinity can generate new scaling regimes.
Statistics of clone size.
Here we compute the cumulative distribution function (CDF) of clone size, , which is defined as the fraction of activated clones with size at time . Given exponential growth with rate , this function is given by the fraction of lineages activated before a time ,
| (37) |
Using Eqs. (34) and (36), we obtain
| (38) |
where the exponent is defined in Eq. (10) of the main text. In a similar way, we compute the expected size of the -th largest clone, (). We write , where the activation time is given by the condition . Using again Eqs. (34) and (36), we have and
| (39) |
Equations (38) and (39) are related by Zipf’s law. Both are independent of and, hence, valid also for the saturation clone sizes, , as used in Eq. (11) of the main text.
In the special case of a classical Luria-Delbrück proliferation-mutation process, denotes the number of mutant clones present at time , and Eqs. (34) and (36) reduce to the simpler form , where is the wild-type growth rate. The resulting clone size statistics is still of the form (38) and (39) with size exponent , where is the mutant growth rate.
Empirical clone size statistics in early germinal centers.
We analyze sequencing data of early germinal centers (GCs) from Tas et al. [11] as a proxy for the initial population of activated B cell clones. We use CDR3 sequence counts to estimate the clone size of the different B cell lineages taking part in the response. The dataset contains samples from 6 dissected lymph nodes, each of which contains 2 GCs. We calculate the expected scaled clone size of the -th largest clone found in each lymph node, [thin lines in Fig. 4(a), insert] and the average value over all 6 lymph nodes [thick line in Fig. 4(a), insert]. We also calculate the clonal entropy with and (the sum runs over all clones in the dataset).
Statistics of antigen affinity.
We now evaluate the CDF of antigen binding constants, , in the HS regime. For the high-affinity tail of this function, , activation occurs deterministically, which implies . Recalling that , we obtain . Hence,
| (40) |
Using Zipf’s law, as for the clone size, we obtain the expectation value of the -th lowest binding constant,
| (41) |
as given in Eq. (11) of the main text. Again, this relation is independent of and valid also at the saturation point. Because activation occurs on the moving front , the clone rankings by size and affinity are equivalent up to fluctuations. Hence, by combining Eqs. (39) and (41), we obtain a power law relating size and affinity
| (42) |
In the LS regime, there is no clear power law relation between affinity and rank [see Fig. 4(b)]. High-affinity activated clones span the range between and and show a faster decline of affinity with rank than in the HS regime [see Figs. 4(b) and 4(c)]. Hence, empirical exponents fitted to affinity-rank data take values [see Fig. 4(d)].
Potency statistics and elite neutralisers.
In the HS regime, Eqs. (39) and (41) also determine the statistics of single-clone potencies ,
| (43) |
For typical individuals, many clones contribute to the total potency . However, a characteristic of Luria-Delbrück-Delbrück models is the existence of giant fluctuations. In the HS regime of the model proposed here, there is a set of elite neutralisers singled out by early activation of their first clone. These “jackpot” clones have simultaneously high affinity and large size, which takes a sizeable fraction of the total activated repertoire, [see Fig. 5(c)]. The CDF of potency, , is defined as the fraction of individuals with . For , potency is dominated by jackpot clones, . We find two scaling regimes [see Fig. S3(c)]. In the pre-asymptotic regime (), size fluctuations of the jackpot clone are dominant, and we can write . Hence, by Eq. (38), the CDF of potency takes the form
| (44) |
In the asymptotic regime (), affinity fluctuations are dominant, and we have . Hence,
| (45) |
Appendix C Model parameters and numerical simulations
In the analytical and numerical analysis, we use the following empirical parameters for the activation process and the B cell repertoire: (i) Size of the naive repertoire: lineages [2, 4, 3, 1]. (ii) Growth rate of the antigen population: [5, 6, 7, 8]. (iii) Proliferation rate of activated B cells: [32]. (iv) Activation step rate: . As discussed in the main text, this value is tuned to a repertoire size . (v) Antigen-BCR diffusion-limited association rate, [31]. (vi) Carrying capacity of activated B cells: cells [32]. In the optimality analysis of tuned repertoires [see Fig. S4], we vary , , and around the LS-HS crossover point given by , .
To simulate a primary B cell response, we start by creating an initial population of B cell lineages. Each B cell lineage is represented by a BCR sequence of length , randomly drawn with the set of 20 amino acids. Assuming a deterministic expanding antigen concentration as defined in the main text, we calculate the non-homogeneous activation rate of each B cell lineage, , as given in Eq. 17. Here we use the fact that the time for the first event, , in a non-homogeneous Poisson process with rate is distributed according to
| (46) |
with . We sample then the activation time of each B cell lineage by sampling uniformly distributed random numbers and then using the inverse of the cumulative version of Eq. 46. Once we have all activation times, we proceed to determine the clone size of each of the B cell clones. Here we integrate coupled differential equations
| (47) |
assuming all clones start with clone size . We neglect all B cell clones whose final clone size is smaller than , corresponding to less than one cell division.
References
- Altan-Bonnet et al. [2020] G. Altan-Bonnet, T. Mora, and A. M. Walczak, Quantitative immunology for physicists, Physics Reports 849, 1 (2020).
- Glanville et al. [2009] J. Glanville, W. Zhai, J. Berka, D. Telman, G. Huerta, G. R. Mehta, I. Ni, L. Mei, P. D. Sundar, G. M. Day, D. Cox, A. Rajpal, and J. Pons, Precise determination of the diversity of a combinatorial antibody library gives insight into the human immunoglobulin repertoire, Proceedings of the National Academy of Sciences of the United States of America 106, 20216 (2009).
- Elhanati et al. [2015] Y. Elhanati, Z. Sethna, Q. Marcou, C. G. Callan, T. Mora, and A. M. Walczak, Inferring processes underlying b-cell repertoire diversity, Philosophical Transactions of the Royal Society B: Biological Sciences 370, 10.1098/rstb.2014.0243 (2015).
- Morbach et al. [2010] H. Morbach, E. M. Eichhorn, J. G. Liese, and H. J. Girschick, Reference values for b cell subpopulations from infancy to adulthood, Clinical and Experimental Immunology 162, 271 (2010).
- Smith et al. [2010] A. M. Smith, F. R. Adler, and A. S. Perelson, An accurate two-phase approximate solution to an acute viral infection model, Journal of Mathematical Biology 60, 711 (2010).
- Pawelek et al. [2012] K. A. Pawelek, G. T. Huynh, M. Quinlivan, A. Cullinane, L. Rong, and A. S. Perelson, Modeling within-host dynamics of influenza virus infection including immune responses, PLoS Computational Biology 8, 1 (2012).
- Goyal et al. [2021] A. Goyal, D. B. Reeves, E. F. Cardozo-Ojeda, J. T. Schiffer, and B. T. Mayer, Viral load and contact heterogeneity predict sars-cov-2 transmission and super-spreading events, eLife 10, 1 (2021).
- Sender et al. [2021] R. Sender, Y. M. Bar-On, S. Gleizer, B. Bernshtein, A. Flamholz, R. Phillips, and R. Milo, The total number and mass of sars-cov-2 virions, Proceedings of the National Academy of Sciences of the United States of America 118, 1 (2021).
- Goodnow et al. [2010] C. C. Goodnow, C. G. Vinuesa, K. L. Randall, F. MacKay, and R. Brink, Control systems and decision making for antibody production, Nature Immunology 11, 681 (2010).
- Lam and Baumgarth [2019] J. H. Lam and N. Baumgarth, The multifaceted b cell response to influenza virus, The Journal of Immunology 202, 352 (2019).
- Tas et al. [2016] J. M. Tas, L. Mesin, G. Pasqual, S. Targ, J. T. Jacobsen, Y. M. Mano, C. S. Chen, J. C. Weill, C. A. Reynaud, E. P. Browne, M. Meyer-Hermann, and G. D. Victora, Visualizing antibody affinity maturation in germinal centers, Science 351, 1048 (2016).
- Cancro et al. [1979] M. P. Cancro, W. Gerhard, and N. R. Klinman, The diversity of the influenza-specific primary b-cell repertoire in balb/c mice*, Journal of Experimental Medicine 147, 6577 (1979).
- Perelson and Oster [1979] A. S. Perelson and G. F. Oster, Theoretical studies of clonal selection: Minimal antibody repertoire size and reliability of self-non-self discrimination, Journal of Theoretical Biology 81, 645 (1979).
- Hopfield [1974] J. J. Hopfield, Kinetic proofreading: a new mechanism for reducing errors in biosynthetic processes requiring high specificity, Proceedings of the National Academy of Sciences of the United States of America 71, 4135 (1974).
- Ninio [1975] J. Ninio, Kinetic amplification of enzyme discrimination, Biochimie 57, 587 (1975).
- Mckeithan [1995] T. W. Mckeithan, Kinetic proofreading in t-cell receptor signal transduction, Proceedings of the National Academy of Sciences of the United States of America 92, 5042 (1995).
- Gromadski and Rodnina [2004] K. B. Gromadski and M. V. Rodnina, Kinetic determinants of high-fidelity trna discrimination on the ribosome, Molecular Cell 13, 191 (2004).
- Johansson et al. [2012] M. Johansson, J. Zhang, and M. Ehrenberg, Genetic code translation displays a linear trade-off between efficiency and accuracy of trna selection, Proceedings of the National Academy of Sciences 109, 131 (2012), https://www.pnas.org/doi/pdf/10.1073/pnas.1116480109 .
- Goldstein et al. [2004] B. Goldstein, J. R. Faeder, and W. S. Hlavacek, Mathematical and computational models of immune-receptor signalling, Nature Reviews Immunology 4, 445 (2004).
- François et al. [2013] P. François, G. Voisinne, E. D. Siggia, G. Altan-Bonnet, and M. Vergassola, Phenotypic model for early t-cell activation displaying sensitivity, specificity, and antagonism, Proceedings of the National Academy of Sciences of the United States of America 110, E888 (2013).
- Pettmann et al. [2021] J. Pettmann, A. Huhn, E. A. Shah, M. A. Kutuzov, D. B. Wilson, M. L. Dustin, S. J. Davis, P. A. van der Merwe, and O. Dushek, The discriminatory power of the t cell receptor, eLife 10, 1 (2021).
- Tsourkas et al. [2012] P. K. Tsourkas, W. Liu, S. C. Das, S. K. Pierce, and S. Raychaudhuri, Discrimination of membrane antigen affinity by b cells requires dominance of kinetic proofreading over serial engagement, Cellular and Molecular Immunology 9, 62 (2012).
- Harwood and Batista [2008] N. E. Harwood and F. D. Batista, New insights into the early molecular events underlying b cell activation, Immunity 28, 609 (2008).
- Butler et al. [2013] T. C. Butler, M. Kardar, and A. K. Chakraborty, Quorum sensing allows t cells to discriminate between self and nonself, Proceedings of the National Academy of Sciences of the United States of America 110, 11833 (2013).
- Jiang and Wang [2023] H. Jiang and S. Wang, Molecular tug of war reveals adaptive potential of an immune cell repertoire, Phys. Rev. X 13, 021022 (2023).
- Luria and Delbrück [1943] S. E. Luria and M. Delbrück, Mutations of bacteria from virus sensitivity to virus resistance, Genetics 28, 491 (1943).
- Lea and Coulson [1949] D. E. Lea and C. A. Coulson, The distribution of the numbers of mutants in bacterial populations, Journal of Genetics 49, 264 (1949).
- Mandelbrot [1974] B. Mandelbrot, A population birth-and-mutation process, i: explicit distributions for the number of mutants in an old culture of bacteria, Journal of Applied Probability 11, 437 (1974).
- Kessler and Levine [2013] D. A. Kessler and H. Levine, Large population solution of the stochastic luria-delbruck evolution model, Proceedings of the National Academy of Sciences of the United States of America 110, 11682 (2013).
- Zheng [1999] Q. Zheng, Progress of a half century in the study of the luria–delbrück distribution, Mathematical Biosciences 162, 1 (1999).
- Pecht et al. [1972] I. Pecht, D. Givol, and M. Sela, Dynamics of hapten-antibody interaction. studies on a myeloma protein with anti-2, 4-dinitrophenyl specificity, Journal of Molecular Biology 68, 241 (1972).
- Bocharov and Romanyukha [1994] G. A. Bocharov and A. A. Romanyukha, Mathematical model of antiviral immune response iii. influenza a virus infection, Journal of Theoretical Biology 167, 323 (1994).
- Schwickert et al. [2011] T. A. Schwickert, G. D. Victora, D. R. Fooksman, A. O. Kamphorst, M. R. Mugnier, A. D. Gitlin, and M. L. Nussenzweig, A dynamic t cell-limited checkpoint regulates affinity-dependent b cell entry into the germinal center, Journal of Experimental Medicine 208, 1243 (2011).
- Karnaukhov et al. [2023] V. K. Karnaukhov, D. S. Shcherbinin, A. O. Chugunov, D. M. Chudakov, R. G. Efremov, I. V. Zvyagin, and M. Shugay, Tcren: predicting tcr recognition of unseen epitopes based on residue-level pairwise statistical potential, bioRxiv 10.1101/2022.02.15.480516 (2023).
- Miyazawa and Jernigan [1996] S. Miyazawa and R. L. Jernigan, Residue-residue potentials with a favorable contact pair term and an unfavorable high packing density term, for simulation and threading, Journal of Molecular Biology 256, 623 (1996).
- Eisen [2014] H. N. Eisen, Affinity enhancement of antibodies: how low-affinity antibodies produced early in immune responses are followed by high-affinity antibodies later and in memory b-cell responses, Cancer immunology research 2, 381 (2014).
- Weinstein et al. [2009] J. A. Weinstein, N. Jiang, R. A. White, D. S. Fisher, and S. R. Quake, High-throughput sequencing of the zebrafish antibody repertoire, Science 324, 807 (2009).
- Desponds et al. [2016] J. Desponds, T. Mora, and A. M. Walczak, Fluctuating fitness shapes the clone-size distribution of immune repertoires, Proceedings of the National Academy of Sciences of the United States of America 113, 274 (2016).
- Chardès et al. [2022] V. Chardès, M. Vergassola, A. M. Walczak, and T. Mora, Affinity maturation for an optimal balance between long-term immune coverage and short-term resource constraints, Proceedings of the National Academy of Sciences of the United States of America 119, 1 (2022).
- Shinnakasu et al. [2016] R. Shinnakasu, T. Inoue, K. Kometani, S. Moriyama, Y. Adachi, M. Nakayama, Y. Takahashi, H. Fukuyama, T. Okada, and T. Kurosaki, Regulated selection of germinal-center cells into the memory b cell compartment, Nature Immunology 17, 861 (2016).
- Briney et al. [2019] B. Briney, A. Inderbitzin, C. Joyce, and D. R. Burton, Commonality despite exceptional diversity in the baseline human antibody repertoire, Nature 566, 393 (2019).
- Viant et al. [2020] C. Viant, G. H. Weymar, A. Escolano, S. Chen, H. Hartweger, M. Cipolla, A. Gazumyan, and M. C. Nussenzweig, Antibody affinity shapes the choice between memory and germinal center b cell fates, Cell 183, 1298 (2020).
- Gibson et al. [2009] K. L. Gibson, Y. C. Wu, Y. Barnett, O. Duggan, R. Vaughan, E. Kondeatis, B. O. Nilsson, A. Wikby, D. Kipling, and D. K. Dunn-Walters, B-cell diversity decreases in old age and is correlated with poor health status, Aging Cell 8, 18 (2009).
- Weiskopf et al. [2009] D. Weiskopf, B. Weinberger, and B. Grubeck-Loebenstein, The aging of the immune system, Transplant International 22, 1041 (2009).
- Wang et al. [2014] C. Wang, Y. Liu, L. T. Xu, K. J. L. Jackson, K. M. Roskin, T. D. Pham, J. Laserson, E. L. Marshall, K. Seo, J.-Y. Lee, D. Furman, D. Koller, C. L. Dekker, M. M. Davis, A. Z. Fire, and S. D. Boyd, Effects of aging, cytomegalovirus infection, and ebv infection on human b cell repertoires, The Journal of Immunology 192, 603 (2014).
- Bradshaw et al. [2022] W. J. Bradshaw, M. Poeschla, A. Placzek, S. Kean, and D. R. Valenzano, Extensive age-dependent loss of antibody diversity in naturally short-lived turquoise killifish, eLife 11, 10.7554/ELIFE.65117 (2022).
- Doria-Rose et al. [2014] N. A. Doria-Rose, C. A. Schramm, J. Gorman, P. L. Moore, J. N. Bhiman, B. J. DeKosky, M. J. Ernandes, I. S. Georgiev, H. J. Kim, M. Pancera, R. P. Staupe, H. R. Altae-Tran, R. T. Bailer, E. T. Crooks, A. Cupo, A. Druz, N. J. Garrett, K. H. Hoi, R. Kong, M. K. Louder, N. S. Longo, K. McKee, M. Nonyane, S. O’Dell, R. S. Roark, R. S. Rudicell, S. D. Schmidt, D. J. Sheward, C. Soto, C. K. Wibmer, Y. Yang, Z. Zhang, J. C. Mullikin, J. M. Binley, R. W. Sanders, I. A. Wilson, J. P. Moore, A. B. Ward, G. Georgiou, C. Williamson, S. S. Karim, L. Morris, P. D. Kwong, L. Shapiro, and J. R. Mascola, Developmental pathway for potent v1v2-directed hiv-neutralizing antibodies, Nature 509, 55 (2014).
- Nourmohammad et al. [2016] A. Nourmohammad, J. Otwinowski, and J. B. Plotkin, Host-pathogen coevolution and the emergence of broadly neutralizing antibodies in chronic infections, PLoS Genetics 12, 1 (2016).
- Yan and Wang [2020] L. Yan and S. Wang, Shaping polyclonal responses via antigen-mediated antibody interference, iScience 23, 1 (2020).
- Hearty et al. [2012] S. Hearty, P. Leonard, and R. O’Kennedy, Measuring antibody–antigen binding kinetics using surface plasmon resonance, in Antibody Engineering: Methods and Protocols, Second Edition, edited by P. Chames (Humana Press, Totowa, NJ, 2012) pp. 411–442.
- Qi et al. [2001] S. Y. Qi, J. T. Groves, and A. K. Chakraborty, Synaptic pattern formation during cellular recognition, Proceedings of the National Academy of Sciences of the United States of America 98, 6548 (2001).
- Batista et al. [2001] F. D. Batista, D. Iber, and M. S. Neuberger, B cells acquire antigen from target cells after synapse formation, Nature 411, 489 (2001).
- Carrasco et al. [2004] Y. R. Carrasco, S. J. Fleire, T. Cameron, M. L. Dustin, and F. D. Batista, Lfa-1/icam-1 interaction lowers the threshold of b cell activation by facilitating b cell adhesion and synapse formation, Immunity 20, 589 (2004).
- Fleire et al. [2006] S. J. Fleire, J. P. Goldman, Y. R. Carrasco, M. Weber, D. Bray, and F. D. Batista, B cell ligand discrimination through a spreading and contraction response, Science 312, 738 (2006).
- Gonzalez et al. [2011] S. F. Gonzalez, S. E. Degn, L. A. Pitcher, M. Woodruff, B. A. Heesters, and M. C. Carroll, Trafficking of b cell antigen in lymph nodes, Annual Review of Immunology 29, 215 (2011).