Performance of Data Augmentation Methods for Brazilian Portuguese Text Classification
Abstract
Improving machine learning performance while increasing model generalization has been a constantly pursued goal by AI researchers. Data augmentation techniques are often used towards achieving this target, and most of its evaluation is made using English corpora. In this work, we took advantage of different existing data augmentation methods to analyze their performances applied to text classification problems using Brazilian Portuguese corpora. As a result, our analysis shows some putative improvements in using some of these techniques; however, it also suggests further exploitation of language bias and non-English text data scarcity.
1 Introduction
Text classification is a common and essential task in natural language processing (NLP). Much work has been done in the area. State-of-the-art results achieved high accuracy on several related tasks such as sentiment analysis (Thongtan and Phienthrakul, 2019; Jiang et al., 2020) and topic classification (Kesiraju et al., 2019; Meng et al., 2020). Still, high performance often depends on the size, quality, and perhaps most important, training data availability. Gathering data can quickly become a tedious assignment and it is especially challenging for non-English languages that likely have fewer resources since most current researches use English corpora. In such a scarce scenario, data augmentation techniques are even handier to deal with data. Data augmentation is already widely used in computer vision (Simard et al., 2012; Szegedy et al., 2015; Krizhevsky et al., 2017) and speech (Cui et al., 2015; Ko et al., 2015), where it boosts performance, especially on smaller datasets.
Text data augmentation techniques use various strategies such as applying a set of universal functions to quickly and easily introduce diversity in the dataset (Wei and Zou, 2019), generating new data by translating sentences into another language and back into English (Yu et al., 2018) (also referred to as "back translation"), using predictive language models for synonym replacement (Kobayashi, 2018), and others. Thus, implementation cost versus performance gain varies from technique to technique. Still, all of the methods rely on at least one kind of language resource, which may be a WordNet dictionary, a Word Embedding model, datasets with specific formats, or another type of dependency closely tied to a single language.
Most of these text augmentation techniques were originally developed using English corpora. However, some recent works extend their application scenarios using a specific technique on, whether various languages (Ciolino et al., 2021), or even Brazilian Portuguese corpora as evaluation language (Veríssimo and Costa, 2020; Venturott and Ciarelli, 2020). Each work uses distinct processes and datasets and, given some limitations, data augmentation improved their results.
In this paper, we revisit some different existing text augmentation methods, gathering and reconstructing the necessary resources to reproduce each technique. Then, by applying them to Brazilian Portuguese corpora, we attempt to expand and validate these techniques in a more generic way. Using McNemar’s statistical test to compare the classification models, we achieve a set of different results showing that text augmentation methods are particularly useful, although language-specific fine-tunings should be considered to ensure significant positive gains.
2 Experimental Setup
Initially, we cluster the text augmentation methods into three main groups: (1) Easy Data Augmentation (EDA): based on Wei and Zou (2019), it consists of a collection of four functions (synonym replacement, random insertion, random swap, and random deletion). The first two rely on a map of synonyms; in this case, we use the PPDB Portuguese paraphrase pack (available at http://paraphrase.org). For the other parameters of the technique, we use the same ones in the original paper. (2) Synonym (Syn): Many text augmentation methods are based on some kind of synonym or allonym replacement. They primarily use language models to effectively replace words to create diversity in the training set synthetically. Here we use the nlpaug} library\footnotehttps://github.com/makcedward/nlpaug to produce a pipeline of word replacement (sequential flow) that uses the PPDB Portuguese paraphrase pack, the Fasttext Portuguese Word Embedding model111https://fasttext.cc/docs/en/crawl-vectors.html (Grave et al., 2018), and the Portuguese BERT model222https://huggingface.co/neuralmind/bert-large-portuguese-cased (Souza et al., 2019). Combined, the three resources provide a smart replacement for similar words. We generate one new sentence per sample in the training set using this method. (3) Back translation (BT): many translation APIs are publicly available and free (up to reasonable usage). So for this method, we generate one sentence per sample in the training set using AWS Amazon Translate service, chosen for convenience (Microsoft and Google also offer that kind of API, where it is also possible to use pre-trained models to perform the "back translation" technique).
2.1 Benchmark Datasets
We conduct experiments on three public available Brazilian Portuguese text classification datasets: (1) Tweets: TweetSentBR (Brum and das Graças Volpe Nunes, 2017) is a corpus of 10,648 Tweets manually annotated in one of the three sentiment classes: Positive - the user meant a positive reaction or evaluation about the main topic on the post; Negative - the user meant a negative reaction or evaluation about the main topic on the post; Neutral - tweets not belonging to any of the last classes, usually not making a point, out of topic, irrelevant, confusing or containing only objective data. (2) B2W: B2W Open Product Reviews (available at https://github.com/b2wdigital/b2w-reviews01) consists of a binary classification corpus of 132,373 product reviews. The labels represent the willingness of the customer to recommend the product to someone else; and (3) Mercadolibre: Mercado Libre Data Challenge 2019 (available at https://ml-challenge.mercadolibre.com) is a corpus of 693,318 purchase histories where the goal is to predict the next item bought by the user. As demonstrated by Wei and Zou (2019), some text augmentation techniques have a more significant impact on smaller datasets; for that reason, we randomly resample the datasets into subsets with different sizes . For each subset , we use a 75% train split rate. Also, we use different percentages of the train set in the augmentation process. Finally, we run 15 rounds of the whole experiment for each dataset, totaling 2,700 trained models (3 datasets X 3 augmentation groups X 5 subset sizes X 4 augmentation percentages X 15 rounds).
2.2 Text Classification Models
Due to a large number of models, we opted to use non-deep-learning classifiers to perform the benchmark based on their ease of use and usually faster training. Many popular algorithms for text classification are not based on neural networks; one of the most prominent is the Support Vector Machine (SVM) algorithm (Kowsari et al., 2019).
We use the sci-kit-learn library333https://scikit-learn.org/stable/modules/generated/sklearn.svm.SVC.html#sklearn.svm.SVC implementation of SVM with C=10}, \mintinlinePythonkernel=rbf, and gamma=scale} for all trained models (other parameters set to default). As the featurizer, we use the Fasttext Portuguese Word Embedding model\footnotehttps://fasttext.cc/docs/en/crawl-vectors.html (Grave et al., 2018) to extract the sentence vector for each sample.
2.3 Model Evaluation
We use the F1-score (weighted F1-score for multi-label datasets) as the evaluation metric. The F1-score is the harmonic mean of precision and recall, and it was applied as a filter, leaving only the best 180 models for each experiment round and parameter combination. After the models’ filtering, we use the F1-score of each baseline model () to compute the model gain, i.e. the difference between the baseline F1-score and the F1-score of each augmented model (). Also, to determine if a model’s performance is significantly different, we use the continuity-corrected version of McNemar’s test. This nonparametric statistical method is used on paired nominal data and has been used to confront NLP models (Jiang et al., 2021; Chen et al., 2021).
3 Results
All details regarding baseline F1-scores, F1-score gains and -values can be found in Appendices A, B and C, respectively.
3.1 Tweets Dataset
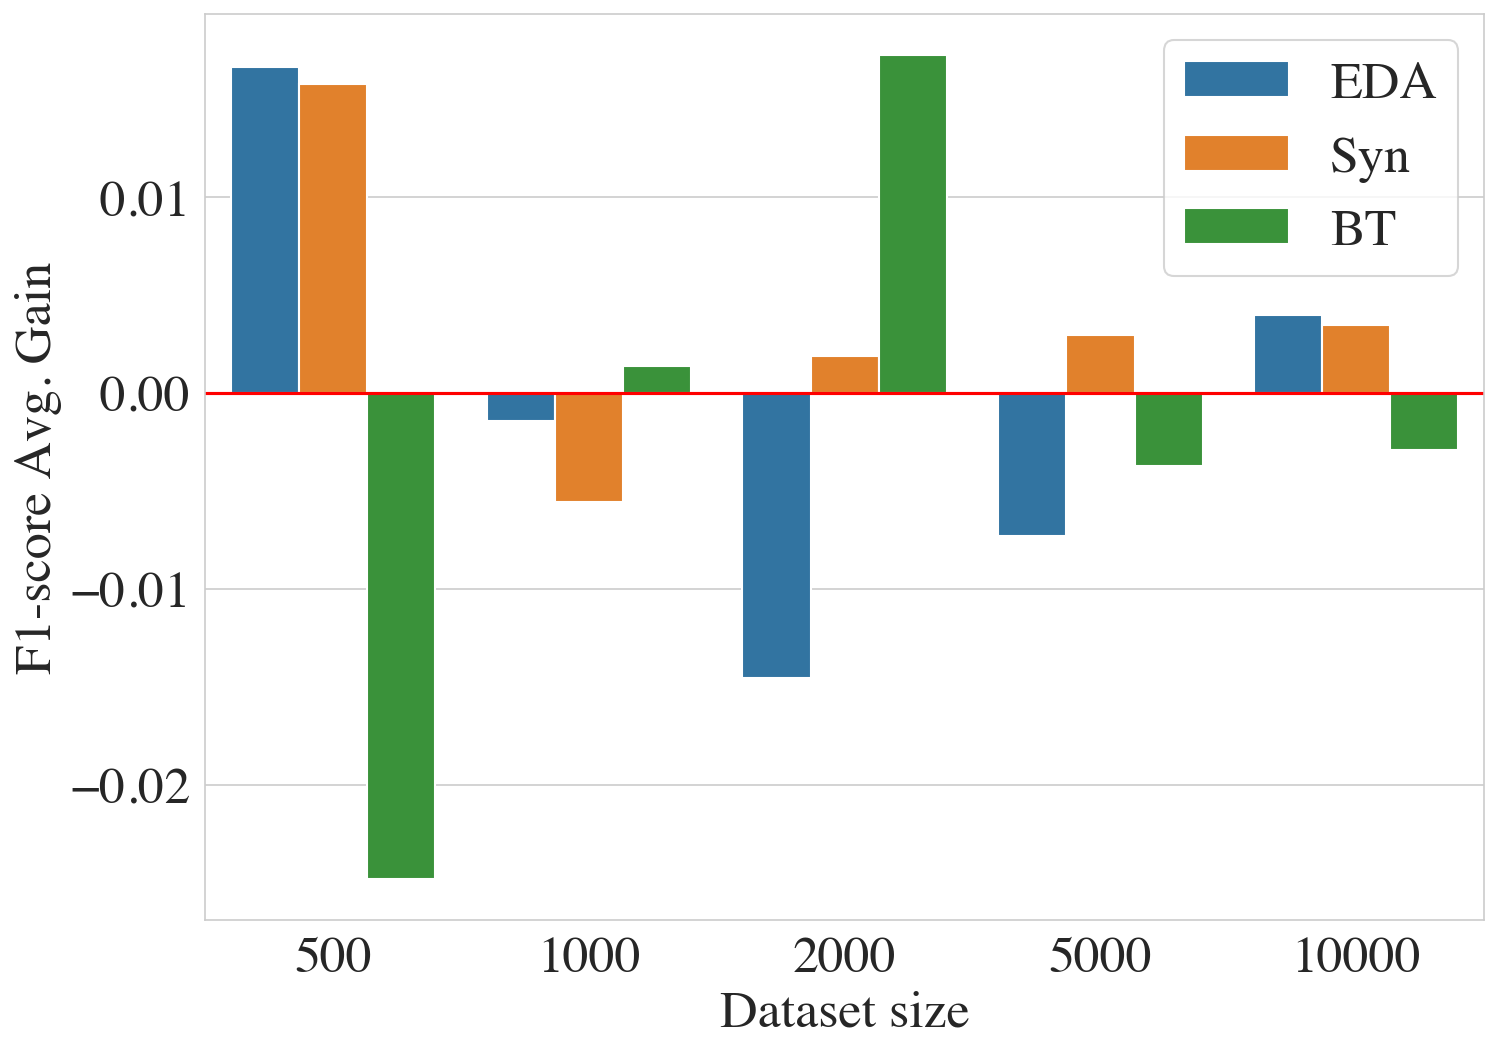
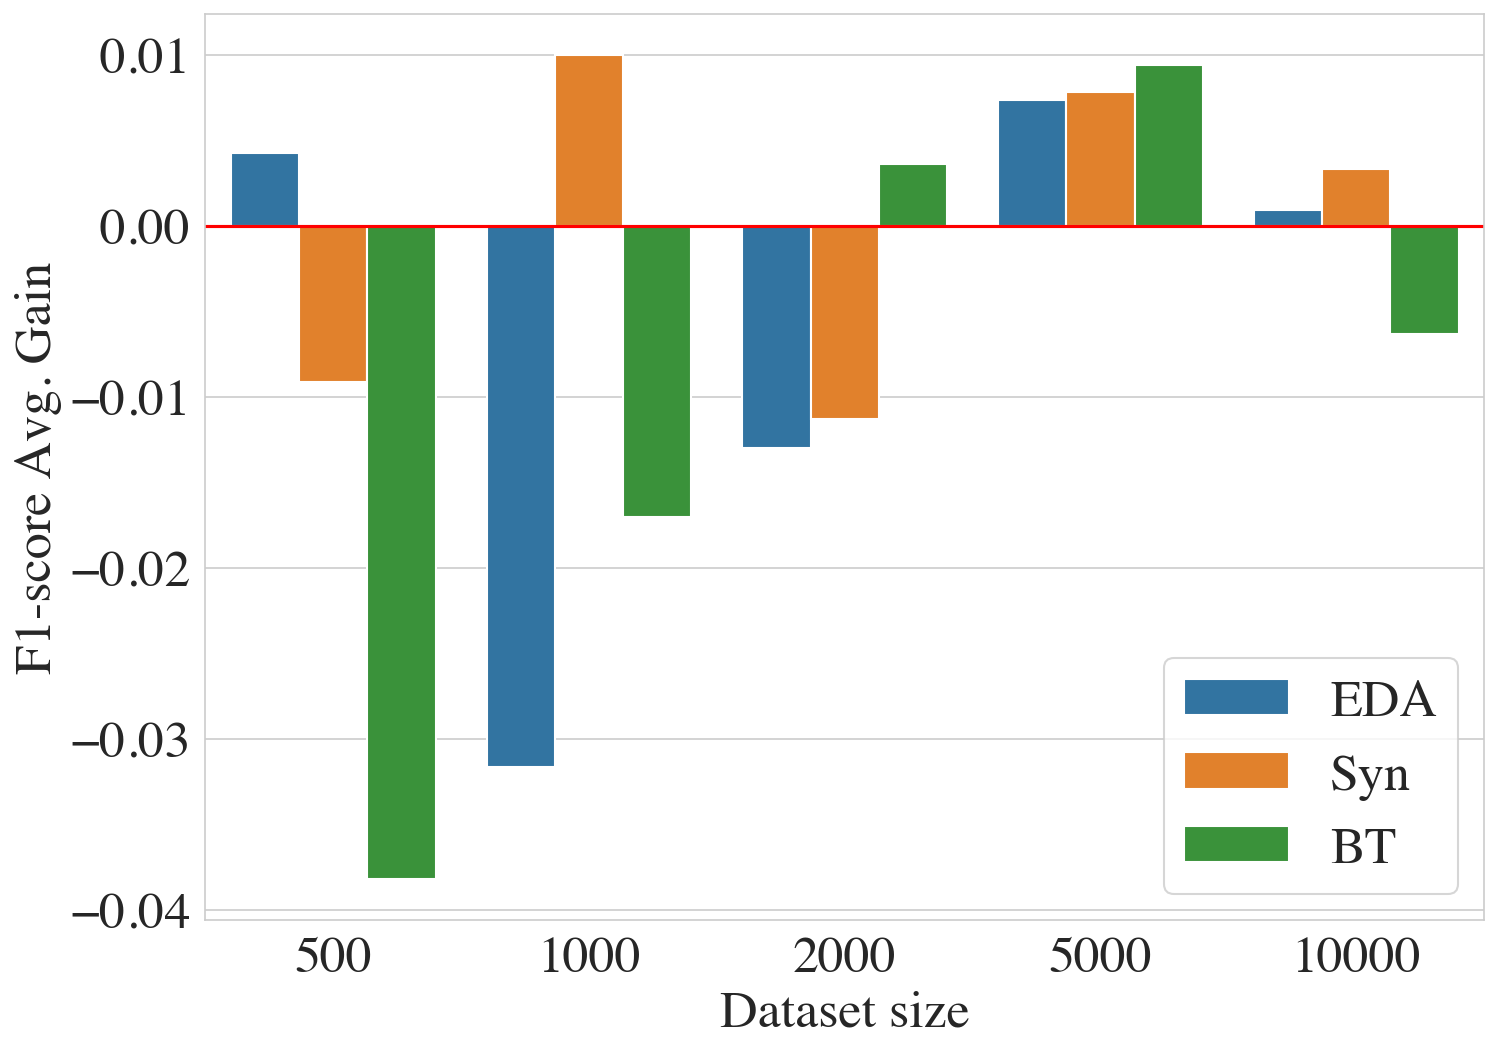
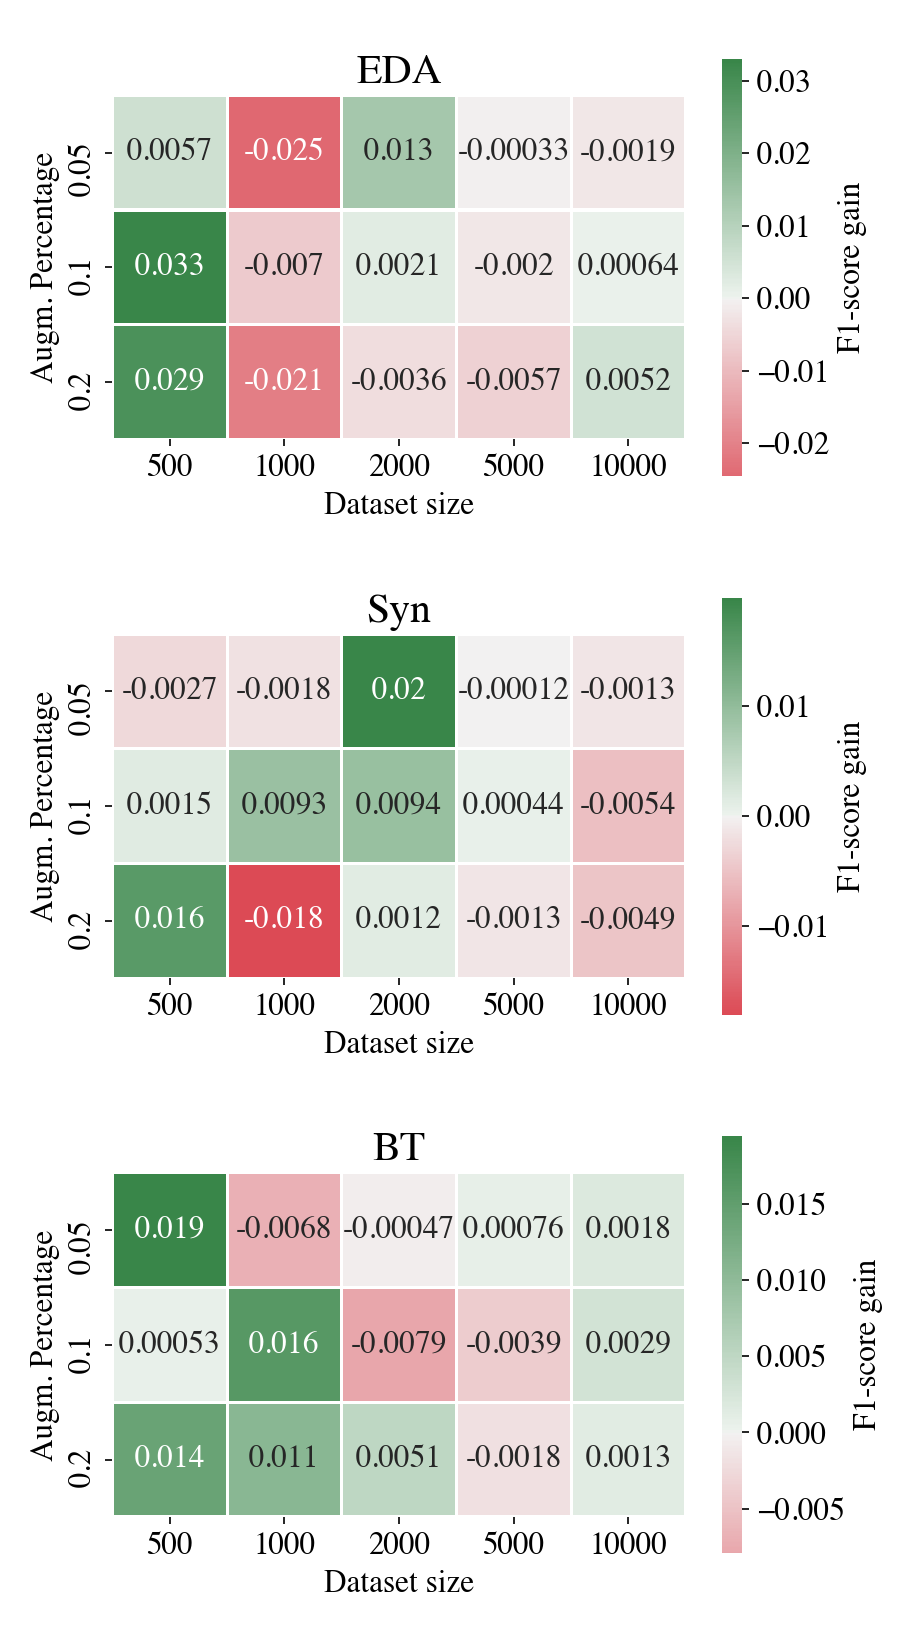
As a result of the Tweets dataset analysis, the highest F1-score gains were obtained on the smallest dataset subset for EDA and Syn augmentation groups. Figure 1 shows the F1-score average gains for each augmentation group.
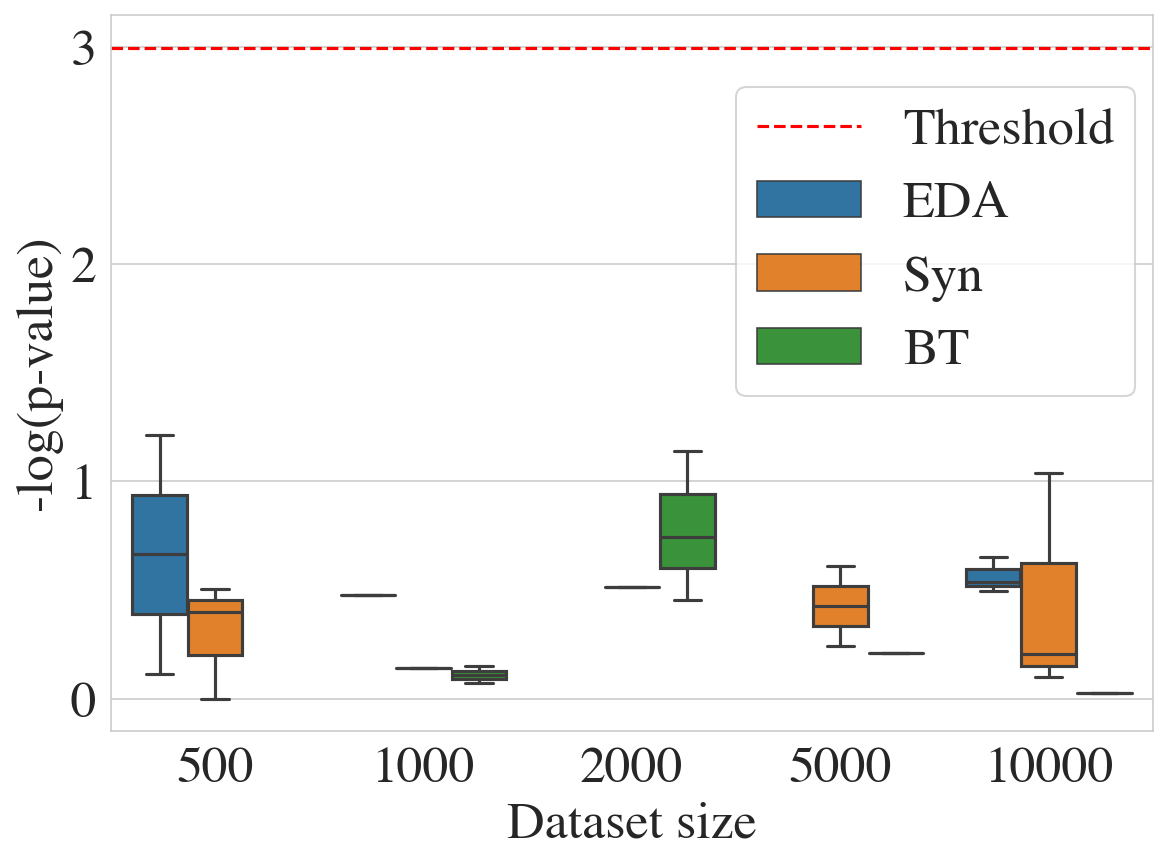
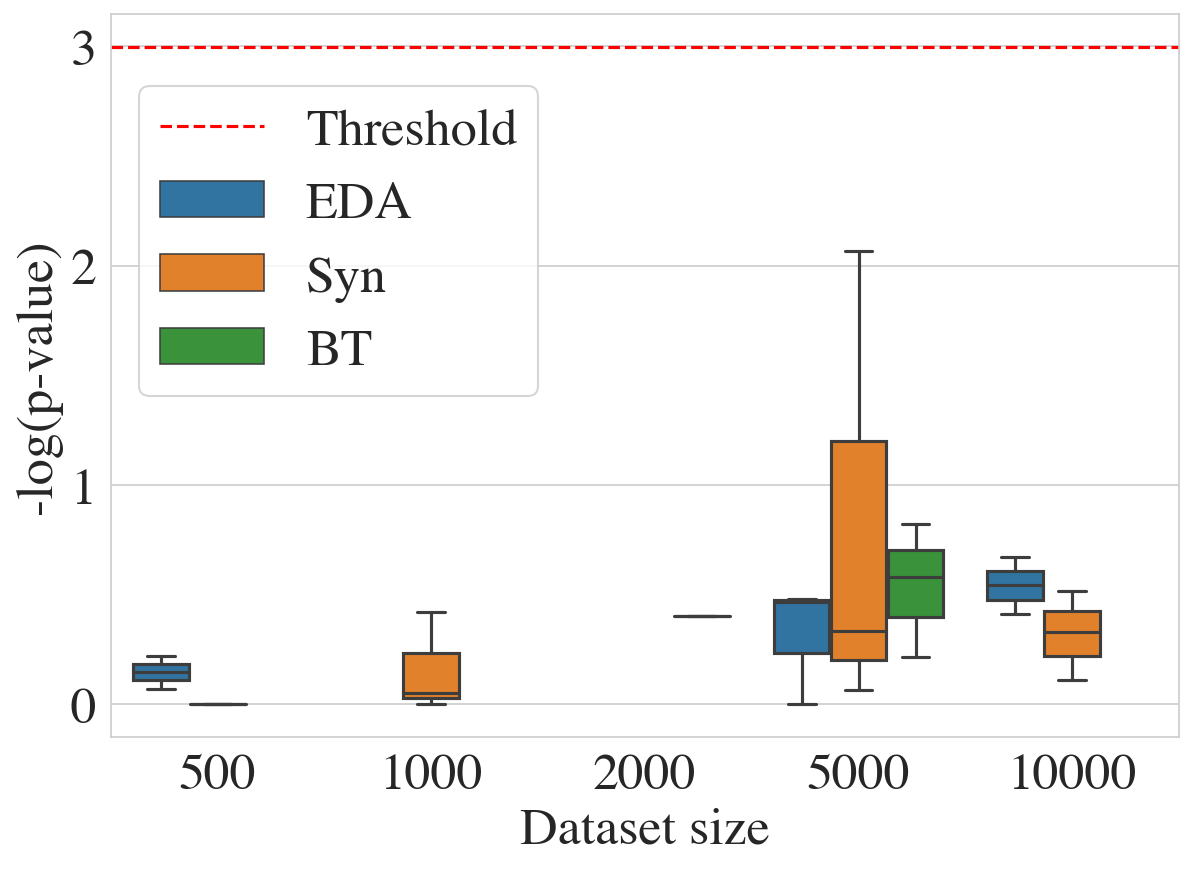
McNemar’s test results show no significant difference between baseline models and augmented models (-value < 0.05). The test was applied only in positive F1-score gain models and is depicted in Figure 2.
3.2 B2W Dataset
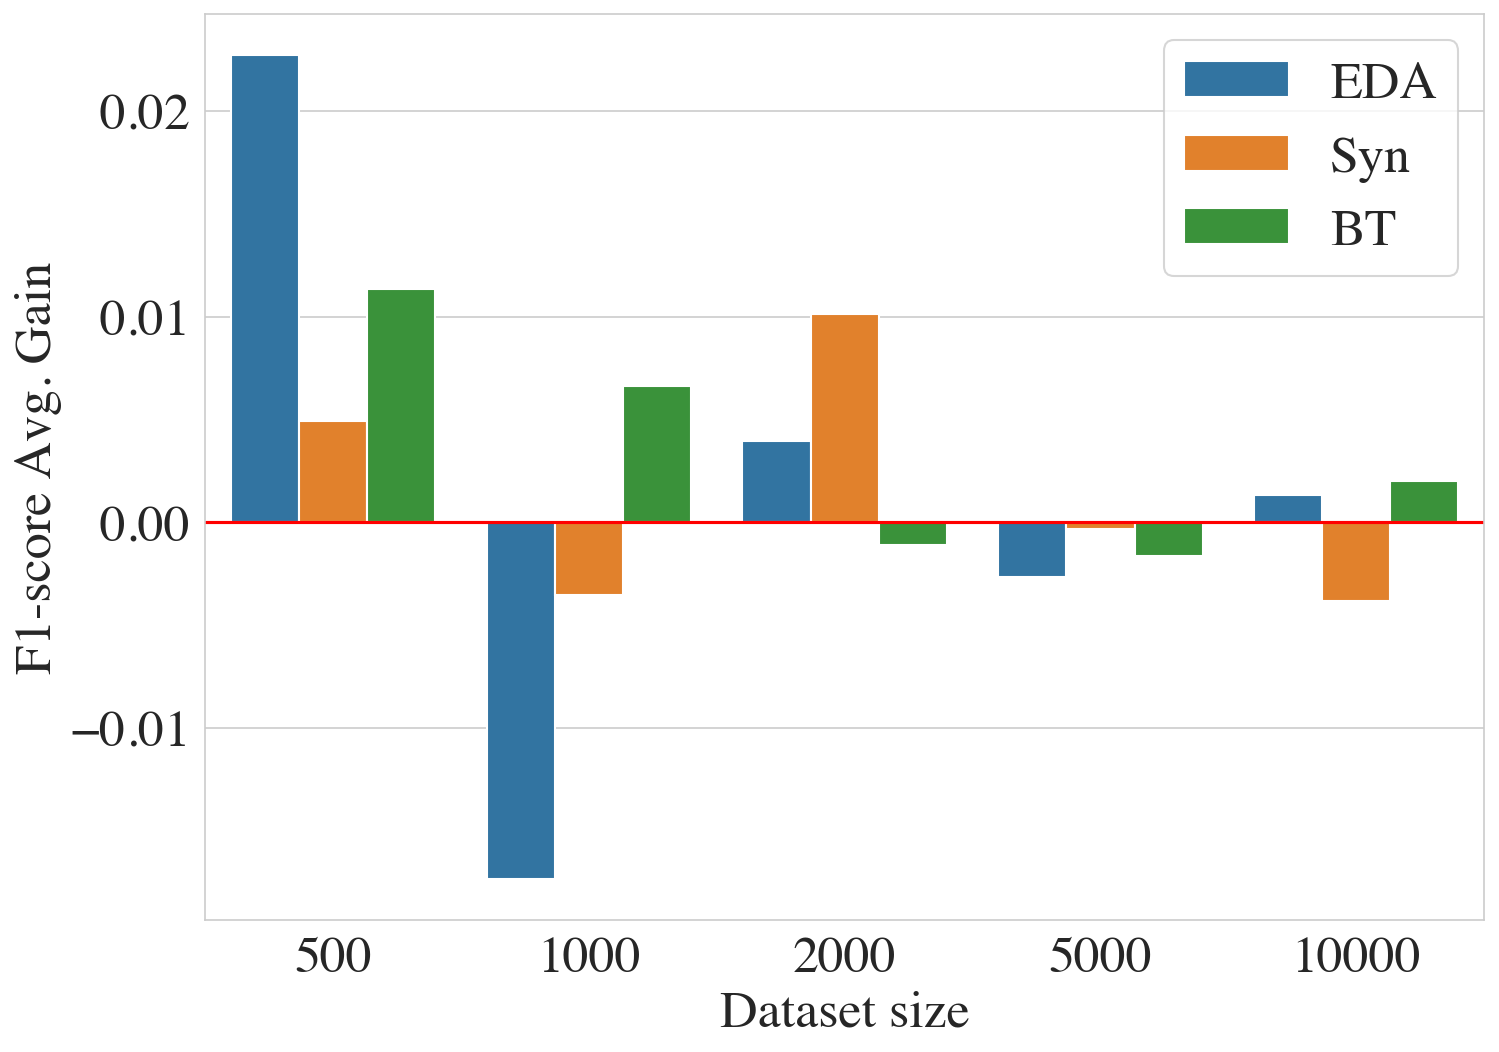
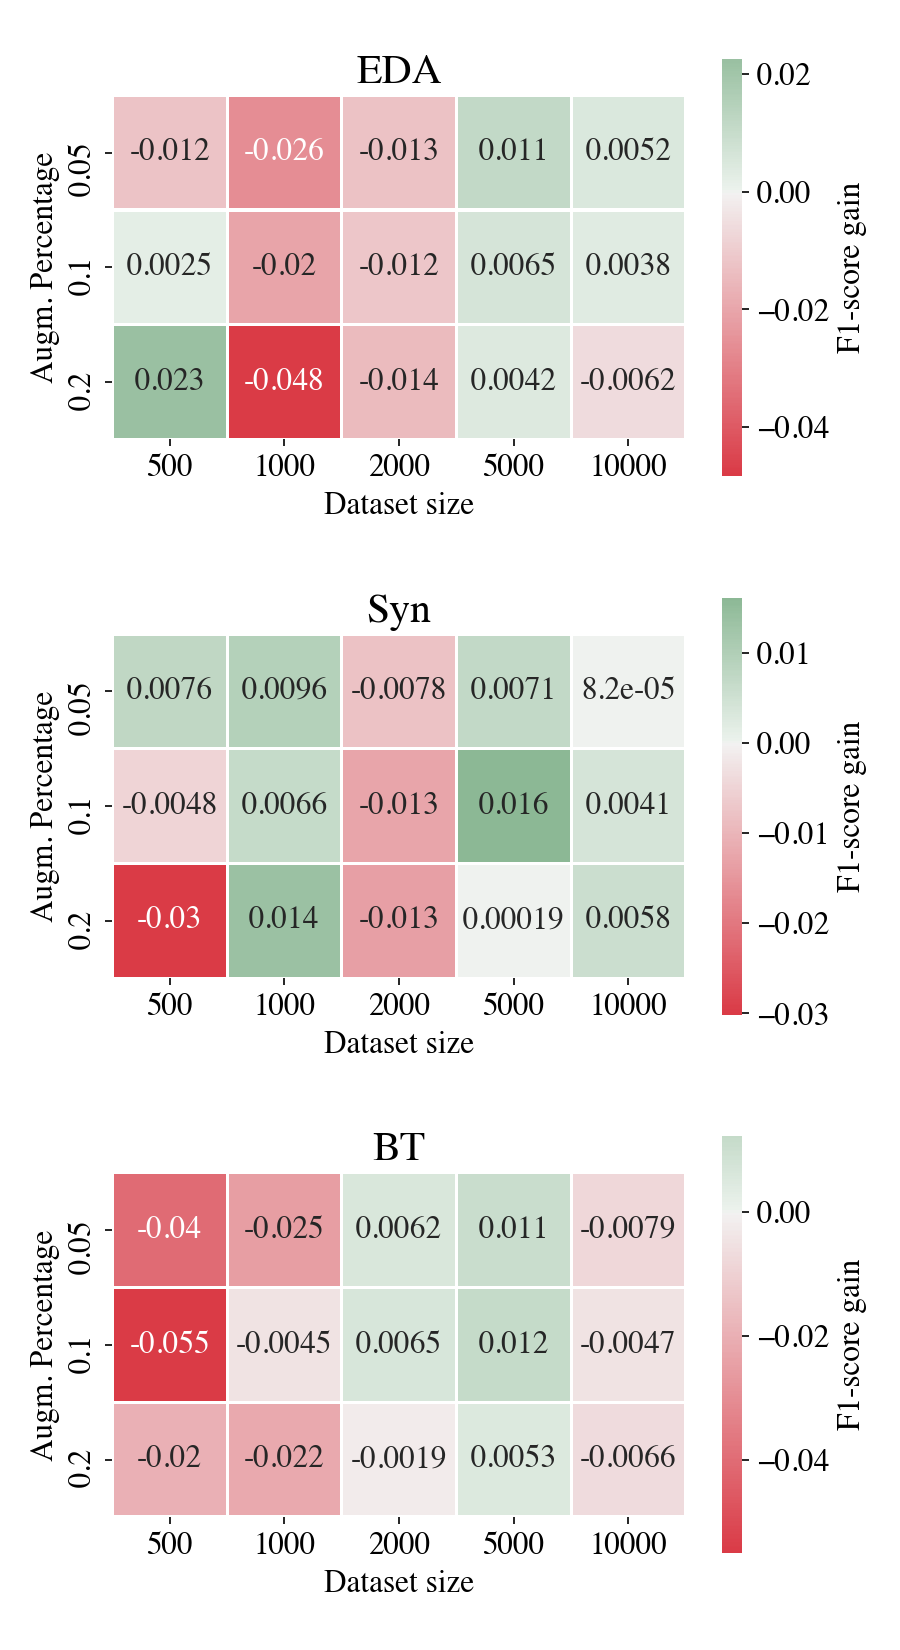
As with Tweets, the analysis of the B2W dataset resulted in the highest F1-score gain belonging to the EDA augmentation group. Also, the dataset subsets sizes that achieved the best results were 500 and 2000. Likewise, the same pattern was observed in the Tweets dataset. Figure 3 shows the F1-score average gains for each augmentation group.
The statistical significance analysis was applied following the same scheme as the Tweets dataset. Figure 4 shows the positive gain models’ -values.
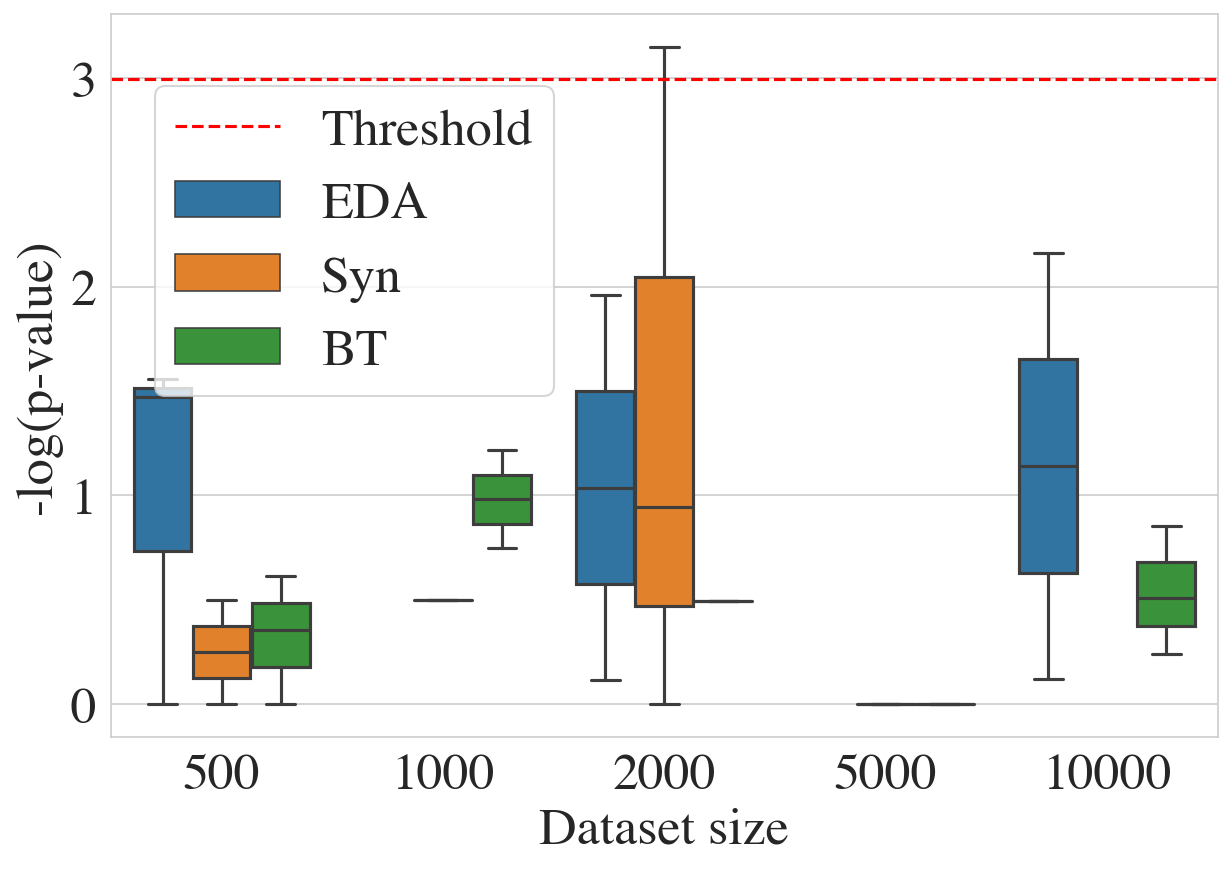
The B2W dataset analysis resulted in a significant model, as shown in Figure 4. This best model, trained with a subset size 2000 and 0.05 augmentation, reached a -value of 0.042957.
3.3 Mercado Libre Dataset
Finally, in the Mercado Libre dataset, the EDA augmentation group still achieved the best F1-score gain. Figure 5 shows the F1-score average gain for each group.
All positive F1-score gains p-values resulting from McNemar’s test are depicted in Figure 6.
Although no significant text classification model was found (Figure 6), the dataset subset size 5000 models obtained a satisfactory performance.
3.4 Augmentation Group Performance
Combining all results across the three augmentation groups, Figure 7 shows the F1-score gains for each dataset subset size.
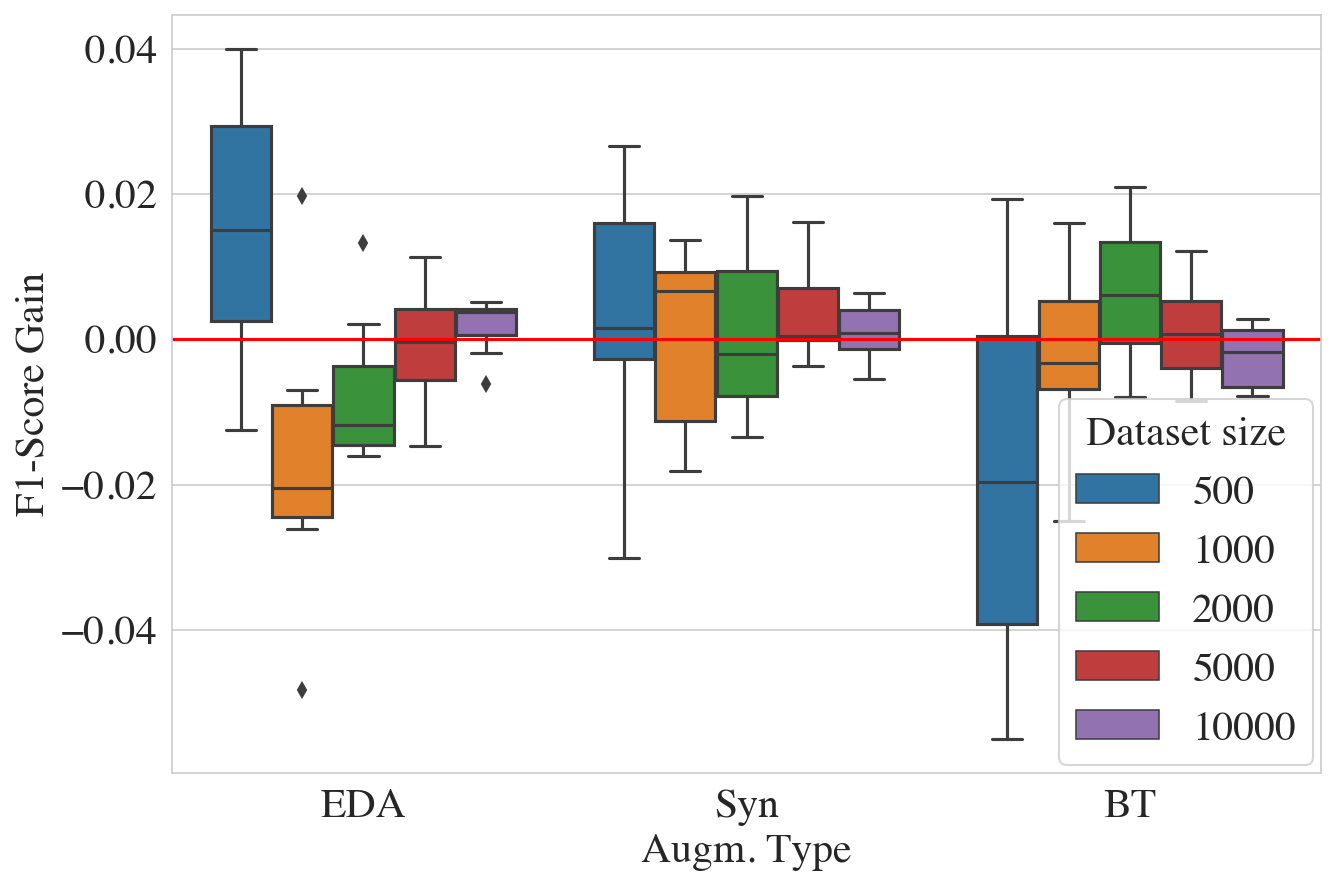
The Syn augmentation group achieved the best overall performance, as shown in Figure 7.
4 Conclusions
We grouped and compared three different text augmentation techniques that have been reported as significant additions to solving text classification tasks. Initially developed using English corpora, we applied these techniques using Brazilian Portuguese publicly available language resources. We trained 2,700 text classification models using three different datasets. For each dataset, the models were generated using combinations of the following attributes: dataset subset size, percentage of augmentation, and the group of augmentation technique. Comparing augmented and non-augmented best models, our analysis showed a slight upward trend in the F1 score gain, although no expressive statistical significance was found. This result might be caused by the model choice, i.e. the SVM is considered a low-sensitive method regarding the train set size; and by the nature of the datasets, i.e. the colloquialism inherent in the Tweets texts and a large number of targets in the Mercado Libre classification task, adding noise to the trained models. Also, since all the augmentation techniques were developed using English corpora, some putative language dependency might occur, biasing the final results. In future work, we are planning to adjust the model choice and expand the analysis on the Brazilian Portuguese language. Besides, in order to increase the available Brazilian Portuguese data volume, we are planning to curate and annotate a new corpus.
References
- Brum and das Graças Volpe Nunes (2017) Henrico Bertini Brum and Maria das Graças Volpe Nunes. 2017. Building a sentiment corpus of tweets in brazilian portuguese.
- Chen et al. (2021) Timothy L. Chen, Max Emerling, Gunvant R. Chaudhari, Yeshwant R. Chillakuru, Youngho Seo, Thienkhai H. Vu, and Jae Ho Sohn. 2021. Domain specific word embeddings for natural language processing in radiology. Journal of Biomedical Informatics, 113:103665.
- Ciolino et al. (2021) Matthew Ciolino, David Noever, and Josh Kalin. 2021. Multilingual augmenter: The model chooses.
- Cui et al. (2015) Xiaodong Cui, Vaibhava Goel, and Brian Kingsbury. 2015. Data augmentation for deep neural network acoustic modeling. IEEE/ACM Transactions on Audio, Speech, and Language Processing, 23(9):1469–1477.
- Grave et al. (2018) Edouard Grave, Piotr Bojanowski, Prakhar Gupta, Armand Joulin, and Tomas Mikolov. 2018. Learning word vectors for 157 languages. In Proceedings of the International Conference on Language Resources and Evaluation (LREC 2018).
- Jiang et al. (2020) Haoming Jiang, Pengcheng He, Weizhu Chen, Xiaodong Liu, Jianfeng Gao, and Tuo Zhao. 2020. SMART: Robust and efficient fine-tuning for pre-trained natural language models through principled regularized optimization. In Proceedings of the 58th Annual Meeting of the Association for Computational Linguistics, pages 2177–2190, Online. Association for Computational Linguistics.
- Jiang et al. (2021) Tao Jiang, Jian Ping Li, Amin Ul Haq, Abdus Saboor, and Amjad Ali. 2021. A novel stacking approach for accurate detection of fake news. IEEE Access, 9:22626–22639.
- Kesiraju et al. (2019) Santosh Kesiraju, Oldřich Plchot, Lukáš Burget, and Suryakanth V Gangashetty. 2019. Learning document embeddings along with their uncertainties.
- Ko et al. (2015) T. Ko, Vijayaditya Peddinti, D. Povey, and S. Khudanpur. 2015. Audio augmentation for speech recognition. In INTERSPEECH.
- Kobayashi (2018) Sosuke Kobayashi. 2018. Contextual augmentation: Data augmentation by words with paradigmatic relations. In Proceedings of the 2018 Conference of the North American Chapter of the Association for Computational Linguistics: Human Language Technologies, Volume 2 (Short Papers). Association for Computational Linguistics.
- Kowsari et al. (2019) Kowsari, Jafari Meimandi, Heidarysafa, Mendu, Barnes, and Brown. 2019. Text classification algorithms: A survey. Information, 10(4):150.
- Krizhevsky et al. (2017) Alex Krizhevsky, Ilya Sutskever, and Geoffrey E. Hinton. 2017. ImageNet classification with deep convolutional neural networks. Communications of the ACM, 60(6):84–90.
- Meng et al. (2020) Yu Meng, Yunyi Zhang, Jiaxin Huang, Yu Zhang, Chao Zhang, and Jiawei Han. 2020. Hierarchical topic mining via joint spherical tree and text embedding.
- Simard et al. (2012) Patrice Y. Simard, Yann A. LeCun, John S. Denker, and Bernard Victorri. 2012. Transformation invariance in pattern recognition – tangent distance and tangent propagation. In Lecture Notes in Computer Science, pages 235–269. Springer Berlin Heidelberg.
- Souza et al. (2019) Fábio Souza, Rodrigo Nogueira, and Roberto Lotufo. 2019. Portuguese named entity recognition using bert-crf.
- Szegedy et al. (2015) Christian Szegedy, Wei Liu, Yangqing Jia, Pierre Sermanet, Scott Reed, Dragomir Anguelov, Dumitru Erhan, Vincent Vanhoucke, and Andrew Rabinovich. 2015. Going deeper with convolutions. In 2015 IEEE Conference on Computer Vision and Pattern Recognition (CVPR). IEEE.
- Thongtan and Phienthrakul (2019) Tan Thongtan and Tanasanee Phienthrakul. 2019. Sentiment classification using document embeddings trained with cosine similarity. In Proceedings of the 57th Annual Meeting of the Association for Computational Linguistics: Student Research Workshop, pages 407–414, Florence, Italy. Association for Computational Linguistics.
- Venturott and Ciarelli (2020) Lígia Iunes Venturott and Patrick Marques Ciarelli. 2020. Data augmentation for improving hate speech detection on social networks. In Proceedings of the Brazilian Symposium on Multimedia and the Web. ACM.
- Veríssimo and Costa (2020) Vinícius Veríssimo and Rostand Costa. 2020. Using data augmentation and neural networks to improve the emotion analysis of brazilian portuguese texts. In Proceedings of the Brazilian Symposium on Multimedia and the Web. ACM.
- Wei and Zou (2019) Jason Wei and Kai Zou. 2019. EDA: Easy data augmentation techniques for boosting performance on text classification tasks. In Proceedings of the 2019 Conference on Empirical Methods in Natural Language Processing and the 9th International Joint Conference on Natural Language Processing (EMNLP-IJCNLP). Association for Computational Linguistics.
- Yu et al. (2018) Adams Wei Yu, David Dohan, Quoc Le, Thang Luong, Rui Zhao, and Kai Chen. 2018. Fast and accurate reading comprehension by combining self-attention and convolution. In International Conference on Learning Representations.
Appendix A Detailed Baseline F1-scores
A.1 Tweets Dataset
Table 1 shows all baseline F1-scores for Tweets dataset.
| Augm. Type | |||||||||
|---|---|---|---|---|---|---|---|---|---|
| EDA | Syn | BT | |||||||
| Augm.Perc. | |||||||||
| Subset Size | 0.05 | 0.1 | 0.2 | 0.05 | 0.1 | 0.2 | 0.05 | 0.1 | 0.2 |
| 500 | 0.83 | 0.82 | 0.83 | 0.83 | 0.83 | 0.83 | 0.87 | 0.87 | 0.87 |
| 1000 | 0.80 | 0.79 | 0.80 | 0.80 | 0.80 | 0.80 | 0.80 | 0.80 | 0.80 |
| 2000 | 0.81 | 0.81 | 0.81 | 0.79 | 0.79 | 0.79 | 0.78 | 0.78 | 0.78 |
| 5000 | 0.79 | 0.80 | 0.80 | 0.78 | 0.78 | 0.78 | 0.79 | 0.79 | 0.79 |
| 10000 | 0.78 | 0.78 | 0.77 | 0.77 | 0.78 | 0.77 | 0.78 | 0.78 | 0.78 |
A.2 B2W Dataset
Table 2 shows all baseline F1-scores for B2W dataset.
| Augm. Type | |||||||||
|---|---|---|---|---|---|---|---|---|---|
| EDA | Syn | BT | |||||||
| Augm.Perc. | |||||||||
| Subset Size | 0.05 | 0.1 | 0.2 | 0.05 | 0.1 | 0.2 | 0.05 | 0.1 | 0.2 |
| 500 | 0.92 | 0.92 | 0.91 | 0.94 | 0.94 | 0.94 | 0.92 | 0.92 | 0.92 |
| 1000 | 0.95 | 0.95 | 0.95 | 0.94 | 0.93 | 0.94 | 0.94 | 0.93 | 0.93 |
| 2000 | 0.93 | 0.94 | 0.93 | 0.93 | 0.93 | 0.93 | 0.94 | 0.94 | 0.93 |
| 5000 | 0.93 | 0.94 | 0.93 | 0.93 | 0.93 | 0.93 | 0.94 | 0.94 | 0.93 |
| 10000 | 0.94 | 0.94 | 0.93 | 0.94 | 0.94 | 0.94 | 0.93 | 0.93 | 0.93 |
A.3 Mercado Libre Dataset
Table 3 shows all baseline F1-scores for Mercado Libre dataset.
| Augm. Type | |||||||||
|---|---|---|---|---|---|---|---|---|---|
| EDA | Syn | BT | |||||||
| Augm.Perc. | |||||||||
| Subset Size | 0.05 | 0.1 | 0.2 | 0.05 | 0.1 | 0.2 | 0.05 | 0.1 | 0.2 |
| 500 | 0.62 | 0.61 | 0.63 | 0.64 | 0.62 | 0.62 | 0.65 | 0.66 | 0.66 |
| 1000 | 0.73 | 0.73 | 0.74 | 0.69 | 0.69 | 0.69 | 0.71 | 0.72 | 0.71 |
| 2000 | 0.80 | 0.80 | 0.80 | 0.79 | 0.78 | 0.79 | 0.77 | 0.78 | 0.77 |
| 5000 | 0.85 | 0.85 | 0.85 | 0.85 | 0.84 | 0.85 | 0.84 | 0.84 | 0.84 |
| 10000 | 0.88 | 0.88 | 0.88 | 0.88 | 0.88 | 0.88 | 0.89 | 0.89 | 0.89 |
Appendix B Detailed F1-score Gains
B.1 Tweets Dataset
Figure 8 shows all F1-score gains for Tweets dataset.
B.2 B2W Dataset
Figure 9 shows all F1-score gains for B2W dataset.
B.3 Mercado Libre Dataset
Figure 10 shows all F1-score gains for Mercado Libre dataset.
Appendix C Detailed -values
C.1 Tweets Dataset
Table 4 shows all -values for Tweets dataset.
| Augm. Type | |||||||||
|---|---|---|---|---|---|---|---|---|---|
| EDA | Syn | BT | |||||||
| Augm. Perc. | |||||||||
| Subset Size | 0.05 | 0.1 | 0.2 | 0.05 | 0.1 | 0.2 | 0.05 | 0.1 | 0.2 |
| 500 | 0.30 | 0.89 | 1.00 | 1.00 | 0.67 | 0.60 | 0.70 | 0.24 | 0.58 |
| 1000 | 0.81 | 0.61 | 0.62 | 0.74 | 0.68 | 0.87 | 0.93 | 1.00 | 0.86 |
| 2000 | 0.43 | 0.43 | 0.63 | 0.60 | 0.95 | 0.95 | 0.63 | 0.48 | 0.32 |
| 5000 | 0.53 | 0.97 | 0.24 | 0.54 | 0.78 | 0.67 | 0.55 | 0.81 | 0.50 |
| 10000 | 0.61 | 0.58 | 0.52 | 0.91 | 0.81 | 0.35 | 0.98 | 0.88 | 0.45 |
C.2 B2W Dataset
Table 5 shows all -values for B2W dataset.
| Augm. Type | |||||||||
|---|---|---|---|---|---|---|---|---|---|
| EDA | Syn | BT | |||||||
| Augm. Perc. | |||||||||
| Subset Size | 0.05 | 0.1 | 0.2 | 0.05 | 0.1 | 0.2 | 0.05 | 0.1 | 0.2 |
| 500 | 1.00 | 0.23 | 0.21 | 1.00 | 1.00 | 0.61 | 0.54 | 1.00 | 0.70 |
| 1000 | 0.09 | 0.73 | 0.21 | 1.00 | 0.61 | 0.32 | 0.74 | 0.30 | 0.47 |
| 2000 | 0.14 | 0.89 | 0.81 | 0.04 | 0.39 | 1.00 | 1.00 | 0.55 | 0.61 |
| 5000 | 0.92 | 0.78 | 0.35 | 0.92 | 1.00 | 0.93 | 1.00 | 0.48 | 0.79 |
| 10000 | 0.56 | 0.89 | 0.12 | 0.77 | 0.10 | 0.15 | 0.60 | 0.42 | 0.79 |
C.3 Mercado Libre Dataset
Table 6 shows all -values for Mercado Libre dataset.
| Augm. Type | |||||||||
|---|---|---|---|---|---|---|---|---|---|
| EDA | Syn | BT | |||||||
| Augm. Perc. | |||||||||
| Subset Size | 0.05 | 0.1 | 0.2 | 0.05 | 0.1 | 0.2 | 0.05 | 0.1 | 0.2 |
| 500 | 0.93 | 0.93 | 0.80 | 1.00 | 0.93 | 0.50 | 0.60 | 0.44 | 0.81 |
| 1000 | 0.79 | 1.00 | 0.36 | 1.00 | 0.95 | 0.66 | 0.69 | 0.80 | 0.95 |
| 2000 | 0.52 | 0.55 | 0.54 | 0.75 | 0.67 | 0.56 | 0.67 | 0.67 | 0.96 |
| 5000 | 0.63 | 0.62 | 1.00 | 0.72 | 0.13 | 0.93 | 0.56 | 0.44 | 0.81 |
| 10000 | 0.51 | 0.66 | 0.23 | 0.89 | 0.72 | 0.60 | 0.23 | 0.38 | 0.21 |