Non-thermal motions and atmospheric heating of cool stars
Abstract
The magnetic processes associated with the non-thermal broadening of optically thin emission lines appear to carry enough energy to heat the corona and accelerate the solar wind. We investigate whether non-thermal motions in cool stars exhibit the same behaviour as on the Sun by analysing archival stellar spectra taken by the Hubble Space Telescope, and full-disc Solar spectra taken by the Interface Region Imaging Spectrograph. We determined the non-thermal velocities by measuring the excess broadening in optically thin emission lines formed in the stellar atmosphere; the chromosphere, the transition region and the corona. Assuming the non-thermal broadening is caused by the presence of Alfvén waves, we also determined the associated wave energy densities. Our results show that, with a non-thermal velocity of 23 km s-1 the Sun-as-a-star results are in very good agreement with values obtained from spatially-resolved solar observations. The non-thermal broadening in our sample show correlation to stellar rotation, with the strength of the non-thermal velocity decreasing with decreasing rotation rate. Finally, the non-thermal velocity in cool Sun-like stars varies with atmospheric height or temperature of the emission lines, and peaks at transition region temperatures. This points towards a solar-like Alfvén wave driven heating in stellar atmospheres. However, the peak is at a lower temperature in some cool stars suggesting that, other magnetic process such as flaring events could also dominate.
1 Introduction
One of the key drivers of atmospheric loss in (exo)planets orbiting cool main-sequence stars is the magnetised winds of their central star (Kislyakova et al., 2014; Airapetian et al., 2017). In cool stars like our Sun, the wind is driven by non-thermal processes in the stellar corona and interface region 111includes the chromosphere and the transition region, which act as an interface between the photosphere and the corona, which include magnetic reconnection, propagation and presence of Alfvén waves, turbulence, flares and other explosive events (e.g., Mariska, 1992; De Pontieu et al., 2021, and references therein). Out of these different processes Alfvén waves have emerged as the dominant heating mechanism in solar and stellar wind models (Suzuki & Inutsuka, 2006; Cranmer et al., 2007; van der Holst et al., 2014; Lionello et al., 2014; Shoda et al., 2019; Réville et al., 2020). However, controversy still exists on the contribution of these different non-thermal processes towards coronal heating and wind propagation (Cranmer & Winebarger, 2019). Detailed comparative study of the interface region in the Sun and other cool stars can help shed light into these different processes and constrain numerical models of solar and stellar winds.
In the case of the Sun, far-ultraviolet (FUV) and extreme-ultraviolet (EUV) spectral lines provide important diagnostics of the plasma properties in the interface region. While flux ratios of certain spectral lines can be used to estimate the density of the emitting plasma (Polito et al., 2016; Young et al., 2018), other diagnostics such as Doppler shifts (Cheung et al., 2015; Testa et al., 2016), asymmetries (Martínez-Sykora et al., 2011), and non-thermal broadening (Chae et al., 1998; De Pontieu et al., 2015) of spectral lines provide valuable constraints to solar coronal heating and wind acceleration models. Here, we focus on the analysis of non-thermal broadening of FUV lines from cool stars, where the non-thermal broadening is the excess broadening of a spectral line on top of the thermal and instrumental broadening.
Instruments such as the Skylab spectrograph (Tousey et al., 1973; Reeves, 1976), the Solar Ultraviolet Measurements of Emitted Radiation (SUMER) instrument aboard the Solar and Heliophysics Observatory (SOHO, Wilhelm et al., 1995), and the Interface Region Imaging Spectrograph (IRIS, De Pontieu et al., 2014) have provided new insights on the non-thermal broadening of interface region emission lines. The non-thermal velocities, measured in the quiet Sun, range from 5 to 30 km s-1, and show a correlation with the emission line temperature or the atmospheric height (Boland et al., 1975; Doschek et al., 1976; Mariska, 1992; Chae et al., 1998; Teriaca et al., 1999). The measured non-thermal velocities increase with an increasing temperature, and reach a peak in the upper transition region, which is then followed by a decline towards higher temperatures in the corona. Correlations have been also reported between the non-thermal velocities and the line intensities, however the correlations gets weaker with increase in temperature (Chae et al., 1998). These observed properties of non-thermal velocities suggest that magnetic processes in the solar atmosphere drive solar coronal heating and wind acceleration.
While solar observations provide us with an unique opportunity to obtain an in-depth knowledge of the physical processes in a cool main sequence star, it is a single data point amongst the hundreds of thousands of cool stars in our neighbourhood. To obtain a general understanding of non-thermal broadening in stellar atmospheres and their connection to stellar fundamental properties such as mass and rotation, we must also examine cool stars other than the Sun. Measurements of non-thermal velocities in cool stars are limited, and most of our knowledge of cool stellar non-thermal velocities come from observations taken by the Hubble Space Telescope’s Goddard High Resolution Spectrograph (HST/GHRS, Linsky & Wood, 1994; Wood et al., 1997, and references therein). The interface region emission lines used in these studies not only showed large non-thermal broadening, but also a non-Gaussian profile with strong emission around the wings. Although not as prominent as in stellar spectra, such a shape is also known to exist in solar emission lines (Kjeldseth Moe & Nicolas, 1977; Peter, 2001; Ayres et al., 2021). To account for the broad wings the spectral lines are often modelled using a double Gaussian profile with a narrow and a broad component. The non-thermal velocities are then calculated for both the narrow and the broad component individually.
The presence of the broad component adds an additional layer of complexity in the interpretation of the measured non-thermal broadening. In the case of giant and super-giant stars, anisotropically distributed turbulence along the line of sight has been proposed as a mechanism behind enhanced wings of non-thermally broadened lines (Robinson et al., 1996; Airapetian et al., 2000). Based on observations of cool stars, Wood et al. (1997) concluded that the non-thermal broadening in the narrow component could be attributed to turbulence or Alfvén waves, whereas the broad component is generated by micro-flares. A Sun-as-a-star study by Peter (2006) provides an alternative theory, that the broad component is related to the underlying magnetic network in the chromosphere, and the non-thermal broadening of the narrow component is a better indicative for coronal and wind heating. A recent study of solar emission lines by Ayres et al. (2021) shows that the non-Gaussian nature of the lines prevail even at the finest spatial scales, suggesting that the observed velocity distribution might be non-Maxwellian in nature. However, further investigations are needed to explore the true nature of these emission lines.
In this work we investigate the non-thermal broadening in a sample of cool stars, based on archival measurements of HST’s Cosmics Origins Spectrograph (COS). We use a double Gaussian profile to model the emission lines, and only consider the narrow component of the Gaussian while calculating the non-thermal broadening of the sample. We investigate the correlation between the measured non-thermal velocities and stellar properties at different formation temperatures, and compare our results to the non-thermal velocities measured using full-disk solar data. In section 2 we discuss the archival data set, followed by data analysis in Section 3. The results are discussed in Section 4, and the conclusions in Section 5.
| HD name | other name | mass | radius | planet host | additional refs | |||||
|---|---|---|---|---|---|---|---|---|---|---|
| K | km s-1 | days | km s-1 | |||||||
| HD 75732 | 55 Cnc | 0.92 | 0.95 | 5235 | 27.8 | 42.0 | -5.01 | 25.9 | Yes | 1, 2 |
| HD 129333 | EK Dra | 0.89 | 0.91 | 5845 | -20.0 | 2.6 | -4.10 | 38.0 | No | 1, 3 |
| HD 209458 | HIP 108859 | 1.10 | 1.1 | 6099 | -14.7 | 11.4 | -4.88 | 25.4 | Yes | 4, 5 |
| HD 69830 | LHS 245 | 0.86 | 0.90 | 5361 | 32.2 | 41.2 | -5.02 | 24.9 | Yes | 1 |
| HD 154345 | LHS 3260 | 0.90 | 0.84 | 5468 | -46.6 | 31.0 | -4.80 | 23.9 | Yes | 1 |
| HD 204961 | GJ 832 | 0.45 | 0.48 | 3472 | 13.0 | 40.0 | -5.07 | 14.8 | Yes | 1, 6 |
| HD 38529 | HIP 27253 | .. | .. | 5697 | 30.0 | 35.7 | .. | 35.2 | Yes | 1 |
| .. | LTT 2050 | 0.48 | 0.45 | 3633 | -6.7 | 3.7 | .. | 14.7 | No | 7, 8 |
| .. | LP 415-1619 | .. | 0.58 | 3420 | 55.0 | .. | .. | 26.3 | No | 1, 9, 10 |
| HD 121504 | LTT 5432 | 1.18 | .. | 6075 | 19.6 | 8.6 | -4.75 | 29.7 | Yes | 1, 11 |
| .. | GJ 3470 | 0.45 | 0.42 | 3600 | 26.3 | 20.7 | .. | 17.8 | Yes | 12, 13 |
| HD 3651 | 54 Psc | 0.80 | 0.88 | 5221 | -32.9 | 37.0 | -5.11 | 22.4 | Yes | 1 |
| HD 38459 | LTT 2361 | 0.88 | .. | 5320 | 26.0 | 12.0 | -4.46 | 17.1 | No | 14, 15 |
| HD 97658 | GJ 3651 | 0.90 | 0.74 | 5148 | -1.5 | 38.5 | -5.04 | 20.4 | Yes | 1 |
| .. | WASP-69 | 0.83 | 0.81 | 4715 | -9.4 | 23.1 | .. | 21.1 | Yes | 1,16 |
| HD 172669 | HIP 91210 | 1.08 | 1.00 | 5964 | -6.7 | .. | .. | 17.2 | No | 17, 18 |
| HD 1461 | LTT 149 | 1.14 | 1.10 | 5765 | -10.0 | 29.0 | -5.33 | 28.9 | Yes | 1 |
| HD 95128 | 47 UMa | 1.29 | 1.22 | 5882 | 11.5 | 24.0 | -4.90 | 29.3 | Yes | 1 |
| HD 285968 | GJ 176 | 0.45 | 0.45 | 3416 | 26.0 | 38.9 | -4.76 | 15.9 | Yes | 1,19, 20 |
| HD 62850 | HIP 37563 | 1.01 | 1.05 | 5700 | 17.9 | .. | -4.27 | 31.4 | No | 21, 22, 23, 24 |
| HD 22049 | Eri | 0.71 | 0.72 | 5146 | 16.0 | 11.7 | -4.50 | 23.2 | Yes | 1 |
| HD 13445 | GJ 86 | 0.93 | 0.80 | 5151 | 55.0 | 30.0 | .. | 19.4 | Yes | 1 |
| HD 7924 | HIP 6379 | 0.80 | 0.75 | 5177 | -22.0 | 38.0 | -4.90 | 18.2 | Yes | 1 |
| .. | HAT-P-11 | 0.81 | 0.75 | 4780 | -63.7 | 30.5 | -4.65 | 18.7 | Yes | 1, 25 |
| HD 189733 | GJ 4130 | 0.82 | 0.76 | 5050 | -2.3 | 13.4 | -4.50 | 21.8 | Yes | 1, 26 |
| HD 156384C | GJ 667 C | 0.33 | .. | 3600 | 6.0 | 105.0 | -5.30 | 10.4 | Yes | 1, 27, 28, 29 |
| HD 40307 | GJ 2046 | 0.78 | 0.71 | 4827 | 31.3 | 48.0 | -5.25 | 20.1 | Yes | 1 |
| .. | GJ 849 | 0.49 | 0.46 | 3601 | -32.0 | 39.2 | -4.95 | 15.7 | Yes | 30, 31, 32 |
| HD 146233 | 18 Sco | 0.98 | 1.02 | 5791 | 10.0 | .. | -4.90 | 24.8 | No | |
| HD 104067 | LTT 4461 | 0.91 | 0.75 | 4956 | 15.0 | 34.7 | -4.80 | 18.4 | Yes | 1 |
| HD 128311 | GJ 3860 | 1.32 | 0.73 | 4965 | -9.0 | 14.0 | -4.49 | 23.6 | Yes | 1 |
| HD 136118 | HIP 74948 | 1.25 | 1.74 | 6097 | -3.0 | 12.2 | -4.79 | 23.8 | No | 1 |
| HD 201091 | 61 Cyg A | 0.66 | 0.67 | 4545 | -65.5 | 35.0 | -4.70 | 19.8 | No | 33, 34 |
| HD 41004 | HIP 28393 | 0.70 | .. | 5010 | 42.5 | 27.0 | -4.67 | 23.6 | Yes | 35 |
| HD 99492 | 83 Leo B | 1.24 | 0.76 | 4955 | 3.0 | 45.0 | -5.00 | 17.7 | Yes | 1 |
| HD 10647 | q1 Eri | 0.98 | 1.10 | 6105 | 27.6 | 10.0 | .. | 26.0 | Yes | 1 |
| .. | GJ 876 | 0.37 | 0.38 | 3130 | -1.5 | 81.0 | -5.00 | 13.6 | Yes | 36, 37 |
| HD 92788 | LTT 3928 | 1.64 | 0.99 | 5836 | -4.0 | 31.7 | -4.95 | 17.9 | Yes | 1 |
| HD 150706 | GJ 632 | 1.17 | 0.96 | 5961 | -17.0 | .. | -4.40 | 25.1 | Yes | 38 |
| HD 39091 | Men | 1.12 | 1.15 | 5950 | 10.0 | 33.9 | -4.89 | 30.3 | Yes | 1 |
| HD 85512 | LHS 2201 | 0.69 | .. | 4715 | -10.0 | 47.1 | -4.96 | 17.0 | Yes | 1, 39 |
| HD 192263 | HIP 99711 | 0.83 | 0.75 | 4975 | -10.0 | 24.5 | -4.57 | 18.0 | Yes | 1 |
| .. | GJ 581 | 0.31 | 0.29 | 3498 | -16.0 | 94.2 | -5.43 | 9.9 | Yes | 1, 40, 41 |
| HD 143761 | CrB | 1.47 | 1.32 | 5823 | 18.0 | 18.5 | -4.95 | 18.0 | Yes | 1 |
| HD 186427 | 16 Cyg B | 1.10 | 1.15 | 5674 | -28.0 | 29.1 | -4.90 | 27.1 | Yes | 1 |
| HD 72905 | UMa | 1.00 | 0.96 | 5873 | -12.0 | 5.0 | -4.30 | 27.0 | No | 42, 43, 44 |
| HD 161897 | HIP 86540 | 1.01 | 0.86 | 5623 | -16.5 | .. | -4.77 | 17.7 | No | |
| HD 192310 | LHS 488 | 0.84 | 0.81 | 5080 | -54.0 | 47.7 | -5.30 | 16.8 | Yes | 1 |
| HD 24636 | HIP 17764 | 1.39 | 1.37 | 6831 | 14.5 | .. | .. | 57.6 | No | 17, 23, 45 |
| HD 25825 | LP 15-582 | 1.01 | 1.08 | 5941 | 37.0 | .. | -4.34 | 23.3 | No | |
| HD 160691 | Ara | 1.08 | .. | 5813 | -12.0 | 31.0 | -4.97 | 22.0 | Yes | 46,47 |
| HD 39587 | Ori | 0.82 | 1.01 | 5882 | -13.4 | 5.2 | -4.40 | 30.7 | No | |
| HD 186408 | 16 Cyg A | 1.25 | 1.25 | 5781 | -27.5 | 26.9 | -4.98 | 25.5 | No | 1 |
| HD 197037 | LTT 16037 | 1.11 | 1.15 | 6150 | 8.0 | 19.1 | .. | 18.8 | Yes | 1,48 |
| HD 1835 | 9 Cet | 0.98 | 0.96 | 5837 | -2.5 | .. | -4.40 | 29 | No |
Note. — Columns 1 to 9: HD name, other name, mass, radius, effective temperature, radial velocity, rotation, stellar activity or , mean non-thermal velocity determined in this work from the Si IV 1393 Å line. The stellar parameters are taken from Valenti & Fischer (2005) or the following references, France et al. (2018)1; Poppenhaeger et al. (2010)2; Wright et al. (2011)3;Silva-Valio (2008)4; Boro Saikia et al. (2018)5; Wittenmyer et al. (2014)6; Schweitzer et al. (2019)7; Passegger et al. (2020)8; Kopytova et al. (2016)9; Terrien et al. (2015)10; Mayor et al. (2004)11; Bonfils et al. (2012)12; Palle et al. (2020)13; Pavlenko et al. (2019)14; Hojjatpanah et al. (2020)15; Anderson et al. (2014)16; McDonald et al. (2012)17; Kervella et al. (2019)18; Peacock et al. (2019)19; Endl et al. (2008)20; Muirhead et al. (2018)21; Cutispoto et al. (2002)22; Bochanski et al. (2018)23; Nielsen et al. (2019)24; Bakos et al. (2010)25; Bouchy et al. (2005)26; Anglada-Escudé et al. (2012)27; Anglada-Escudé et al. (2013)28; Delfosse et al. (2013)29; Schöfer et al. (2019)30; Butler et al. (2006)31; Feng et al. (2015)32; Boro Saikia et al. (2016)33; Kervella et al. (2008)34; Santos et al. (2002)35; von Braun et al. (2014)36; Youngblood et al. (2017)37; Boisse et al. (2012)38; Pepe et al. (2011)39; Bonfils et al. (2005)40; von Braun et al. (2011)41; Cenarro et al. (2007)42; Rosén et al. (2016)43; Kochukhov et al. (2020)44; Gáspár et al. (2016)45; Butler et al. (2001)46; Santos et al. (2004)47; Robertson et al. (2012)48
2 Observations and data analysis
The stellar data used in this work were obtained from the Mikulski Archive for Space Telescopes (MAST) at the Space Telescope Science Institute. The specific observations analyzed can be accessed via https://doi.org/10.17909/wvzj-wd79 (catalog DOI: 10.17909/wvzj-wd79). Table 1 lists the properties of our stellar sample of 55 stars, all of which were observed by HST COS (Froning & Green, 2009), which is a highly-sensitive moderate resolution spectrograph with a spectral resolution of 1600-24000 over a wavelength range of 1150-3200 Å. We also analysed solar spectra taken by IRIS (De Pontieu et al., 2014), which is a NASA Small Explorer satellite that takes high-resolution UV images and spectra of the Sun; spectral resolution of 50,000. In addition to daily raster scans of the Sun IRIS provides monthly full-disc mosaics in 6 spectral windows, enabling us to compare Sun-as-a-star spectral lines to the stellar sample.
2.1 Interface region emission lines
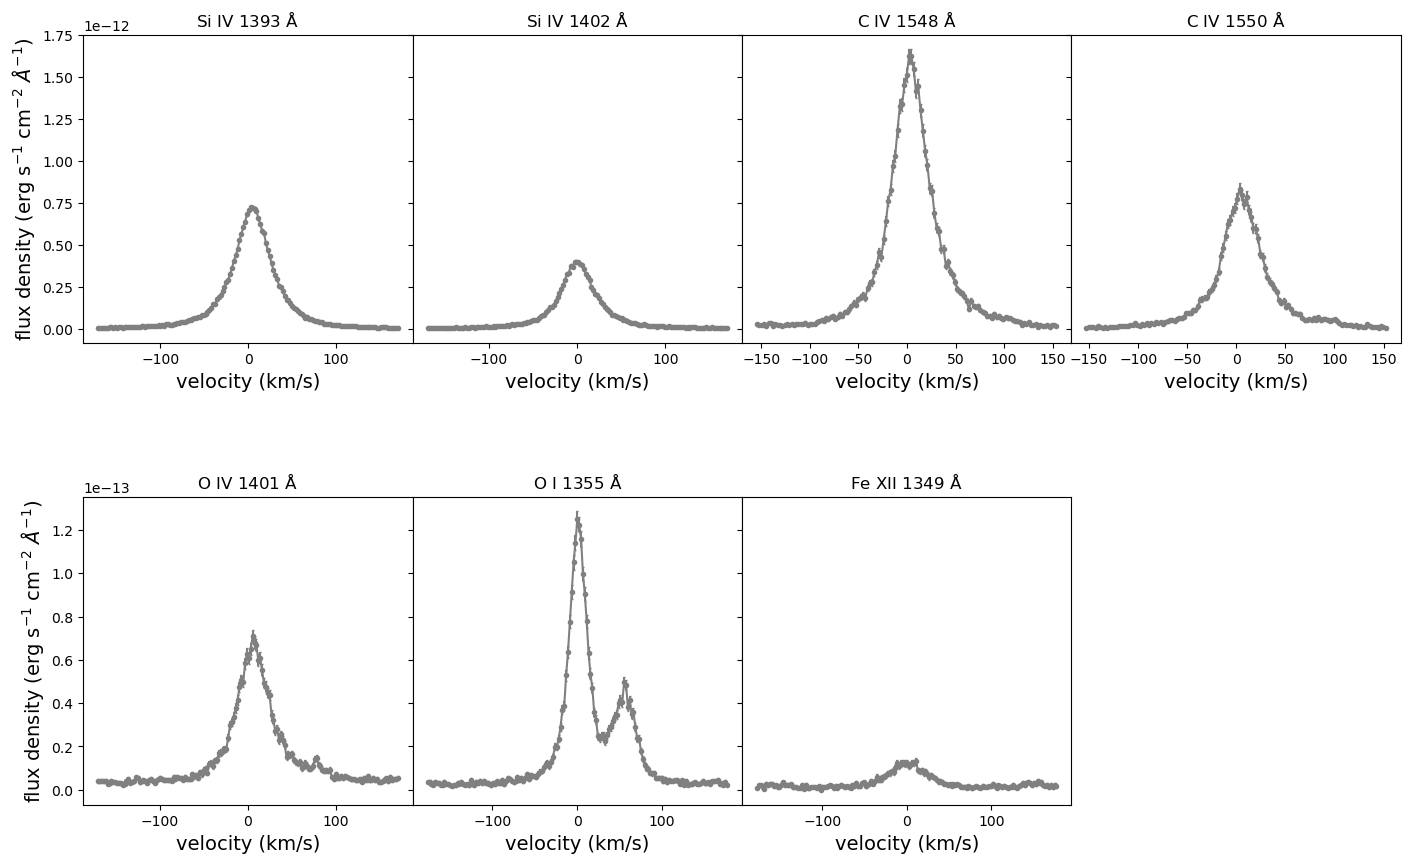
Non-thermal velocities in stellar interface regions can be determined from optically thin emission lines. In this work we analysed optically thin FUV emission lines formed in the interface layer; the chromosphere and the transition region. Additionally, we also included a coronal emission line in our analysis. The line selection was based on the wavelength coverage of COS and IRIS, and on the signal-to-noise ratio of the archival observations. Figures 1 and 2 show the emission lines analysed in this work (absolute flux densities are shown in Figure 9).
2.1.1 Chromospheric emission lines
The most well-studied chromospheric lines are optically thick, which include the Mg II h and k lines at 2803.52 Å and 2796.34 Å, and the Ca II h and k lines at 3936.85 Å and 3933.64 Å, respectively. In recent years, due to its optically thin nature, the O I 1355.6 Å line has emerged as a strong diagnostics for non-thermal motions in the chromosphere. According to Lin & Carlsson (2015), the O I line forms at a wide range of heights at the middle of the chromosphere, and in this work we adopt a temperature of 20,000 K (Teriaca et al., 1999). Due to its formation in the chromosphere the O I line is a very good diagnostic tool not only for non-thermal broadening but also as a proxy for magnetic activity in the stellar chromosphere. However, careful analysis is required as the O I line blends with the C I line at 1355.8 Å, as shown in Figures 2 and 9.
2.1.2 Transition region emission lines
The transition region is the second layer of the interface region, where the temperature rises from a few thousands of Kelvin to a million degree Kelvin. It is also the region where multiple different optically thin emission lines form, providing an excellent diagnostic for plasma motions. We included five transition region emission lines in our study, which include the Si IV doublet at 1393.76 Å and 1402.77 Å, the C IV doublet at 1548.195 Å and 1550.77 Å, and O IV at 1401.156 Å, respectively. Figure 9 shows these five transition region emission lines for the young exoplanet host star Eri.
The Si IV doublet lines are resonance lines formed under optically thin collisionally excited conditions with a peak formation temperature of 80,000 K (Peter et al., 2014) and lie at the middle of the transition region. The Si IV line formed at 1393 Å (decimals are ignored for simplicity in the rest of the text) has a stronger intensity than the line formed at 1402 Å. Under optically thin conditions the flux ratio of these two lines (1393/1402) is 2, while under the optically thick conditions the ratio is . The Si IV doublet lines are the only lines for which we have included full-disc solar observations from IRIS.
The C IV doublet lines are resonance lines with a peak formation temperature at 100,000 K (Teriaca et al., 1999). The 1548 Å line originates from an atomic transition from the ground to the 3rd energy level and the 1550 Å line is formed due to a transition from the ground to the 2nd energy level. The C IV doublet have the strongest intensity when compared to the other emission lines used in this work. Under non-flaring solar conditions the flux ratio of the two lines in the doublet are shown to be 2, suggesting optically thin conditions (Dere & Mason, 1993). Due to limited wavelength coverage the C IV line could be analysed for only one star in the sample, Eri.
The O IV line at 1401 Å is one of the five O IV inter-combination lines found close to the Si IV line. With a formation temperature of 150,000 K under equilibrium conditions (De Pontieu et al., 2014) the O IV line is an important density diagnostic tool (Keenan et al., 2002). The ratio of this line with the O IV line at 1399 Å is widely used as a density diagnostic tool for medium density plasma (Polito et al., 2016). In the Sun, the wings of O IV line are known to be blended with the photospheric cool transition line of S I (Polito et al., 2016).
2.1.3 Coronal emission lines
While the corona mostly emits in X-rays, it can be also probed using a limited number of FUV and EUV lines. The coronal emission line included in this study is the Fe XII 1349.4 Å forbidden line with a peak formation temperature of 1.5 MK. Figure 9 shows the Fe XII line of Eri, which has the poorest signal-to-noise ratio amongst all the lines included in this work. Furthermore, the weak Fe XII line is only observable for two stars in our sample. Even in the Sun long exposure times are required to obtain a good signal-to-noise ratio for this line (Testa et al., 2016).
Our results in Section 3 are primarily based on the Si IV line at 1393 Å, as it is most easily detectable line for all stars included in our study. The results related to the other six emission lines are only discussed for a handful of stars with a good signal-to-noise ratio.
2.2 Gaussian model line fitting and non-thermal velocities
In order to determine the non-thermal broadening we first perform a Gaussian fit to the observed emission lines. The full width at half maximum (FWHM) of the best fit model is then used to measure the non-thermal broadening after subtracting the corresponding thermal broadening.
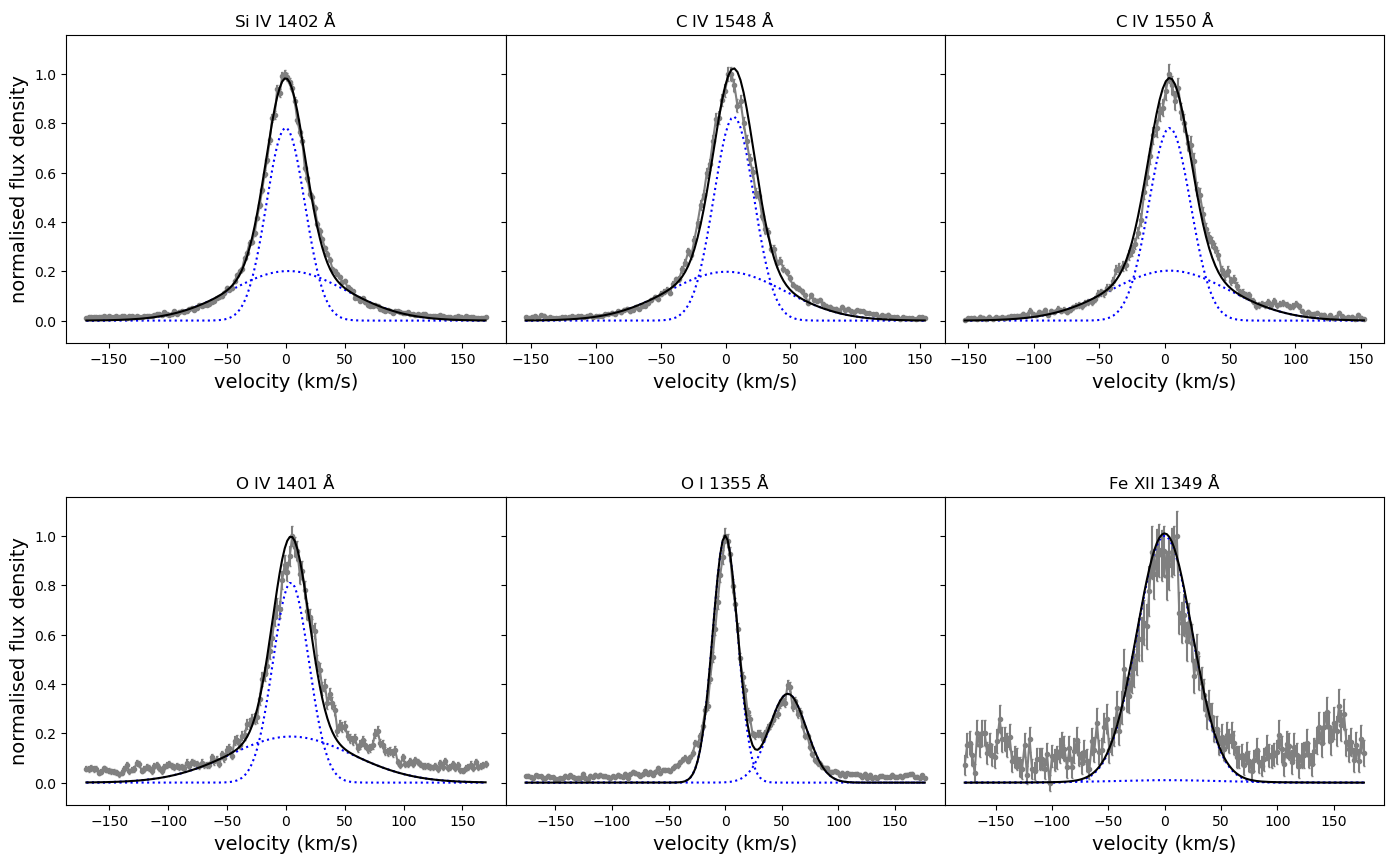
As shown in Figures 1 and 2, the S IV, C IV and O IV lines were fitted using a double Gaussian model, which includes a narrow component (NC) and a broad (BC) component. A slightly different Gaussian model was applied to the O I and Fe XII lines. The nearby C I was included in the fitting procedure of the O I line. The best fit model doesn’t account for the broad wings of O I suggesting an additional Gaussian component might be necessary, which is not included here. Finally, a single Gaussian model is used to fit the Fe XII line. Analysis of IRIS Fe XII lines in the solar active regions by Testa et al. (2016) show that a single Gaussian model is sufficient to model this line. Figure 2 also suggests that the Fe XII line can be modelled using a single Gaussian model. However it has been shown that, while spectra with poor signal-to-noise can be easily fit with a single Gaussian line profile, the same spectra might need a double Gaussian model if the signal-to-noise ratio improves (Peter, 2006). Finally, although a double Gaussian model is applied to the O IV line, the S I line blend is not included in the line fitting process. Hence, care should be taken while interpreting the non-thermal broadening determined using the O I, Fe XII, and O IV lines.
Since our emission line profiles are composed of either a single or a double Gaussian, the FWHM of the best fit Gaussian models can be expressed as a combination of thermal and non-thermal motions,
| (1) |
where is the rest wavelength of the emission line in Å, is the speed of light in km s-1, is the Boltzmann constant, is the temperature of the plasma in Kelvin, is the mass of the ion emitting the line in units of the hydrogen atom, and is the non-thermal velocity along the line of sight in km s-1.
In addition to thermal and non-thermal broadening, other key broadening mechanisms in the observed emission lines are instrumental and rotational broadening. For rapidly rotating stars, especially for chromospheric lines where the lines are narrower than their transition region counterparts, the affect of rotational broadening should be included in the model. The rotational broadening for moderate to slowly rotating stars, however, is negligible compared to the other broadening mechanisms. The stellar sample included here mostly consists of moderate and slow rotators, hence rotational broadening is not included in our current model. To account for the instrumental broadening of COS spectra, our Gaussian models are convolved with the COS line spread function (LSF) before applying the fitting algorithm. The instrumental broadening of IRIS is reported to be 5.5 km s-1 (De Pontieu et al., 2014), which is accounted for in our calculation by including the term in equation 1, as shown below,
| (2) |
Our fitting algorithm is based on python, and is optimised by scipy’s least-squares minimisation. Additionally, we determine the goodness of our fits by calculating the . To provide an error estimate we carried out multiple Gaussian fits by including a wide range of initial conditions to the fitting algorithm. The standard deviation of the non-thermal velocities calculated from these Gaussian fits is taken as the dispersion, with an average dispersion of 2 km s-1. Figures 1 and 2 show examples of the best-fit Gaussian models to Eri’s emission lines observed by HST COS, where the line widths are much broader than what is expected from thermal broadening alone. As an example, the width of the Si IV line due to thermal motions is 12 km s-1, which is much smaller than the line width seen in Figure 1. The average non-thermal velocity obtained for this star after subtracting the thermal broadening is 23.2 km s-1 (Table 1). This clearly shows that non-thermal broadening mechanisms dominate in the interface region lines discussed here.
2.3 Non-thermal energy carried by Alfvén waves
The observed non-thermal velocity could be attributed to multiple different processes, out of which Alfvén waves have widely emerged as the mechanism of choice for current coronal and wind heating models (van der Holst et al., 2014; Lionello et al., 2014; Réville et al., 2020). If the excess energy required to heat solar/stellar winds is provided by the presence of transverse Alfvén waves, then the associated wave energy density can be expressed as,
| (3) |
where is the mass density and is the wave velocity perturbation, and both of these terms can be observationally constrained using the emission lines discussed here. The wave velocity perturbation can be determined directly from the observed non-thermal velocities (Banerjee et al., 1998). The mass density can be determined from the electron number density , , where is the mass of a single hydrogen atom. Flux ratios of certain interface region emission lines act as a good diagnostic of the number density (Keenan et al., 2002; Polito et al., 2016). However, it should be noted that this diagnostic method is sensitive to line formation temperature. As the temperature in the interface region vary rapidly the density diagnostic will be strongly dependent on the line used. In this work the O IV 1399/1401 line ratio was analysed to constrain and , as discussed in Section 3.5.
3 Results and discussion
3.1 Emission line shapes
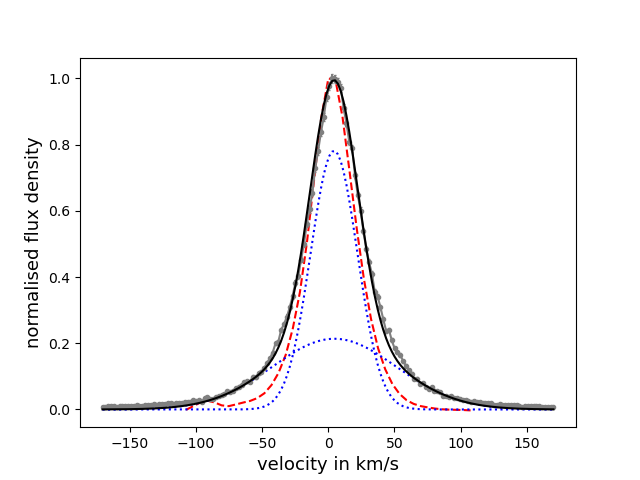
Figure 1 shows an example Si IV 1393 Å line for the active young Sun Eri. The best fit double Gaussian model is also shown, together with a full-disk spectra of the Sun taken by the IRIS spectrograph. In the case of Eri strong excess emission close to the wings is detected in both the red and the blue part of the spectral line. Such strong emission around the wings have been detected in all of the stars in our sample. In comparison the excess emission in the full-disc solar spectral line is relatively weaker, as shown in Figure 1.
In addition to the double Gaussian shape, some of the emission lines exhibit distortions in the line profile, and in some cases shifts of the central wavelength of the line profile were also detected. In Fig. 2 the core of the C IV 1548 Å shows a distorted profile shape. In the solar case distortions and variations in the FUV emission lines are caused due to non-thermal motions along the line-of-sight (Phillips et al., 2008). Recently, such distortions were also detected for the exoplanet host star 55 Cnc (Bourrier et al., 2018), where the distortions and the reduction in flux in FUV lines coincided with one of its planet, 55 Cnc e’s transit. According to the authors the variation seen in these lines could not be explained by stellar activity alone and could include contributions from possible star-planet interaction. A detailed analysis of these line profile distortions and Doppler shifts in stars, with and without exoplanets, has the potential to uncover a possible diagnostics for star-planet-interaction, which is however beyond the scope of this work.
3.2 Non-thermal velocity at the solar transition region
To determine the non-thermal velocity in the solar atmosphere we analysed 98 full-disc mosaics surrounding the Si IV 1393 Å line taken by the IRIS mission, which cover a period from the declining phase of solar cycle 24 to the increasing phase of cycle 25 (September 2013 to June 2022). The non-thermal velocities determined from these observations have a mean of 22.9 km s-1 and a standard deviation of 0.5 km s-1, which are in strong agreement with measurements of the Quiet Sun (QS) by Dere & Mason (1993) and Chae et al. (1998). The non-thermal velocities determined from full-disk IRIS mosaics also agree with results from spatially resolved IRIS observations of the Si IV 1402 Å line, where the non-thermal velocity was determined to be 20 km s-1 (De Pontieu et al., 2015).
Ten out of the 98 full-disc IRIS mosaics used here were also analysed by Ayres et al. (2021) as part of their Sun-as-a-star study (referred to as A21 from here on), where they included 10 full-disc mosaics taken between October 2013 and September 2019. The data analysed by A21 were corrected for cosmic ray hits and missing data, and for this data-set we obtained a mean non-thermal velocity of 22.4 km s-1 with a standard deviation of 0.6 km s-1, which is in agreement with the results obtained from the full IRIS sample of 98 observations. For a detailed comparison between individual observations please see Appendix C.
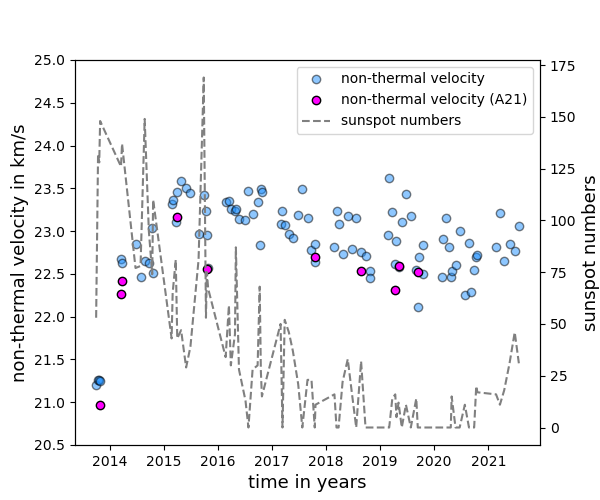
Since IRIS observations cover the decreasing phase of solar cycle 24 and the increasing phase of cycle 25, we also investigate any possible correlation between full-disc solar non-thermal velocities and magnetic spot emergence. Figure 3 shows the evolution of the non-thermal velocity with the solar cycle. There is a phase delay between the peaks of the two measurements with the non-thermal velocity peaking at least a year later and showing a general flat distribution towards the declining phase of cycle 24. The lower envelope of the non-thermal velocities for the entire sample of 98 observations exhibit a similar trend as the sunspot numbers as they progress from cycle 24 to 25. The non-thermal velocities determined for the observations taken from A21 agree well with the full IRIS sample used here. Sunspot numbers are a proxy for photospheric magnetic activity and non-thermal velocities are diagnostics for magnetic processes in the interface region. Since the interface region magnetic field has roots in the photosphere, it is not surprising to see a general agreement in Figure 3 despite the difference in spatial scales.
3.3 Non-thermal velocity vs stellar properties
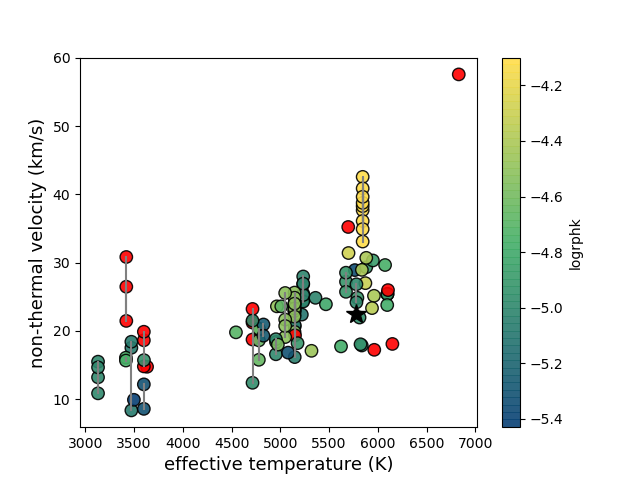
We determine the non-thermal velocities for the stars listed in Table 1 from the Si IV 1393 Å line profile, and investigate their relationship with stellar properties such as rotation and effective temperature.
The spectral coverage of our sample lies between late F and mid M dwarfs, with G and K dwarfs being the dominant majority, as shown in Figure 4. The chromospheric activity of the sample indicate mostly intermediate to low activity stars, with a few active stars in the mix. The solar non-thermal velocity, determined in the previous section, is close to the average non-thermal velocity for its spectral type.
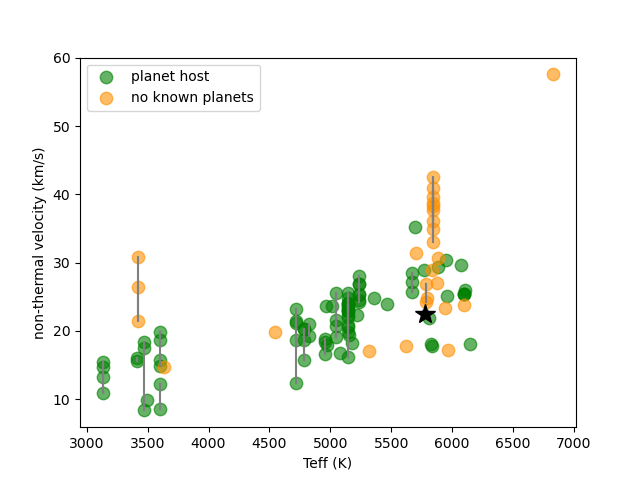
The non-thermal velocities show a weak dependence on the stellar spectral type, with an overall decrease in velocity towards late type dwarfs, as shown in Figure 4. M dwarfs are known to have stronger surface magnetic fields when compared to G and K dwarfs (Shulyak et al., 2017). However, late-type dwarfs have smaller surface convective velocities compared to G dwarfs, which corresponds to smaller amplitudes for Alfvén waves (Sakaue & Shibata, 2021) and non-thermal velocities. This could explain the weak dependence of non-thermal velocity on spectral type. Additionally, as shown in the right panel of Figure 4, the majority of the stars in our sample are exoplanet hosts. Our sample is biased towards inactive cool stars and only includes partially convective M dwarfs. A majority of the known partially convective M dwarfs outside of young associations are inactive and believed to be older, which could also contribute towards the relatively low non-thermal broadening in M dwarf spectra seen in this work. This decreasing trend towards early M dwarfs has been also reported in multiple chromospheric activity studies of late-type dwarfs (Reiners et al., 2012; Astudillo-Defru et al., 2017; Boro Saikia et al., 2018). Hence, rotation or age should be also included when investigating the non-thermal broadening-stellar property relation for our sample.
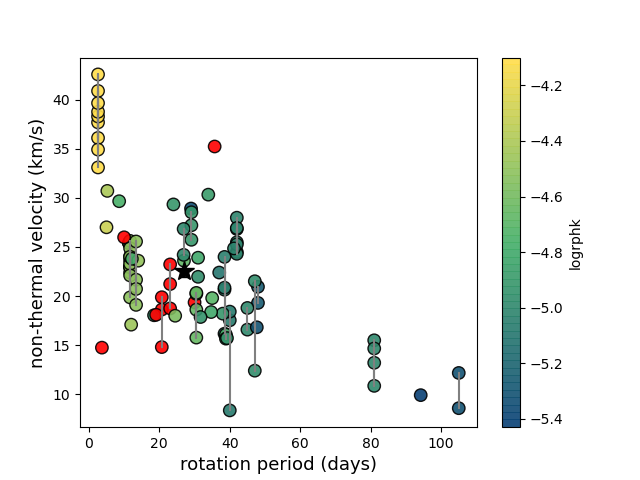
Stellar non-thermal velocity shows a clear dependence on rotation, as presented in Figure 5. The late-type stars in Figure 4 with the lowest non-thermal velocity are indeed older slowly rotating dwarfs. Overall the non-thermal velocity shows a linear dependence on rotation, but within the intermediate to rapidly rotating cohort the non-thermal velocity exhibits a flat distribution between 15-30 km s-1. The rapidly rotating young Sun EK Dra with non-thermal velocity in the range of 30-40 km s-1 gives the impression of an increase with rapid rotation in the left panel of Figure 5. However, at a rotation period of 2 days rotational effects could distort and broaden the observed spectral line. Furthermore, some of the EK Dra observations are affected by a flaring event (Ayres & France, 2010; Ayres, 2015). Hence, the quiescent non-thermal velocity of EK Dra could be much lower than reported here.
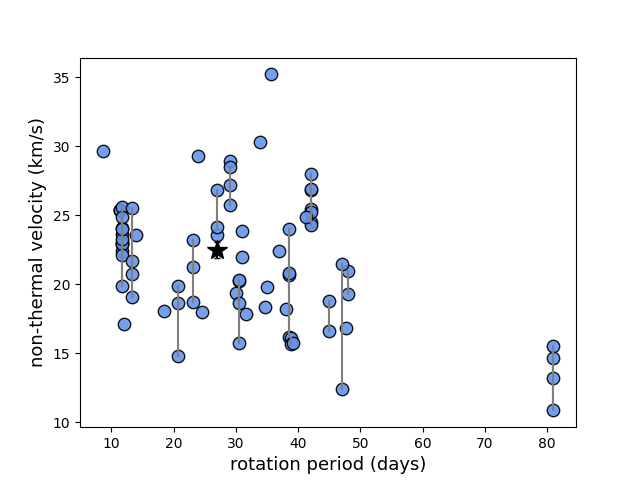
Since the influence of rotational broadening is not included in the model spectra the stellar sample was additionally reduced to include only slowly rotating stars. The right panel of Figure 5 shows the non-thermal velocity of a smaller sample of stars with low rotational velocity, km s-1 222Five stars, including two M dwarfs, didn’t have any measurements so those stars were also omitted in the right panel of Figure 5.. The overall trend is the same as the left panel of Figure 5. The non-thermal velocity of stars similar to the Sun in rotation period lie in the range of 15-30 km s-1, and the single slowly rotating M dwarf exhibits a non-thermal velocity in the range of 10-15 km s-1. Future observations of both rapidly and slowly rotating stars, together with a more complex model, would help to further constrain the relationship between non-thermal velocity and rotation in Figure 5.
3.4 Non-thermal broadening vs Si IV 1393 flux
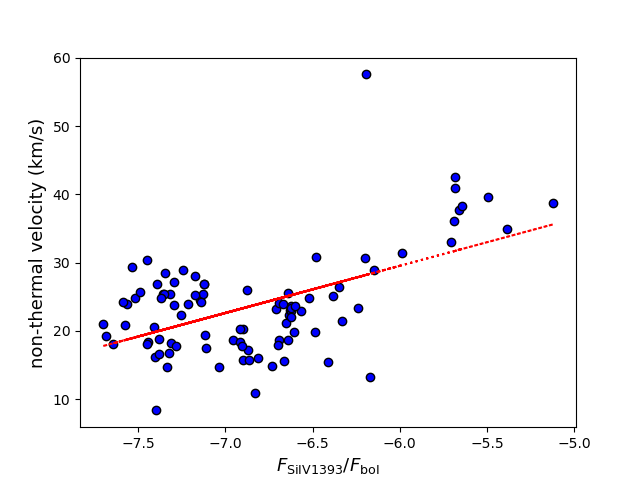
The Si IV 1393 Å line is also considered to be an indirect tracer of stellar magnetic field, and a proxy for stellar EUV activity (France et al., 2018). Hence, we investigate possible correlations between the Si IV 1393 flux and the measured non-thermal velocities. The flux in the Si IV 1393 line, , is calculated by performing an integration centred around the line. Since our sample consists of stars of different spectral types we normalise the measured flux by the bolometric flux .
| (4) |
where is the Stefan-Boltzmann constant, is the stellar effective temperature, is the stellar radius, and is the distance.
Figure 6 shows the S IV 1393 Å non-thermal velocity as a function of the normalised Si IV flux . The non-thermal velocities exhibit a weak correlation with the measured flux, with a coefficient of determination () of 0.3. The correlation appears to be stronger for above -6.5. Stronger correlations have been reported between the non-thermal velocity and intensity of the Si IV line for the Quiet Sun by Chae et al. (1998). Solar simulations suggests that, depending on the magnetic field orientation, the observed correlation between non-thermal broadening and line intensity could be attributed to either shocks or turbulence (De Pontieu et al., 2015). It is however to be noted that these results are based on spatially resolved solar observations, which is not the same as the disk integrated stellar observations. Furthermore, unlike the Sun, where the correlation is for multiple observations of the same star, the correlation shown in Figure 6 is based on measurements taken for different cool stars. The stellar correlation could be due to different levels of magnetic activity, including short- and long-term variability.
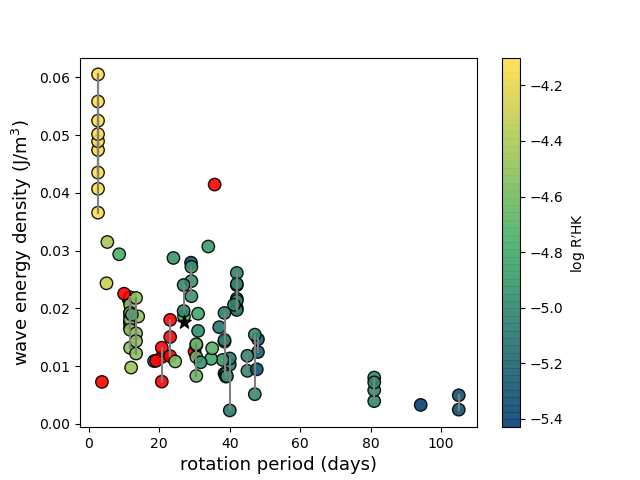
3.5 Alfvén wave energy vs stellar rotation
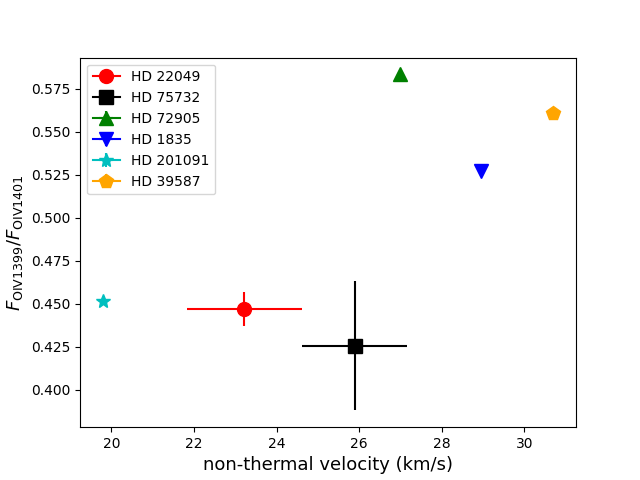
As discussed in Section 2.3, to determine the Alfvén wave energy density the mass density must also be known in addition to the non-thermal velocity measurements. We determined the O IV 1399/1401 flux ratio to estimate the mass density . The O IV lines are much weaker than the Si IV lines (Figure 9). Hence, the density estimates could be obtained for only six stars out of our entire sample (Table 2). As show in Figure 10, the line ratios lie close to the high-density limit of cm-3 in Figure 2 of Polito et al. (2016). Hence, we applied the solar mass density 333 of 21010 cm-3 (van der Holst et al., 2014) in equation 3 as a minimum density to determine the Alfvén wave energy density (Figure 11). Since the density remains the same for all stars the trend is same as the non-thermal velocity. A detailed density determination will help to shed light into the dependence of wave energy density on stellar properties.
| name | O IV 1399/1401 |
|---|---|
| HD 22049 | 0.45 |
| HD 75732 | 0.43 |
| HD 72905 | 0.58 |
| HD 1835 | 0.53 |
| HD 201091 | 0.45 |
| HD 39587 | 0.56 |
3.6 Non-thermal velocity vs emission line temperature
3.6.1 The Sun
The dependence of the solar non-thermal velocity on emission line temperature in spatially resolved solar measurements was extensively studied in the past (Doschek et al., 1976; Chae et al., 1998; Teriaca et al., 1999). In Figure 7 we include non-thermal velocities, determined using SUMER observations, from two such studies (Chae et al., 1998; Teriaca et al., 1999) and compare them to our Sun-as-a-star result determined from the Si IV 1393 Å line. To make comparison easier we also fit a second-order polynomial to the archival measurements, where green marks the fit obtained for Chae et al. (1998), purple marks the fit obtained for Teriaca et al. (1999), and black is the fit obtained for combined Chae et al. (1998) and Teriaca et al. (1999) measurements. Table 3 lists the equations of the polynomial fits.
| a | b | c | |
|---|---|---|---|
| QS fit C98 | -15.1 | 162.2 | -408.2 |
| AR fit T99 | -10.39 | 112.1 | -272.6 |
| QS fit T99 | -11.21 | 120.2 | -293.9 |
| fit all data | -13.06 | 140.3 | -348.6 |
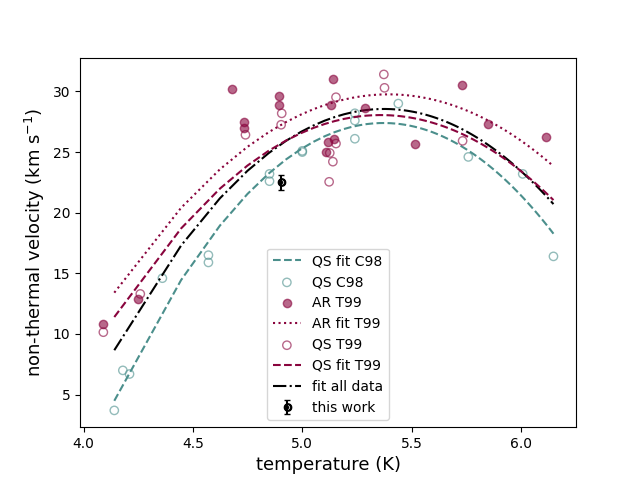
As shown in Figure 7, the solar non-thermal velocity increases with line temperature, peaks at around 100,000-200,000 K, and decreases towards higher temperatures. Figure 7 also shows that the AR measurements are consistently higher than the QS measurements. The QS non-thermal velocities from Chae et al. (1998) are weaker than the ones obtained by Teriaca et al. (1999), which could be due to different observing periods, and data reduction and analysis techniques. Despite this slight discrepancy the overall trend exhibited by both of these studies is very similar. Our Sun-as-star non-thermal velocity is on the lower end, closest to the QS value of Chae et al. (1998).
3.6.2 Sun-like stars
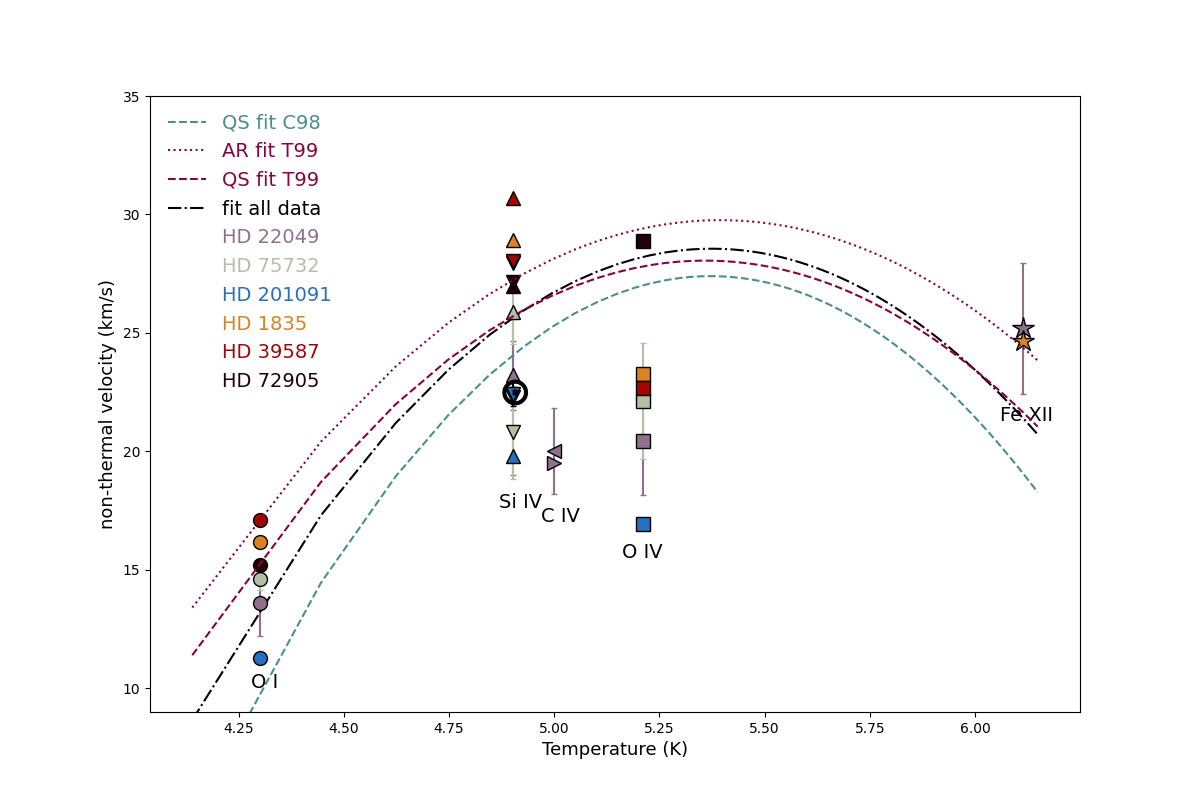
To determine the dependence of non-thermal velocity on emission line temperature in stars other than the Sun we analysed the seven emission lines discussed in Section 2.1 and determined the non-thermal broadening for six stars with appropriate wavelength coverage and good signal-to-noise ratios. Although six is a small number the stars vary in mass, age and rotation period, and include two older Sun-like stars 55 Cnc and 61 Cyg A, and four active young Sun-like stars UMa, Eri, 9 Cet and Ori. Two out of these six stars are known exoplanet hosts, 55 Cnc and Eri. Out of these six stars the non-thermal broadening in the C IV doublet could be determined for only one target, Eri, as this line was out of the wavelength coverage for the rest of the stars. Additionally, due to poor signal-to-noise ratio of the Fe XII line we could determine the non-thermal broadening in this line for two out of the six stars, Eri and 9 Cet. The O I, Si IV, and the O IV lines could be analysed for all six stars.
Figure 8 shows the non-thermal broadening vs emission line temperature for the six stars discussed above, where each star is represented by a single colour. Similar to the solar case, the stellar non-thermal velocities exhibit a clear dependence on emission line temperature. The non-thermal velocity is the lowest in the chromosphere (20000 K) and the highest at the transition region. However, unlike the Sun where the peak occurs between 100,000-200,000 K, in almost all stars the non-thermal velocity peaks at a lower temperature of 80,000 K. HD72905 or UMa is the only star analysed in this work where the non-thermal velocity peak is similar to the Sun. The other young solar analogues in the sample do not exhibit the same trend. A similar analysis by Pagano et al. (2004) on HST STIS spectra of the moderately active star Cen A showed that its non-thermal velocity peaks at a similar temperature to the Sun. This suggests that the discrepancy between the solar and stellar non-thermal velocity peaks, seen in Figure 8, might not be related to spatial scales and instrument used, but could be due to differences in the underlying physical processes that causes the non-thermal broadening in these lines.
As discussed previously, the non-thermal broadening of emission lines is due to mechanisms such as, Alfvén waves, turbulence, shocks, flares, and re-connection events. It is now widely accepted that Alfvén waves are the dominant transport mechanism in the Sun. Based on the relationship between the non-thermal velocity and emission line temperature in UMa and Cen A, it is reasonable to assume that the energy transport processes in these two stars are very similar to the Sun. This provides a strong justification to the suitability of Alfvén wave driven models for wind simulations in stars like UMa and Cen A.
For some stars, however, the non-thermal velocity peak at 80,000 K indicates that a majority of the Alfvén waves are either dissipating at lower temperatures than the Sun, or processes other than Alfvén waves are contributing towards the non-thermal broadening for the Si IV line at 80,000 K. As an example, the Eri observations used in this work are taken from the HST archive and some of these observations are impacted by flares (Loyd et al., 2022). It is however difficult to judge how extreme events such as flares impact the non-thermal broadening of the interface region emission lines from these observations alone. A detailed study of these emission lines at different levels of solar activity, including and excluding large flare events could help shed further light into this problem.
4 Summary and conclusion
We analysed HST COS and IRIS archival spectra to determine the non-thermal velocity of cool Sun-like stars by measuring the non-thermal broadening in the Si IV line for 56 stars including the Sun.
To determine the non-thermal velocity of the Sun we used full-disc mosaics of IRIS, which can be compared to disk-integrated stellar observations. The non-thermal velocities obtained this work are in good agreement with results obtained from spatially resolved observations of the quiet Sun and also with other Sun-like stars that have similar spectral type and rotation period. We also detect a weak correlation between the solar non-thermal velocity and the sunspot numbers.
The Si IV 1393 Å line profile was also used to determine the non-thermal velocity of 55 other Sun-like stars, the majority of which are exoplanet hosts. The non-thermal velocity shows a clear dependence on rotation, where an increase in rotation rate is followed by an increase in non-thermal velocity. We also determined the Alfvén wave energy density, assuming that the non-thermal broadening is caused by the presence of transverse Alfvén waves. By applying the solar plasma density in the transition region as a representative minimum value for cool stars, our results show that the Alfvén wave energy density follows the same trend as the non-thermal velocity. Since the Alfvén wave energy density is an important input parameter for state-of-the-art stellar wind models such as AWSoM (van der Holst et al., 2014), these results provide, for the first time, a data-driven way to constrain the wave energy in such models, and thus help us scale the models for stars with different rotation periods. However, detailed density determination in cool stars is still needed to fully exploit the diagnostic capabilities of the emission lines discussed here.
Finally, we investigated the relationship between non-thermal broadening and emission line temperature using seven emission lines with temperatures ranging from from the chromosphere to the lower corona.This part of the analysis could be only applied to a limited sample size of six stars due to signal-to-noise ratio constraints. In the Sun the non-thermal velocity increases with temperature, peaking at around 100,000-200,000 K and decreases towards coronal temperatures. Our results show that in cool stars the global trend for non-thermal velocity vs emission line temperature is very similar to the Sun, however the non-thermal velocity peaks at a lower temperature for some stars. This suggests that, in some cool stars, either a majority of the Alfvén energy is dissipated at a lower temperature in the transition region, or other processes, such as flares could contribute strongly towards the non-thermal broadening at low temperatures. To obtain a better understanding of the contribution of Alfvén waves and energetic events such as flares, detailed investigations of the Sun and stars using emission lines formed at different interface region temperatures is required.
References
- Airapetian et al. (2017) Airapetian, V. S., Glocer, A., Khazanov, G. V., et al. 2017, ApJ, 836, L3
- Airapetian et al. (2000) Airapetian, V. S., Ofman, L., Robinson, R. D., Carpenter, K., & Davila, J. 2000, ApJ, 528, 965
- Anderson et al. (2014) Anderson, D. R., Collier Cameron, A., Delrez, L., et al. 2014, MNRAS, 445, 1114
- Anglada-Escudé et al. (2012) Anglada-Escudé, G., Arriagada, P., Vogt, S. S., et al. 2012, ApJ, 751, L16
- Anglada-Escudé et al. (2013) Anglada-Escudé, G., Tuomi, M., Gerlach, E., et al. 2013, A&A, 556, A126
- Astudillo-Defru et al. (2017) Astudillo-Defru, N., Delfosse, X., Bonfils, X., et al. 2017, A&A, 600, A13
- Ayres et al. (2021) Ayres, T., De Pontieu, B., & Testa, P. 2021, ApJ, 916, 36
- Ayres & France (2010) Ayres, T., & France, K. 2010, ApJ, 723, L38
- Ayres (2015) Ayres, T. R. 2015, AJ, 150, 7
- Bakos et al. (2010) Bakos, G. Á., Torres, G., Pál, A., et al. 2010, ApJ, 710, 1724
- Banerjee et al. (1998) Banerjee, D., Teriaca, L., Doyle, J. G., & Wilhelm, K. 1998, A&A, 339, 208
- Bochanski et al. (2018) Bochanski, J. J., Faherty, J. K., Gagné, J., et al. 2018, AJ, 155, 149
- Boisse et al. (2012) Boisse, I., Pepe, F., Perrier, C., et al. 2012, A&A, 545, A55
- Boland et al. (1975) Boland, B. C., Dyer, E. P., Firth, J. G., et al. 1975, MNRAS, 171, 697
- Bonfils et al. (2005) Bonfils, X., Forveille, T., Delfosse, X., et al. 2005, A&A, 443, L15
- Bonfils et al. (2012) Bonfils, X., Gillon, M., Udry, S., et al. 2012, A&A, 546, A27
- Boro Saikia et al. (2016) Boro Saikia, S., Jeffers, S. V., Morin, J., et al. 2016, A&A, 594, A29
- Boro Saikia et al. (2018) Boro Saikia, S., Marvin, C. J., Jeffers, S. V., et al. 2018, A&A, 616, A108
- Bouchy et al. (2005) Bouchy, F., Udry, S., Mayor, M., et al. 2005, A&A, 444, L15
- Bourrier et al. (2018) Bourrier, V., Ehrenreich, D., Lecavelier des Etangs, A., et al. 2018, A&A, 615, A117
- Butler et al. (2006) Butler, R. P., Johnson, J. A., Marcy, G. W., et al. 2006, PASP, 118, 1685
- Butler et al. (2001) Butler, R. P., Tinney, C. G., Marcy, G. W., et al. 2001, ApJ, 555, 410
- Cenarro et al. (2007) Cenarro, A. J., Peletier, R. F., Sánchez-Blázquez, P., et al. 2007, MNRAS, 374, 664
- Chae et al. (1998) Chae, J., Schühle, U., & Lemaire, P. 1998, ApJ, 505, 957
- Cheung et al. (2015) Cheung, M. C. M., De Pontieu, B., Tarbell, T. D., et al. 2015, ApJ, 801, 83
- Cranmer et al. (2007) Cranmer, S. R., van Ballegooijen, A. A., & Edgar, R. J. 2007, ApJS, 171, 520
- Cranmer & Winebarger (2019) Cranmer, S. R., & Winebarger, A. R. 2019, ARA&A, 57, 157
- Cutispoto et al. (2002) Cutispoto, G., Pastori, L., Pasquini, L., et al. 2002, A&A, 384, 491
- De Pontieu et al. (2015) De Pontieu, B., McIntosh, S., Martinez-Sykora, J., Peter, H., & Pereira, T. M. D. 2015, ApJ, 799, L12
- De Pontieu et al. (2014) De Pontieu, B., Title, A. M., Lemen, J. R., et al. 2014, Sol. Phys., 289, 2733
- De Pontieu et al. (2021) De Pontieu, B., Polito, V., Hansteen, V., et al. 2021, Sol. Phys., 296, 84
- Delfosse et al. (2013) Delfosse, X., Bonfils, X., Forveille, T., et al. 2013, A&A, 553, A8
- Dere & Mason (1993) Dere, K. P., & Mason, H. E. 1993, Sol. Phys., 144, 217
- Doschek et al. (1976) Doschek, G. A., Feldman, U., Vanhoosier, M. E., & Bartoe, J. D. F. 1976, ApJS, 31, 417
- Endl et al. (2008) Endl, M., Cochran, W. D., Wittenmyer, R. A., & Boss, A. P. 2008, ApJ, 673, 1165
- Feng et al. (2015) Feng, Y. K., Wright, J. T., Nelson, B., et al. 2015, ApJ, 800, 22
- France et al. (2018) France, K., Arulanantham, N., Fossati, L., et al. 2018, ApJS, 239, 16
- Froning & Green (2009) Froning, C. S., & Green, J. C. 2009, Ap&SS, 320, 181
- Gáspár et al. (2016) Gáspár, A., Rieke, G. H., & Ballering, N. 2016, ApJ, 826, 171
- Hojjatpanah et al. (2020) Hojjatpanah, S., Oshagh, M., Figueira, P., et al. 2020, A&A, 639, A35
- Keenan et al. (2002) Keenan, F. P., Ahmed, S., Brage, T., et al. 2002, MNRAS, 337, 901
- Kervella et al. (2019) Kervella, P., Arenou, F., Mignard, F., & Thévenin, F. 2019, A&A, 623, A72
- Kervella et al. (2008) Kervella, P., Mérand, A., Pichon, B., et al. 2008, A&A, 488, 667
- Kislyakova et al. (2014) Kislyakova, K. G., Johnstone, C. P., Odert, P., et al. 2014, A&A, 562, A116
- Kjeldseth Moe & Nicolas (1977) Kjeldseth Moe, O., & Nicolas, K. R. 1977, ApJ, 211, 579
- Kochukhov et al. (2020) Kochukhov, O., Hackman, T., Lehtinen, J. J., & Wehrhahn, A. 2020, A&A, 635, A142
- Kopytova et al. (2016) Kopytova, T. G., Brandner, W., Tognelli, E., et al. 2016, A&A, 585, A7
- Lin & Carlsson (2015) Lin, H.-H., & Carlsson, M. 2015, ApJ, 813, 34
- Linsky & Wood (1994) Linsky, J. L., & Wood, B. E. 1994, ApJ, 430, 342
- Lionello et al. (2014) Lionello, R., Velli, M., Downs, C., Linker, J. A., & Mikić, Z. 2014, ApJ, 796, 111
- Loyd et al. (2022) Loyd, R. O. P., Mason, J., Jin, M., et al. 2022, arXiv e-prints, arXiv:2207.05115
- Mariska (1992) Mariska, J. T. 1992, The Solar Transition Region
- Martínez-Sykora et al. (2011) Martínez-Sykora, J., De Pontieu, B., Hansteen, V., & McIntosh, S. W. 2011, ApJ, 732, 84
- Mayor et al. (2004) Mayor, M., Udry, S., Naef, D., et al. 2004, A&A, 415, 391
- McDonald et al. (2012) McDonald, I., Zijlstra, A. A., & Boyer, M. L. 2012, MNRAS, 427, 343
- Muirhead et al. (2018) Muirhead, P. S., Dressing, C. D., Mann, A. W., et al. 2018, AJ, 155, 180
- Nielsen et al. (2019) Nielsen, E. L., De Rosa, R. J., Macintosh, B., et al. 2019, AJ, 158, 13
- Pagano et al. (2004) Pagano, I., Linsky, J. L., Valenti, J., & Duncan, D. K. 2004, A&A, 415, 331
- Palle et al. (2020) Palle, E., Nortmann, L., Casasayas-Barris, N., et al. 2020, A&A, 638, A61
- Passegger et al. (2020) Passegger, V. M., Schweitzer, A., Shulyak, D., et al. 2020, A&A, 634, C2
- Pavlenko et al. (2019) Pavlenko, Y. V., Kaminsky, B. M., Jenkins, J. S., et al. 2019, A&A, 621, A112
- Peacock et al. (2019) Peacock, S., Barman, T., Shkolnik, E. L., et al. 2019, ApJ, 886, 77
- Pepe et al. (2011) Pepe, F., Lovis, C., Ségransan, D., et al. 2011, A&A, 534, A58
- Peter (2001) Peter, H. 2001, A&A, 374, 1108
- Peter (2006) —. 2006, A&A, 449, 759
- Peter et al. (2014) Peter, H., Tian, H., Curdt, W., et al. 2014, Science, 346, 1255726
- Phillips et al. (2008) Phillips, K. J. H., Feldman, U., & Landi, E. 2008, Ultraviolet and X-ray Spectroscopy of the Solar Atmosphere
- Polito et al. (2016) Polito, V., Del Zanna, G., Dudík, J., et al. 2016, A&A, 594, A64
- Poppenhaeger et al. (2010) Poppenhaeger, K., Robrade, J., & Schmitt, J. H. M. M. 2010, A&A, 515, A98
- Reeves (1976) Reeves, E. M. 1976, Sol. Phys., 46, 53
- Reiners et al. (2012) Reiners, A., Joshi, N., & Goldman, B. 2012, AJ, 143, 93
- Réville et al. (2020) Réville, V., Velli, M., Panasenco, O., et al. 2020, ApJS, 246, 24
- Robertson et al. (2012) Robertson, P., Endl, M., Cochran, W. D., et al. 2012, ApJ, 749, 39
- Robinson et al. (1996) Robinson, R. D., Airapetian, V. S., Maran, S. P., & Carpenter, K. G. 1996, ApJ, 469, 872
- Rosén et al. (2016) Rosén, L., Kochukhov, O., Hackman, T., & Lehtinen, J. 2016, A&A, 593, A35
- Sakaue & Shibata (2021) Sakaue, T., & Shibata, K. 2021, ApJ, 919, 29
- Santos et al. (2004) Santos, N. C., Israelian, G., & Mayor, M. 2004, A&A, 415, 1153
- Santos et al. (2002) Santos, N. C., Mayor, M., Naef, D., et al. 2002, A&A, 392, 215
- Schöfer et al. (2019) Schöfer, P., Jeffers, S. V., Reiners, A., et al. 2019, A&A, 623, A44
- Schweitzer et al. (2019) Schweitzer, A., Passegger, V. M., Cifuentes, C., et al. 2019, A&A, 625, A68
- Shoda et al. (2019) Shoda, M., Suzuki, T. K., Asgari-Targhi, M., & Yokoyama, T. 2019, ApJ, 880, L2
- Shulyak et al. (2017) Shulyak, D., Reiners, A., Engeln, A., et al. 2017, Nature Astronomy, 1, 0184
- Silva-Valio (2008) Silva-Valio, A. 2008, ApJ, 683, L179
- Suzuki & Inutsuka (2006) Suzuki, T. K., & Inutsuka, S.-I. 2006, Journal of Geophysical Research (Space Physics), 111, A06101
- Teriaca et al. (1999) Teriaca, L., Banerjee, D., & Doyle, J. G. 1999, A&A, 349, 636
- Terrien et al. (2015) Terrien, R. C., Mahadevan, S., Deshpande, R., & Bender, C. F. 2015, ApJS, 220, 16
- Testa et al. (2016) Testa, P., De Pontieu, B., & Hansteen, V. 2016, ApJ, 827, 99
- Tousey et al. (1973) Tousey, R., Bartoe, J. D. F., Bohlin, J. D., et al. 1973, Sol. Phys., 33, 265
- Valenti & Fischer (2005) Valenti, J. A., & Fischer, D. A. 2005, ApJS, 159, 141
- van der Holst et al. (2014) van der Holst, B., Sokolov, I. V., Meng, X., et al. 2014, ApJ, 782, 81
- von Braun et al. (2011) von Braun, K., Boyajian, T. S., Kane, S. R., et al. 2011, ApJ, 729, L26
- von Braun et al. (2014) von Braun, K., Boyajian, T. S., van Belle, G. T., et al. 2014, MNRAS, 438, 2413
- Wilhelm et al. (1995) Wilhelm, K., Curdt, W., Marsch, E., et al. 1995, Sol. Phys., 162, 189
- Wittenmyer et al. (2014) Wittenmyer, R. A., Tuomi, M., Butler, R. P., et al. 2014, ApJ, 791, 114
- Wood et al. (1997) Wood, B. E., Linsky, J. L., & Ayres, T. R. 1997, ApJ, 478, 745
- Wright et al. (2011) Wright, N. J., Drake, J. J., Mamajek, E. E., & Henry, G. W. 2011, ApJ, 743, 48
- Young et al. (2018) Young, P. R., Keenan, F. P., Milligan, R. O., & Peter, H. 2018, ApJ, 857, 5
- Youngblood et al. (2017) Youngblood, A., France, K., Loyd, R. O. P., et al. 2017, ApJ, 843, 31
Appendix A Absolute flux densities
Appendix B Alfvén wave energy density
Appendix C IRIS observations included in A21
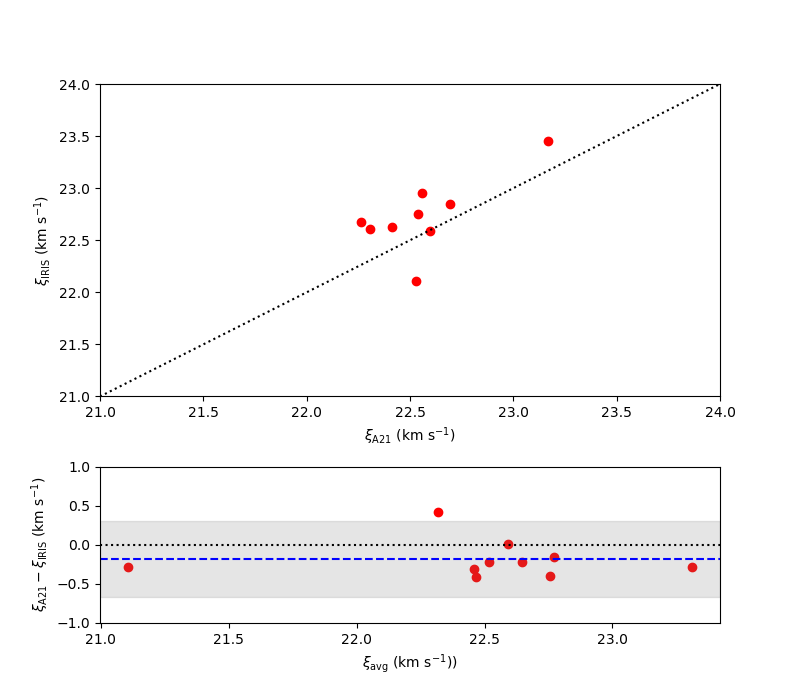
In order to determine how individual observations are impacted by the data processing step of A21 we compared the A21 observations (data-set A) with IRIS observations that didn’t go through the additional data-processing steps of A21 (data-set B). The non-thermal velocities obtained from these two data-sets are listed in Table 4. Figure 12 shows a comparison plot between these two data-sets, including a mean-difference plot. The top plot in Figure 12 shows that all except one measurement in data-set B are slightly higher than the values obtained from data-set A. Overall, no significant difference is detected between the two data-sets, as shown by the bottom plot in Figure 12 where the bias or the average difference between the two data-sets is close to zero and all except one measurement falls inside the limits of agreement (bias ).
| date | ||
|---|---|---|
| year/month/day | km s-1 | km s-1 |
| 2013/10/27 | 21.1 | 21.4 |
| 2014/03/17 | 22.4 | 22.9 |
| 2014/03/24 | 22.5 | 22.9 |
| 2015/04/01 | 23.3 | 23.7 |
| 2015/10/18 | 22.7 | 23.2 |
| 2017/10/21 | 22.8 | 23.1 |
| 2018/08/25 | 22.7 | 23.0 |
| 2019/04/13 | 22.4 | 22.9 |
| 2019/05/05 | 22.7 | 22.8 |
| 2019/09/12 | 22.6 | 22.4 |