Proposed host galaxies of repeating fast radio burst sources detected by CHIME/FRB
Abstract
We present a search for host galaxy associations for the third set of repeating fast radio burst (FRB) sources discovered by the CHIME/FRB Collaboration. Using the 1 arcmin CHIME/FRB baseband localizations and probabilistic methods, we identify potential host galaxies of two FRBs, 20200223B and 20190110C at redshifts of 0.06024(2) and 0.12244(6), respectively. We also discuss the properties of a third marginal candidate host galaxy association for FRB 20191106C with a host redshift of 0.10775(1). The three putative host galaxies are all relatively massive, fall on the standard mass-metallicity relationship for nearby galaxies, and show evidence of ongoing star formation. They also all show signatures of being in a transitional regime, falling in the “green valley” which is between the bulk of star-forming and quiescent galaxies. The plausible host galaxies identified by our analysis are consistent with the overall population of repeating and non-repeating FRB hosts while increasing the fraction of massive and bright galaxies. Coupled with these previous host associations, we identify a possible excess of FRB repeaters whose host galaxies have colors redder than the bulk of star-forming galaxies. Additional precise localizations are required to confirm this trend.
1 Introduction
Over 600 short-duration energetic radio pulses known as fast radio bursts (FRBs; Lorimer et al., 2007) have been reported111https://www.chime-frb.ca/catalog (CHIME/FRB Collaboration et al., 2021; Nimmo et al., 2023). Multiple FRBs that are coincident in sky location and dispersion measure (DM)—“FRB repeaters”, are particularly interesting since they provide more opportunities for detailed follow-up studies. While we do not yet know whether repeaters and one-off FRBs are two separate classes, the existence of repeaters demonstrates that the progenitors of at least some FRBs are not cataclysmic (for a review of FRB models, see Platts et al. 2019). Recently, the magnetar theory for FRBs (Beloborodov, 2017; Metzger et al., 2019) was confirmed as one possible origin of FRB with the discovery of a very luminous FRB-like burst from the Galactic magnetar SGR (CHIME/FRB Collaboration et al., 2020; Bochenek et al., 2020). However, it remains the only FRB source confirmed to be a magnetar, emphasizing the need for additional probe of their nature.
The host galaxies of various types of transients have often provided useful insight into their origins—allowing constraints on the ages and physical properties required to produce them (e.g., Eftekhari et al., 2019, 2021). To date, approximately 34 FRBs have been localized to their host galaxies (e.g., Chatterjee et al., 2017; Bhandari et al., 2020; Heintz et al., 2020; Bhandari et al., 2021; Bhardwaj et al., 2021b; Niu et al., 2021; Bhandari et al., 2022a; Michilli et al., 2022; Rajwade et al., 2022; Gordon et al., 2023; Sharma et al., 2023; Jankowski et al., 2023). This is due to the difficulty of pinpointing FRBs within the arcsecond precision required for robust host associations (Eftekhari & Berger, 2017) and multi-wavelength follow-up (e.g., Scholz et al., 2017). The host populations of both repeating and non-repeating FRBs have diverse properties (star-forming/quiescent, low/high metallicity, massive/dwarf, spiral/elliptical) (e.g., Heintz et al., 2020; Bhandari et al., 2021, 2022b) and it is not clear what type of host is preferred by repeaters. While the nature and the origin of repeating FRBs are still debated, finding more host galaxies will provide insights into the origin of the FRB population. In addition to understanding the nature of FRBs, FRBs with known host galaxies are useful cosmological probes because the relationship between their DMs and redshifts could give insight into the missing baryons in the intergalactic medium (IGM) (Macquart et al., 2020).
Recently, the Canadian Hydrogen Intensity Mapping Experiment Fast Radio Burst (CHIME/FRB) project (CHIME/FRB Collaboration et al., 2018) published 25 new repeaters and a further 14 candidates as described by CHIME/FRB Collaboration et al. (2023). This supplements 21 previously published CHIME/FRB repeaters (CHIME/FRB Collaboration et al., 2019a, b; Fonseca et al., 2020; Bhardwaj et al., 2021a; Lanman et al., 2022; Mckinven & CHIME/FRB Collaboration, 2022), all of which are observed in the frequency range 400–800 MHz. This sample represents by far the largest population of repeaters detected by a single survey to date and thus offers the opportunity to learn about various properties of the FRB population. CHIME/FRB repeaters show a lower average dispersion measure than those of apparently non-repeating sources (CHIME/FRB Collaboration et al., 2023) even though this could be a selection effect (see Connor et al., 2020).
Other previously established characteristic properties of repeaters such as wider bursts and narrower emitting bandwidths than non-repeating FRBs were confirmed in the additional set of repeaters (CHIME/FRB Collaboration et al., 2021; Pleunis et al., 2021). These observational differences could signal a distinct astrophysical origin for repeaters. Additional multi-wavelength studies with a larger sample, including host galaxy identification, could help to disentangle potential multiple populations.
Typically, robust host associations require 1 arcsecond localizations for the FRBs, and hence detection of a burst with interferometers (Eftekhari & Berger, 2017). Indeed, some FRB repeaters (e.g., FRB 20180916B and 20201124A; Marcote et al. 2020, Nimmo et al. 2022) discovered by CHIME/FRB have subsequently been associated with their host galaxies by means of very long-baseline interferometry (VLBI). However, arcsecond localizations are not available for most CHIME/FRB bursts. At best, CHIME/FRB can achieve 1 arcminute localization for bursts when baseband data are recorded. CHIME/FRB baseband data are channelized raw voltages of the FRB signals from the telescope feeds. Localizations with precision 1 arcminute using baseband data from CHIME/FRB can be obtained following the techniques described by Michilli et al. (2021). While these baseband positions are larger than the size of a typical galaxy in the sky, for objects in the relatively nearby universe, it is possible to make probable host galaxy associations due to the low density of galaxies at lower redshifts. This technique has previously been used to associate five FRBs detected by CHIME/FRB with likely hosts: FRBs 20200120E (Bhardwaj et al., 2021a), 20181030A (Bhardwaj et al., 2021b), 20220912A (Mckinven & CHIME/FRB Collaboration, 2022), 20180814A, and 20190303A (Michilli et al., 2022) and the reliability of the method was supported by the eventual VLBI confirmation of the host galaxies for FRB 20200120E (Kirsten et al., 2021).
Future telescopes such as the CHIME/FRB Outrigger project (currently under construction) will be able to improve the number of precisely localized FRBs (Leung et al., 2021; Mena-Parra et al., 2022; Cassanelli et al., 2022). Other such facilities include the Real-time fast transients at the Karl Janskly Very Large Array (realfast VLA; Law et al., 2018), the fast radio transient-detection program at MeerKAT (MeerTRAP; Rajwade et al., 2022), and the Deep Synoptic Array (DSA-110; Ravi et al., 2022). Until sub-arcseconds localization is possible for CHIME/FRB events, the baseband position remains a useful technique for associating local universe FRBs to their host galaxies (Michilli et al., 2022).
In this paper, we perform a search for likely host galaxies for 20 repeaters and 3 repeater candidates from the recently published sample by CHIME/FRB Collaboration et al. (2023) for which arcmin baseband localization were available. In total, we identify highly probable hosts for two FRBs and one marginally significant candidate host for a third. A thorough description of our search for the probable hosts of the events is described in §2 and details of the observations of likely hosts are explained in §3. The observed and inferred properties of the hosts are described in §4 including a comparison between the three hosts and previously known hosts of FRBs in §4.5. Finally, we summarize the result of the host associations in §5.
2 Search for Probable Host Galaxies
Here we describe the process used to search for probable host galaxies to the CHIME/FRB repeaters. Specifically, after describing our initial sample (§2.1), we determine the maximum redshift for each FRB based on its DM (§2.2), search archival optical catalogs for galaxies within the localization regions for each burst (§2.3), and perform a probability of chance coincidence analysis (§2.4). Finally, we summarize these results for three galaxies identified as potential hosts to CHIME repeating FRBs in §2.5.
2.1 Initial FRB Sample
Of the 25 ‘gold’ and 14 ‘silver’ repeating FRBs presented by CHIME/FRB Collaboration et al. (2023), we first restrict ourselves to objects that have baseband localizations for multiple bursts because of their small localization uncertainties. This criterion is met for 20 gold and 3 silver candidates. From there, we continue the analysis with events that are in the survey coverage area of either the Sloan Digital Sky Survey (SDSS) DR12 (Alam et al., 2015) or Dark Energy Spectroscopy Instrument (DESI), Data Release 9 (DR9) (Dey et al., 2019) Legacy Imaging Survey photometric catalog, as these are required to assess the population of possible host galaxies within the CHIME/FRB localizations regions. This reduced the sample list to the 12 gold and 1 silver (FRB 20190303D) candidates listed in Table 1.
| FRB Name | DM | DMMWc | zmax | d | Max e | Max e | mr,galf | g |
|---|---|---|---|---|---|---|---|---|
| (pc cm-3) | (pc cm-3) | (AB mag) | ||||||
| FRB 20200223B | 201.8(4) | 45.6 | 0.19 | 7 | 0.994 | 0.899 | 16.08 | 0.010 |
| FRB 20191106C | 332.2(7) | 25.0 | 0.36 | 11 | 0.951 | 0.815 | 17.31 | 0.063 |
| FRB 20190110C | 221.6(1.6) | 37.1 | 0.22 | 9 | 0.918 | 0.779 | 18.00 | 0.102 |
| FRB 20190804E | 363.2(3) | 43.4 | 0.37 | 9 | 0.638 | 0.549 | 19.13 | 0.305 |
| FRB 20200118D | 625.7(1.4) | 76.6 | 0.62 | 14 | 0.619 | 0.520 | 19.71 | 0.491 |
| FRB 20201114A | 321.1(8) | 37.8 | 0.33 | 60 | 0.537 | 0.454 | 17.68 | 0.469 |
| FRB 20200913C | 574.2(1.6) | 47.8 | 0.60 | 74 | 0.490 | 0.407 | 17.87 | 0.600 |
| FRB 20200929C | 413.3(3) | 38.4 | 0.44 | 41 | 0.474 | 0.388 | 17.04 | 0.144 |
| FRB 20191013D | 524.1(6.5) | 43.1 | 0.55 | 111 | 0.465 | 0.396 | 17.49 | 0.401 |
| FRB 20190609Ca | 479.2(3) | 113.4 | 0.43 | 3 | 0.409 | 0.354 | 22.58 | 0.745 |
| FRB 20201221B | 509.5(1.1) | 50.9 | 0.53 | 45 | 0.210 | 0.175 | 19.48 | 0.686 |
| FRB 20190303Db | 716.6(1.6) | 36.5 | 0.77 | 28 | 0.118 | 0.098 | 20.55 | 0.750 |
| FRB 20200619A | 439.6(0.4) | 50.8 | 0.45 | 350 | 0.080 | 0.067 | 18.18 | 0.753 |
Notes:
a PATH probability using the SDSS list of host candidates while others used the DESI list of host candidates.
b This is the only silver candidate in our sample. The rest of the candidates are from the gold sample.
c DM contribution expected for the disk of the Milky Way from the NE2001 model (Cordes & Lazio, 2002).
d is the number of extended optical objects detected in the FRB 90% error region.
e Max is the maximum probability estimated by PATH for each FRB region given two different priors, and . FRBs are ordered in the decreasing order of Max .
f mr,gal(AB) is the r-band AB magnitude of the plausible host of the FRB as identified by PATH.
g is the probability of finding a galaxy with the r-band magnitude of the most probable host or brighter (mr,gal) within each FRB 90% error region.
2.2 Determination of zmax
To begin, we calculate the maximum redshift for each FRB in our sample. This is possible because the DM measured for each burst gives us an integrated column density of electrons along the line of sight. This DM will contain contributions from materials in the Milky Way (MW) disk and halo, the inter-galactic medium (IGM), the host galaxy interstellar medium (ISM), and potentially the local material around the FRB. However, if electrons in the IGM are the dominant contribution, the DM of FRBs is approximately linearly related to redshift.
For each of the FRBs in Table 1, we determine the maximum redshift using DMs taken from CHIME/FRB Collaboration et al. (2023). To do this, we subtract the DM contribution expected for the disk of the Milky Way from the NE2001 model (Cordes & Lazio, 2002), DMMW(NE2001), but do not attempt to correct for contributions from either the MW halo (DMhalo) or the FRB host galaxy (DMhost).
This method provides us with a conservative estimate for the “excess” DM associated with each burst (DMexcess). We then calculate the maximum redshift, zmax for each repeater event by attributing this entire DMexcess to the IGM using the FRUITBAT software (Batten, 2019). FRUITBAT uses the given DM to estimate the maximum redshift given the cosmology of Komatsu et al. (2009) and the DM-redshift relationship of Zhang (2018). In Table 1, we list the DM, DMMW(NE2001), and zmax for all bursts in our sample. The derived zmax values span 0.19 zmax 0.77.
We acknowledge that this method is different from that described by Bhardwaj et al. (2021a) and used in other CHIME/FRB papers. However, we emphasize that zmax is not utilized in the probabilistic analysis below. We consider all galaxies in the field of the FRB. Rather, zmax is only used to ensure that any individual host with a high probability of association has z < zmax (see Section 2.5). However, using the method described by Bhardwaj et al. (2021a) does not change the set of possible host galaxies. We, therefore, opt for the most conservative approach.
2.3 Optical Galaxy Catalog Search
We searched the SDSS and DESI catalogs for host galaxy candidates within the 90%-confidence baseband positions of the FRBs. For 12 of the 13 events that are in the survey coverage area of both DESI and SDSS, we adopted the DESI catalog which is more sensitive to fainter sources (r-band 5 depths of 23.4 mag), while the SDSS catalog (r-band 5 depths of 22.7 mag) was used to analyze FRB 20190609C. The impact of completeness in these catalogs, especially for faint galaxies, will be discussed below. To identify likely host galaxies, we first exclude any object classified as a point source within the SDSS or DESI catalogs. Multiple extended sources were found within the 90%-confidence positional error region for each FRB. We record the number of extended objects within the localization regions for each FRB as in Table 1.
2.4 Host Probability Analysis
We use two complementary methods to assess the likelihood that a galaxy within the CHIME/FRB error region can be robustly associated with a host galaxy. We use the result of these methods together to decide on when/whether likely host associations can be made.
First method: First, for cases where more than one galaxy was identified in DESI/SDSS imaging, we analyze the probability of each being associated with the FRB using the formalism described in the Probabilistic Association of Transients to their Hosts (PATH) software (Aggarwal et al., 2021). PATH takes as input the FRB position and its uncertainty, and the r-band magnitudes and half-light radii of all candidate galaxies. It then calculates a probability for each galaxy using Bayes’ theorem and accounting for the FRB localization error region. We initially adopt priors that assume (i) the probability that each candidate galaxy is the host and is inversely proportional to the angular surface density of galaxies with magnitudes equal to or brighter than the candidate’s magnitude (based on galaxy counts from Driver et al. 2016), (ii) the probability of finding the host galaxy of the FRB at a given physical offset is an exponentially declining function, and (iii) that the probability that the true host was undetected, , was zero (). The impact of adjusting this final assumption on the resultant probabilities is examined below, as well as how reasonable the assumption is given the depth of the DESI/SDSS surveys at the maximum redshifts of specific bursts (see § 2.5). For the CHIME/FRB host candidates described above, we obtained the half-light radii in arcseconds from DESI and used the Petrosian radius instead in the absence of a half-light radius for the FRB with only SDSS data.
Applying the PATH framework, we obtain a probability of associating the FRB with each of the candidates identified in its localization region and report the highest probability value, Max in Table 1. In total, we find three FRBs where the maximum PATH probability () for the case is 90%. Given that we initially ran PATH adopting a probability of zero that the true host was undetected (and hence not in our candidate list), this is effectively a statement that PATH significantly prefers one of the candidate hosts over all detected galaxies222The resulting PATH probabilities for all galaxies within these fields are given in Appendix A. For the remaining 10 FRBs, PATH gives a maximum probability to any individual galaxy of 75% even in the case that the probability of an undetected host is zero. For these cases, we argue that it is not possible to make a likely host association with current data, while the three FRBs with higher Max warrant further examination.
In particular, it is possible that some potential host galaxies were missing from our initial candidate lists. The DESI detection limit corresponds to an absolute r-band magnitude of 15.9 to 17.48 at redshifts between 0.19 and 0.36 (the range of values for the three bursts with the highest PATH probability hosts). At these depths, we are sensitive to galaxies fainter than 0.1L∗ including all of the superluminous supernova and long-duration gamma-ray burst host galaxies at 0.3 of Lunnan et al. (2014). However, some of the faintest dwarf galaxies, such as the Mr 16.5 host of FRB121102 (Chatterjee et al., 2017), could have eluded detection at the high-end of this distance range.
Given the possibility of undetected dwarf galaxies, we re-run PATH, now setting an arbitrary prior on the probability that the true host was undetected as (recommended by the authors of PATH). The results are also listed in Table 1. For one FRB, 20200223B, the galaxy with the maximum PATH probability is approximately 90%, while for the other two (20190110C, 20191106C), the maximum PATH probability falls to 82% 78%. We will further discuss the appropriateness of these values of P(U) for each of these specific FRBs—given our survey depth at their maximum distance—in Section 2.5.
Second method: Given that the appropriate value for for each burst is uncertain, we also calculate the probability that the galaxy most preferred by PATH would be found within the CHIME localization region for that FRB by chance. To calculate this probability of chance coincidence (), we use a Monte Carlo approach. Specifically, for each FRB, we query random patches of the sky within the SDSS footprint having the size of the FRB localization region for 1000 times. We used SDSS instead of DESI because it was easier to query the entire SDSS catalog multiple times for many error regions. We determine the number of galaxies within that patch that have r-band magnitudes brighter than or equal to that of the most probable host galaxy according to PATH (mr mr,gal). We then use the fractions of these runs that have at least one galaxy that meets this requirement to determine the probability that the most plausible identified host was within the FRB 90%-confidence localization region by chance. In Table 1, we list as well as the AB r-band magnitude (mr,gal) values for the preferred host of these FRBs.
We note that these values are most useful in cases where the maximum PATH probability is high. For example, while the galaxy with the highest PATH probability within the localization region of FRB 20200929C has a small of 14.4%, PATH only assigns a probability of 38 47% that this is the true host because there are two galaxies of similar brightness within the localization region. On the other hand, for three FRBs (20200223B, 20190110C, 20191106C) with maximum PATH probability at 90%, we calculate that there was a 10% chance that the preferred galaxy is located within the CHIME/FRB localization region by chance.
We emphasize that these values describe the probability that an individual galaxy would be located within an area the size of an individual FRB localization region. They do not account for “look-elsewhere” effects associated with the fact that we have searched multiple CHIME/FRB localization regions as part of this overall study. If we instead perform our Monte Carlo analysis considering a region with the combined area of all 13 FRBs listed in Table 1, we find that: (i) in 71.7% of trials, there is at least one galaxy with (the SDSS magnitude of the preferred host for FRB 20200223B), (ii) in 72.9% of trials, there are at least 3 galaxies with (the SDSS magnitude of the preferred host for FRB 20191106C), and (iii) in 73.6% of trials, there are at least 8 galaxies with (the SDSS magnitude of the preferred host for FRB 20190110C). For cases (ii) and (iii), we quote values for at least 3 and 8 galaxies, respectively, because that was the total number of galaxies with those brightnesses found in the combined localization regions of all 13 FRBs. These numbers indicate that although there is a relatively low of finding a bright galaxy in the localization region of an individual FRB (e.g. for FRB 20200223B). When considering the search region as a whole, we do not see evidence for a strong overabundance of bright galaxies within the combined 13 CHIME/FRB repeaters regions. This implies that we cannot make associations for our galaxies using based on galaxy number counts alone.
2.5 Summary of Possible Host Associations
In the analysis above, we identified three galaxies that we felt were worthy of further investigation due to PATH strongly preferring an individual galaxy over any other source detected in the field. We found that when “look-elsewhere” effects were considered, there is not a strong overabundance of bright galaxies ( mag) within the 13 combined CHIME/FRBs localization regions. However, if we assume that FRBs must come from galaxies, then the Bayesian approach of PATH—which takes into account not only galaxy number counts but also information on transients offsets—offers a means to robustly consider the relative probabilities of possible hosts for an individual FRB. We, therefore, rely primarily on the PATH analysis. Here, we synthesize information available for the three galaxies necessary to infer whether a likely host association can be made.
FRB 20200223B: There are seven extended sources in the DESI catalog in the field of FRB 20200223B. These are marked as green boxes in the left panel of Figure 1, and have apparent -band magnitudes in the range 16.08 mr 23.97. The morphology of Source 1 suggests a spiral galaxy while sources 2-7 are faint objects in the field. Of these, Source 1 (SDSS J003304.68284952.6; hereafter A) with mr(AB) 16.0800.001 mag and an effective radius of 5.810.02 arcseconds is the galaxy preferred by PATH (see Table 6 in Appendix A for PATH probabilities assigned to all galaxies in the field of this FRB).
When adopting , PATH gives a probability of 99.4% that the FRB is associated with galaxy A (Table 1). Given that the DESI depth corresponds to an absolute magnitude of roughly 15.90 mag at 0.19, our initial search should have been sensitive to all FRB hosts discovered to date. The probabilities obtained using the prior, are likely reasonable for this FRB. In addition, we found that the probability of finding an m16.1 mag galaxy in the CHIME localization region for FRB 20200223B by chance was 1.0%.
Finally, we note that the photometric redshift for this galaxy (0.060.01) is less than for this FRB ( 0.19). We, therefore, consider this host association robust. A is located at (J2000) 00h33m0468 (0.015) and (J2000) = 28°49′5260 (0.021) (Alam et al., 2015).
FRB 20190110C: We found nine objects that are not point sources in the field of FRB 20190110C by searching the DESI DR9 catalog (shown in green boxes on the middle panel of Fig 1). The nine sources have apparent DESI -band magnitudes in the range 18.0 mr 23.9. By visual inspection, source 1 looks like an irregularly shaped object with an extended clump classified as source 5 by DESI. We, therefore, consider them the same as opposed to distinct sources. Source 1, SDSS J163716.43412636.2 (hereafter, B) has a probability of being associated with the FRB of 91.8% (when adopting ) and has a 0.10 0.02 compared to 0.22 for this target. It has apparent r-band magnitude, mr(AB) 18.009 0.006 and an effective radius of 3.38 0.03 arcseconds.
The DESI depth of mr(AB) 24 mag corresponds to an absolute magnitude of roughly 16.26 mag at 0.22, and thus we were sensitive to all FRB hosts discovered to date. Given this, the probabilities obtained using the prior, is likely reasonable for this FRB. In addition, we found that the probability of finding an m mag galaxy in the CHIME localization region by chance was 10.2%. We, therefore, conclude that B is the likely host galaxy of FRB 20190110C. Galaxy B is located at (J2000) 16h37m1643 (0.022) and (J2000) = 41°26′3630 (0.024) (Alam et al., 2015). We report the PATH probability of all the sources in the field of this FRB in Table 7 of Appendix A.
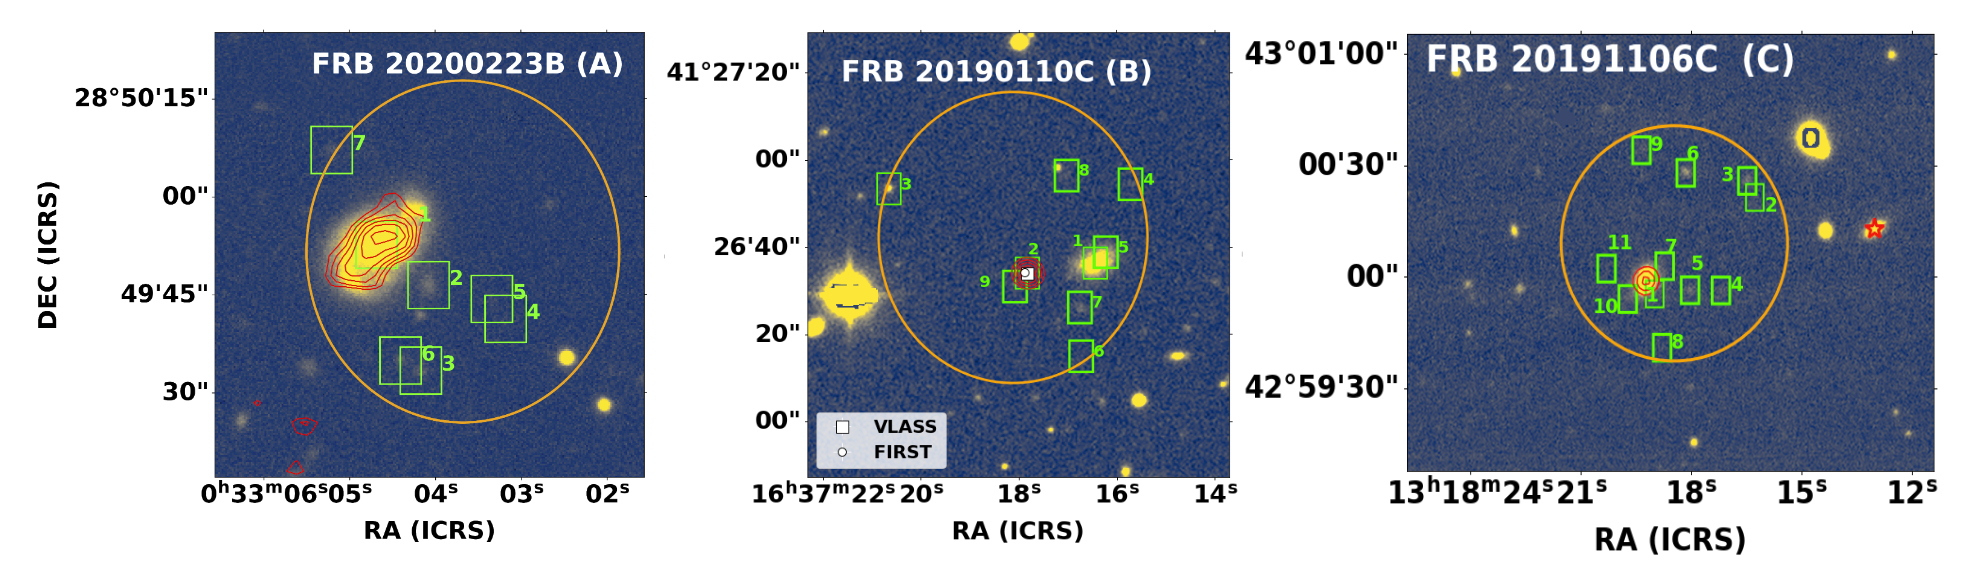
FRB 20191106C: 11 objects that are not point sources were found in the DESI catalog within the baseband region of FRB 20191106C (See the green boxes in Figure 1. The eleven sources have apparent DESI -band magnitudes in the range 17.3 mr 23.9.
We note that the DM for FRB 20191106C is larger than those of the other two FRBs discussed in this section, leading to a higher . As a result, the DESI limit corresponds to a slightly higher absolute magnitude of roughly 17.48 mag at and it is possible that some dwarf galaxies were missing from our initial candidate list (for example, the known host of FRB 121102 at mag; Chatterjee et al. 2017). Given these, it is likely more appropriate to use for this FRB.
Even when adopting , PATH significantly prefers source 1 (SDSS J131819.23+425958.9, hereafter, C) over any other objects in the field. It assigns a probability of 81.5% to galaxy C compared to 1% for any other galaxy in the field (see Table 8 in Appendix A where we report the PATH probability of all the sources in the field of this FRB). However, we found that the probability of finding an m17.3 mag galaxy in the CHIME localization region by chance is 6.3%. Therefore, we argue that C is likely a good candidate host of the FRB. It is located at (J2000) 13h18m1923 (0.01) and (J2000) = 42°59′5897 (0.01) (Alam et al., 2015) and looks like an elliptical/irregular galaxy with mr(AB) of 17.306 0.003.
Summary: Based on the results above, we conclude that Galaxies A and B are highly probable hosts for FRB 20200223B and FRB 20190110C, respectively. Both galaxies have 90% probability of being the true host based on PATH and the depth of the archival surveys is sufficient to detect all previously discovered FRB host galaxies. As described above, although it is not possible to make host associations based on galaxy number counts in the 13 CHIME/FRB localization regions alone, if we assume that FRBs come from galaxies, the Bayesian approach of PATH provides a means to assess the most likely host. In contrast, the association of galaxy C to FRB 20191106C is more marginal due to the shallower depth of archival surveys which means that the probability of unseen galaxies as the host is non-negligible. This leads to a PATH probability below 90% when adopting a value of P(U) that is greater than 0. However, given that PATH strongly preferred this host over any other source found in the field, we chose to also describe the properties of this galaxy in the section below.
Finally, we note that the FRB host galaxy association method described in this manuscript is different from that used in previously published CHIME/FRB papers (Bhardwaj et al., 2021a, b; Michilli et al., 2022). The latter involves obtaining spectroscopic redshifts of all the galaxy candidates within the FRB field and uses the condition to decide on host association. Given that we are looking at many FRB fields, some of which have high DMs, it is beyond the scope of the present work to conduct spectroscopic analysis for all the candidates in each field. Hence, we adopt the probabilistic method as described here. However, future more detailed studies involving spectroscopic redshifts could be of use.
3 Observations of Likely Host Associations
Here we describe the full set of archival and follow-up observations obtained for the plausible host galaxies of FRBs 20200223B, 20191106C, and 20190110C. These will be used to measure detailed host properties in §4.
3.1 Optical and Infrared Photometry
We retrieved photometric data for each of the 3 host galaxies from SDSS, DESI, the Wide-field Infrared Survey Explorer (WISE) (Wright et al., 2010), 2MASS (Cutri et al., 2003), the Galaxy Evolution Explorer (GALEX) (Bianchi et al., 2017) and the Spitzer Enhanced Imaging Product (SEIP) source list (SSTSL2) (Spitzer Science Center & Infrared Science Archive (IRSA)(2021), SSC). We will use these optical-infrared spectral energy distributions to estimate various properties of the galaxies in §4.2. We corrected all data for Galactic foreground extinction using the dust reddening map of Schlegel et al. (1998) and assuming an R3.1 Milky Way extinction curve. values are 0.0489(8), 0.0081(5), and 0.0200(8) for galaxies A, B, and C respectively.
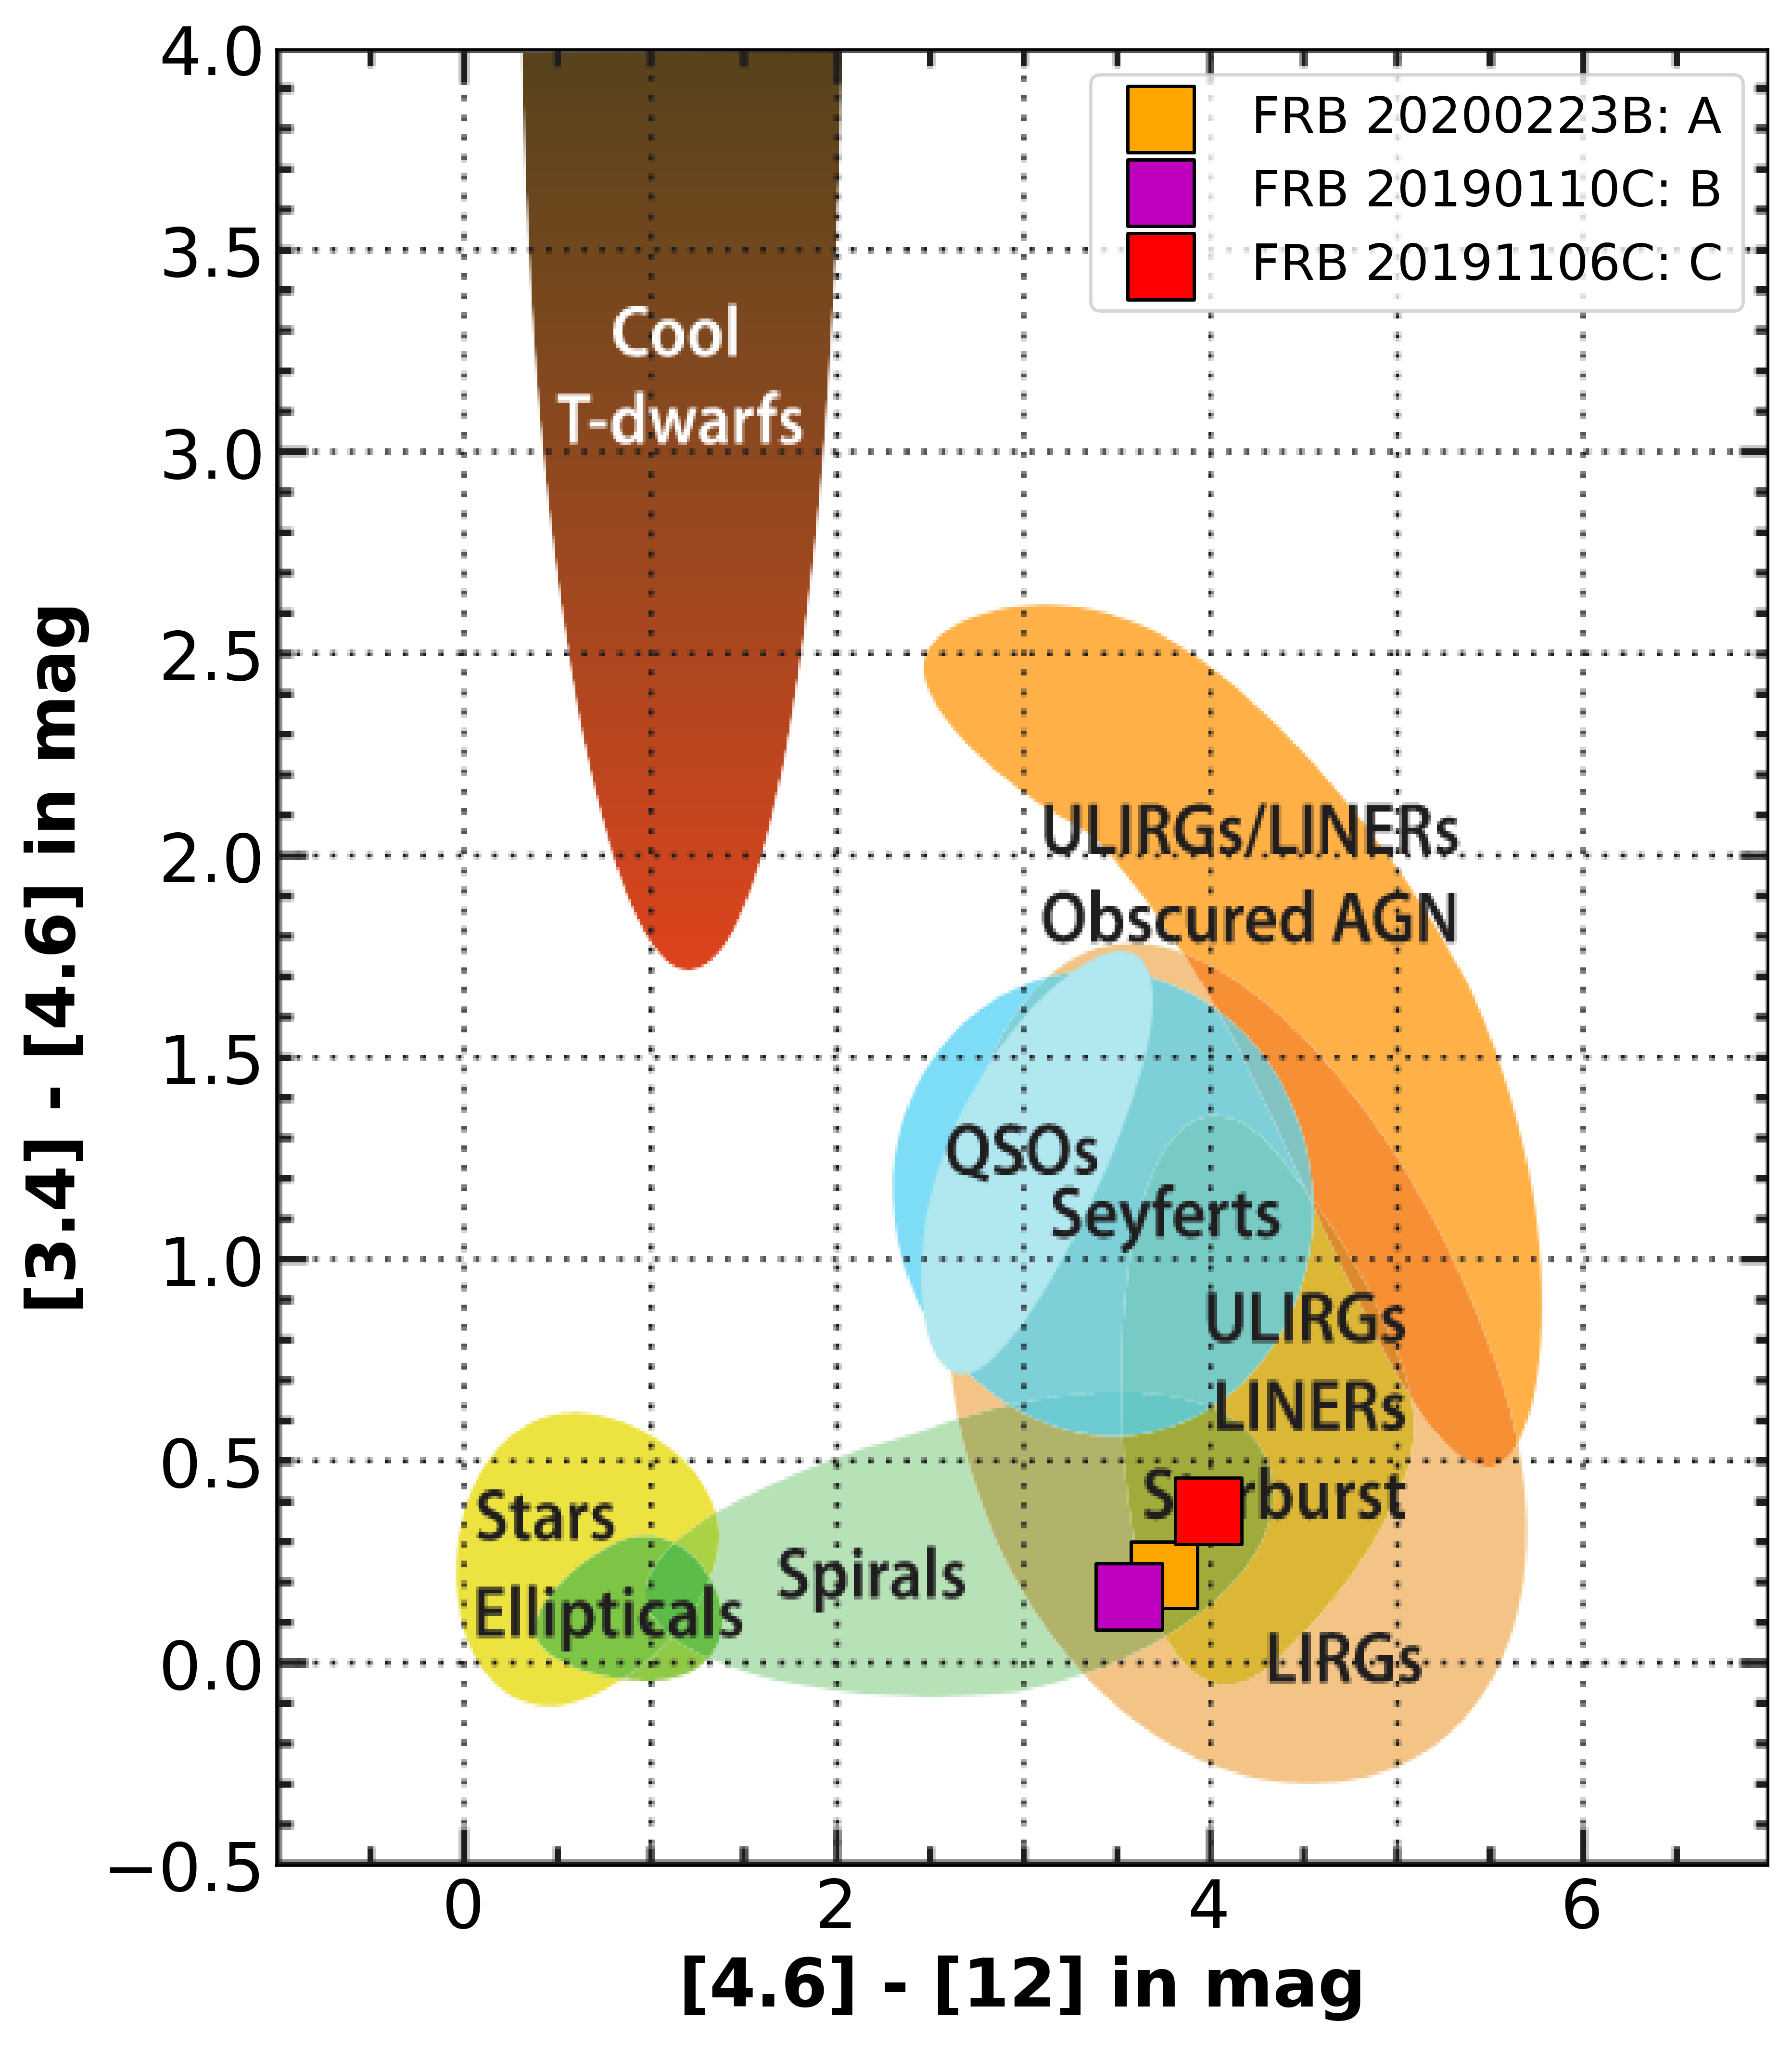
The infrared colors of galaxies A, B, and C in the WISE bands can be seen in Figure 2. Using the WISE color-map diagnostic plot (Wright et al., 2010; Nikutta et al., 2014), galaxy A falls in a region also occupied by spiral, star-forming, starburst, low-ionization nuclear emission-line regions (LINER) galaxies, and luminous infrared galaxies (LIRG) (Jarrett et al., 2017). While the morphology of galaxy B is ambiguous, the infrared colors also overlap with spiral galaxies and LIRGs, implying a star-forming galaxy. Finally, we note that Galaxy C was previously classified as an elliptical galaxy by Kuminski & Shamir (2016) with 88% certainty and an ellipticity of 0.4 (Simard et al., 2011). However, the infrared colors overlap with various classes of star-forming galaxies (spiral, starburst, and LIRGs), which is inconsistent with a typical quiescent elliptical galaxy. Moreover, this infrared color result is in line with the result of Ellison et al. (2016) who use artificial neural networks to model the total infrared luminosity, where they predict that C is a star-forming galaxy. We conclude that C could be among the rare population of elliptical galaxies with ongoing star formation.
3.2 Optical Spectroscopy
For all three likely host galaxies, we use optical spectroscopy to determine their spectroscopic redshifts and emission line fluxes— particularly, Hα, Hβ, [OIII](), and [NII]()— that will then be used to estimate other galaxy properties in §4.1. In all cases, we convert redshifts to luminosity distances assuming a flat cosmology with 67.7 km s-1 Mpc-1, = 0.31, and = 0.70 (Planck Collaboration et al., 2020).
3.2.1 Archival Spectroscopy
For galaxies A and C, archival spectra are available. For FRB 20200223B, the likely host galaxy, A, was observed and released as part of the Large Sky Area Multi-Object Fiber Spectroscopic Telescope (LAMOST; Cui et al., 2012) Data Release 5 (DR5). We retrieve the redshift and relevant emission line fluxes. The spectroscopic redshift is 0.06024(2) which corresponds to a luminosity distance of 278.97(9)Mpc. For FRB 20191106C, the likely host galaxy, C, was observed as part of SDSS DR12 and the redshift was reported by Alam et al. (2015). The spectroscopic redshift is 0.10775(1), which corresponds to a luminosity distance of 515.32(4) Mpc. Emission line fluxes for galaxy C were extracted from the SDSS-III spectroscopic survey (Eisenstein et al., 2011; Ahumada et al., 2020).
For both A and C, we correct the previously published LAMOST/SDSS line fluxes for foreground Milky Way extinction. We determine correction factors based on the Cardelli et al. (1989) extinction law (RV 3.1) at the rest wavelengths of Hα, Hβ, [OIII]() and [NII](). In addition, we also check for intrinsic host galaxy extinction by calculating the Balmer decrement from the Hα, Hβ line fluxes. Compared to the theoretical Case-B recombination line ratio of Hα/Hβ 2.86, we do not find evidence for significant additional extinction.
3.2.2 Gemini North Spectroscopy
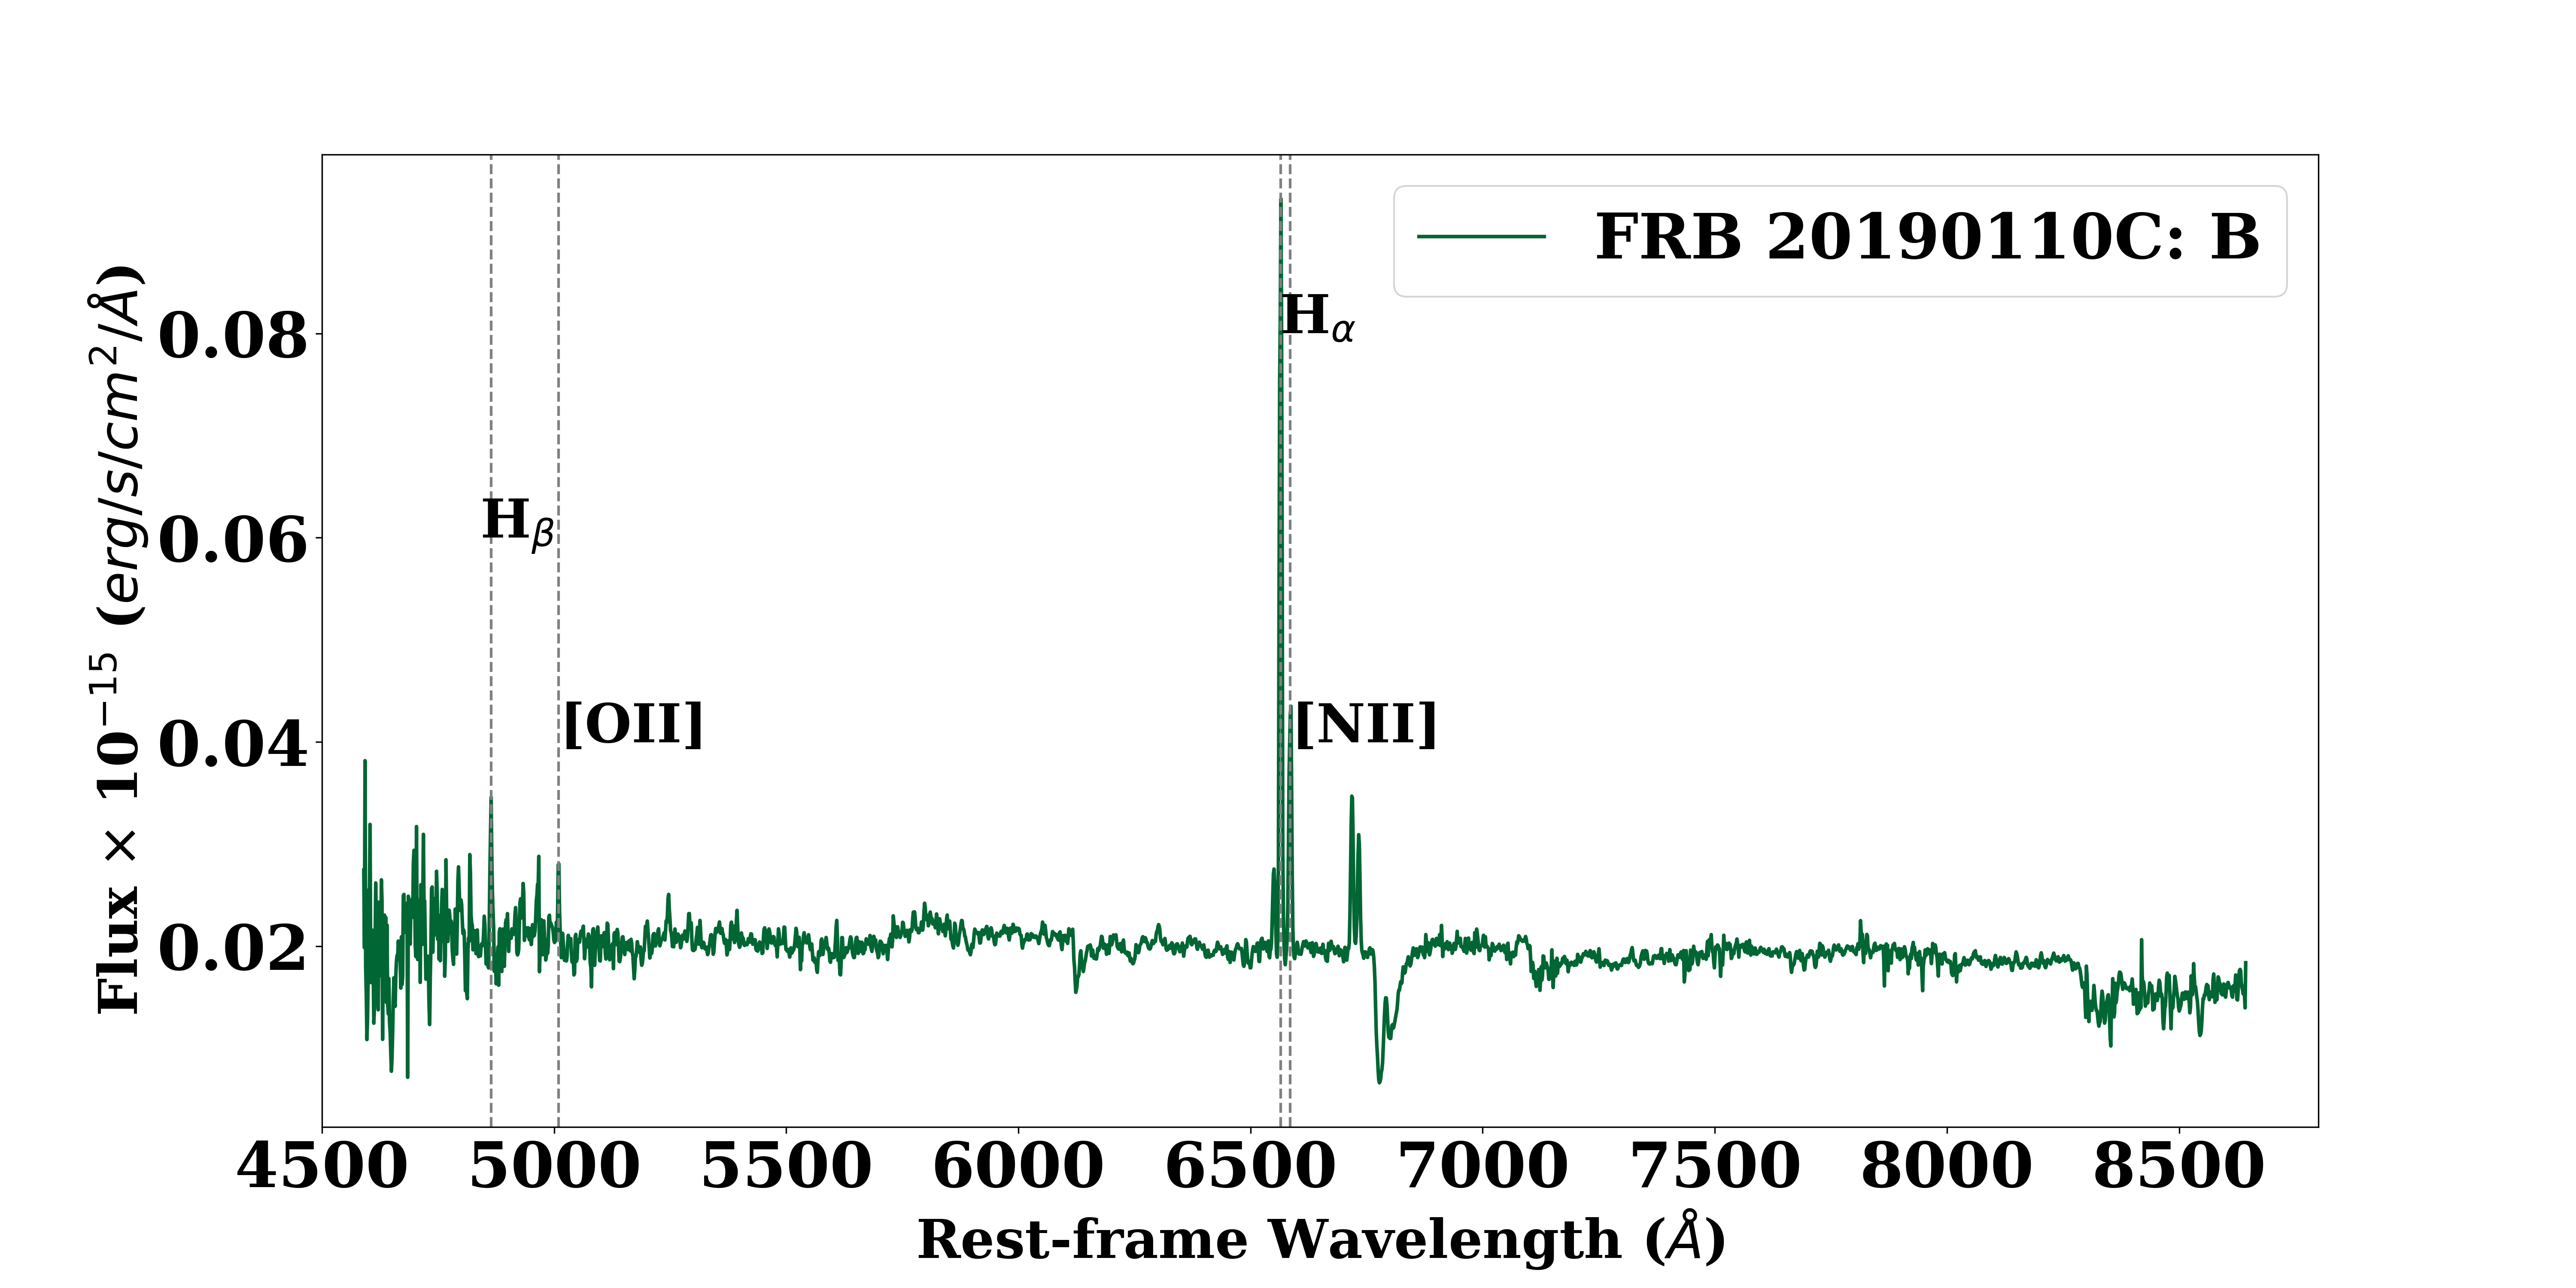
For FRB 20190110C, there is no archival spectroscopy available for its plausible host galaxy, B. Hence we obtained an observation with the Gemini Multi-Object Spectrograph (GMOS) of the Gemini-North telescope in Hawaii. The data were obtained on 2022 August 20 during semester 2022B. We used the 1.0" long-slit, R400 grating and OG515 ( 520 nm) blocking filter, at central wavelengths of 720/730 nm. In total, we obtained five 1200 second exposures with a mean airmass of 1.2.
The data were reduced using the standard packages of gmos and gemini routine in PYRAF (Science Software Branch at STScI, 2012). This included overscan correction, flat fielding, sky subtraction, wavelength calibration, extraction, and flux calibration. Chip gaps and cosmic rays were removed from individual exposures and the different exposure spectra were combined to produce a single spectrum. In order to estimate the redshift of galaxy A from the spectrum, we measured the observed central wavelengths of the Hα, Hβ, [NII], and SII emission lines. We recorded a redshift of 0.12244(6), which corresponds to a luminosity distance of 591.2(3) Mpc.
The spectrum was then corrected for cosmological expansion using the redshift and corrected for Milky Way extinction using the Cardelli et al. (1989) extinction law. As above, we find no evidence for significant additional internal extinction when calculating the Balmer decrement. The line fluxes of Hα, Hβ, [OIII](), and [NII]() were then measured by fitting a gaussian profile to the rest-frame spectrum. The process was carried out in an automated manner and repeated 100 times to estimate the error in the line fluxes due to uncertainty at the continuum level.
3.3 Radio Emission
We searched for the presence of a persistent radio source (PRS) within the error regions of the three FRBs using archival radio catalogs from the VLA Sky Survey (VLASS; Lacy et al., 2020), the NRAO VLA Sky Survey (NVSS; Condon et al., 1998), the Faint Images of the Radio Sky at Twenty-Centimeters (FIRST; Becker et al., 1995) survey, the TIFR-GMRT Sky Survey (TGSS; Intema et al., 2017) and the high-resolution component of the LOFAR Two-metre Sky Survey (LoTSS; Shimwell et al., 2022).
There are LoTSS radio sources at the locations of the host galaxies of FRB 20200223B and FRB 20191106C, with integrated flux densities of 2.96 0.59 mJy and 3.29 0.14 mJy, respectively, at a frequency of 144 MHz. We measured upper limits on the presence of a radio source at the location of B, which is the plausible host of FRB 20190110C. In Table 2, we report detections and upper limits on radio emission in the vicinity of the plausible host galaxies from these datasets. In §4.3, we will investigate the possible origin of any emission detected.
| A | B | C | ||||
|---|---|---|---|---|---|---|
| Survey | Frequency | Angular | Flux density | Flux density | Flux density | References |
| ( MHz) | Resolution ( ′′) | ( mJy) | mJy | mJy | ||
| FIRST | 1400 | 5 | 0.75a | 0.75a | 0.75a | Becker et al. (1995) |
| NVSS | 1400 | 45 | 12.5a | 12.5a | 12.5a | Condon et al. (1998) |
| VLASS | 3000 | 2.5 | 0.69a | 0.60a | 0.63a | Lacy et al. (2020) |
| TGSS ADR1 | 150 | 25 | 17.5a | 17.5a | 17.5a | Intema et al. (2017) |
| LoTSS | 144 | 6 | 2.96 0.59 | 0.42a | 3.29 0.14 | Shimwell et al. (2022) |
Notes.
a 5 RMS sensitivity or upper limit.
4 Properties of Likely Host Associations
Here we described the properties of galaxies A, B, and C. We investigate the implication of the results from optical spectroscopy used to estimate galaxy properties of A, B, and C in §4.1. We then report on the SED fitting using Prospector for galaxies A and B in §4.2, and place constraints on the presence of radio emission from these galaxies in §4.3. We check for any intervening structures that could contribute to the DM and discuss their effect on DMhost for the FRB in our sample in §4.4. Finally, in § 4.5 we compare the properties of these galaxies to the hosts of other FRBs.
| Observed property | A Values | B Values | C Values |
|---|---|---|---|
| Right Ascension (J2000) | 00h33m0468 (0.015) | 16h37m1643 (0.022) | 13h18m1923 (0.01) |
| Declination (J2000) | 28°49′5260 (0.021) | 41°26′3630 (0.024) | 42°59′5897 (0.01) |
| Galaxy name | SDSS J003304.68284952.6 | SDSS 163716.43412636.2 | SDSS J131819.23+425958.9 |
| Galactic Longitude () and Latitude () | 118.08, 33.86 | 65.57, 42.09 | 105.68, 73.22 |
| Apparent r-band mag (AB) | 18.0090.006 | 17.3060.003 | |
| (mag) | 0.0483(8) | 0.0078(5) | 0.0197(8) |
| spectroscopic redshift, | 0.06024(2) | 0.12244(6) | 0.10775(1) |
| Luminosity distance (Mpc) | 278.97(9) | 591.2(3) | 515.32(4) |
| Effective radius, Reff (kpc)e | 7.830.03 | 9.650.09 | 4.010.01 |
| Mr | 21.150.01 | 20.710.02 | 21.200.01 |
| Mu Mr | 1.840.05 | 1.640.11 | 2.080.07 |
| Hα | 8.6310-15f | 4.8042(8)10-16 | 6.0910-15f |
| Hβ | 1.1710-15f | 6.43(8)10-17 | 8.8810-16f |
| [OIII]() | 2.9410-15f | 2.93(7)10-17 | 1.2710-16f |
| [NII]() | 4.1710-15f | 1.703(9)10-16 | 2.0910-15f |
| Inferred Property | |||
| SFR ( yr-1)a | N/A | 0.1575(6) | 1.53f |
| Oxygen Abundance [ (O/H)]a + 12 | N/A | 9.102(2) | 9.10f |
| SFR ( yr-1)b | 0.59 | 0.54 | 4.75c |
| Stellar mass (M⊙)b | |||
| Mass weighted Age (Gyr)b | 3.37 | 2.59 | - |
| Specific star formation rate [log(sSFR)] (yr-1) | 10.98d | 10.66d | 10.61c |
Notes.
aValues obtained using the optical spectrum of the host galaxies.
bValue estimated from Prospector.
c Published values obtained from literature (Chang et al., 2015).
d Values obtained using SFR and the stellar mass values from the Prospector analysis.
e Values are half-light radius taken from DESI legacy catalog (Dey et al., 2019)
f Values published without errors. Our analysis of these data shows that the errors will not change the result of our analysis.
N/A represents parameter estimates that are not reliable, and hence not published.
4.1 Optical Emission Line Diagnostics
For the three host galaxies, we use the corrected emission line fluxes (see §3.2) to infer their dominant source of photo-ionization, star formation rates, and metallicities.
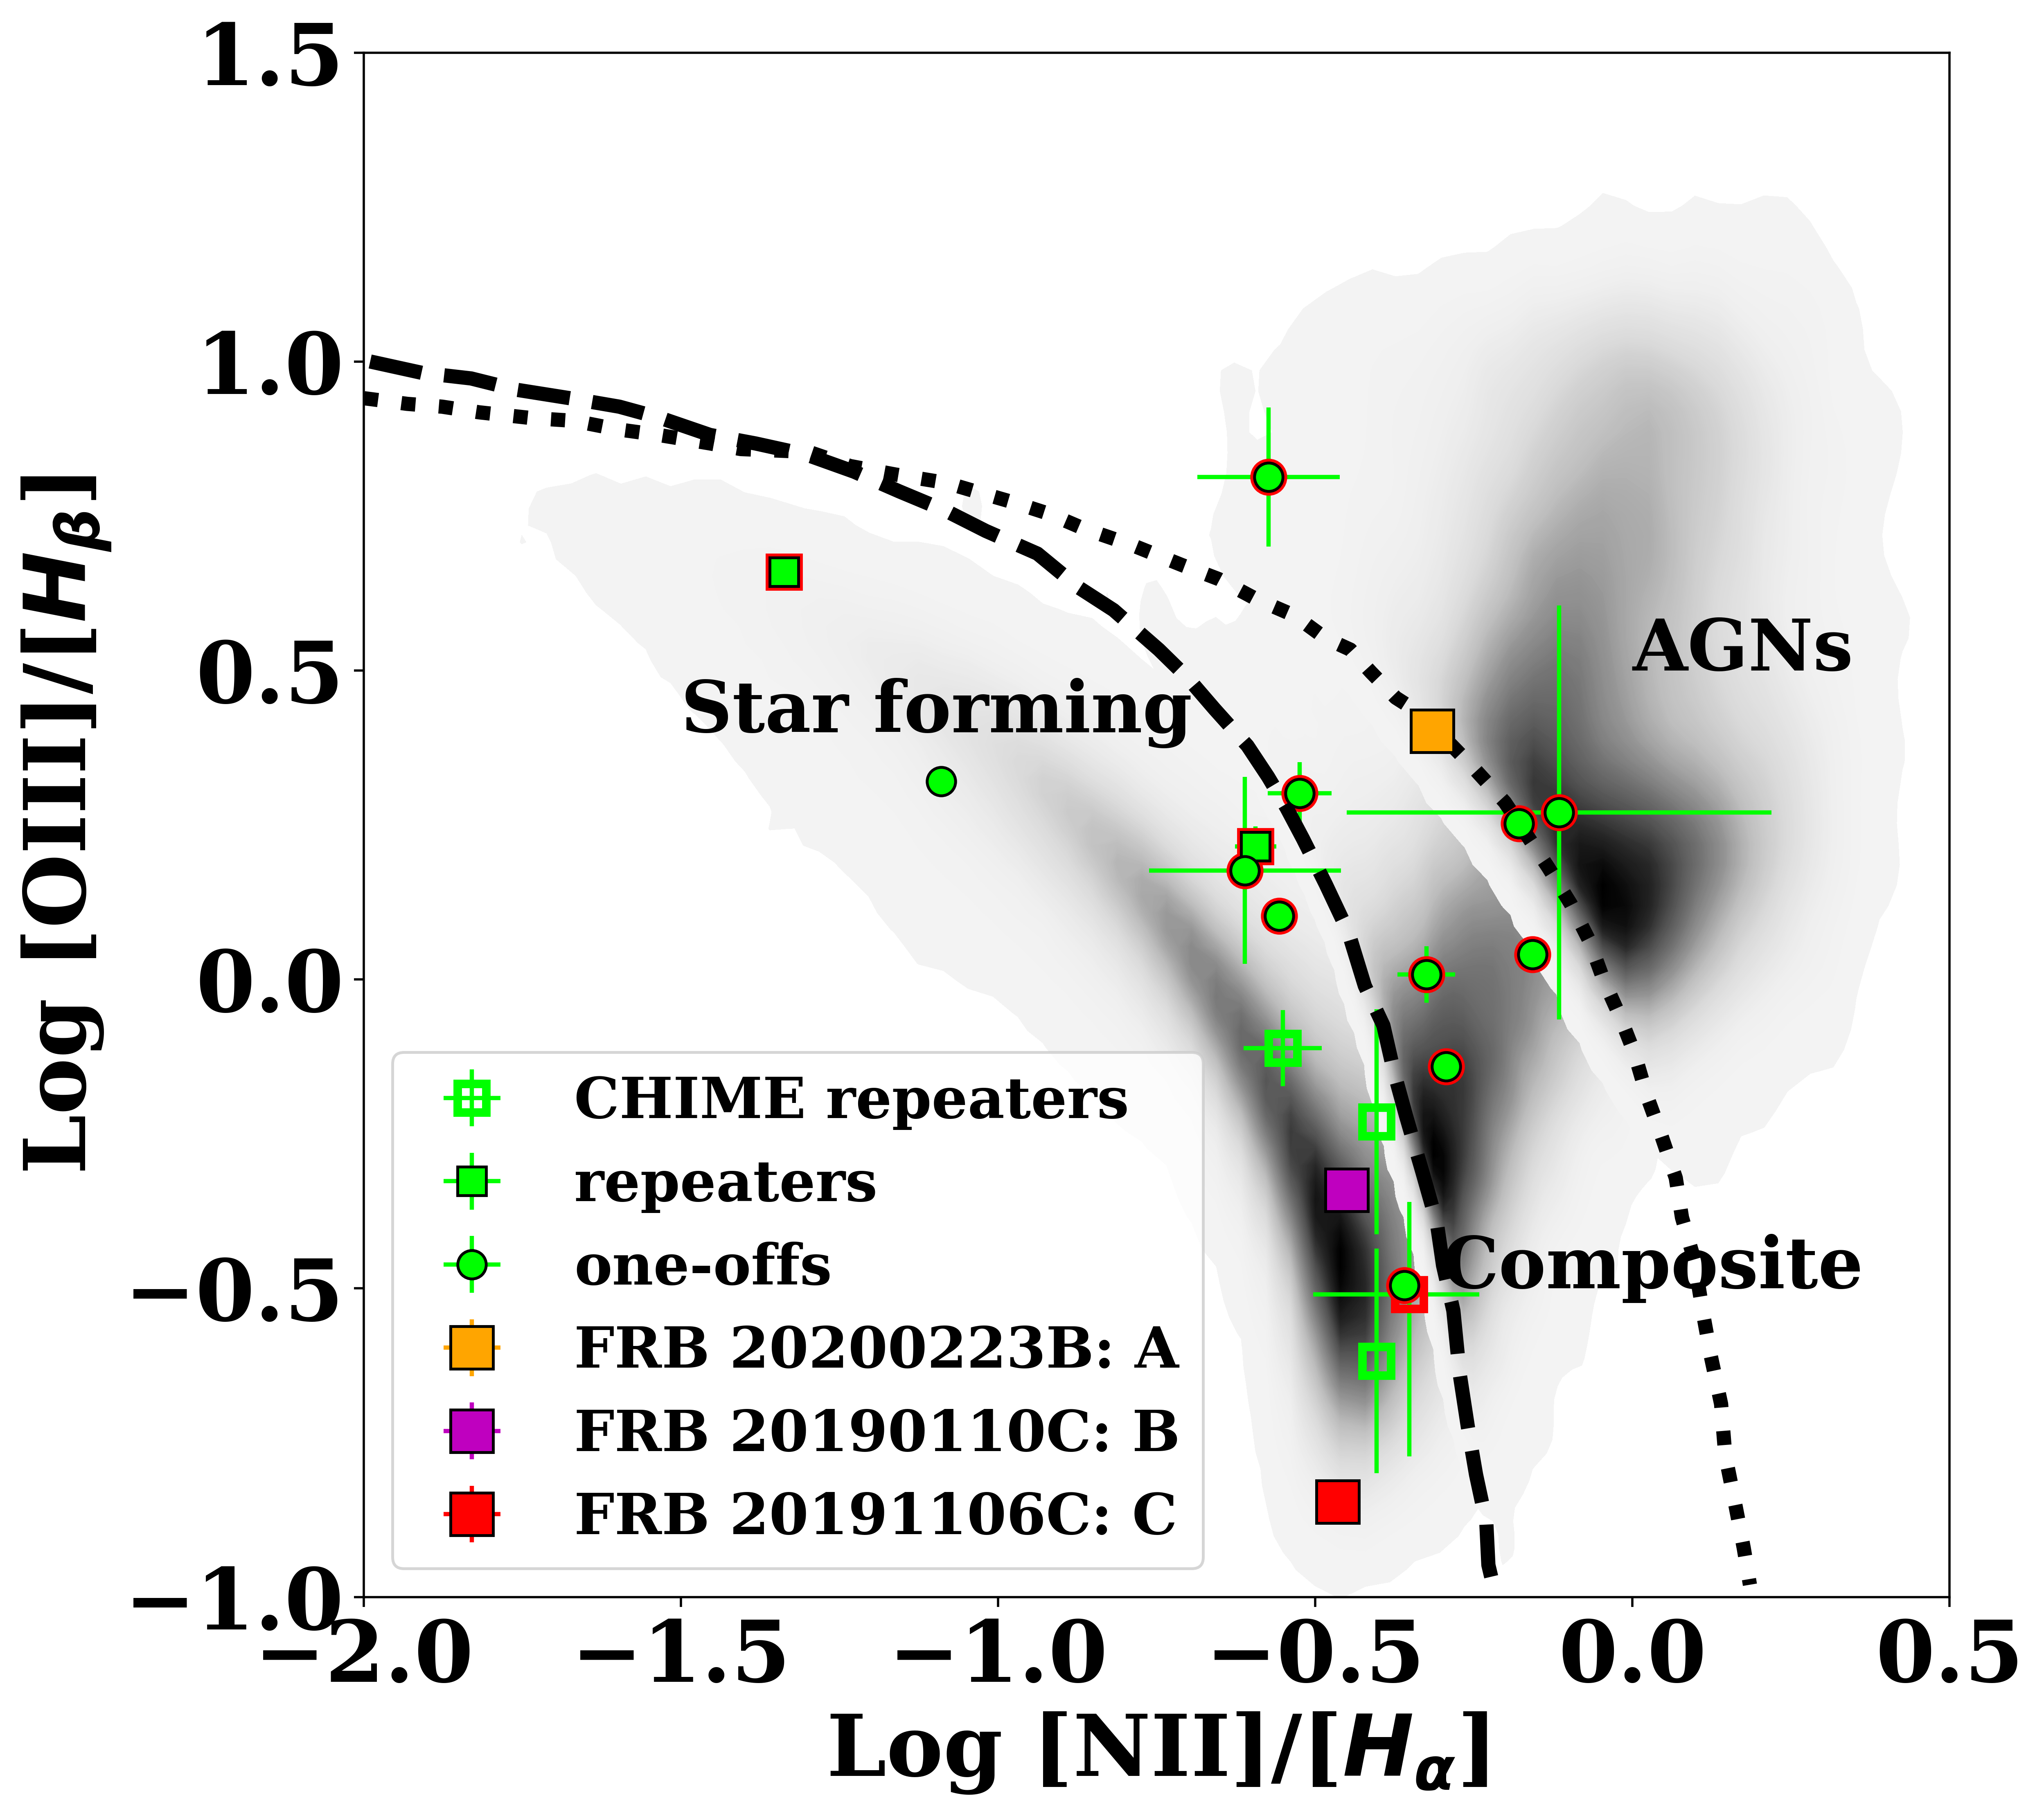
BPT diagram: In order to probe the major source of photo-ionization in each of the three galaxies, we first placed all 3 of them on the updated “Baldwin, Phillips & Terlevich” Baldwin et al. (1981) (BPT) diagram of Trouille et al. (2011) shown in Figure 4. Galaxies A, B, and C are designated by orange, magenta, and red squares, while in the background we plot the density distribution of nearby (0.02 0.35) emission line galaxy ratios with S/N 5 from the SDSS spectroscopic data from Data Release 8 (DR8: Aihara et al., 2011). Comparison with other overplotted FRB hosts line ratios is made in §4.5.
From this, we see that B and C galaxies fall within the region where the optical emission line ratios are dominated by star formation, while A appears to have a non-negligible contribution from an AGN to its optical line ratios. We note that there are no error bars associated with emission line fluxes for galaxies A and C (which were taken from LAMOST and SDSS, respectively, see above). From examining these archival spectra, we find that both and [NII] are strongly detected while [OIII] (and in the case of galaxy A) fall in noisy regions of the spectra. However, if we assume a conservative error of 30% (corresponding to a 3 detection of these lines), the resulting errors would not be significant enough to shift either galaxy from the star-forming or composite region of the BPT diagram, respectively. As a result, we consider these broad classifications robust and calculate other properties of star formation in the host galaxies (star formation rate, metallicity) for B and C only. We do not calculate the star formation rate and metallicity for A due to the AGN contamination.
Star formation rates: In the absence of internal extinction as was evident from the Balmer decrement of each of the three galaxies, we calculate star formation rates from the Hα line fluxes for B and C without Balmer decrement correction using the equations from Kennicutt (1998): SFR() 7.910-42 (L) From this we find star formation rates of 0.1575(6) yr-1 at L = 1.994(7) 1040 ergs s-1 for B and 1.53 yr-1 at L = 1.94 1041 ergs s-1 for C (See Table 3). These values are consistent with galaxies with active star formation.
Metallicity: We calculate metallicities using Equation 1 from Pettini & Pagel (2004) (12 log (O/H) 8.90 0.57 N2), where N2 [NII]6583/Hα. Using these ratios to estimate the metallicity of the galaxy resulted in an oxygen abundance of 9.102(2) which is equivalent to 2.76(1) Z☉ metallicity for B, and 9.10 which is equivalent to 2.7 Z☉ metallicity for C. These are high metallicities expected from an old population.
4.2 Prospector SED Fitting
We fitted the observed photometric data and spectroscopic redshifts using the stellar population synthesis modeling code Prospector (Johnson et al., 2021), in order to determine the stellar mass of galaxies A and B (the mass of Galaxy C properties was previously published by Chang et al. 2015, hence there was no need to carry out SED fitting for it). Prospector uses the stellar population synthesis library provided in the Flexible Stellar Populations Synthesis (FSPS) stellar population code python-fsps (Conroy et al., 2009) to fit the observed data. We assumed a Chabrier initial mass function (2003) and allowed a delayed- star formation history (SFH) model (Carnall et al., 2019) that has 5 free parameters (stellar mass, stellar metallicity, galaxy age, dust attenuation optical depth for a foreground screen, and star formation timescale for an exponentially declining SFH). Reasonable priors as listed in Table 5 were set for the free parameters. The likelihood given the free parameters was then sampled using a Markov Chain Monte Carlo (MCMC) approach through the emcee code (Foreman-Mackey et al., 2013) and the posterior distributions were calculated. The extinction-corrected photometry was converted to flux densities as listed in Table 4.
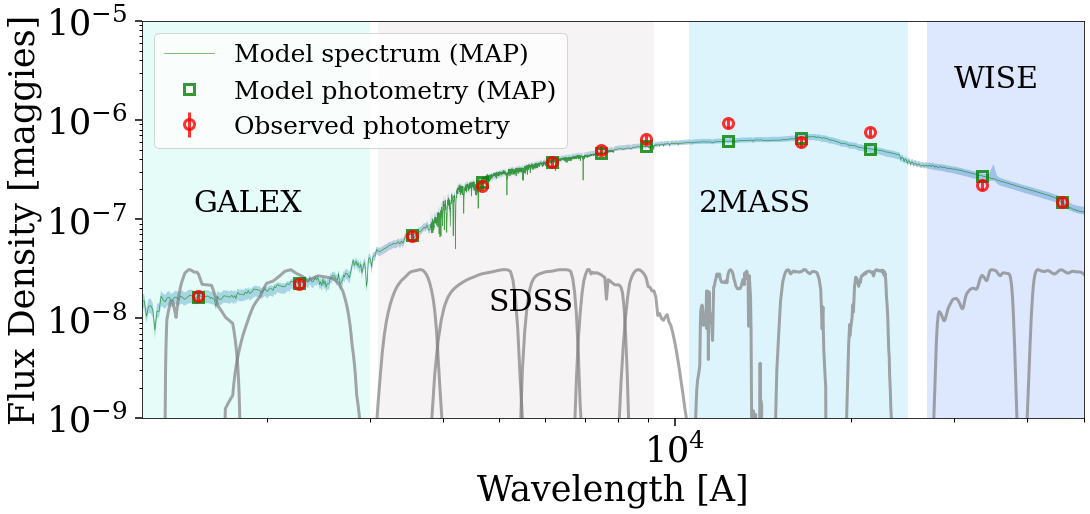
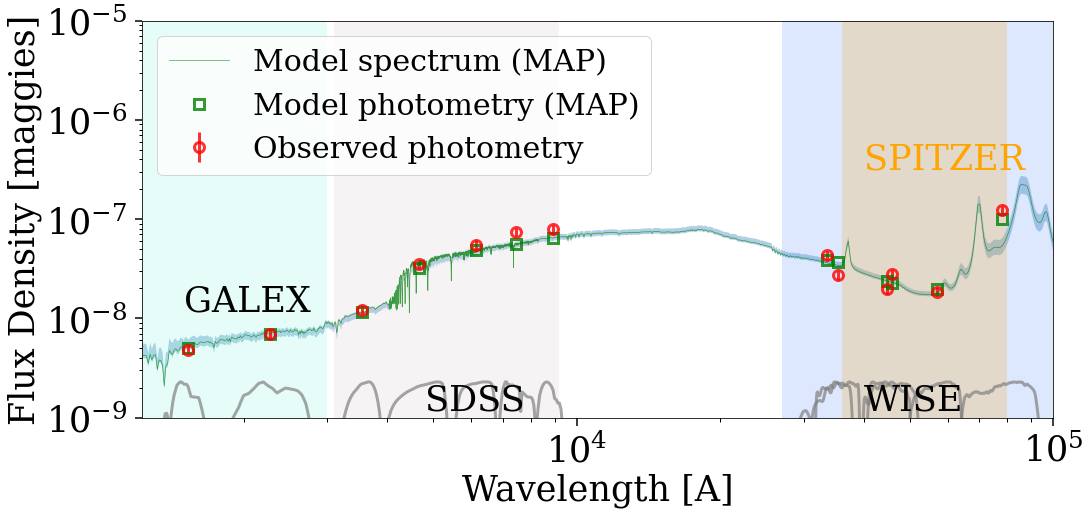
The best-fit SED profile of A (left panel) and B (right panel) are shown in Figure 5. Since we did not fit the spectra of galaxy B, we plot only the photometry and the fitted model. In Table 3 we present values for stellar mass, age, and SFR from our Prospector analysis of galaxies A and B along with values for stellar mass and SFR for galaxy C from (Chang et al., 2015). Prospector estimates SFR using the posteriors for the stellar mass, galaxy age, and decay time scale. Based on these results, we find that galaxies A, B and C are all relatively massive with M M⊙. For galaxies B and C we combine these masses with SFRs estimated from the spectroscopic analysis described above to compute specific star formation rates (see Table 3).
| Dataset | Filter | Central | A Flux density | B Flux density |
|---|---|---|---|---|
| Wavelength (Å) | ||||
| GALEX | FUV | 1528 | 1.6810-8 | 4.8510-9 |
| NUV | 2271 | 2.2310-8 | 6.9810-9 | |
| SDSS | u | 3543 | 6.8310-8 | 1.2310-8 |
| g | 4770 | 2.1810-7 | 3.4910-8 | |
| r | 6231 | 3.7210-7 | 5.5410-8 | |
| i | 7625 | 4.9510-7 | 7.4310-8 | |
| z | 9134 | 6.3810-7 | 7.9110-8 | |
| 2MASS | J | 12350 | 9.2810-7 | - |
| K | 16620 | 5.9510-7 | - | |
| Ks | 21590 | 7.5810-7 | - | |
| WISE | W1 | 33526 | 2.1910-7 | 4.3210-8 |
| W2 | 46028 | 1.4910-7 | 2.7910-8 | |
| Spitzera | 3.6m | 35510 | - | 2.7110-8 |
| 4.5m | 44930 | - | 1.9810-8 | |
| 5.8m | 57300 | - | 1.8610-8 | |
| 8.0m | 78730 | - | 1.2410-8 |
Note: All flux densities are in maggies.
a Flux densities are for 3.8 arcsecond diameter aperture.
| Prior description | A | B | ||
|---|---|---|---|---|
| Total stellar mass formed | log(M∗/M⊙) | log-uniform | min9, max11 | min9, max12 |
| Stellar metallicity | log(Z/Z⊙) | top-hat | min 2, max1 | min 5, max 1 |
| Diffuse V-band dust optical depth | dust2 | top-hat | min0, max0.3 | min0, max5 |
| Stellar population age of the galaxy | tage (Gyrs) | log-uniform | min5, max12 | min1, max10 |
| E-folding time of the SFH | (Gyrs) | log-uniform | min0.05, max10 | min0.05, max10 |
4.3 Constraints on the presence of persistent radio sources
In the field of FRB 20200223B, we found a source in the high-resolution LOFAR Two-metre Sky Survey (LoTSS; Shimwell et al., 2022) LoTSS catalog, ILT J003304.67+284952.4 with an integrated flux density of 2.960.59 mJy and an isotropic radio luminosity of 2.7(5) 1029 erg s-1 Hz-1 at 144 MHz given the luminosity distance of 277.81 Mpc. The radio source is resolved and extended in the LoTSS, with a full-width half maximum (FWHM) of the major axis width of 19.53" (LoTSS beam size, ) and also spatially coincident with galaxy A. The radio contours match the optical morphology implying that the radio emission originates from star-formation activity from the galaxy (see the left panel of Figure 1). We used the VLASS upper limit of 0.69 mJy (5) at 3 GHz and the LoTSS detection at 144 MHz to estimate an upper limit on the spectral index (S) of the radio source as which is consistent with star formation in the galaxy. Also, the radio-to-optical flux ratio of 0.4 is consistent with star formation as opposed to AGN activity (radio-to-optical flux ratio, 1.4) (e.g., Machalski & Condon, 1999; Vega et al., 2008; Padovani et al., 2009). Therefore, we conclude that the radio source is likely a low-frequency emission coming from star formation in the host galaxy. Due to the large beam size, of LoTSS, we cannot rule out a faint PRS embedded in this emission.
In the field of FRB 20190110C, we found unresolved radio sources in FIRST (FIRST J163717.8412634), VLASS (VLASS 1QLCIR J163717.83412633.9: Epoch 1 and 2), and LoTSS (ILT J163717.72412633.8) catalogs in the field spatially coincident with one another but not with the plausible host galaxy, B. There is no source found in NVSS down to a 5 threshold of 12.5 mJy/beam. The integrated radio flux density for the FIRST source is 0.910.15 mJy; for the first epoch of VLASS is 0.850.11 mJy; for the second epoch of VLASS is 0.720.11 mJy and for the LoTSS source is 8.670.14 mJy. The detailed analysis of this radio source will be published by Ibik et al. (in prep.). We report the measured upper limits from the B location in Table 2.
In the field of FRB 20191106C, we found five LoTSS sources with one (ILT J131819.22+425958.9, shown in the right panel of Figure 1) spatially coincident with the plausible host galaxy, C. For simplicity, we show only the radio source contours that are spatially coincident with the plausible host galaxy. This source, ILT J131819.22+425958.9, has an integrated flux density of 3.290.14 mJy and a radio luminosity of 1.050.04 1030 erg s-1 Hz-1 at 144 MHz given the luminosity distance of 516.60 Mpc. The radio source is slightly resolved in the LoTSS, with an FWHM major axis width of 7.76", and is offset by 4.01.2 kpc from the centre of the host galaxy. We used the VLASS upper limit of 0.63 mJy (5) at 3 GHz and the LoTSS detection at 144 MHz to estimate a spectral index . The spectral index and the radio-to-optical ratio of 0.9 are both consistent with star formation as opposed to AGN activity. Therefore, we conclude that the radio source is likely a low-frequency emission coming from star formation in the host galaxy. Due to the large beam size, of LoTSS, we cannot rule out a faint PRS if embedded in the emission.
4.4 Estimates of Host Dispersion Measures
To characterize DMhost of a galaxy, we first need to properly assess any additional foreground contributions to the DM from intervening structures. Typically, using the equation, DMhost DMobserved DMMW(NE2001) DMhalo DMIGM, any missed or unaccounted intervening media will reduce the estimated value of DMhost. We searched within our FRB baseband positions for foreground galaxy clusters using data from Wen et al. (2009, 2012); Wen & Han (2015); Wen et al. (2018); Banerjee et al. (2018), Galactic H II-regions using the Hα maps from Green (2019); Anderson et al. (2014), Galactic star-forming regions using CO maps from Avedisova (2002); Rice et al. (2016), nearby galaxies from GLADE v2.3 (Dálya et al., 2018) and dwarf galaxies from McConnachie (2012).
The results show that there are no star-forming or H II-regions in the foreground of the searched FRB repeaters in our sample listed in Table 1. We will now estimate DMhost for the 3 FRBs with plausible hosts discussed in this work and discuss the result of the few cases where there is at least one galaxy cluster or a galaxy in the region.
For the case of FRB 20200223B, in the absence of any object along the line-of-sight of the plausible host, we use to obtain DMIGM = 57.12(2) pc cm-3 following Equation 2 of Macquart et al. (2020). We chose a range of DMhalo with the lower bound and a higher bound that will produce a physical DMhost for each FRB but still within the given range reported by Dolag et al. (2015); Yamasaki & Totani (2020); Cook et al. (2023) which is 30 98 pc cm-3 for this FRB. Taking note of the DMMW(NE2001) 45(9) pc cm-3, we estimate DM - pc cm-3.
We do not find any object along the line-of-sight of the host galaxy of FRB 20190110C. We therefore use z for the host galaxy to directly estimate DMIGM and hence DMhost. For DMMW(NE2001) 37(7) pc cm-3 and assuming DMhalo = 30 65 pc cm-3, we obtain DMIGM = 117.75(6) pc cm-3 and DM - pc cm-3.
In the field of FRB 20191106C, there is a galaxy cluster, WHL J131827.1+425803 (Wen & Han, 2015) with z. Given , we do not expect that the galaxy cluster will affect the DM of the FRB. There are many other galaxies in the field but none of them has a redshift that could contribute to the DM of the FRB. In the absence of any intervening medium, we estimate DM 103 187 pc cm-3 from DMIGM = 103.29(1) pc cm-3 at z of the host galaxy, assuming DMhalo = 30 111 pc cm-3 and DMMW(NE2001) 25(5) pc cm-3.
For the rest of this section, we take note of any possible intervening structures for the other 10 repeaters in our sample, for which we do not yet have host associations, but for which one should beware if host galaxy associations are made in the future. We found a nearby galaxy cluster (WHL J172540.4+550250) (Wen et al., 2009) with redshift in the field of FRB 20190804E. However, we do not think that this galaxy cluster could affect the DM of the FRB as it has . In the field of FRB 20201114A with , we found a GLADE galaxy (HyperLEDA catalog number: 2745781) with z (Dálya et al., 2018) and 4 other galaxies from the DESI catalog, all having .
We also found 4 galaxy clusters, namely WHL J010806.9+182752 (z), WHL J010830.7+183100 (z), WHL J010833.0+182514 (z) (Wen & Han, 2015), and AMF9 J010830.7+182754 (z) (Banerjee et al., 2018) in the field of FRB 20200929C. Since their redshifts are lower compared to the FRB’s , it is plausible that WHL J010806.9+182752 and AMF9 J010830.7+182754 could affect the DM of the FRB depending on the location and redshift of the host galaxy.
4.5 Comparison to Previous FRB Hosts
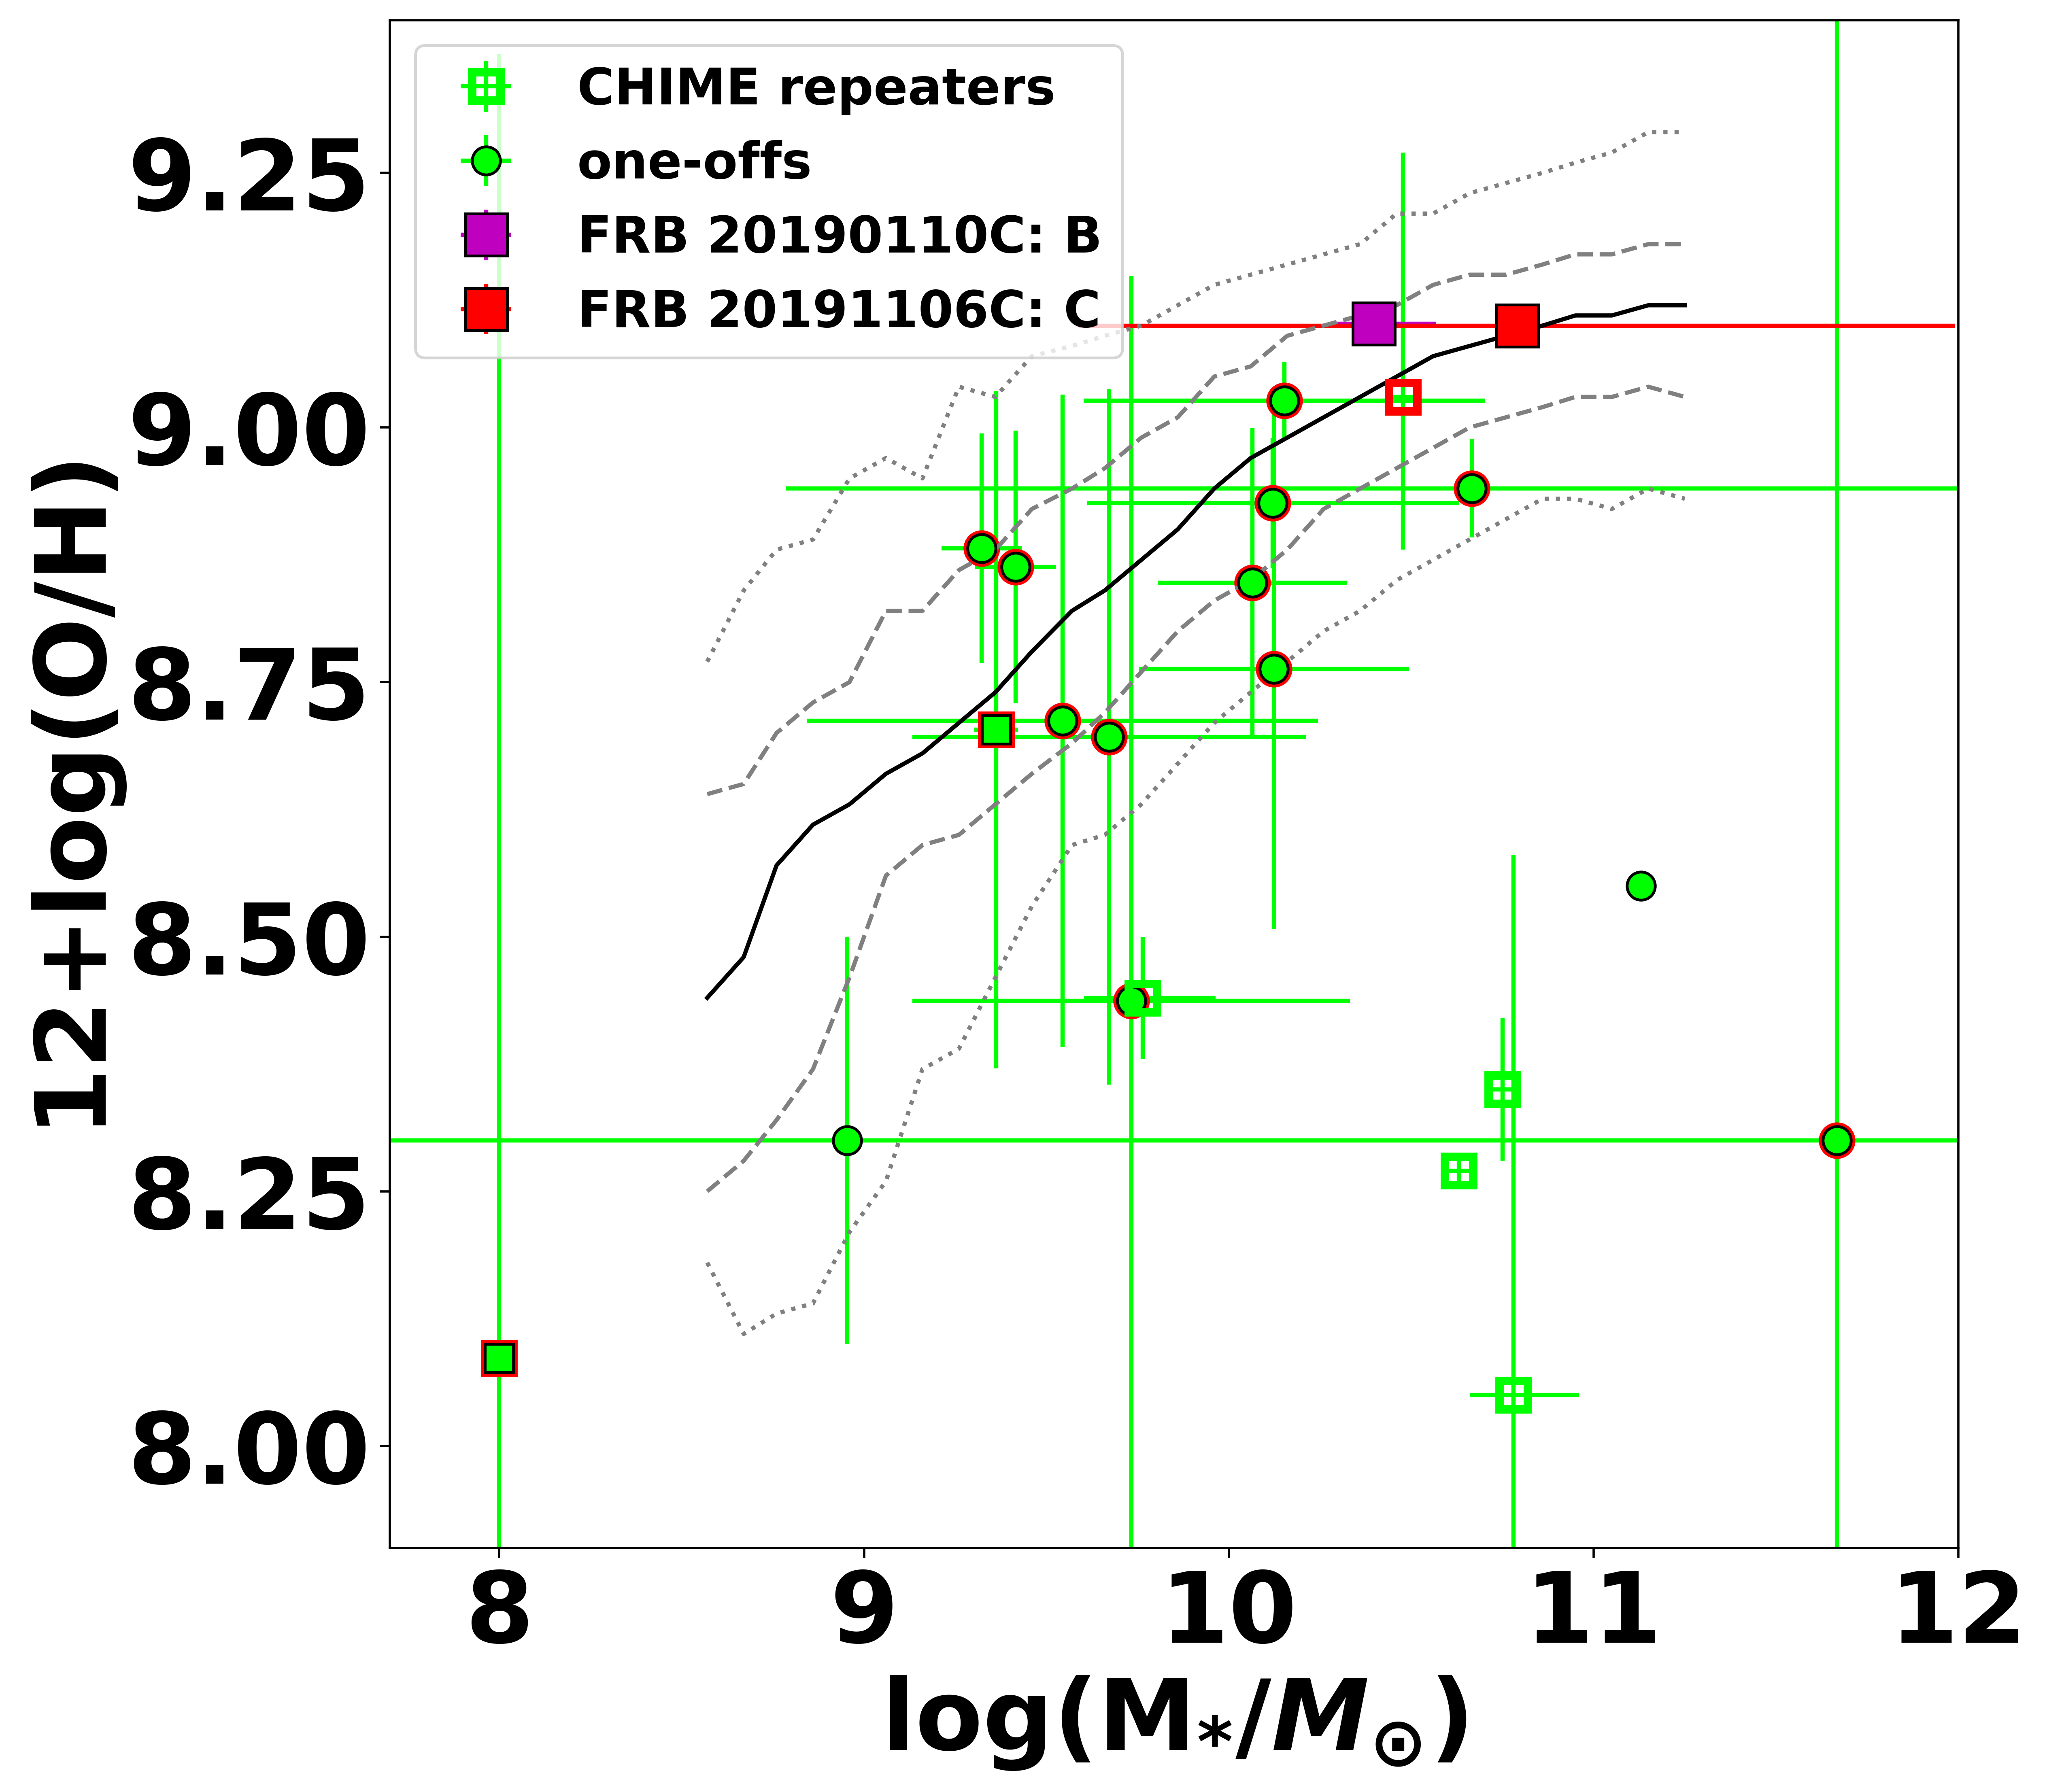
Based on the results found above, the three probable FRB host galaxies presented here are all relatively massive galaxies with signatures of ongoing star formation and roughly solar metallicity. Here, we compare these properties to those of other known FRB hosts. To aid this comparison, we plot galaxies A, B, and C along with other FRB hosts on a BPT diagram (Figure 4), a mass-star formation rate diagram (Figure 6), a color-magnitude diagram (Figure 7) and a mass-metallicity diagram (Figure 8). In all plots, FRB hosts from the literature are shown in green, with repeaters designated as squares and one-offs as circles. Previous repeating FRBs that were identified by CHIME/FRB are shown as open squares. FRBs with robust host association are shown as red-edge-colored markers.
BPT diagram: First, to compare the dominant sources of photoionization in FRBs host galaxies, we add FRBs from the literature to the BPT diagram described in §4.1 to get Figure 4. A total of 15 FRB hosts’ emission line fluxes were taken from Heintz et al. (2020), Mannings et al. (2021), Fong et al. (2021), Bhardwaj et al. (2021b), Bhandari et al. (2021), and Michilli et al. (2022) and shown in green squares and circles for 5 repeating (the host of FRB 20190303A are two merging galaxies which leads to 6 open squares in the Figure) and 10 non-repeating FRBs. Out of the 15 FRBs, 3 repeaters and 9 one-offs have robust (FRBs with localization region of 1 arcsecond) host associations (see markers with red edge colors in Fig 4). The plot shows that the 3 host galaxies’ (A, B, C) line ratios are broadly consistent with those of most FRB hosts, although galaxy A would be the first host for a repeating FRB with signatures of AGN activity. Galaxies B and C, support the trend identified by Bhandari et al. (2021) that most repeating FRBs happen in galaxies where star formation is the dominant source of photo-ionization, thus disfavoring progenitor channels where AGN activity is required (e.g. Katz, 2017; Vieyro et al., 2017; Gupta & Saini, 2018).
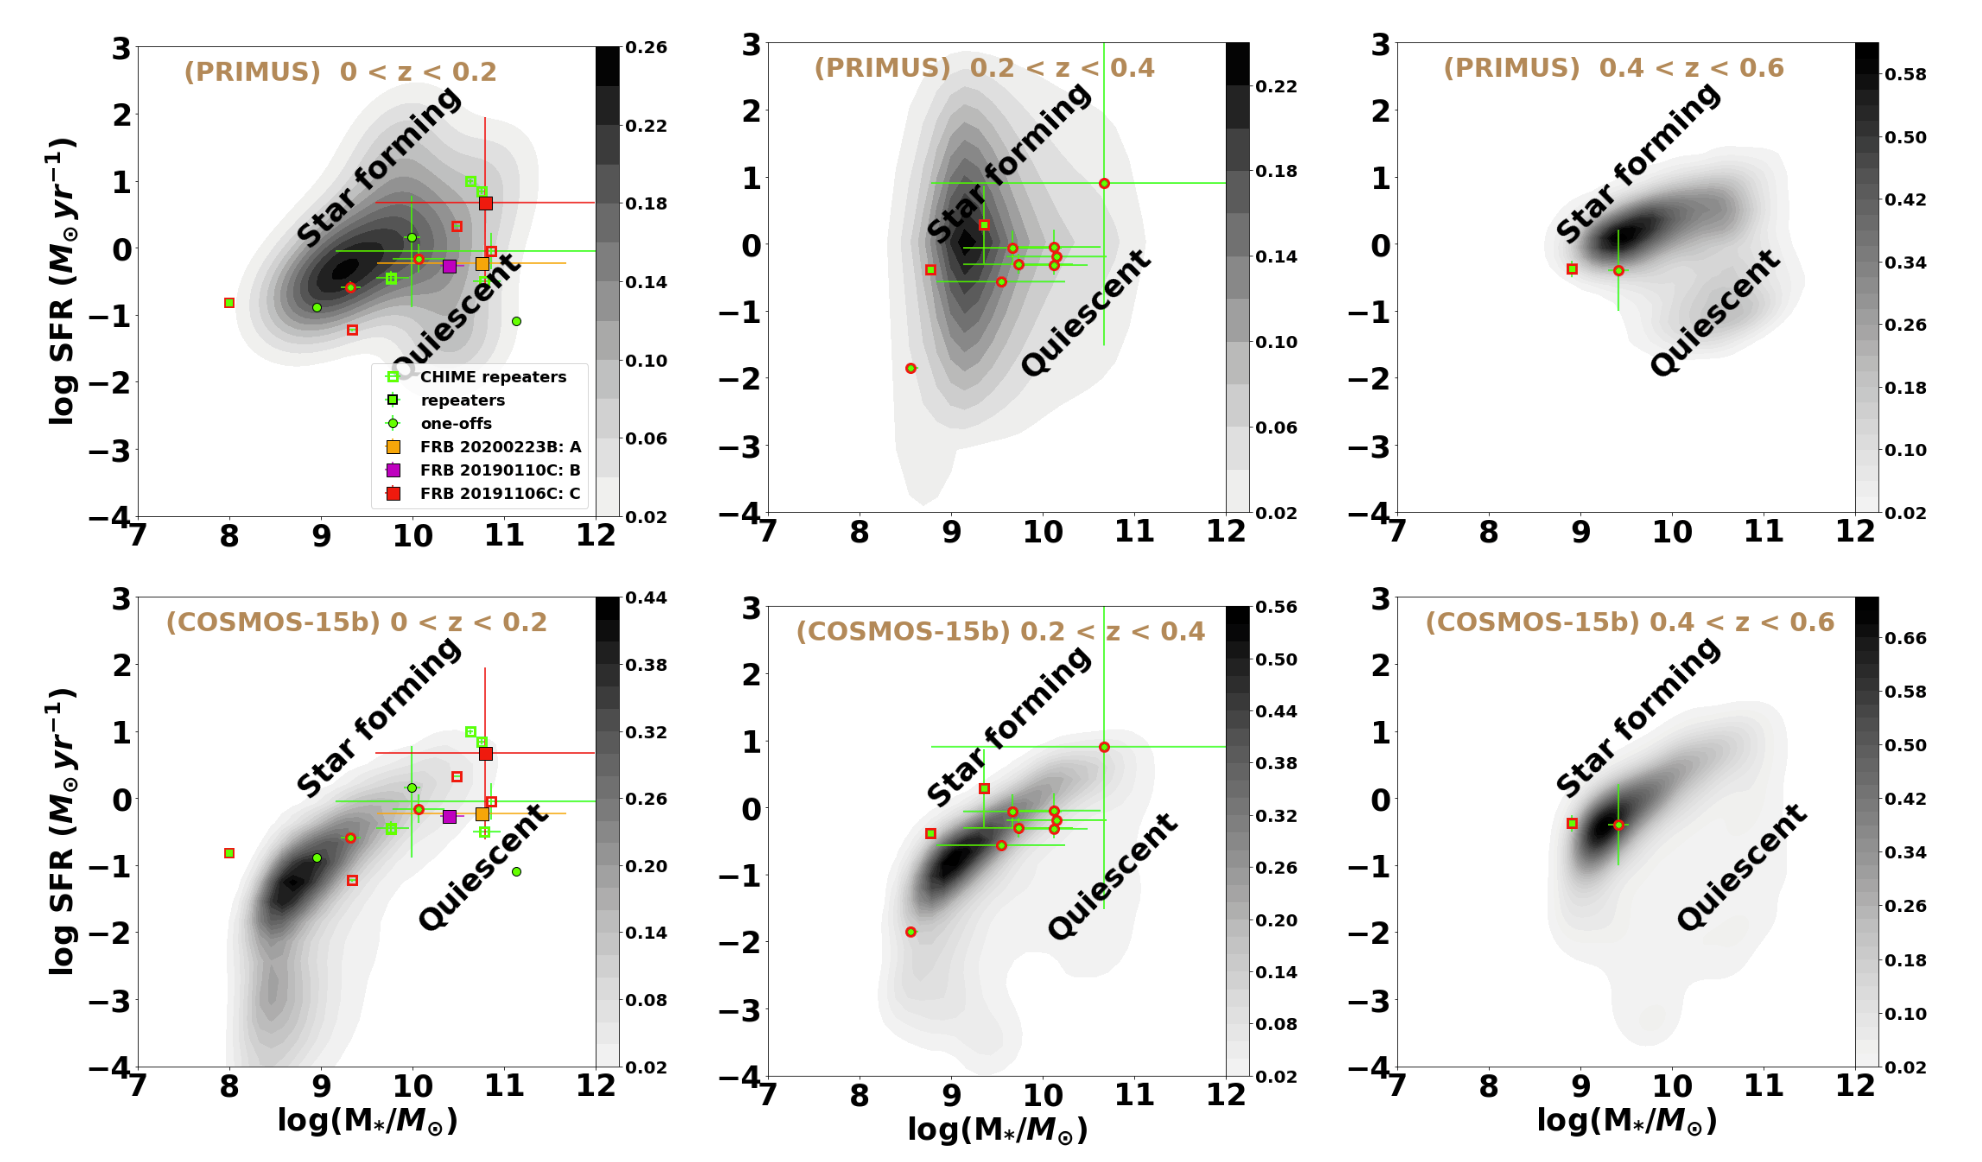
SFR-Mass: In Figure 6, we compare the rate of star formation versus the stellar mass of FRB host galaxies in three redshift bins, 0 z 0.2, 0.2 z 0.4, and 0.4 z 0.6. SFRs and masses for 24 FRB hosts were extracted from Mahony et al. (2018), Heintz et al. (2020), Mannings et al. (2021), Fong et al. (2021), Bhardwaj et al. (2021a), Bhandari et al. (2021), (Bhardwaj et al., 2021b), Niu et al. (2021), Bhandari et al. (2022a), Michilli et al. (2022), and Sharma et al. (2023) and shown in green squares and circles for 10 repeating (the host of FRB 20190303A are two merging galaxies which leads to 11 open squares in the Figure) and 14 non-repeating FRBs. Out of the 24 FRBs, 7 repeaters and 11 one-offs have robust (FRBs with localization region of 1 arcsecond) host associations (see markers with red edge colors in Fig 6). We plot the location of galaxies A, B, and C using SFRs, and stellar masses measured from Prospector SED fitting described above.
In the top left panel, kernel density contours represent galaxies from the PRism MUlti-object Survey (PRIMUS) survey (Moustakas et al., 2013) with redshifts z 0.5. In the bottom left panel, kernel density contours represent galaxies from the COSMOS-15 sample that were modeled by Leja et al. (2020), referred to as COSMOS-15b. Bhandari et al. (2021) previously identified that most FRB host galaxies are offset slightly below the star-forming main sequence, showing low star formation rates for their masses when compared to the PRIMUS dataset. This offset is visible in our figure (see Figure 6), where the star-forming main sequence is shifted about half an order of magnitude lower in the upper panels (PRIMUS) of Figure 6. In agreement with the result of Gordon et al. (2023), when compared to the lower panel (COSMOS15b), the galaxies mostly fall within the star-forming main sequence in closer alignment to many of the known FRB hosts.
While reconciling this discrepancy is beyond the scope of this work, we note the following:
i) Our datasets are a mix of both spectroscopic measurements and SED-derived information and so some are model-dependent. This makes it difficult to select direct analogous survey data for comparison;
ii) We note that below redshift 0.2, the PRIMUS sample has fewer galaxies compared to higher redshift field galaxies and lacks quality SFR and stellar mass measurements within this redshift range;
iii) The PRIMUS dataset redshifts are however measured from spectroscopy and the derived galaxy property values are from parametrized star formation history;
iv) The COSMOS-15b dataset on the other hand has redshift measurements from a mixture of spectroscopic and photometric data while its galaxy properties are derived values from a non-parametric continuity SFH.
Compared to both comparison datasets, galaxies A, B, and C (and many of the other CHIME repeaters) lie along and below the star-forming main sequence. In addition, the WISE plot location of galaxy A, showing ongoing star formation coupled with emission line signatures showing AGN activity, is also consistent with a galaxy in a transition phase. Our findings show that most FRBs appear to come from star-forming galaxies across the FRB redshift range observed so far. While the hosts of repeating FRBs show diverse SFR behavior, only a few FRBs are associated with transitioning and quiescent galaxies. Most FRB hosts are slightly offset below the star-forming main sequence when compared to the PRIMUS dataset in the redshift range 0 z 0.2. While this effect is less strong compared to the COSMOS-15b data, in each case, a subset of FRB-repeater hosts (including those presented here) still exhibit low star formation for their galaxy mass.
Overall, even though most FRB hosts prefer star-forming hosts, there may be an observational bias against finding FRBs in star-forming regions due to large possible levels of pulse dispersion and scattering in such regions. This could lead to decreased sensitivity to repeating bursts (Gordon et al., 2023). The difference in the SED-modelling methods used for the two field galaxy datasets as well as insufficient data for a given redshift range are possible factors that could affect the interpretation of this result.
Gordon et al. (2023) also used the mass-doubling number criterion (the number of times the stellar mass doubles within the age of the universe at redshift at the redshift of the galaxy assuming a constant specific star formation rate, sSFR) described by Tacchella et al. (2022) to classify galaxies as star-forming, transitioning and quiescent. We adopted this method for all the galaxies in our comparison sample as well as galaxies A, B, and C (even though we caution that the criterion was developed for galaxy properties derived using non-parametric star formation histories). Our results of the literature comparison sample show that most FRB hosts are star-forming, few are transitioning and one is quiescent. In addition, Galaxies A and B are both transitioning while C is star-forming according to the criteria with mass-doubling numbers of 0.1363, 0.2686, and 0.9547 respectively. Together, we note that all four galaxies classified as transitioning by this metric were repeaters. The overall outcome (that many FRB hosts are star-forming) is however consistent with the conclusions of Gordon et al. (2023) and Sharma et al. (2023).
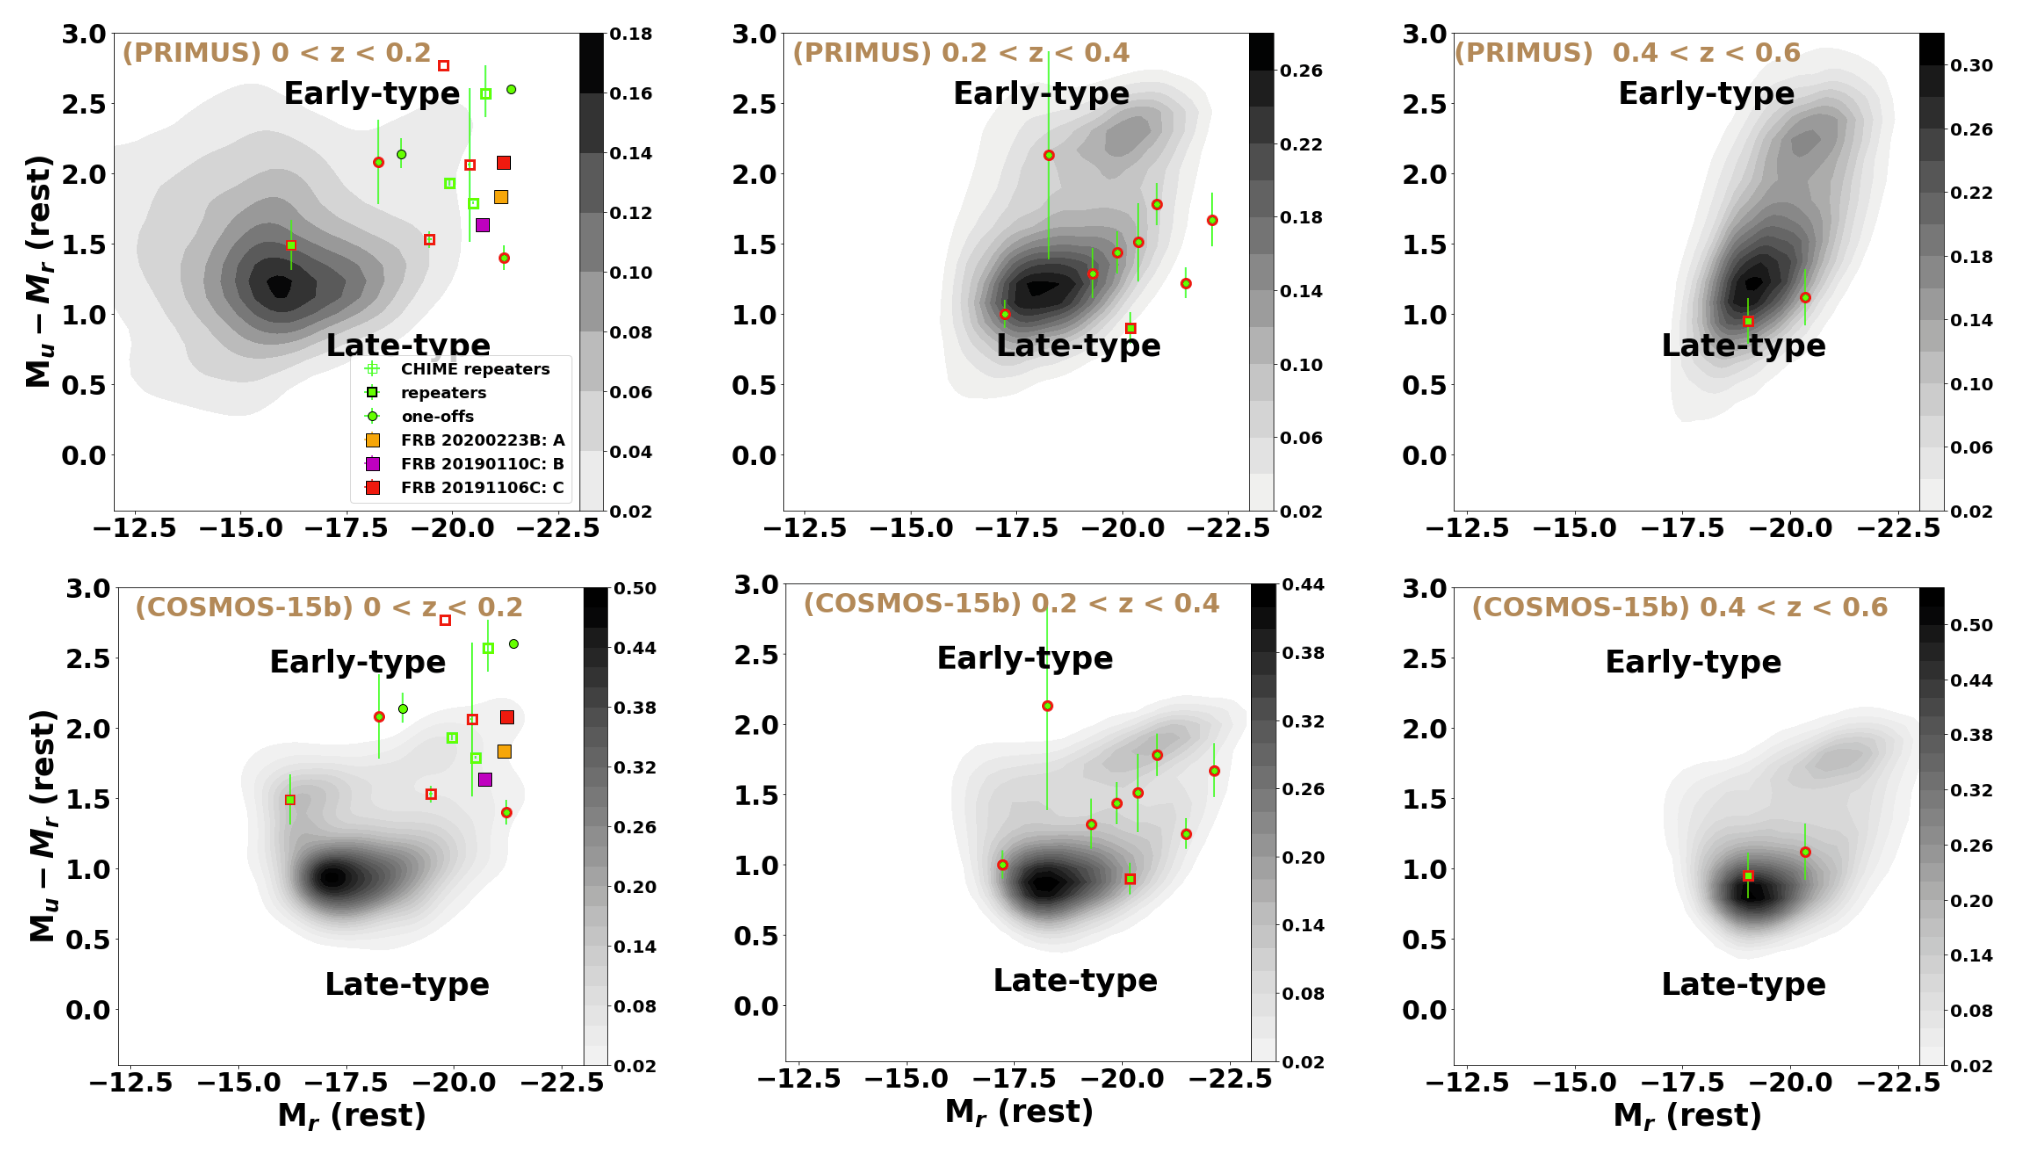
Color-Magnitude: To further examine the possibility that a subset of repeating FRB hosts are in a transitional phase, in Figure 7, we compare the color–magnitude properties of the FRB hosts in three redshift bins, 0 z 0.2, 0.2 z 0.4 and 0.4 z 0.6. This can be a useful indicator of the class of stellar population in the galaxies, which is less model-dependent. Specifically, the plot of the rest-frame M colors versus their absolute r-band magnitudes, Mr is overplotted with the kernel density contours of field galaxies. The top panel again compares to galaxies from the PRIMUS survey with redshifts z 0.5 and the lower panel with galaxies of the COSMOS-15b (Leja et al., 2020) dataset retrieved from the parent catalog (Laigle et al., 2016). A total of 21 FRB hosts’ color-magnitude values were extracted from Mahony et al. (2018), Heintz et al. (2020), Mannings et al. (2021), Fong et al. (2021), Bhandari et al. (2021), Bhardwaj et al. (2021a), Bhardwaj et al. (2021b), Bhandari et al. (2022a), Michilli et al. (2022), and Sharma et al. (2023) and shown in green squares and circles for 8 repeating (the host of FRB 20190303A are two merging galaxies which leads to 9 open squares in the Figure) and 13 non-repeating FRBs. Out of the 21 FRBs, 6 repeaters and 11 one-offs have robust (FRBs with localization region of 1 arcsecond) host associations (see markers with red edge colors in Fig 7). Galaxies A, B, and C are bright but fall within the overall range of properties seen in the literature for the FRB hosts. Many FRBs come from bright galaxies and there is a diversity of early-type, late-type, and “green-valley” (parameter space between the two peaks— early-type and late-type) galaxies among repeaters and one-offs.
Our result shows that the observed colors for all three probable hosts presented in this manuscript fall within the “green valley” when compared to the PRIMUS dataset, which would be consistent with having low star formation rates for their stellar masses (We note that the PRIMUS dataset has very few quiescent galaxies in the redshift range 0 z 0.2 which is why there is no corresponding “early-type” island in the left top panel). In particular, with the addition of these hosts, half of the FRB repeaters shown in Figure 7 have colors between 1.6 mag M 2.1 mag.
When comparing to the COSMOS-15b dataset, we again see that the three probable hosts described here show redder colors than a majority of late-time galaxies. (We note that the Leja et al. 2020 sample has very few quiescent galaxies, which is why there is a small corresponding “early-type” islands in all the lower panels). We note that this is a slightly different behaviour that was observed with the SFR-Stellar mass plot for the COSMOS-15b dataset (lower panels Figure 6) where many FRBs fell directly on the SFR main sequence. Given that the exact same set of galaxies are plotted in both figures, this distinction must stem from methods used to measure star-formation rate and stellar mass for the COSMOS-15b and FRB datasets (see above).
Approximately half of the FRB-repeater hosts show evidence of being in the transitional green-valley and early-type, irrespective of datasets. The moderate and low SFR seen for most FRB hosts are consistent with the location on the color-magnitude diagram. Most of the hosts are in the green valley and have a redder color possibly because of their low current star formation. This result is however non-intuitive as previous analysis shows that FRB hosts are mostly star-forming (which is mostly associated with late-type galaxies). It is possible that many FRBs are coming from star-forming regions of either late-type or green-valley galaxies. Indeed, we see evidence above for ongoing star formation within the potential FRB hosts presented here. Alternatively, this may be evidence for an additional, older, FRB progenitor channel, which is slightly overrepresented in the repeater population. Indeed, there has been recent evidence for some FRBs coming from older environments, such as FRB 20200120E found in a globular cluster of a spiral galaxy (Bhardwaj et al., 2021a; Kirsten et al., 2021). Finally, it is possible that this outcome is a selection bias since it may be easier to see FRBs from early-type galaxies given that they are not obscured by a high degree of dispersion and scattering from ionised gas in the hosts (Mannings et al., 2021).
Mass-Metallicity: Finally, Figure 8 shows the distribution of host galaxies’ metallicities and stellar masses. These are shown in comparison to the Tremonti et al. (2004) stellar mass versus gas-phase metallicity relationship found from SDSS data of redshifts z 0.1. The solid black line is the median, and the grey dashed and dotted lines cover the 68% and 95% confidence regions. Host information for 19 other FRBs was extracted from Heintz et al. (2020); Mannings et al. (2021); Bhardwaj et al. (2021b); Bhandari et al. (2021); Michilli et al. (2022); Sharma et al. (2023) consisting of 6 repeaters (the host of FRB 20190303A are two merging galaxies which leads to 7 open squares in the Figure) and 13 one-offs. Out of the 19 FRBs, 3 repeaters and 11 one-offs have robust (FRBs with localization region of 1 arcsecond) host associations (see markers with red edge colors in Fig 8). In most cases, we extract raw emission line fluxes and calculate metallicity ourselves using the O3N2 calibration (Hirschauer et al., 2018). In 3 cases where the line fluxes were not available and we could not identify the metallicity calibration used, we took published metallicities directly, acknowledging that a small error may be present in their location within Figure 8 due to systematic offsets between the various strong line metallicity diagnostics (Kewley & Ellison, 2008). Galaxies B and C are both relatively high-mass galaxies that fall directly on the mass-metallicity relationship of Tremonti et al. (2004). Overall, there is no metallicity preference between repeaters and one-offs but most of them are slightly below the solid line. This supports the conclusion that FRBs, as a whole, do not require the low metallicity, high specific star-formation rate environments preferred by superluminous supernovae and long-duration gamma-ray bursts (Lunnan et al., 2014).
Trends with FRB repeat rate: We used the repeat rates reported by CHIME/FRB Collaboration et al. (2023) for 8 CHIME/FRB events in our sample to compare with host properties (metallicity, SFR, color). Out of these, 7 of them are clustered at similar low repeat rates (1 hr-1) with only one having a high repeat rate (1 hr-1). The results show no relationship between repeat rates and any of the properties given the current data. However, this is a very small dataset; a larger sample collected in the future could provide more insight.
Trends with FRB DMhost: We retrieved the FRB DMhost values of 24 FRBs containing 8 repeaters and 16 one-offs from Law et al. (2022). We included the DMhost estimates from FRB 20200223B, FRB 20190110C, and FRB 20191106C thereby increasing the sample of repeaters to 11 events. We applied the two-sample Kolmogorov-Smirnov test to the DMhost histogram distribution for repeaters and non-repeaters. The result is a p-value of 0.4112 (41%). Assuming a null hypothesis at a 95% confidence interval that the repeaters and non-repeaters have the same local environment, then a p-value that is less than 0.05 (5%) will reject the null hypothesis. In this case, the p-value is greater than 5%, thus in agreement with the null hypothesis stating that the two distributions are the same. We note that there is an outlier among the repeaters which is FRB 190520. However, repeating the test with the outlier removed does not change the conclusion.
In summary, the sample of about 24 known FRB of host galaxies (repeating and non-repeating; Heintz et al., 2020; Bhandari et al., 2021; Niu et al., 2021; Bhandari et al., 2022a; Michilli et al., 2022) covers a broad range of -band absolute magnitude, Mu-Mr colors, stellar masses, star formation rates, and metallicities. The three new probable hosts identified here are consistent with this broader population. However, it is notable that through a combination of intermediate M colors (galaxies A, B, C), low star formation rate for a given stellar mass (galaxies A, B, C), mass-doubling timescale (galaxies A, B, C) and/or an elliptical morphology with signatures of ongoing star formation (galaxy C), all three show some evidence of being in a transitional or star-forming regime. Coupled with the previously published hosts, there is tentative evidence that FRB repeaters, in particular, are over-represented in the star-forming and “green valley” with many showing M colors redder than the majority of star-forming galaxies.
5 Summary
We searched for host galaxy associations for 13 FRB repeaters out of the 25 “gold” and 14 “silver” samples recently published by CHIME/FRB Collaboration et al. (2023). The CHIME/FRB baseband localization regions were searched for host galaxies in SDSS and DESI. We considered two methods to assess the probability of host association for candidate galaxies within the field. First, we run candidate host galaxies through PATH to estimate their probabilities of association with an FRB. Second, we consider the probability that a galaxy as bright as the host preferred by PATH would be found within the CHIME localization region by chance. When we consider the “look-elsewhere” effects associated with the fact that we searched 13 CHIME/FRB localization regions, we do not find evidence for a significant overabundance of bright galaxies. However, under the assumption that FRBs come from galaxies, the Bayesian approach of PATH still allows us to consider the most probable host for an individual FRB.
In the end, we consider two FRBs (FRB 20200223B, FRB 20190110C) for which we have galaxy candidates with a maximum association probability that is greater than 90%. We also cautiously discuss a third FRB (FRB 20191106C) with a plausible host galaxy for which the archival surveys have a shallower depth at the maximum redshift of the FRB. We obtained a Max P 81.5% at , but this galaxy was strongly preferred over any other galaxy in the field. The resulting discussed host galaxies for the 3 FRBs (FRB 20200223B, FRB 20190110C, and FRB 20191106C) are SDSS J003304.68+284952.6, SDSS 163716.43+412636.2, and SDSS J131819.23+425958.9, respectively.
FRB 20200223B is likely located in a spiral, star-forming galaxy with evidence for AGN activity. FRB 20190110C likely comes from a high metallicity, irregular galaxy showing evidence of quenching star formation, while the potential host galaxy of FRB 20191106C is a high metallicity, possibly elliptical with evidence for ongoing star formation. The latter two galaxies follow the standard mass-metallicity relationship observed for nearby galaxies. Moreover, all 3 galaxies are in the transitional phase with regard to star formation and show redder colors than expected for late-type galaxies. This is consistent with the broader repeater host population, which appears to prefer the region between early and late-type galaxies as discussed in §4.5. In addition, the high metallicity and low specific star-formation rate obtained for these galaxies are different from what is seen for the hosts of superluminous supernovae and long-duration gamma-ray bursts. However, it is critical to both confirm these host galaxies via arcsecond localization and to continue to increase the number of FRBs with robust host associations, since probabilistic host identification methods are biased towards bright galaxies.
Facilities: CHIME, Gemini North
Softwares: FRUITBAT (Batten, 2019),
PATH (Aggarwal et al., 2021), PYRAF (Science Software Branch at STScI, 2012), Prospector (Johnson et al., 2021), emcee (Foreman-Mackey et al., 2013), python-fsps (Conroy et al., 2009), Astropy (Astropy Collaboration et al., 2018), Matplotlib (Hunter, 2007), NumPy (Harris et al., 2020), SAOImage DS9(Joye & Mandel, 2003)
6 Acknowledgement
We thank Kasper Heintz and Joel Leja for the supplementary information and code that facilitated this work. We sincerely appreciate Prof. Edward Wright and Chao-Wei Tsai for granting permission to use the WISE diagnostic plot from their paper.
We acknowledge that CHIME is located on the traditional, ancestral, and unceded territory of the Syilx/Okanagan people. We are grateful to the staff of the Dominion Radio Astrophysical Observatory, which is operated by the National Research Council of Canada. CHIME is funded by a grant from the Canada Foundation for Innovation (CFI) 2012 Leading Edge Fund (Project 31170) and by contributions from the provinces of British Columbia, Quebec, and Ontario. The CHIME/FRB Project is funded by a grant from the CFI 2015 Innovation Fund (Project 33213) and by contributions from the provinces of British Columbia and Quebec, and by the Dunlap Institute for Astronomy and Astrophysics at the University of Toronto. Additional support was provided by the Canadian Institute for Advanced Research (CIFAR), McGill University, and the McGill Space Institute thanks to the Trottier Family Foundation and the University of British Columbia. The CHIME/FRB baseband system is funded in part by a Canada Foundation for Innovation John R. Evans Leaders Fund award to IHS.
The Dunlap Institute is funded through an endowment established by the David Dunlap family and the University of Toronto.
Based on observations obtained at the Gemini Observatory, which is operated by the Association of Universities for Research in Astronomy, Inc., under a cooperative agreement with the NSF on behalf of the Gemini partnership: the National Science Foundation (United States), the Science and Technology Facilities Council (United Kingdom), the National Research Council (Canada), CONICYT (Chile), the Australian Research Council (Australia), Ministério da Ciência e Tecnologia (Brazil), and SECYT (Argentina). We appreciate the Gemini team for granting us observing time for the program ID: GN-2022B-Q-308.
B.M.G. acknowledges the support of the Natural Sciences and Engineering Research Council of Canada (NSERC) through grant RGPIN-2022-03163, and of the Canada Research Chairs program. MRD acknowledges support from the NSERC through grant RGPIN-2019-06186, the Canada Research Chairs Program, the Canadian Institute for Advanced Research (CIFAR), and the Dunlap Institute at the University of Toronto. V.M.K. holds the Lorne Trottier Chair in Astrophysics & Cosmology, a Distinguished James McGill Professorship, and receives support from an NSERC Discovery grant (RGPIN-228738-13), and from the FRQNT CRAQ. K.W.M. holds the Adam J. Burgasser Chair in Astrophysics and is supported by an NSF Grant (2008031). A.B.P. is a Banting Fellow, McGill Space Institute (MSI) Fellow, and a Fonds de Recherche du Quebec – Nature et Technologies (FRQNT) postdoctoral fellow. Z.P. and P. S. are Dunlap Fellows. FRB Research at UBC is funded by an NSERC Discovery Grant and by the Canadian Institute for Advanced Research. The CHIME/FRB baseband system is funded in part by a CFI John R. Evans Leaders Fund award to IHS. M.B. is a Mcwilliams fellow. F.A.D is supported by the UBC Four Year Fellowship. A.M.C is funded by an NSERC Doctoral Postgraduate Scholarship. K.S. is supported by the NSF Graduate Research Fellowship Program.
References
- Aggarwal et al. (2021) Aggarwal, K., Budavári, T., Deller, A. T., et al. 2021, ApJ, 911, 95, doi: 10.3847/1538-4357/abe8d2
- Ahumada et al. (2020) Ahumada, R., Prieto, C. A., Almeida, A., et al. 2020, ApJS, 249, 3, doi: 10.3847/1538-4365/ab929e
- Aihara et al. (2011) Aihara, H., Allende Prieto, C., An, D., et al. 2011, ApJS, 193, 29, doi: 10.1088/0067-0049/193/2/29
- Alam et al. (2015) Alam, S., Albareti, F. D., Allende Prieto, C., et al. 2015, ApJS, 219, 12, doi: 10.1088/0067-0049/219/1/12
- Anderson et al. (2014) Anderson, L. D., Bania, T. M., Balser, D. S., et al. 2014, ApJS, 212, 1, doi: 10.1088/0067-0049/212/1/1
- Astropy Collaboration et al. (2018) Astropy Collaboration, Price-Whelan, A. M., Sipőcz, B. M., et al. 2018, AJ, 156, 123, doi: 10.3847/1538-3881/aabc4f
- Avedisova (2002) Avedisova, V. S. 2002, VizieR Online Data Catalog, V/112A
- Baldwin et al. (1981) Baldwin, J. A., Phillips, M. M., & Terlevich, R. 1981, PASP, 93, 5, doi: 10.1086/130766
- Banerjee et al. (2018) Banerjee, P., Szabo, T., Pierpaoli, E., et al. 2018, New A, 58, 61, doi: 10.1016/j.newast.2017.07.008
- Batten (2019) Batten, A. 2019, The Journal of Open Source Software, 4, 1399, doi: 10.21105/joss.01399
- Becker et al. (1995) Becker, R. H., White, R. L., & Helfand, D. J. 1995, ApJ, 450, 559, doi: 10.1086/176166
- Beloborodov (2017) Beloborodov, A. M. 2017, ApJ, 843, L26, doi: 10.3847/2041-8213/aa78f3
- Bhandari et al. (2020) Bhandari, S., Sadler, E. M., Prochaska, J. X., et al. 2020, ApJ, 895, L37, doi: 10.3847/2041-8213/ab672e
- Bhandari et al. (2021) Bhandari, S., Heintz, K. E., Aggarwal, K., et al. 2021, arXiv e-prints, arXiv:2108.01282. https://arxiv.org/abs/2108.01282
- Bhandari et al. (2022a) Bhandari, S., Gordon, A. C., Scott, D. R., et al. 2022a, arXiv e-prints, arXiv:2211.16790, doi: 10.48550/arXiv.2211.16790
- Bhandari et al. (2022b) Bhandari, S., Heintz, K. E., Aggarwal, K., et al. 2022b, AJ, 163, 69, doi: 10.3847/1538-3881/ac3aec
- Bhardwaj et al. (2021a) Bhardwaj, M., Gaensler, B. M., Kaspi, V. M., et al. 2021a, The Astrophysical Journal Letters, 910, L18, doi: 10.3847/2041-8213/abeaa6
- Bhardwaj et al. (2021b) Bhardwaj, M., Kirichenko, A. Y., Michilli, D., et al. 2021b, ApJ, 919, L24, doi: 10.3847/2041-8213/ac223b
- Bianchi et al. (2017) Bianchi, L., Shiao, B., & Thilker, D. 2017, ApJS, 230, 24, doi: 10.3847/1538-4365/aa7053
- Bochenek et al. (2020) Bochenek, C. D., Ravi, V., Belov, K. V., et al. 2020, Nature, 587, 59, doi: 10.1038/s41586-020-2872-x
- Cardelli et al. (1989) Cardelli, J. A., Clayton, G. C., & Mathis, J. S. 1989, ApJ, 345, 245, doi: 10.1086/167900
- Carnall et al. (2019) Carnall, A. C., Leja, J., Johnson, B. D., et al. 2019, The Astrophysical Journal, 873, 44, doi: 10.3847/1538-4357/ab04a2
- Cassanelli et al. (2022) Cassanelli, T., Leung, C., Rahman, M., et al. 2022, AJ, 163, 65, doi: 10.3847/1538-3881/ac3d2f
- Chabrier (2003) Chabrier, G. 2003, PASP, 115, 763, doi: 10.1086/376392
- Chang et al. (2015) Chang, Y.-Y., van der Wel, A., da Cunha, E., & Rix, H.-W. 2015, ApJS, 219, 8, doi: 10.1088/0067-0049/219/1/8
- Chatterjee et al. (2017) Chatterjee, S., Law, C. J., Wharton, R. S., et al. 2017, Nature, 541, 58–61, doi: 10.1038/nature20797
- CHIME/FRB Collaboration et al. (2018) CHIME/FRB Collaboration, Amiri, M., Bandura, K., et al. 2018, The Astrophysical Journal, 863, 48, doi: 10.3847/1538-4357/aad188
- CHIME/FRB Collaboration et al. (2019a) CHIME/FRB Collaboration, Amiri, M., Bandura, K., et al. 2019a, Nature, 566, 235, doi: 10.1038/s41586-018-0864-x
- CHIME/FRB Collaboration et al. (2019b) CHIME/FRB Collaboration, Andersen, B. C., Bandura, K., et al. 2019b, ApJ, 885, L24, doi: 10.3847/2041-8213/ab4a80
- CHIME/FRB Collaboration et al. (2020) CHIME/FRB Collaboration, Andersen, B. C., Bandura, K. M., et al. 2020, Nature, 587, 54, doi: 10.1038/s41586-020-2863-y
- CHIME/FRB Collaboration et al. (2021) CHIME/FRB Collaboration, Amiri, M., Andersen, B. C., et al. 2021, ApJS, 257, 59, doi: 10.3847/1538-4365/ac33ab
- CHIME/FRB Collaboration et al. (2023) CHIME/FRB Collaboration, :, Andersen, B. C., et al. 2023, arXiv e-prints, arXiv:2301.08762. https://arxiv.org/abs/2301.08762
- Condon et al. (1998) Condon, J. J., Cotton, W. D., Greisen, E. W., et al. 1998, AJ, 115, 1693, doi: 10.1086/300337
- Connor et al. (2020) Connor, L., Miller, M. C., & Gardenier, D. W. 2020, MNRAS, 497, 3076, doi: 10.1093/mnras/staa2074
- Conroy et al. (2009) Conroy, C., Gunn, J. E., & White, M. 2009, The Astrophysical Journal, 699, 486, doi: 10.1088/0004-637X/699/1/486
- Cook et al. (2023) Cook, A. M., Bhardwaj, M., Gaensler, B. M., et al. 2023, arXiv e-prints, arXiv:2301.03502, doi: 10.48550/arXiv.2301.03502
- Cordes & Lazio (2002) Cordes, J. M., & Lazio, T. J. W. 2002, arXiv preprint astro-ph/0207156
- Cui et al. (2012) Cui, X.-Q., Zhao, Y.-H., Chu, Y.-Q., et al. 2012, Research in Astronomy and Astrophysics, 12, 1197, doi: 10.1088/1674-4527/12/9/003
- Cutri et al. (2003) Cutri, R. M., Skrutskie, M. F., van Dyk, S., et al. 2003, VizieR Online Data Catalog, II/246
- Dálya et al. (2018) Dálya, G., Galgóczi, G., Dobos, L., et al. 2018, MNRAS, 479, 2374, doi: 10.1093/mnras/sty1703
- Dey et al. (2019) Dey, A., Schlegel, D. J., Lang, D., et al. 2019, AJ, 157, 168, doi: 10.3847/1538-3881/ab089d
- Dolag et al. (2015) Dolag, K., Gaensler, B. M., Beck, A. M., & Beck, M. C. 2015, MNRAS, 451, 4277, doi: 10.1093/mnras/stv1190
- Driver et al. (2016) Driver, S. P., Wright, A. H., Andrews, S. K., et al. 2016, MNRAS, 455, 3911, doi: 10.1093/mnras/stv2505
- Eftekhari & Berger (2017) Eftekhari, T., & Berger, E. 2017, ApJ, 849, 162, doi: 10.3847/1538-4357/aa90b9
- Eftekhari et al. (2019) Eftekhari, T., Berger, E., Margalit, B., et al. 2019, ApJ, 876, L10, doi: 10.3847/2041-8213/ab18a5
- Eftekhari et al. (2021) Eftekhari, T., Margalit, B., Omand, C. M. B., et al. 2021, ApJ, 912, 21, doi: 10.3847/1538-4357/abe9b8
- Eisenstein et al. (2011) Eisenstein, D. J., Weinberg, D. H., Agol, E., et al. 2011, AJ, 142, 72, doi: 10.1088/0004-6256/142/3/72
- Ellison et al. (2016) Ellison, S. L., Teimoorinia, H., Rosario, D. J., & Mendel, J. T. 2016, MNRAS, 455, 370, doi: 10.1093/mnras/stv2275
- Fong et al. (2021) Fong, W.-f., Dong, Y., Leja, J., et al. 2021, ApJ, 919, L23, doi: 10.3847/2041-8213/ac242b
- Fonseca et al. (2020) Fonseca, E., Andersen, B. C., Bhardwaj, M., et al. 2020, ApJ, 891, L6, doi: 10.3847/2041-8213/ab7208
- Foreman-Mackey et al. (2013) Foreman-Mackey, D., Hogg, D. W., Lang, D., & Goodman, J. 2013, PASP, 125, 306, doi: 10.1086/670067
- Gordon et al. (2023) Gordon, A. C., Fong, W.-f., Kilpatrick, C. D., et al. 2023, arXiv e-prints, arXiv:2302.05465. https://arxiv.org/abs/2302.05465
- Green (2019) Green, D. 2019, Journal of Astrophysics and Astronomy, 40, 36
- Gupta & Saini (2018) Gupta, P. D., & Saini, N. 2018, Journal of Astrophysics and Astronomy, 39, 14, doi: 10.1007/s12036-017-9499-9
- Harris et al. (2020) Harris, C. R., Millman, K. J., van der Walt, S. J., et al. 2020, Nature, 585, 357, doi: 10.1038/s41586-020-2649-2
- Heintz et al. (2020) Heintz, K. E., Prochaska, J. X., Simha, S., et al. 2020, ApJ, 903, 152, doi: 10.3847/1538-4357/abb6fb
- Hirschauer et al. (2018) Hirschauer, A. S., Salzer, J. J., Janowiecki, S., & Wegner, G. A. 2018, AJ, 155, 82, doi: 10.3847/1538-3881/aaa4ba
- Hunter (2007) Hunter, J. D. 2007, Computing in Science & Engineering, 9, 90, doi: 10.1109/MCSE.2007.55
- Intema et al. (2017) Intema, H. T., Jagannathan, P., Mooley, K. P., & Frail, D. A. 2017, A&A, 598, A78, doi: 10.1051/0004-6361/201628536
- Jankowski et al. (2023) Jankowski, F., Bezuidenhout, M. C., Caleb, M., et al. 2023, MNRAS, 524, 4275, doi: 10.1093/mnras/stad2041
- Jarrett et al. (2017) Jarrett, T. H., Cluver, M. E., Magoulas, C., et al. 2017, ApJ, 836, 182, doi: 10.3847/1538-4357/836/2/182
- Johnson et al. (2021) Johnson, B. D., Leja, J., Conroy, C., & Speagle, J. S. 2021, ApJS, 254, 22, doi: 10.3847/1538-4365/abef67
- Joye & Mandel (2003) Joye, W. A., & Mandel, E. 2003, in Astronomical Society of the Pacific Conference Series, Vol. 295, Astronomical Data Analysis Software and Systems XII, ed. H. E. Payne, R. I. Jedrzejewski, & R. N. Hook, 489
- Katz (2017) Katz, J. I. 2017, MNRAS, 471, L92, doi: 10.1093/mnrasl/slx113
- Kauffmann et al. (2003) Kauffmann, G., Heckman, T. M., Tremonti, C., et al. 2003, MNRAS, 346, 1055, doi: 10.1111/j.1365-2966.2003.07154.x
- Kennicutt (1998) Kennicutt, Robert C., J. 1998, ARA&A, 36, 189, doi: 10.1146/annurev.astro.36.1.189
- Kewley et al. (2001) Kewley, L. J., Dopita, M. A., Sutherland, R. S., Heisler, C. A., & Trevena, J. 2001, ApJ, 556, 121, doi: 10.1086/321545
- Kewley & Ellison (2008) Kewley, L. J., & Ellison, S. L. 2008, ApJ, 681, 1183, doi: 10.1086/587500
- Kirsten et al. (2021) Kirsten, F., Marcote, B., Nimmo, K., et al. 2021. https://arxiv.org/abs/2105.11445
- Komatsu et al. (2009) Komatsu, E., Dunkley, J., Nolta, M. R., et al. 2009, ApJS, 180, 330, doi: 10.1088/0067-0049/180/2/330
- Kuminski & Shamir (2016) Kuminski, E., & Shamir, L. 2016, ApJS, 223, 20, doi: 10.3847/0067-0049/223/2/20
- Lacy et al. (2020) Lacy, M., Baum, S. A., Chandler, C. J., et al. 2020, Publications of the Astronomical Society of the Pacific, 132, 035001, doi: 10.1088/1538-3873/ab63eb
- Laigle et al. (2016) Laigle, C., McCracken, H. J., Ilbert, O., et al. 2016, ApJS, 224, 24, doi: 10.3847/0067-0049/224/2/24
- Lanman et al. (2022) Lanman, A. E., Andersen, B. C., Chawla, P., et al. 2022, ApJ, 927, 59, doi: 10.3847/1538-4357/ac4bc7
- Law et al. (2022) Law, C. J., Connor, L., & Aggarwal, K. 2022, ApJ, 927, 55, doi: 10.3847/1538-4357/ac4c42
- Law et al. (2018) Law, C. J., Bower, G. C., Burke-Spolaor, S., et al. 2018, ApJS, 236, 8, doi: 10.3847/1538-4365/aab77b
- Leja et al. (2020) Leja, J., Speagle, J. S., Johnson, B. D., et al. 2020, ApJ, 893, 111, doi: 10.3847/1538-4357/ab7e27
- Leung et al. (2021) Leung, C., Mena-Parra, J., Masui, K., et al. 2021, AJ, 161, 81, doi: 10.3847/1538-3881/abd174
- Lorimer et al. (2007) Lorimer, D. R., Bailes, M., McLaughlin, M. A., Narkevic, D. J., & Crawford, F. 2007, Science, 318, 777, doi: 10.1126/science.1147532
- Lunnan et al. (2014) Lunnan, R., Chornock, R., Berger, E., et al. 2014, ApJ, 787, 138, doi: 10.1088/0004-637X/787/2/138
- Machalski & Condon (1999) Machalski, J., & Condon, J. J. 1999, The Astrophysical Journal Supplement Series, 123, 41, doi: 10.1086/313228
- Macquart et al. (2020) Macquart, J.-P., Prochaska, J. X., McQuinn, M., et al. 2020, Nature, 581, 391–395, doi: 10.1038/s41586-020-2300-2
- Mahony et al. (2018) Mahony, E. K., Ekers, R. D., Macquart, J.-P., et al. 2018, ApJ, 867, L10, doi: 10.3847/2041-8213/aae7cb
- Mannings et al. (2021) Mannings, A. G., Fong, W.-f., Simha, S., et al. 2021, ApJ, 917, 75, doi: 10.3847/1538-4357/abff56
- Marcote et al. (2020) Marcote, B., Nimmo, K., Hessels, J. W. T., et al. 2020, Nature, 577, 190, doi: 10.1038/s41586-019-1866-z
- McConnachie (2012) McConnachie, A. W. 2012, AJ, 144, 4, doi: 10.1088/0004-6256/144/1/4
- Mckinven & CHIME/FRB Collaboration (2022) Mckinven, R., & CHIME/FRB Collaboration. 2022, The Astronomer’s Telegram, 15679, 1
- Mena-Parra et al. (2022) Mena-Parra, J., Leung, C., Cary, S., et al. 2022, AJ, 163, 48, doi: 10.3847/1538-3881/ac397a
- Metzger et al. (2019) Metzger, B. D., Margalit, B., & Sironi, L. 2019, MNRAS, 485, 4091, doi: 10.1093/mnras/stz700
- Michilli et al. (2021) Michilli, D., Masui, K. W., Mckinven, R., et al. 2021, The Astrophysical Journal, 910, 147, doi: 10.3847/1538-4357/abe626
- Michilli et al. (2022) Michilli, D., Bhardwaj, M., Brar, C., et al. 2022, arXiv e-prints, arXiv:2212.11941, doi: 10.48550/arXiv.2212.11941
- Moustakas et al. (2013) Moustakas, J., Coil, A. L., Aird, J., et al. 2013, ApJ, 767, 50, doi: 10.1088/0004-637X/767/1/50
- Nikutta et al. (2014) Nikutta, R., Hunt-Walker, N., Nenkova, M., Ivezić, Ž ., & Elitzur, M. 2014, Monthly Notices of the Royal Astronomical Society, 442, 3361, doi: 10.1093/mnras/stu1087
- Nimmo et al. (2023) Nimmo, K., Chatterjee, S., & Petroff, E. 2023, doi: 10.7298/VQGS-GD32
- Nimmo et al. (2022) Nimmo, K., Hewitt, D. M., Hessels, J. W. T., et al. 2022, ApJ, 927, L3, doi: 10.3847/2041-8213/ac540f
- Niu et al. (2021) Niu, C. H., Aggarwal, K., Li, D., et al. 2021, arXiv e-prints, arXiv:2110.07418. https://arxiv.org/abs/2110.07418
- Padovani et al. (2009) Padovani, P., Mainieri, V., Tozzi, P., et al. 2009, ApJ, 694, 235, doi: 10.1088/0004-637X/694/1/235
- Pettini & Pagel (2004) Pettini, M., & Pagel, B. E. J. 2004, MNRAS, 348, L59, doi: 10.1111/j.1365-2966.2004.07591.x
- Planck Collaboration et al. (2020) Planck Collaboration, Aghanim, N., Akrami, Y., et al. 2020, A&A, 641, A6, doi: 10.1051/0004-6361/201833910
- Platts et al. (2019) Platts, E., Weltman, A., Walters, A., et al. 2019, Physics Reports, 821, 1–27, doi: 10.1016/j.physrep.2019.06.003
- Pleunis et al. (2021) Pleunis, Z., Good, D. C., Kaspi, V. M., et al. 2021, ApJ, 923, 1, doi: 10.3847/1538-4357/ac33ac
- Rajwade et al. (2022) Rajwade, K. M., Bezuidenhout, M. C., Caleb, M., et al. 2022, MNRAS, 514, 1961, doi: 10.1093/mnras/stac1450
- Ravi et al. (2022) Ravi, V., Catha, M., Chen, G., et al. 2022, arXiv e-prints, arXiv:2211.09049, doi: 10.48550/arXiv.2211.09049
- Rice et al. (2016) Rice, T. S., Goodman, A. A., Bergin, E. A., Beaumont, C., & Dame, T. M. 2016, ApJ, 822, 52, doi: 10.3847/0004-637X/822/1/52
- Schlegel et al. (1998) Schlegel, D. J., Finkbeiner, D. P., & Davis, M. 1998, ApJ, 500, 525, doi: 10.1086/305772
- Scholz et al. (2017) Scholz, P., Bogdanov, S., Hessels, J. W. T., et al. 2017, ApJ, 846, 80, doi: 10.3847/1538-4357/aa8456
- Science Software Branch at STScI (2012) Science Software Branch at STScI. 2012, PyRAF: Python alternative for IRAF, Astrophysics Source Code Library, record ascl:1207.011. http://ascl.net/1207.011
- Sharma et al. (2023) Sharma, K., Somalwar, J., Law, C., et al. 2023, arXiv e-prints, arXiv:2302.14782, doi: 10.48550/arXiv.2302.14782
- Shimwell et al. (2022) Shimwell, T. W., Hardcastle, M. J., Tasse, C., et al. 2022, A&A, 659, A1, doi: 10.1051/0004-6361/202142484
- Simard et al. (2011) Simard, L., Mendel, J. T., Patton, D. R., Ellison, S. L., & McConnachie, A. W. 2011, ApJS, 196, 11, doi: 10.1088/0067-0049/196/1/11
- Spitzer Science Center & Infrared Science Archive (IRSA)(2021) (SSC) Spitzer Science Center (SSC), & Infrared Science Archive (IRSA). 2021, VizieR Online Data Catalog, II/368
- Tacchella et al. (2022) Tacchella, S., Conroy, C., Faber, S. M., et al. 2022, ApJ, 926, 134, doi: 10.3847/1538-4357/ac449b
- Tremonti et al. (2004) Tremonti, C. A., Heckman, T. M., Kauffmann, G., et al. 2004, ApJ, 613, 898, doi: 10.1086/423264
- Trouille et al. (2011) Trouille, L., Barger, A. J., & Tremonti, C. 2011, ApJ, 742, 46, doi: 10.1088/0004-637X/742/1/46
- Vega et al. (2008) Vega, O., Clemens, M. S., Bressan, A., et al. 2008, A&A, 484, 631, doi: 10.1051/0004-6361:20078883
- Vieyro et al. (2017) Vieyro, F. L., Romero, G. E., Bosch-Ramon, V., Marcote, B., & del Valle, M. V. 2017, A&A, 602, A64, doi: 10.1051/0004-6361/201730556
- Wen & Han (2015) Wen, Z. L., & Han, J. L. 2015, ApJ, 807, 178, doi: 10.1088/0004-637X/807/2/178
- Wen et al. (2009) Wen, Z. L., Han, J. L., & Liu, F. S. 2009, ApJS, 183, 197, doi: 10.1088/0067-0049/183/2/197
- Wen et al. (2012) —. 2012, ApJS, 199, 34, doi: 10.1088/0067-0049/199/2/34
- Wen et al. (2018) Wen, Z. L., Han, J. L., & Yang, F. 2018, MNRAS, 475, 343, doi: 10.1093/mnras/stx3189
- Wright et al. (2010) Wright, E. L., Eisenhardt, P. R. M., Mainzer, A. K., et al. 2010, AJ, 140, 1868, doi: 10.1088/0004-6256/140/6/1868
- Yamasaki & Totani (2020) Yamasaki, S., & Totani, T. 2020, ApJ, 888, 105, doi: 10.3847/1538-4357/ab58c4
- Zhang (2018) Zhang, B. 2018, ApJ, 867, L21, doi: 10.3847/2041-8213/aae8e3
Appendix A PATH Probabilities of all candidates
Here we present the Tables of probabilities of all the sources in the field of FRB 20200223B, FRB 20190110C, and FRB 20191106C. R50 is the half-light radius of the galaxy from the DESI survey, P0.0 is the probability that the object is the preferred host galaxy of the FRB given the prior and P0.1 is the probability that the object is the preferred host galaxy of the FRB given the prior .
| Source | RA | DEC | R50 | r-band | P0.0 | P0.1 |
|---|---|---|---|---|---|---|
| ° | ° | " | mag | |||
| 1 | 8.269527 | 28.831267 | 5.814174 | 16.080395 | 0.994104 | 0.899497 |
| 2 | 8.266982 | 28.829577 | 0.405767 | 22.06333 | 0.001767 | 0.001599 |
| 3 | 8.267366 | 28.82594 | 0.646236 | 21.993284 | 0.001427 | 0.001291 |
| 4 | 8.263246 | 28.828137 | 0.434656 | 23.971949 | 0.000322 | 0.000291 |
| 5 | 8.263912 | 28.828986 | 0.877458 | 23.089138 | 0.000708 | 0.00064 |
| 6 | 8.268353 | 28.826364 | 0.439845 | 22.411278 | 0.000992 | 0.000897 |
| 7 | 8.271681 | 28.835329 | 0.450015 | 22.615425 | 0.000682 | 0.000617 |
| Source | RA | DEC | R50 | r-band | P0.0 | P0.1 |
|---|---|---|---|---|---|---|
| ° | ° | " | mag | |||
| 1 | 249.318485 | 41.443412 | 3.379357 | 18.00912 | 0.917943 | 0.779452 |
| 2 | 249.324262 | 41.442808 | 0.662556 | 22.32065 | 0.013446 | 0.011418 |
| 3 | 249.336069 | 41.448172 | 0.39331 | 21.21785 | 0.025025 | 0.02125 |
| 4 | 249.315487 | 41.448435 | 0.337111 | 23.374989 | 0.003773 | 0.003204 |
| 5 | 249.317587 | 41.444105 | 2.032882 | 21.900526 | 0.016519 | 0.014027 |
| 6 | 249.319692 | 41.437475 | 1.434205 | 23.942047 | 0.002159 | 0.001833 |
| 7 | 249.319796 | 41.440578 | 0.571469 | 22.459723 | 0.009711 | 0.008246 |
| 8 | 249.32092 | 41.448989 | 0.321152 | 23.473305 | 0.004379 | 0.003719 |
| 9 | 249.325318 | 41.441917 | 0.459996 | 23.032875 | 0.007045 | 0.005982 |
| Source | RA | DEC | R50 | r-band | P0.0 | P0.1 |
|---|---|---|---|---|---|---|
| ° | ° | " | mag | |||
| 1 | 199.580129 | 42.999713 | 1.601871 | 17.306004 | 0.951259 | 0.815378 |
| 2 | 199.567778 | 43.005932 | 0.361793 | 23.50386 | 0.001473 | 0.001262 |
| 3 | 199.568633 | 43.007172 | 1.032621 | 21.765076 | 0.006658 | 0.005707 |
| 4 | 199.571617 | 42.998974 | 0.700418 | 22.764788 | 0.00331 | 0.002837 |
| 5 | 199.57512 | 42.99899 | 0.467756 | 22.17816 | 0.006046 | 0.005182 |
| 6 | 199.575607 | 43.007772 | 0.982723 | 21.274609 | 0.012805 | 0.010976 |
| 7 | 199.577994 | 43.000793 | 1.937793 | 23.018389 | 0.003076 | 0.002636 |
| 8 | 199.578285 | 42.994688 | 0.400479 | 23.901838 | 0.001067 | 0.000915 |
| 9 | 199.580623 | 43.009469 | 1.088066 | 22.449223 | 0.003727 | 0.003195 |
| 10 | 199.582184 | 42.998333 | 2.298028 | 21.562593 | 0.009444 | 0.008095 |
| 11 | 199.584588 | 43.000609 | 0.749572 | 23.984762 | 0.001136 | 0.000973 |