Diffusion across a concentration step: Strongly nonmonotonic evolution into thermodynamic equilibrium
Abstract
Dynamical and statistical behavior of the ionic particles in dissolved salts have long been known, but their hydration shells still raise unsettled questions. We engineered a “diffusion tunnel diode” that is structurally analogous to the well-known Esaki diode, but now concentration gradients serve as generalized voltages and the current means particle flow. In an equipartition sense, the hydrated ions enter a cavity as individual particles and later, upon increase of their concentration therein, they lose water molecules that henceforth are particles of their own. These temporarily attached water molecules thus are the tunnel current analogue. Unlike the original tunnel diode, our negative differential resistance has implications for the second law of thermodynamics, due to thermal effects of changes in the hydration shells.
Keywords: Generalization of tunnel diode; Negative differential resistance; Properties of hydration shells; Equipartition law; Entropy
I Introduction
The transfer of electrical conduction mechanisms to situations with other driving forces has a long-standing tradition. Heat conduction driven by temperature gradients, downhill motion of water due to gravity, and diffusion caused by concentration gradiens (our present instance) are common examples. A somewhat less intuitive case is magnetism, where field strength, flux density, and permeability correspond to driving force, current density, and conductivity, respectively.
Usually such issues are studied in a linear regime in the spirit of a generalized Ohm’s law. However, the tunnel diode esaki departs dramatically from linearity, due to a current-voltage characteristic that involves a range of negative differential resistance that is able to undamp an oscillatory circuit. Clearly, this cannot end up in a resonance catastrophe, since amplification stops as this range gets exceeded by the current or voltage amplitude. In any case, there is also a positive static (that is, ohmic) resistance contribution that dissipates energy from the power supply.
As indicated previously, we intend to translate the essentials of the tunnel diode to the case where potential levels are established by particle concentrations, giving rise to diffusive particle currents. At first glance this is doomed to failure, since the tunnel current has no classical analogue (and we disregard de Broglie wave tunneling of particles as heavy as hydrated ions). We pursue quite another course by looking for a purely structural correspondence that in substance is entirely different. Sometimes such analogues are said to be isomorphic.
In the description of the experiment we shall see how the additional particle flow (beyond ordinary diffusion) comes about. We choose NaCl for practical reasons, among them its high solubility in water. Essentially, we consider ions that complete their hydration shell outside of a cavity and later they release the water molecules inside again. In short, we use that there is maximum degree of hydration at minimum concentration of the ions. The occurrence of a negative differential resistance then is straightforward, since the “voltage” between a reservoir with saturated solution and the interior of said cavity is at its maximum for zero ionic particle concentration therein (see below that we additionally organize a zone of low salt concentration, thus enhanced hydration, right outside the cavity). But then there is not yet any water molecules release, and so the transfer rate of separate (independent) water molecules into the cavity peaks at some intermediate voltage. We are aware of other contributions that involve negative differential resistances as well, sometimes also in quite a generalized context with respect to the original Esaki diode, we mention the experiments renk ; kannan . Further, Ref. li presents a simulation not too far from a possible experimental implementation, where the driving force is no longer an electric field strength but a temperature gradient. However, all these authors largely focused on issues we do not primarily have in mind.
The delicate behavior of hydration shells is already a worthy research subject in our view, but we have an even more ambitious goal. Due to energy conservation, hydration is attended with thermal effects, but this concerns the (generalized) tunnel current only. Whereas, in terms of the equipartition law, the “ordinary” particle current, that is, the flow of ionic carriers for the polar water molecules is just made of individual particles, regardless of their hydration status. This has exciting consequences that we intend to investigate.
II Setup for generalized tunnel diode
A device with the desired properties must necessarily have an initial particle concentration gradient, a barrier of geometrically restricted (or, conversely, admitted) moderate diffusion conductance in order to separate regions of different concentrations, and also a possibility to restore the initial situation. Then, very importantly, there should be a built-in equipment to measure small temperature differences and thus, by virtue of the hydration heat, indirectly also concentration profiles.
Fig. 1 presents the required items and, we think, their meaningful assembly, as will emerge later. Bottom-up we see a petri dish that serves as the reservoir for saturated NaCl solution, a toothed structure that stands for a grid to establish a clearance to the thermoelectric generator (TEG) just above, and then a porous glass fiber paper for the diffusion barrier already mentioned. Then there is a plastic frame with a square hole, covered with PTFE tape (Polytetrafluoroethylene, often referred to as Teflon). Above that we use a glass plate that carries a funnel containing glass granules soaked with water by capillary forces, and also the hole or cavity underneath is filled with plain water. All of this is fairly well isolated from the environment by simple means, as only temperatures very close to ambient occur (see below), and so there is little heat exchange. Uppermost there is another funnel for (optional) water inlet, i.e., to flush or replace the water in the aforesaid square cavity, as will be explained later. But this new external water just enters the lower funnel, while flushing takes place with temperature-adapted water that has been there for a long time. Moreover, the water marginally tends to leak out between plastic frame and the moderately hydrophilic glass plate, but the Teflon layer there reliably prevents that.
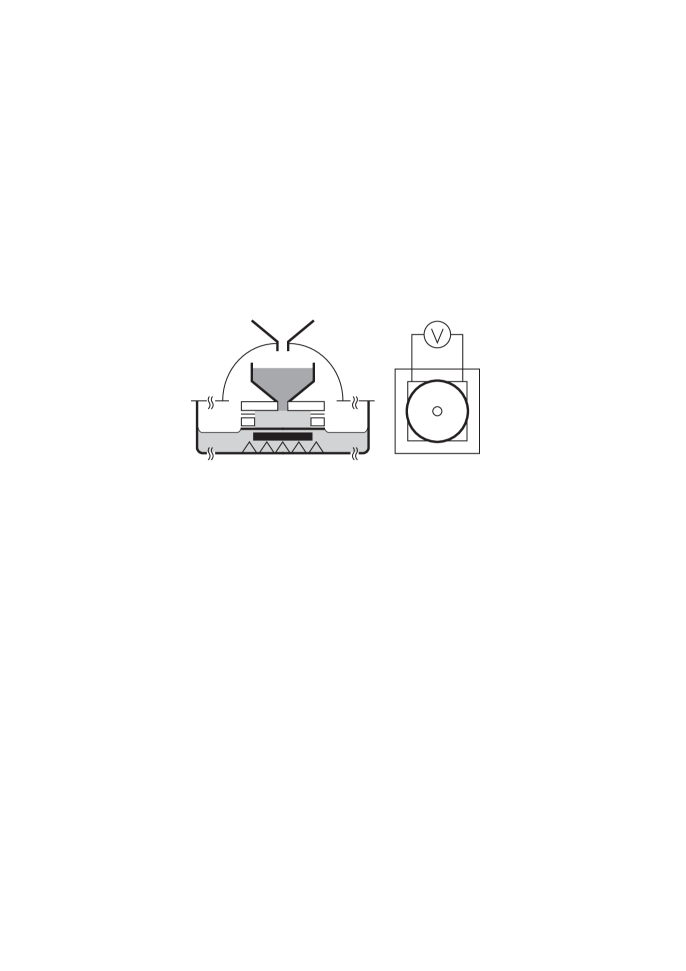
The commercial TEG is a (waterproof sealed) 13 by 13 mm square with an efficiency of some 0.06 V/K, and the hole in the plastic frame is around the same area and 1.5 mm in height. Such lengths matter primarily because of diffusion velocities, as we shall see in the measurements section. This also means that only within certain limits we might proportionally enlarge our setup. Further, the glass fiber paper provides the barrier or obstacle to diffusion from the NaCl solution reservoir into the cavity inside the plastic frame. We use a filter paper around 0.45 mm thick with 93% porosity and 1.5 m pore size in terms of particle retention, but this turns out to be surprisingly uncritical. To see that, we tried greatly different substitutes, among them metal meshes of various thickness and porosity, which altered things just quantitatively. In this respect at least, our setup is quite robust.
With these preliminaries we may now anticipate what our particular arrangement in Fig. 1 is good for, why it is the analogue of a tunnel diode and what we actually want to measure. We place the actual device (with lower funnel and cavity in the plastic frame filled with plain water) into the prepared saltwater reservoir, assemble the isolation from the surroundings and connect the TEG to the voltmeter. Then, at the very beginning of what follows, the temperatures at the TEG should be as balanced as possible (that is, little offset in any sign). Once all the material is provided, this is most easily accomplished by trial and error, as recording such TEG voltage offsets is not overly elaborate. We have already briefly outlined what then happens, namely diffusion out of the reservoir into the cavity, attended with thermally relevant hydration effects. Outside the cavity, predominantly in the filter paper out there (that has also been previously soaked with plain water), we get a “blurred zone” with by far less salt concentration than in the reservoir. There, the hydration increases significantly with respect to the reservoir, which causes heat (or enthalpy) of dilution. Such dilution processes occasionally can even be violent, as is known from the dilution of acids. The reverse then happens in the cavity; the concentration therein grows over time, causing the hydration to decrease and hence the temperature to drop. Just this mechanism will ultimately be used in the subsequent figures. In our view, it is instructive to recognize that in saturated NaCl solution there are only some 4.5 times more water molecules than ions, and so these “few” molecules must account for both hydration as well as liquid between the ions. Provisionally we only note that most likely every water molecule gets involved in hydration, at least temporarily.
Further, the geometry in Fig. 1 deserves some remarks in order to understand the tunnel diode analogy. The hydrated particles diffuse into said cavity from the outside and then proceed further inwards. Clearly, the generalized potential difference is largest between the reservoir and the innermost part of the cavity. Here the intended analogy is certainly less intuitive than in a geometry where the particles perform a transit, i.e., enter the cavity on one side and exit on the opposite one. However, this causes significant engineering problems, and so we stick to the more stable and much simpler version of Fig. 1. We merely have to accept a minor additional generalization step with regard to the archetypal electronic tunnel diode.
III Measurements and their physical meaning
First, we highlight some key properties of diffusion, since they are supremely relevant to experimental geometries in the spirit of Fig. 1 due to rates of change in particle concentrations. At the same time, we also want to look at the Brownian motion of individual particles, primarily because together they make up diffusion as a whole, and also regarding the hydration effects that rather incompletely may be described as a macroscopic overall phenomenon. The interplay of many particles in statistical mechanics and thermodynamics is a vast research domain, we refer to kubo ; blundell for many relevant aspects. We start out with the Langevin equation for a single particle
| (1) |
that, besides friction term and possible external force, comprises the random driving force due to collisions. Frequently, external force means gravitation, but here this is negligible since the hydrated Na+ and Cl- ions do not sediment to the ground. Also, we do not apply an electric field. The collision force is thought to be a long-term function of time, i.e., an irregular sequence of many different collisions.
This situation may be reconsidered as a momentary view of the sum over many particles that perform a random walk according to Eq. (1), once we accept ergodicity to apply in this case. Conveniently, isotropy removes the random term from this sum, and as a final prerequisite we make use of equipartition that introduces temperature. This way, after some steps of rearrangement we arrive at our preferred version of Eq. (1), namely an equation that also covers the few just above stated clear-cut assumptions. This reads
| (2) |
where the spatial mean value of squared distances the particles have departed (in some fixed direction) from their starting point is our new variable. The stationary solution of Eq. (2) is a fairly known result, namely the linearly growing mean value
| (3) |
Here is the diffusion constant as it enters the two major statements for unconstrained diffusion (in large volume liquids) according to Fick’s laws, namely
| (4) |
The vector denotes the particle current density, and Eqs. (4) describe Brownian motion as an overall diffusion phenomenon of many particles with density . We recognize that already unrestricted diffusion constitutes a quasi-equilibrium of Brownian particles with their host medium, since there exists a macroscopic time-evolution while the density gradients tend to even out. Admittedly the process is slow, and so the equipartition law stays almost unaffected. Apart from the time-evolution of in Eqs. (4), we urgently point to the formal analogy of the first equation there with Ohm’s law, as this is a major premise of our current approach.
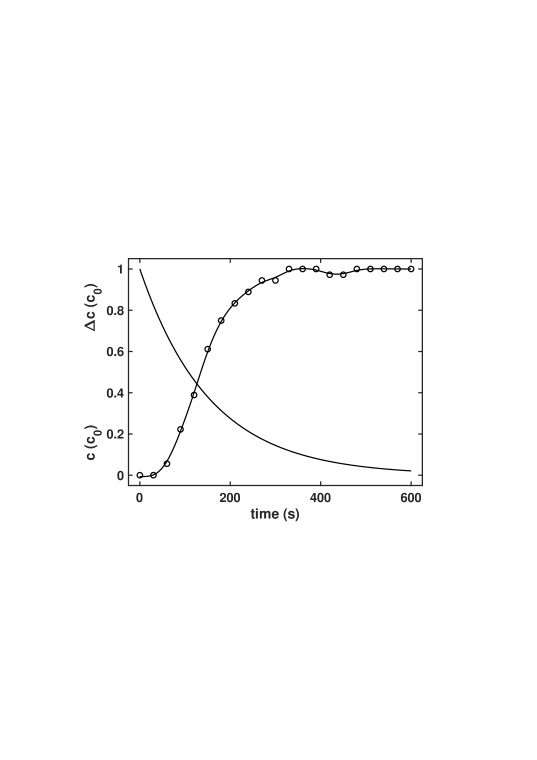
Now we are ready to present Fig. 2 that encompasses many of the issues raised so far. Just the upper funnel in Fig. 1 for water inlet is not yet used here. At , the hydrated ions begin to fill up the all-important cavity in Fig. 1 after traversing the blurred zone (see above). Then, as the concentration in this cavity increases, their degree of hydration descends and gradually approaches the one of saturated solution. This consumes energy and the TEG measures the corresponding temperature drop with respect to the reservoir (note that the warming outside the cavity is not subject to our measurements). The circles in Fig. 2 represent measured Seebeck voltages normalized to the saturation concentration at large times, which corresponds to around 0.9 mV or K across our TEG. After a characteristic time for our chosen geometry s the concentration in the cavity amounts to , that is, just an fraction of is still missing.
Based on the just above stated characteristic time , we can also plot the approximate generalized voltage . In view of the filter paper that acts as a particle inlet barrier, an exponential function with measured decay constant is much more convenient and trustworthy than direct calculation of using Eqs. (4). In sum, we record a spatial average of concentration-dependent temperature changes (drops due to hydration decrease) over the TEG area, measured as a momentaneous overall thermovoltage, which then provides both curves in Fig. 2. After all, at the top right we see that the vertical error bars (voltage measurement plus inherent process instability for our setup) are fairly well given by the diameter of the circles, and at small times the precision is even better.
By virtue of the diffusion dynamics, Fig. 2 depends, e.g., on the dimensions of the TEG. We think it is worthwhile to look at Fig. 3 that renders things now on the more natural abscissa of the generalized voltages . Thus, the exponential in Fig. 2 degenerates to a straight line with slope unity, as this is now simply a function of itself. The most important issue is the strongly unequal distribution of the previously equidistant circles.

Only now, in Fig. 4, we come to the analogues of the currents in the Esaki diode, namely the ordinary diffusive particle flow, and finally the tunnel current that interests us the most. We conveniently set the volume of the cavity to be unity, so that we do not need to distinguish particle numbers and concentrations. Admittedly, our ordinary particle current is somewhat ill-defined in the sense that the hydrated ions enter the cavity and then do not instantaneously reach its innermost part, and so, in a simple linear model for the mean flow, we consider half of the particle entries per unit time to be the actual current. However, we emphasize that this will have no relevance at all for our subsequent investigations, and therefore we prefer a straightforward definition of this certainly less important part of the total current. Then, based on the assumption that just one water molecule per ion gets released from the hydration shell (see below), the cooling in Figs. 2 and 3 that is normalized to saturation concentration measures the number of particles that have contributed to this thermal effect. The ordinary current is proportional to our already stated generalized voltage , and the integral of this current over all times for our above plain model amounts to , which is half of the saturation totality of particles that finally have arrived in the cavity (recall that we equate particle numbers and concentrations, as the volume is thought to be unity). Altogether, the ordinary (or ohmic in our generalized perception) current as a function of time reads
| (5) |
which is normalized as
| (6) |
and in Fig. 4 we merely need the proportionality factor or actually conductance in from the second part of Eq. (5). In the general case, that is, no arrangement specified, this factor corresponds to the diffusion constant in Eqs. (4). This is intuitive, since a lower characteristic time increases the diffusion rate in Fig. 2 and also means an enlarged factor .
Next we proceed to our major concern in this article, namely the generalized tunnel current. On this score, we should care for the concentration-dependent degree of hydration of the ions. What really matters is the increase in hydration as the ion concentration drops and vice versa, while the actual number of attached water molecules affects Fig. 4 only quantitatively. It is not that easy to extract the quantitative extent of hydration from the literature, since the determined hydration status of an ion significantly depends on experimental as well as computational methods. We present a choice of references that have particularly attracted our interest, namely (in chronological order) Refs. soper ; onori ; barnett ; rempe ; carrillo ; korolev ; sahle . These findings may be summerized very briefly as follows: most authors obtain a primary shell with more strongly bound water molecules, namely and of them around Na+ and Cl-, respectively, and some authors do not distinguish inner and outer shells. In addition, an upper limit of involved water molecules is somewhat arbitrary, as this depends on where the too-weak interaction is truncated.

As already mentioned, we assume that, averaged over all the ions, only a single water molecule per ion finally gets released in the cavity. This number (one molecule per ion) depends on the efficiency of our setup, e.g., how well the blurred zone outside the cavity (see above) is able to complete the hydration of ionic particles arriving from the reservoir. More importantly, it strongly matters where in the hydration shell the molecules come from, and so we actually should weight them accordingly. Thus it is not really useful to question this number, as it depends on how it was determined. In this respect, Fig. 4 might then be subject to quantitative changes.
And so, the generalized tunnel current is just the time derivative of the momentaneous number of particles accumulated in the cavity (that has unit volume, see above). We also plot the sum (dashed line in Fig. 4) of ohmic and tunnel current in order to show the structural analogy to the “true” electronic tunnel diode. However, this is not really what we are after. Our main subject of investigation is the tunnel current only, and by virtue of the measured hydration heat, this may well be separated from the ohmic contribution that is an indirectly obtained particle flow. This is in fact a qualitative difference from the original Esaki diode that exhibits an electric tunnel current without such aforesaid thermal effects, just as in the conventional current share based on conduction mechanisms of any semiconductor diode. Note also that more than half of the abscissa in Fig. 4 is attended with a negative differential resistance for the tunnel current alone curve.
The thermal effects are completely decoupled from the ohmic governed particle current, since the released and now independent water molecules in the cavity did not come in as individual particles from the outside, but were an attached part of a hydrated ion. However, this is of paramount importance, as this implies a non-dissipative heat flow out of the cavity, giving rise to the measured cooling inside. Hence, the range of negative differential resistance may be harnessed to undamp thermal oscillations that do not dissipate energy from the driving power supply. Clearly, this range should never be exceeded by the (generalized) voltage or current amplitude in the spirit of Fig. 4, and so we must permanently harvest the thermal oscillation energy. We think this is a possible second law of thermodynamics violation, as the said heat flow out of the cavity spontaneously constitutes a temperature difference, and the input is only the externally powered particle concentration gradient that does not involve the thermal energy attended with unbalanced temperatures. This must then be organized recurrently in order to maintain the oscillations.
We show this relationship between thermal and concentration oscillations in our Fig. 5, which this time also involves the upper funnel in the Fig. 1 setup. Again, the circles are measured points, and the fit still features moderate smoothing, as is easiest seen at the tops of the three structures (maximum cooling in the cavity). The steep rises indicate the flushing events, that is, we pour 0.2 cm3 of plain water into the upper funnel. The basic level, thus apart from the peaks, compares to the 0.9 mV of Fig. 2, but the three peak heights indicate lower temperatures. This is expected, as the liquid in the cavity is somewhat cooler than the one right above the TEG, where thermal conduction out of the reservoir has an influence (however, thermal equilibration in Fig. 2 takes place on a much longer time scale). The cooler saltwater from the bulk region of the cavity then flows over the TEG and causes the measured “cold shocks”. A larger amount of flushing water results in even stronger shocks and, also importantly, improves the salt depletion in the blurred zone (see above) outside the cavity. But, in a cautious attitude, we stay with an amount somewhat less than the cavity volume.

The actual peak heights depend, among other things, on the current conditions in the upper funnel. Further, even their long-term average is of minor importance, since this also depends on the geometrical details in the overall setup. Fig. 5 is just intended to demonstrate how the initial situation with a concentration drop between reservoir and the cavity interior (extended by the blurred zone) can be organized in a periodically recurrent manner.
Moreover, it may be helpful to mind that the situation in Fig. 5 withstands a complete reversal of concentrations, that is, the reservoir now contains plain water, and the cavity as well as lower funnel are initially filled with saturated NaCl solution. Most importantly, “flushing” is also performed with saturated solution. Then, the liquid inside the cavity gets diluted upon concentration equilibration and thus warms up. The flushing processes cause the warmer liquid from the more central area of the cavity to flow over the TEG again, and so we experience “heat shocks” of similar magnitude as the previous coolings.
We have already touched on the possibility of exceptions to the second law, and therein we disregard the issues of a Maxwell’s demon and of time reversal. To our knowledge, there are no such exceptions in statistical mechanics based on point-like particles, that is, in a somewhat hypothetical world where these points are nevertheless realistically spaced for fluids or solids (the ideal gas is a common example). Interestingly, the domain of continuum mechanics (no inner structure or constituents) admits extensions where these exceptions or violations can occur, see ostoja . In the present article, however, we pursue quite another course, namely we scrutinize some rather hidden properties of our working medium, hence of the dissolved hydrated Na+ and Cl- ions.
Regarding particle size only, we summarized our ideas in moser , where we studied a porous medium with hollow sizes that are reasonably related to the particle extent. There we experienced small but undoubtedly measurable entropic consequences. What is most striking in such measurements is the dependence of the diffusion constant on the geometrical conditions, as is shown particularly clearly in lancon . Essentially, we dealt with “thermodynamics” of small systems, namely the pores or hollows in such media, and these weakly coupled subsystems then add up to a macroscopic volume. For an interesting perspective on such small systems, see sekimoto and very recently watanabe . We point to linear response theory that provides a convenient way to theoretically tackle such issues, as the forces of the inner walls on the particles may be naturally incorporated into a generalized external (scalar) force . Let be a (for the sake of simplicity again scalar) unperturbed system’s signal. We state the progressing time-average of its response to said generalized force as
| (7) |
Then, the Fourier transform of the linear response function or susceptibility in Eq. (7) enters
| (8) |
that is the fluctuation-dissipation theorem, see kubo ; blundell . The Heaviside function in Eq. (7) assures causality with respect to the effect of , and in (8) means the Fourier transform of or power spectral density. For the Brownian particles that make up diffusion, theorem (8) states that the dissipation caused by , thus essentially , has the same physical origin as the Brownian fluctuations (characterized by the distribution) themselves. Further, depletion effects are a fairly known research domain where particle size may cause entropic phenomena, see, e.g., karzar . Clearly, in our present approach there are no such peculiarities of porous media (apart from the diffusion barrier between reservoir and cavity, see above), and also depletion effects are minor. However, we point to the strong overlap with our current work, as nonzero particle size is really crucial. A theory where the water molecules for a hydration shell just disappear into point-like particles is, in our view, somewhat strange.
A final remark is devoted to Jarzynski’s equality jarzynski that bypasses the inequality in the second law of thermodynamics; in plain terms, entropy tends to increase (or remains constant in the Hamiltonian, that is, conservative limit). The statement reads
| (9) |
and relates the Helmholtz free energy difference to the work supplied to a system, regardless whether or not we slowly pursue a reversible path of quasi-static states starting at equilibrium situation of reservoir temperature . Here, in with being the internal energy, the term due to dissipation of entropy may well grow. The inequality (entropy remains or rises, or also ) is removed, and this actually supports strict validity of the second law that this way might relate to other physical statements. Jarzynski’s equality goes on to be an active research field, and exciting generalizations have also emerged, see, e.g., Ref. knipschild . However, just as in the particle size discussion above, this is not our primary goal, since we tackle the scope of the second law from a different perspective. By virtue of hydration, our particles have changed size and mass along their way, and this is not covered in Eqs. (8) and (9), neither are the attended thermal effects that are the major subject of this article. Nevertheless, the particles are always small enough that equipartition holds true.
IV Conclusions and outlook
Overall, we have investigated an analogue of the tunnel diode, with the driving force now being a concentration gradient of dissolved ionic particles (we used NaCl in the present work). Clearly, to reproduce the negative differential resistance is imperative, and we point out its long and steep range in Fig. 4. Diffusion processes are notoriously slow, but we envision thermal applications where this is not overly disadvantageous.
The tunnel current analogue consists of water molecules of a hydration shell that in a sense are “stowaways”, as they later get released in a cavity (upon growth of concentration therein). But this process, only after a maximum transfer rate of such water molecules, gradually comes to an end due to concentration equilibration, which also explains the negative differential resistance.
Here it is of great importance that the thermal hydration effects only concern the generalized tunnel current, and not the usual (in our analogy ohmic) particle flow attended with dissipation. This is a beneficial additional feature of our approach compared to the original Esaki diode where the tunnel current cannot be separated from the conventional forward current. Definitely, this has entropic consequences, as the resulting heat flow out of the cavity (see above) is opposite to the inward particle flow driven by a concentration gradient. To our knowledge, the interdependence between hydration heat and a negative differential resistance has not yet been investigated, or maybe rather marginally and indirectly.
There is certainly a lot of potential to improve our setup, above all since we used the energy in a hydration shell only to a small extent. On the theoretical side, we think statistical mechanics of such over time varying hydrated ions has not been studied particularly well either, as hydration involves both statistics and deterministic dynamics. Molecular dynamics simulations may be a promising tool to anticipate the theory, but there are still many unsettled questions.
Acknowledgments
The author thanks P. Robmann and U. Straumann for constructive discussions.
References
- (1) L. Esaki, Phys. Rev. 109, 603 (1958).
- (2) K. F. Renk and B. I. Stahl, Phys. Lett. A 375, 2644 (2011).
- (3) V. Kannan, H.-S. Kim, and H.-C. Park, Phys. Lett. A 380, 3743 (2016).
- (4) F. Li, J. Wang, G. Xia, and Z. Li, Nanoscale 11, 13051 (2019).
- (5) R. Kubo, M. Toda, and N. Hashitsume, Statistical Physics II (Nonequilibrium Statistical Mechanics), 2nd ed. (Springer, Berlin, 2003).
- (6) S. J. Blundell and K. M. Blundell, Concepts in Thermal Physics, 2nd ed. (Oxford University Press, New York, 2010).
- (7) A. K. Soper, G. W. Neilson, J. E. Enderby, and R. A. Howe, J. Phys. C: Solid State Phys. 10, 1793 (1977).
- (8) G. Onori, J. Chem. Phys. 89, 510 (1988).
- (9) R. N. Barnett and U. Landman, Phys. Rev. Lett. 70, 1775 (1993).
- (10) S. B. Rempe and L. R. Pratt, Fluid Phase Equilibria 183-184, 121 (2001).
- (11) M. Carrillo-Tripp, H. Saint-Martin, and I. Ortega-Blake, J. Chem. Phys. 118, 7062 (2003).
- (12) V. P. Korolev, J. Structural Chem. 52, 737 (2011).
- (13) C. J. Sahle, E. de Clermont Gallerande, J. Niskanen, A. Longo, M. Elbers, M. A. Schroer, C. Sternemann, and S. Jahn, Phys. Chem. Chem. Phys. 24, 16075 (2022).
- (14) M. Ostoja-Starzewski, Entropy 19, 78 (2017).
- (15) H. R. Moser, arXiv:1602.04249v1 (2016).
- (16) P. Lançon, G. Batrouni, L. Lobry, and N. Ostrowsky, Physica A 304, 65 (2002).
- (17) K. Sekimoto, F. Takagi, and T. Hondou, Phys. Rev. E 62, 7759 (2000).
- (18) G. Watanabe and Y. Minami, Phys. Rev. Res. 4, L012008 (2022).
- (19) M. Karzar-Jeddi, R. Tuinier, T. Taniguchi, and T.-H. Fan, J. Chem. Phys. 140, 214906 (2014).
- (20) C. Jarzynski, Phys. Rev. Lett. 78, 2690 (1997).
- (21) L. Knipschild, A. Engel, and J. Gemmer, Phys. Rev. E 103, 062139 (2021).