The bright end of the galaxy luminosity function at from the VISTA VIDEO survey
Abstract
We have conducted a search for Lyman break galaxies over 8.2 square degrees of near-infrared imaging from the VISTA Deep Extragalactic Observations (VIDEO) survey in the XMM-Newton - Large Scale Structure (XMM-LSS) and the Extended Chandra Deep Field South (ECDF-S) fields. Candidate galaxies were selected from a full photometric redshift analysis down to a depth of 25.3 (), utilizing deep auxiliary optical and Spitzer/IRAC data to remove brown dwarf and red interloper galaxy contaminants. Our final sample consists of 28 candidate galaxies at with . We derive stellar masses of for the sample, suggesting that these candidates represent some of the most massive galaxies known at this epoch. We measure the rest-frame UV luminosity function (LF) at , confirming previous findings of a gradual decline in number density at the bright-end () that is well described by a double-power law (DPL). We show that quasar contamination in this magnitude range is expected to be minimal, in contrast to conclusions from recent pure-parallel Hubble studies. Our results are up to a factor of ten lower than previous determinations from optical-only ground-based studies at . We find that the inclusion of photometry is vital for removing brown-dwarf contaminants, and samples based on red-optical data alone could be highly contaminated ( per cent). In comparison with other robust samples, our results further support little evolution in the very bright-end of the rest-frame UV LF from –, potentially signalling a lack of mass quenching and/or dust obscuration in the most massive galaxies in the first Gyr.
keywords:
galaxies: formation – galaxies: evolution – galaxies: high-redshift1 Introduction
Observing the formation and evolution of galaxies at very high-redshifts is vital for understanding the build-up of early structures and all subsequent galaxy evolution to the present day. The Lyman-break technique has been used successfully for over three decades to search for high-redshift galaxies (Guhathakurta et al., 1990; Steidel et al., 1996) via the redshifted Lyman- break at Å, by utilizing the strong spectral break that appears at the wavelength of the Lyman- line due to absorption by the IGM along the line of sight. The selection of high-redshift Lyman-break galaxies (LBGs) has been revolutionised thanks to the unparalleled near-infrared capabilities of the James Webb Space Telescope (JWST). Early results have identified and spectroscopically confirmed galaxies in the range – (e.g. Curtis-Lake et al., 2022; Bunker et al., 2023; Arrabal Haro et al., 2023) and rest-frame optical spectroscopy has revealed the gas phase properties for the first time (e.g. Fujimoto et al., 2023; Cameron et al., 2023; Curti et al., 2023). One surprising result from the first samples of galaxy candidates found by JWST has been the discovery of an unexpected number of luminous () sources at (e.g. Naidu et al., 2022; Finkelstein et al., 2022) that have challenged models of galaxy formation (Ferrara et al., 2022).
Galaxies form and reside within dark matter halos, and the luminosity function (LF, number density as a function of brightness) provides a connection to the dark-matter halo-mass function and early galaxy formation since galaxy formation efficiency has a strong dependency on halo mass (e.g. Vale & Ostriker, 2006; Behroozi et al., 2013; Wechsler & Tinker, 2018). This makes the LF a key measurement in galaxy evolution. As at LBGs are typically selected and studied in the near-infrared (NIR), which provides access to the rest-frame UV emission from young stars, many studies have derived the rest-frame UV LF (hereafter UV LF) from photometric samples at (e.g. McLure et al., 2013; Finkelstein et al., 2015; Stefanon et al., 2019; Bouwens et al., 2021). The shape of the UV LF gives insight into feedback properties within galaxies and ionising properties of galaxies in the early Universe (e.g. Benson et al., 2003; McLure et al., 2010; Bradley et al., 2012; Bowler et al., 2015). A common form used to fit the rest-frame UV LF in the local Universe is the Schechter function (Schechter, 1976), , where is the faint end slope, is the characteristic luminosity and is the density normalisation. The faint end follows a power law and a rapid decline is seen in the bright end, necessitating an exponential cut-off beyond the knee at . This suggests the growth of the brightest, most massive galaxies is quenched in lower redshift LBG samples (e.g. van der Burg et al., 2010; Stevans et al., 2018; Adams et al., 2022), since the dark matter halo mass function has a shallower high-mass slope and is more akin to a double power law. Probing the bright end of the rest-frame UV LF requires galaxy searches to be conducted in degree-scale surveys, since the number density of bright objects declines rapidly. For example, LBGs at have a surface density of a few per square degree at (Bowler et al., 2014). The widest survey fields imaged by the Hubble Space Telescope (HST) only cover (e.g. Bouwens et al., 2021), proving only weak constraints on the LF at . Prior to the launch of space missions capable of imaging a wide area (e.g. Euclid and Roman), ground-based NIR surveys provide the only insight into the number density of the very bright galaxy population at . The first determinations of the UV LF with degree-scale surveys showed an excess of bright galaxies compared to the commonly used Schechter function, with a double power law (DPL) fit preferred (Bowler et al., 2012, 2014). The DPL form has also been identified in optical-only studies from the Hyper-Suprime Cam GOLDRUSH program (Ono et al., 2018; Harikane et al., 2022b). This bright end excess appears to continue out to (Stefanon et al., 2019; Bowler et al., 2020). Additionally, there is evidence that whatever mechanism causes the excess in bright galaxies at has a rapid onset, with a clear steepening of the bright-end slope found to occur in the 400 Myrs between and (Bowler et al., 2015; Adams et al., 2022)
Interestingly, many simulations do not predict intrinsic UV LFs with a DPL shape at , with a steeper bright-end only appearing after the addition of significant dust obscuration (e.g. Cai et al. (2014), see compilation in Bowler et al. (2015)). While at lower redshifts the steep decline in luminous/massive galaxies (e.g. Yang et al., 2009) can be attributed to mass quenching (Peng et al., 2010), attenuation or a lack of attenuation is predicted to be the more significant effect in shaping the UV LF at high redshifts (e.g. Cai et al., 2014; Vijayan et al., 2021). Additionally, as active galactic nucei (AGN) begin to grow and turn on in the early Universe, energetic feedback from their accretion disc may suppress star formation in massive galaxies (e.g. Bower et al., 2012; Davé et al., 2019; Lovell et al., 2022). While quasars at are extremely rare (e.g. Mortlock et al., 2011; Bañados et al., 2018; Wang et al., 2021), the quasar LF appears to rapidly increase to lower redshifts, which leads to the faint end of the AGN LF being comparable to the bright end around at (Cano-Díaz et al., 2012; Adams et al., 2022; Harikane et al., 2022b). By determining the functional form of the luminosity function at different redshifts, the onset of potential quenching and/or dust obscuration can be investigated. Comparison of the bright end of the galaxy UV LF with simulations, plus follow-up observations with JWST and ALMA, can then uncover the dominant mechanism responsible for the shape of the UV LF.
A key step in searching for galaxies is the removal of red, dusty galaxies at and cool Galactic M, L and T dwarf stars (e.g. Stanway et al., 2008; Bowler et al., 2015) which have photometry that can mimic a Lyman break. The selection of robust samples requires the use of deep optical, NIR and Spitzer Infrared Array Camera (IRAC) photometry via a colour-colour selection or spectral energy distribution (SED) fitting (e.g. Bowler et al., 2014; Bouwens et al., 2022). In this work we conduct a search for galaxies within the VISTA VIDEO XMM-LSS and ECDF-S fields. Crucially, these fields are covered by a range of deep multi-wavelength data including the optical, red optical and NIR filters extending to (and up to with Spitzer/IRAC data) allowing the robust removal of contaminant populations. This work comprises the largest ground-based optical+NIR search for galaxies to date, providing the most robust constraints on the bright-end of the rest-frame UV LF prior to the launch of wide-area space missions.
This paper is structured as follows. In Section 2 we outline the multi-wavelength datasets, and in Section 3 we present the selection process of our LBG sample. We present our candidate galaxies and their properties in Section 4, and in Section 5 we measure the rest-frame UV LF at and present our results. We discuss contamination and potential contribution by AGN in Section 6. We then present our conclusions in Section 7. In the Appendix we present SED fitting and postage stamps of all candidate objects. We also present an alternate calculation of the UV LF at using a more inclusive sample. All magnitudes are reported in the AB system (Oke & Gunn, 1983). We assume a standard cosmology, .
2 Data
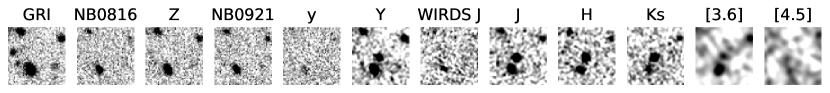
In this study we use multi-wavelength data across two fields, XMM-LSS and ECDF-S. These fields are selected for their coverage by the VISTA Deep Extragalactic Observations (VIDEO) survey in the near-infrared bands (Jarvis et al., 2013), in addition to having overlapping deep optical data. We use the final data release of the VISTA VIDEO survey, which is now publicly available111http://www-astro.physics.ox.ac.uk/~video/public/Home. The VIDEO data in the ELAIS-S1 field is not included due to a current lack of deep optical imaging, particularly in the red optical bands around the expected position of the Lyman break. The total overlapping optical and NIR area used in this work covers . The field footprints are shown in Fig. 1. The optical and NIR bands are used for SED fitting, and Spitzer/Infrared Array Camera (IRAC) imaging in the mid-infrared is used to remove low-redshift dusty interlopers (see Section 3.4).
2.1 XMM-LSS
The VIDEO data are split into three VISTA pointings, or tiles (XMM1, 2, 3), of each as shown in Fig. 1. Optical data are taken from the Data Release of the Hyper Suprime-Cam Subaru Strategic Program (HSC-SSP, Aihara et al., 2022). XMM1 contains an ‘ultradeep’ HSC pointing with longer exposure than the ‘deep’ pointings. The DR3 data provide an increase in 5 depth of mag on DR2 (Aihara et al., 2019). HSC-SSP also provides two narrow bands, NB816 and NB921, near the expected position of the Lyman break at . This can aid in reducing errors on photometric redshifts. In addition, imaging from the Spitzer Extragalactic Representative Volume Survey (SERVS, Mauduit et al., 2012) is used along with the deeper Spitzer Extended Deep Survey (SEDS, Ashby et al., 2013) where available. The area containing overlapping VIDEO and HSC data is 4.33 , accounting for masking of bright stars and artefacts such as stellar ghosts.
2.2 ECDF-S
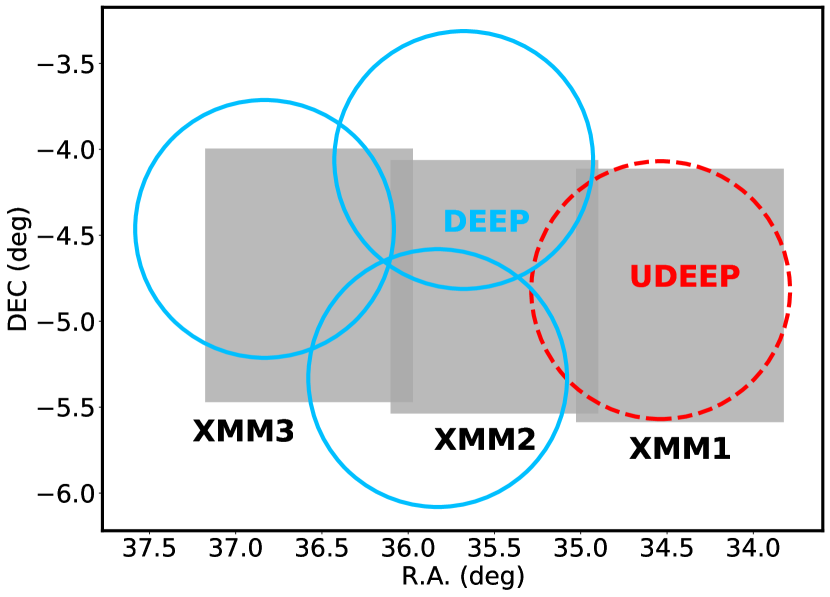
Similarly to XMM-LSS, the VIDEO images in ECDF-S are split into three tiles (CDFS1, 2, 3) of each as shown in Fig. 1. Optical data is comprised of ancillary HSC data compiled by Ni et al. (2019), in the form of four pointings in G, I and Z and a central single pointing of the R-band. The HSC data are a combination of different observation conditions, leading to poor seeing in the - and -bands. The full width at half maximum (FWHM) of the point spread function (PSF) varies by 0.1 arcsec across the field in these bands (see Section 2.4). Furthermore, there is poor coverage in the -band. We therefore complement the HSC data with optical data from VST Optical Imaging of the CDFS and ES1 fields (VOICE, Vaccari et al., 2016), covering . Spitzer/IRAC imaging is taken from the Cosmic Dawn Survey (CDS, Euclid Collaboration et al., 2022a). The area containing overlapping VIDEO, HSC and VOICE data is 3.89 .
2.3 Image processing and depths
The astrometry of the VIDEO data is matched to GAIA (Gaia Collaboration et al., 2018). If not already matched to GAIA, all other auxiliary data was shifted into this frame using Scamp (Bertin, 2006), and the pixel-scale was matched using Swarp (Bertin et al., 2002). The depths were computed across the images to determine flux uncertainties. Circular apertures with a 2 arcsec diameter were placed on empty regions of the image. For the Spitzer/IRAC data we use a 2.8 arcsec diameter aperture to account for the poorer resolution. The Segmentation map produced by SExtractor (Bertin & Arnouts, 1996) was used to avoid foreground objects. To measure the standard deviation of the fluxes, the median absolute deviation (MAD) was used. This is more robust to outliers than Gaussian fitting, and is given by , with . Local depth maps in each image were produced by splitting the image into local regions with a size determined by taking the closest 300 apertures to each point. The global depths were taken as the mode of these local depths and are reported in Table 1.
| Filter | XMM1 | XMM2 | XMM3 | CDFS1 | CDFS2 | CDFS3 |
| u | - | - | - | 25.5 | 25.6 | 25.4 |
| g | - | - | - | 26.0 | 25.9 | 26.0 |
| r | - | - | - | 26.0 | 26.0 | 26.0 |
| i | - | - | - | 24.6 | 24.8 | 24.7 |
| G | 27.6 | 27.1 | 27.1 | 26.5 | 26.2 | 26.4 |
| R | 27.1 | 26.6 | 26.5 | 25.5 | 25.5 | 25.5 |
| I | 26.9 | 26.2 | 26.2 | 25.6 | 25.5 | 25.5 |
| NB0816 | 26.0 | 25.4 | 25.4 | - | - | - |
| Z | 26.5 | 25.9 | 25.9 | 25.1 | 24.8 | 24.8 |
| NB0921 | 26.0 | 25.3 | 25.4 | - | - | - |
| y | 25.6 | 24.7 | 24.7 | - | - | - |
| Y | 25.2 | 25.1 | 25.2 | 25.2 | 25.1 | 25.3 |
| J | 24.7 | 24.7 | 24.7 | 24.6 | 24.9 | 24.6 |
| Y+J | 25.3 | 25.3 | 25.3 | 25.3 | 25.3 | 25.2 |
| H | 24.2 | 24.3 | 24.3 | 24.1 | 24.2 | 24.1 |
| 23.8 | 23.9 | 23.9 | 23.8 | 23.7 | 23.7 | |
| 3.6 | 24.3 | 24.3 | 24.4 | 25.0 | 24.9 | 24.9 |
| 4.5 | 24.1 | 24.1 | 24.1 | 24.8 | 24.8 | 24.8 |
2.4 Catalogue creation
At , the Lyman break will cause objects to drop out of either the , or bands. The VIDEO- band is deeper than the HSC- band (see Table 1), hence we produced fiducial catalogues by running SExtractor in dual image mode on a stacked image (parameters used are provided in Table 2). This probes the rest-frame UV (Å) at . The photometry was performed in 2 arcsec diameter apertures, which encloses 70-80% of the total flux of a point source. This provides high signal-to-noise whilst balancing against the need for a large aperture correction. For the Spitzer/IRAC photometry, 2.8 arcsec diameter apertures were used to account for the broader PSF.
| Parameter | Value |
|---|---|
| DETECT_MINAREA | 3 |
| DETECT_THRESH | 1.4 |
| ANALYSIS_THRESH | 1.4 |
| DEBLEND_NTHRESH | 32 |
| DEBLEND_MINCONT | 0.0001 |
| BACK_SIZE | 64 |
| BACK_FILTERSIZE | 9 |
| BACKPHOTO_TYPE | LOCAL |
| BACKPHOTO_THICK | 24 |
Since fluxes are measured in fixed apertures, the measurement must be corrected to a total flux by accounting for light beyond the aperture using the shape of the PSF. The FWHM of the -band imaging is 0.8 arcsec. However, as mentioned in Section 2.2 for ECDF-S the FWHM of the PSF varies markedly (by up to 0.1 arcsec) across the field for the and bands. We thus used PSFEx (Bertin, 2011) to generate a local PSF model to aperture correct our photometry by splitting each tile into a 1010 grid. For our analysis we only considered regions where VOICE, HSC and VIDEO data overlap (see Fig. 1). Bright stars and regions of low signal-to-noise at the edges of the VISTA VIDEO tiles are masked.
3 Galaxy selection
The selection of robust candidates required several steps, which we detail in this section and present an overview of in Table 3.
3.1 Initial selection
The selected catalogues contained and objects in XMM-LSS and ECDF-S respectively. Objects without overlapping VOICE+HSC+VIDEO imaging are removed, shown as the ‘remove missing data’ step in Table 3. Bright objects were selected by requiring detections at significance in for XMM-LSS. In the ECDF-S data, a cut was insufficient because is mag shallower than (see Table 1), making it challenging to select drop-out objects. We therefore applied a brighter cut in ECDF-S, corresponding to mag brighter than the cut in XMM-LSS.
We then require significance (i.e. a non-detection) in bands bluewards of and including . In ECDF-S the HSC -band is not used for this due to its poor coverage and because is deeper by mag. Similarly, the -band is not used for this since HSC- is mag deeper (see Table 1). The band is also not used due to its significantly shallower depth. Note that all of these bands are later included for SED fitting in Section 3.2. The results of these steps on reducing the sample are shown in Table 3.
| Selection step | Objects remaining |
|---|---|
| XMM-LSS | |
| Initial catalogue | 1814513 |
| Remove missing data | 1707431 |
| cut | 807190 |
| in | 11821 |
| in | 3398 |
| in | 3217 |
| SED fitting: | 307 |
| Visual selection | 121 |
| Dusty galaxies | 97 |
| Brown dwarf removal | 22 |
| ECDF-S | |
| Initial catalogue | 1846027 |
| Remove missing data | 1291653 |
| cut | 428695 |
| in | 2859 |
| in | 1504 |
| in | 1427 |
| in | 1390 |
| SED fitting: | 186 |
| Visual selection | 70 |
| Dusty galaxies | 61 |
| Brown dwarf removal | 6 |
| ID | RA | DEC | Z | NB921 | y | Y | J | H | Ks | [3.6] | [4.5] |
| VIDEO_z7_1∗ | 02:22:56.06 | -05:28:00.37 | |||||||||
| VIDEO_z7_2 | 02:25:51.03 | -04:03:16.98 | > | ||||||||
| VIDEO_z7_3 | 02:26:39.93 | -04:01:09.51 | > | ||||||||
| VIDEO_z7_4 | 02:27:38.62 | -04:51:36.34 | > | > | > | ||||||
| VIDEO_z7_5∗ | 02:26:30.02 | -04:20:32.23 | > | ||||||||
| VIDEO_z7_6 | 02:16:32.44 | -05:30:05.82 | > | > | > | > | |||||
| VIDEO_z7_7 | 02:27:30.78 | -04:25:12.11 | > | ||||||||
| VIDEO_z7_8 | 02:22:05.84 | -04:54:10.85 | > | > | > | > | |||||
| VIDEO_z7_9 | 02:23:47.30 | -05:21:25.49 | |||||||||
| VIDEO_z7_10∗ | 02:16:36.51 | -04:54:50.62 | > | > | |||||||
| VIDEO_z7_11 | 02:24:59.99 | -04:43:54.27 | > | > | > | > | |||||
| VIDEO_z7_12∗ | 02:17:00.07 | -04:12:26.78 | > | > | > | > | |||||
| VIDEO_z7_13 | 02:25:17.59 | -04:38:54.33 | > | > | > | ||||||
| VIDEO_z7_14 | 02:27:37.26 | -04:10:52.04 | > | > | > | > | |||||
| VIDEO_z7_15 | 02:21:29.47 | -05:15:27.24 | > | > | > | > | > | > | |||
| VIDEO_z7_16 | 02:22:27.88 | -05:13:41.40 | > | > | > | > | > | > | |||
| VIDEO_z7_17 | 02:25:30.47 | -05:18:01.46 | > | > | > | > | > | > | |||
| VIDEO_z7_18 | 02:21:16.56 | -04:33:20.28 | > | > | |||||||
| VIDEO_z7_19 | 02:18:06.79 | -04:25:30.56 | > | > | > | > | > | ||||
| VIDEO_z7_20 | 02:15:31.44 | -05:09:07.95 | > | > | > | ||||||
| VIDEO_z7_21∗ | 02:26:46.18 | -04:59:53.51 | > | > | > | ||||||
| VIDEO_z7_22∗ | 02:16:25.10 | -04:57:38.56 | > | > | |||||||
| VIDEO_z7_23∗ | 03:30:17.50 | -28:14:20.71 | > | - | - | ||||||
| VIDEO_z7_24∗ | 03:35:19.41 | -27:49:32.15 | > | - | - | > | > | ||||
| VIDEO_z7_25 | 03:34:44.08 | -28:02:51.72 | > | - | - | ||||||
| VIDEO_z7_26 | 03:28:29.28 | -27:59:28.38 | > | - | - | ||||||
| VIDEO_z7_27 | 03:30:42.79 | -27:17:30.39 | > | - | - | ||||||
| VIDEO_z7_28 | 03:34:29.33 | -28:13:00.47 | > | - | - |
3.2 SED fitting and photometric redshifts
We make use of all available bands to select Lyman break galaxies at by using a SED fitting analysis. SED fitting is done using LePhare (Arnouts et al., 1999; Ilbert et al., 2006), which works by minimising to find the best-fitting redshift and galaxy templates. The redshift was allowed to vary between . Bruzual & Charlot (2003) stellar population models were used with metallicities of . The star-formation histories explored were constant, instantaneous bursts and exponentially declining with timescales in the range Gyr. Stellar population ages could range from 10 Myr to 13.8 Gyr, limited by the age of the Universe at a given redshift. Dust reddening was prescribed by the Calzetti et al. (2000) dust law, with attenuation in the range to allow for very dusty low-redshift interlopers. A Chabrier (2003) initial mass function is assumed, and absorption by the IGM was applied according to Madau (1995). Spitzer/IRAC photometry was not used initially to determine the photometric redshifts of objects due to the larger uncertainties and high rates of confusion due to a larger PSF. Instead, we included the IRAC photometry (when unconfused) for a separate check for low-redshift interlopers (see Section 3.4).
Lyman- emission can increase the photometric redshift of objects by (Bowler et al., 2014) due to the addition of flux to the broadband. This is accounted for by simultaneously fitting Bruzual & Charlot (2003) templates which have lines of equivalent widths Å Å added . To do this, the continuum level was measured from the mean flux between 1250Å and 1300Å. The photometric redshift constraints from this Lyman- analysis are stronger in XMM-LSS due to many overlapping filters around the expected position of the Lyman break, and due to the availability of narrowband filters that can very precisely pick out excess flux due to an emission line. It is highly degenerate in ECDF-S due to the gap between and .
Candidates were first required to have their best fitting solution at . The fits then had to be sufficiently good, defined as () for XMM-LSS (ECDF-S). These values correspond to significance given 5 (6) degrees of freedom. We also required that the high-redshift solution was better than the low-redshift solution by a threshold , which corresponds to a significance. This removes objects in XMM-LSS and in ECDF-S, leaving and objects respectively.
3.3 Visual selection
We conducted a visual selection of the remaining objects to remove artefacts that appear as good high-redshift candidates in the photometry, primarily in the form of crosstalk in VIDEO images and diffraction spikes. Crosstalk is an artefact produced in the readout from the VIRCAM instrument on VISTA that produces ghost images at multiples of 128 pixels in the native scale from bright stars (Bowler et al., 2017). Optical stacked postage stamp images are created to check for low-level optical flux that would indicate a low-redshift galaxy. The bands used for the optical stack are required to have similar depths, leading to a stack in XMM-LSS and a stack in ECDF-S. Single-band detections are also removed. This step removes objects in XMM-LSS and in ECDF-S, leaving and objects respectively.
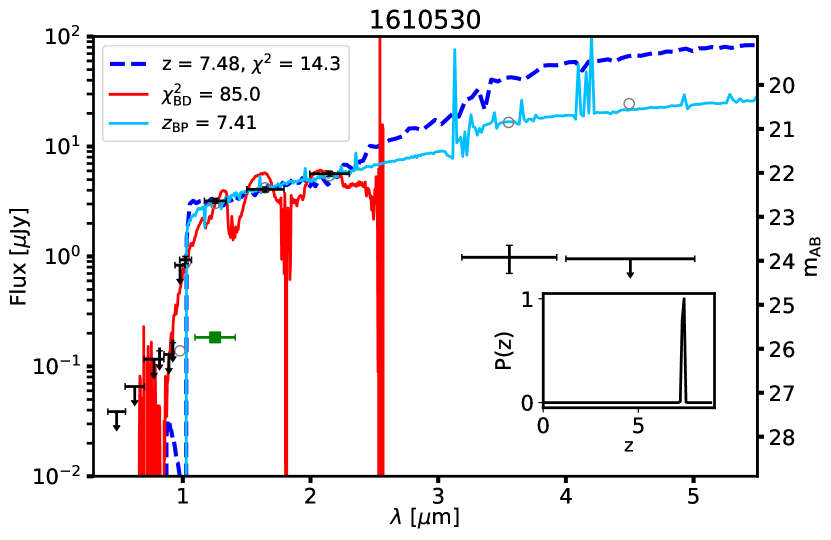
Two objects in XMM-LSS (VIDEO_z7_8 and VIDEO_z7_12) appeared to have low-level flux in their optical stacks. This optical flux is offset from the position of the object in the detection filter by arcsec, suggesting the optical flux originates from a foreground object and hence we retain them. One object (ID 1610530, RA 02:27:12.04, DEC -04:32:05.05) appeared to be remarkably bright at , but a marginal detection at around mag fainter than in and a non-detection at resulted in very unusual photometry that passed our selection criterion. For such a rest-UV bright high-redshift object, we would expect much brighter Spitzer/IRAC flux. We checked for this object in -band imaging from the overlapping WIRCam Deep Survey (WIRDS, Bielby et al., 2012), where it was not present. However, a fainter object closely separated to the south is visible. This object is thus likely either a VIDEO artefact or a transient, supported by the faint detection. The SED fitting and postage stamp images of this object are presented in Appendix C.
3.4 Removing contaminants
Dusty galaxies at with Balmer breaks masquerading as Lyman breaks form one class of contaminant. These galaxies tend to have much redder continuum slopes than galaxies at , as observed in the NIR. We use SED fitting with the Spitzer/IRAC bands to test for dusty low-redshift galaxies. If the SED fitting has a low-redshift solution that is preferred to the high-redshift solution when IRAC is included, the object is rejected if the IRAC photometry is unconfused. This step removes objects in XMM-LSS and objects in ECDF-S, leaving and objects respectively.
M, L and T brown dwarf (BD) stars comprise a major contaminant in high-redshift searches around a magnitude where their number density in extragalactic surveys peaks (Ryan et al., 2011). They have intrinsically red optical to NIR colours with heavy molecular spectral absorption complexes (e.g. Cushing et al., 2008; Marley et al., 2021). The removal of BDs must be done carefully since peaks in their SEDs can line up with the ground-based filters, mimicking a flat NIR colour. We fit our photometry with stellar templates taken from the SpeX prism library (Burgasser, 2014). The , , and bands are excluded from the SED fitting since the templates do not contain any information at these wavelengths. The values are then compared to values, also fitted without these filters. In Bowler et al. (2015), a simulation of brown dwarfs in the Milky Way shows that removing objects with good brown dwarf fits at decreases the contamination rate to essentially zero. We therefore retain those high-redshift candidates which have . This step removes around 80% of objects (see Table 3) compared to around 20% in Bowler et al. (2015). We use a similar model to Bowler et al. (2015) to compute the expected number of brown dwarfs in our fields, assuming a Galactic scale-height of 300 pc. Considering magnitudes down to the depths in XMM-LSS (CDFS), we expect 480 and 220 dwarf stars respectively. Restricting this to the most common stellar types found by our initial SED fitting, we expect 146 and 76 dwarf stars respectively. We do not predict the exact number of dwarf stars because the Galactic scale-height is highly uncertain, with estimates varying between 300 pc (Ryan et al., 2017) and 400 pc (Sorahana et al., 2019). The differences can thus be attributed to a higher LBG number density at the fainter magnitudes and lower redshift probed by their work ( at ), coupled with higher brown dwarf densities at brighter magnitudes probed by this work.
Bowler et al. (2015) state that keeping objects with likely removes some genuine high-redshift galaxies, and they account for this with a completeness correction. We note that many of our candidates with have a significantly better fitting high-redshift galaxy template. In an attempt to be complete to genuine galaxies that may be removed from our primary robust sample due to being fit well as BDs, we conducted a more inclusive BD cut which retains these potential galaxies, and is described in Appendix A.
3.5 SED fitting with BAGPIPES
We repeat SED fitting on the final sample with Bayesian Analysis of Galaxies for Physical Inference and Parameter EStimation (BAGPIPES, Carnall et al., 2018) to compare photometric redshifts with LePhare and determine physical parameters such as stellar masses. The advantage of BAGPIPES is the implementation of grids of nebular emission line models based on input stellar population models. We used a fiducial constant star formation history (SFH) model. The time since star formation switched on varies between the start of the Universe and the redshift being considered. We adopt a uniform prior on the redshift, , and the ionization parameter, . The metallicity is fixed at . Fixing of the metallicity at a value is motivated by recent spectroscopic measurements at that suggest galaxies tend to be metal-poor (e.g. Curtis-Lake et al., 2022; Langeroodi et al., 2022; Matthee et al., 2022; Fujimoto et al., 2023). We also restrict the dust attenuation to the range , limiting it to the largest attenuation we measure with LePhare (VIDEO_z7_25 and VIDEO_z7_26, shown in Table 5). If we do not restrict the range of , large values occur for the objects with the most massive stellar masses: when . This is because dust extinction is degenerate with age (since we have fixed metallicity), so large values are a consequence of the constant SFH model rather than being a realistic estimate of the dust emission (e.g. Inami et al., 2022; Ferrara et al., 2022).
4 The final sample
| ID | Stellar | / mag | ||||||||||
| / mag | / mag | Type | / Å | (BAGPIPES) | (BAGPIPES) | (BAGPIPES) | ||||||
| VIDEO_z7_1∗ | 0.2 | 11.9 | 1.3 | 18.4 | M8 | 18.2 | 40 | |||||
| VIDEO_z7_2 | 0.0 | 11.3 | 1.2 | 36.8 | T3 | 15.8 | ||||||
| VIDEO_z7_3 | 0.2 | 5.4 | 1.3 | 42.8 | M8 | 27.7 | ||||||
| VIDEO_z7_4 | 0.2 | 7.1 | 1.3 | 31.6 | T3 | 23.2 | ||||||
| VIDEO_z7_5 | 0.0 | 6.3 | 1.5 | 21.9 | T3 | 12.5 | ||||||
| VIDEO_z7_61 | 0.0 | 7.9 | 1.3 | 46.2 | M8 | 31.0 | 50 | |||||
| VIDEO_z7_7 | 0.0 | 8.0 | 1.3 | 74.9 | M8 | 65.5 | 50 | |||||
| VIDEO_z7_8 | 0.0 | 4.4 | 1.45 | 16.5 | M6 | 14.2 | ||||||
| VIDEO_z7_9 | 0.0 | 4.1 | 1.25 | 23.5 | M8 | 17.7 | 240 | |||||
| VIDEO_z7_102∗ | 0.2 | 3.4 | 1.35 | 40.4 | T4 | 25.2 | ||||||
| VIDEO_z7_11 | 0.0 | 2.7 | 1.5 | 26.9 | T8 | 20.4 | ||||||
| VIDEO_z7_12∗ | 0.0 | 8.6 | 1.5 | 30.0 | M6 | 33.9 | ||||||
| VIDEO_z7_13 | 0.2 | 8.6 | 1.5 | 54.0 | T8 | 25.9 | ||||||
| VIDEO_z7_14 | 0.0 | 7.8 | 1.5 | 28.2 | T8 | 18.9 | ||||||
| VIDEO_z7_15 | 0.0 | 4.7 | 1.5 | 24.4 | T8 | 12.7 | ||||||
| VIDEO_z7_16 | 0.0 | 8.0 | 1.5 | 31.8 | T8 | 23.5 | ||||||
| VIDEO_z7_17 | 0.0 | 7.8 | 1.15 | 35.1 | T8 | 16.9 | ||||||
| VIDEO_z7_18 | 0.0 | 6.3 | 1.5 | 45.4 | T3 | 23.6 | ||||||
| VIDEO_z7_19 | 0.0 | 9.4 | 1.25 | 88.2 | T8 | 35.9 | ||||||
| VIDEO_z7_20 | 0.0 | 3.7 | 1.45 | 38.7 | T8 | 16.0 | ||||||
| VIDEO_z7_211∗ | 0.1 | 4.5 | 1.5 | 41.8 | T8 | 17.5 | ||||||
| VIDEO_z7_221∗ | 0.0 | 11.4 | 1.6 | 33.6 | T1 | 14.5 | ||||||
| VIDEO_z7_23∗ | 0.0 | 6.7 | 1.45 | 12.2 | M6 | 14.7 | ||||||
| VIDEO_z7_24∗ | 0.0 | 8.3 | 1.45 | 17.7 | M7 | 19.7 | ||||||
| VIDEO_z7_25 | 0.5 | 4.0 | 1.25 | 14.6 | L8 | 13.5 | ||||||
| VIDEO_z7_26 | 0.5 | 4.0 | 1.5 | 8.7 | L8 | 14.7 | ||||||
| VIDEO_z7_27 | 0.0 | 5.6 | 1.45 | 29.4 | M8 | 29.7 | ||||||
| VIDEO_z7_28 | 0.0 | 9.9 | 1.5 | 77.7 | T8 | 11.1 |
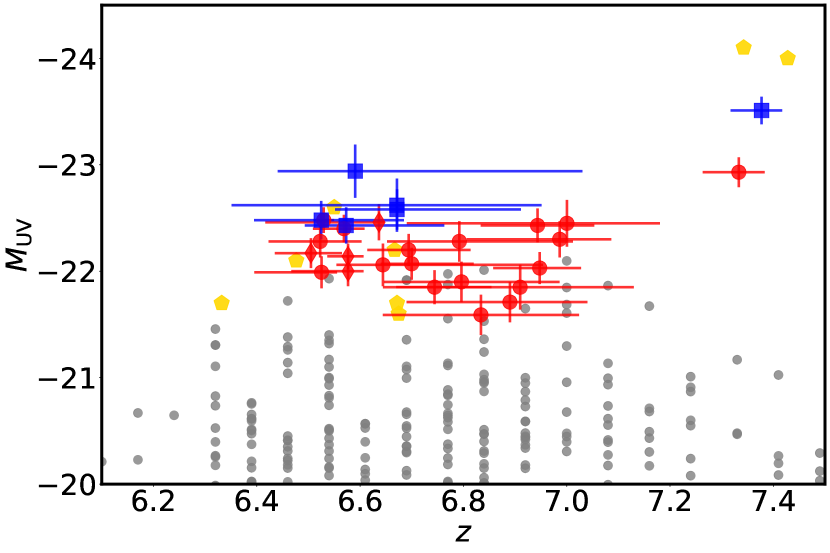
The final sample consists of 28 objects, with photometry presented in Table 4. The results of SED fitting and properties of objects (e.g. photometric redshift, , dust attenuation) are shown in Table 5. Of the 22 primary candidates in XMM-LSS, 18 are newly identified. Five are within the ultradeep HSC pointing, and four have a best-fitting Lyman- template (and have ). The best-fitting rest-frame equivalent widths for these objects are noted in Table 5. In ECDF-S, all candidates are presented here for the first time. One object in ECDF-S had a best-fitting Lyman- template, but was rejected due to having a good low-redshift fit. Therefore, all Ly objects lie in XMM-LSS. The absolute UV magnitudes, , are computed by placing a top-hat filter at 1500Å with width 100Å on the rest-frame best-fitting SED. The sample has a mean redshift , and spans nearly 2 magnitudes in the rest-UV, . The distribution of photometric redshifts against UV absolute magnitude, split by field, is shown in Fig. 2. Candidates in ECDF-S are brighter on average than those in XMM-LSS simply by nature of the different selection thresholds that we imposed because of the shallower optical data available in this field. Uncertainties on the photometric redshifts tend to be lower in XMM-LSS compared to ECDF-S due to the proximity and overlap between , NB921, and around the Lyman break. The grey points in Fig. 2 are candidate galaxies from Bouwens et al. (2021), which uses 1136 square arcminutes of Hubble imaging to derive the rest-UV LF at . Their brightest candidate is . Only 10 of our candidates are fainter than this, showing that these ground-based data better probe the bright-end of the rest-UV LF.
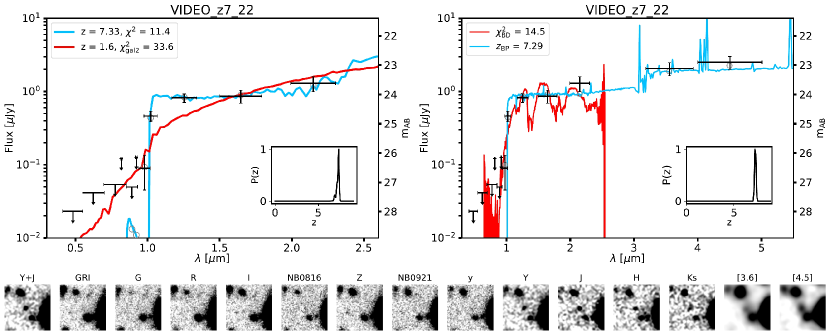
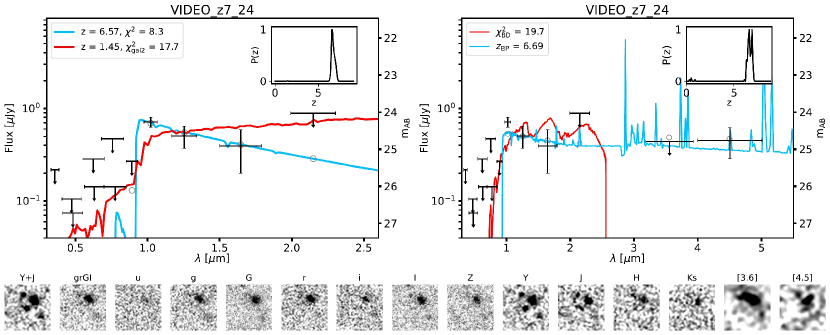
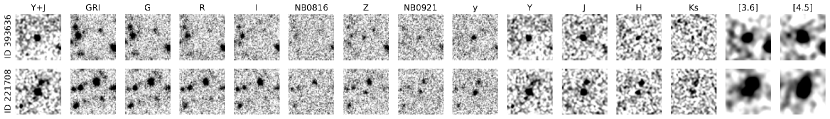
The SED fitting and stamps of a candidate galaxy from each field is shown in Fig. 3. The SED fitting and stamps for all candidates in this work are shown in Appendix B. The [3.6] and [4.5] Spitzer/IRAC bands can be contaminated by nebular emission lines at (primarily H, H, [O ii] and [O iii]). The [3.6] - [4.5] colour will accordingly change with redshift as these lines move through the filters (Smit et al., 2014, 2015). By accounting for nebular emission during SED fitting, we can obtain more precise photometric redshifts. An interesting example is the brightest object in our sample, VIDEO_z7_28, which has a red IRAC colour of and a photometric redshift of . Bowler et al. (2020) extend the expected IRAC colours derived by Smit et al. (2014) out to higher redshifts, predicting that galaxies with strong H emission (Å) can have colours as high as at , in agreement with our photometry for this object. As we discuss later in Section 4.1, we show that several previous candidates at around are likely to be BDs. VIDEO_z7_28 passes our selection criterion with the BD fit showing . It is slightly extended in the data with a FWHM of 1.5 arcsec in comparison to the PSF of the -band. However, we cannot fully rule out a BD solution for this source, and further follow-up will be required to confirm this extremely luminous LBG.
4.1 Comparison to previous work
The Reionisation Era Bright Emission Line Survey (REBELS, Bouwens et al., 2022) is a search for bright galaxies in XMM-LSS and COSMOS, with the aim of following up these galaxies with the Atacama Large Millimeter/submillimeter Array (ALMA). Within XMM-LSS they make use of VIDEO (Jarvis et al., 2013), the UKIDSS Ultra Deep Survey (UDS, Lawrence et al., 2007), and optical data from HSC-SSP DR2 and the Canada-France Hawaii Telescope Legacy Survey (CFHTLS) D1 field (Erben et al., 2009). Of the 40 REBELS objects, 15 are in XMM-LSS and we recover three out of four that are bright enough to meet our cut, namely REBELS-01 (VIDEO_z7_22), REBELS-02 (VIDEO_z7_6) and REBELS-14 (VIDEO_z7_21). REBELS-10 is not recovered due to blending with a foreground object. VIDEO_z7_21 and VIDEO_z7_22 are spectroscopically confirmed at and respectively, in agreement with our photometric redshifts. The difference in objects selected is due to deeper UDS data used by REBELS. By making use of the UDS data they are able to select fainter candidates, and their selection also identifies candidates at .
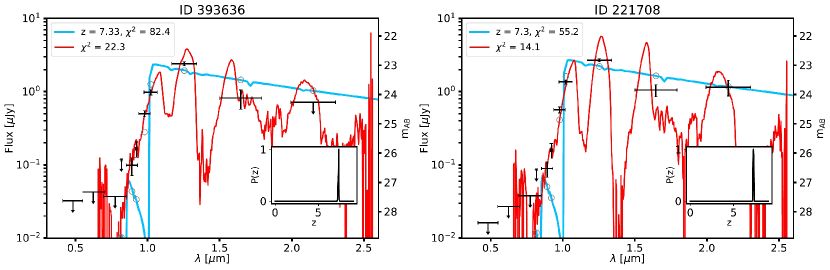
Great Optically Luminous Dropout Research Using HSC (GOLDRUSH, Harikane et al., 2022b) uses HSC-SSP DR2 data () to search for LBGs at . This survey covers to depths comparable to the ‘deep’ and ‘ultradeep’ regions of XMM-LSS outlined in Section 2.1. There are eight objects that overlap with our XMM-LSS data, all in the ‘ultradeep’ HSC pointing. Three out of eight of these objects are recovered in our cut. We find that the two brightest objects recovered at in have preferred brown dwarf fits, with poor galaxy fits. The SED fits for these objects are shown in Fig. 4. These objects have coordinates (RA 02:18:11.39 DEC -05:29:56.55) and (RA 02:17:00.95 DEC -04:40:35.14). The third object (RA 02:19:40.78 DEC -05:13:53.76)222These have IDs 37484833881991283, 37485130234754131 and 37484567594038420 respectively in the Harikane et al. (2022b) catalogue. recovered at in appears to have low-level optical flux, best seen in a stack, due to confusion with a nearby foreground object. Our SED fitting is also used on the remaining five objects that do not satisfy the cut. Of these, two objects have , and three objects have . This appears to give a fiducial contamination rate of per cent, but because we find brown dwarf fits for their brightest objects, it may be the case that their brightest bins are more significantly contaminated. We show the photometric redshifts of the solutions of SED fitting and resulting absolute UV magnitudes for these objects in Fig. 2. The high-redshift solution for the two brown dwarfs places them at with extremely bright absolute UV magnitudes of . The remainder of the objects are fainter, similar to the bulk of our sample. Contamination of the Harikane et al. (2022b) sample, and the impact on the derived bright end of the UV LF, is discussed further in Section 6.1.
Endsley et al. (2021) select galaxies at using overlapping data from HSC-SSP DR2, VIDEO and the UDS. They search in XMM1 and COSMOS, finding 9 objects in XMM1. XMM1-313310 in their study corresponds to VIDEO_z7_10 in this work. We find , agreeing with their redshift range. XMM1-418672 in their study exists in our initial catalogue, but has so is rejected since it fails the cut in XMM-LSS. The other 7 objects were selected by Endsley et al. (2021) in the deeper UDS data, so are not recovered in this work.
4.2 Physical properties with BAGPIPES
Table 5 shows the results of our BAGPIPES fitting. All photometric redshifts measured by BAGPIPES agree with those measured by LePhare apart from objects VIDEO_z7_25 and VIDEO_z7_26 in ECDF-S, which agree within , due to degeneracies in best-fitting redshift because of the gap between the and bands. IRAC detections probe the rest-frame optical, providing improved estimates of stellar masses. Measured stellar masses of the galaxies with unconfused Spitzer/IRAC photometry are in the range , with a mean stellar mass of . Our stellar mass for VIDEO_z7_22 agrees with that found by Bouwens et al. (2022), but our stellar mass for VIDEO_z7_21 is an order of magnitude higher than theirs. This is because Spitzer/IRAC bands for this object are confused, leading to boosted flux due to the foreground object to the north. Bouwens et al. (2022) apply neighbour subtraction to their IRAC photometry, which we do not do. Consequently, we mark objects that are confused in their Spitzer/IRAC photometry with an asterisk in Table 5, indicating that these objects may have overestimated stellar masses. We also show confused IRAC photometry in green and with dashed error bars in the SED fitting plots for all candidates in Appendix B. Nearly half (10/23) of our galaxies with unconfused IRAC photometry have stellar masses , suggesting that these galaxies represent some of the most massive galaxies at this epoch (compared to e.g. Bowler et al., 2014; Bouwens et al., 2022; Labbe et al., 2022). The lower end of our derived stellar masses are more uncertain because the rate of Spitzer/IRAC non-detections increases for , meaning we cannot directly measure the rest-frame optical emission. Our masses are therefore upper limits.
Further issues arise in estimating stellar masses at these redshifts since it is difficult to tell if there is nebular emission (primarily [Oiii] ) contaminating the IRAC photometry, outshining the stellar continuum and masking contributions from the older stellar population. Since we have fixed metallicity, this results in a degeneracy between age and dust attenuation. Whitler et al. (2023) have shown that properties derived from SED fitting depend on the SFH used. The dependence is strongest for derived age and weakest for stellar mass. This can be somewhat remedied by restricting the redshift range and using narrowband and intermediate band photometry to compute more precise photometric redshifts (Endsley et al., 2021), limiting nebular emission to only one of the two Spitzer/IRAC bands and leaving the other free from contamination. Despite this contamination of the IRAC bands, we find that BAGPIPES provides reasonable estimates of the stellar masses in comparison to those derived by excluding contaminated bands entirely (e.g. Bowler et al., 2018).
5 The rest-frame UV Luminosity Function
We use the LBG candidates found in our selection to determine the UV LF at . The method is used to compute points on the LF (Schmidt, 1968), where is the maximum comoving volume a galaxy can occupy and still be included in our survey. The maximum redshift is determined by redshifting the galaxy in steps of until it no longer satisfies the () detection threshold in in XMM-LSS (ECDF-S). is then the comoving volume between and . An upper limit of , the maximum considered redshift, is placed on . The UV LF is then calculated as
| (1) |
where is the width of the magnitude bin and is a completeness correction, which depends on the magnitude and redshift of the object. Poissonian errors are given by
| (2) |
following Adams et al. (2022). Bin widths are chosen for all bins to maximise the number of galaxies in each bin. The bins are centred at and . These bins contain 21, 4 and 1 galaxies respectively. The brightest bin only contains VIDEO_z7_28, so the binning is also chosen to ensure this object is roughly in the centre of the bin. The faintest bin was chosen to ensure we are significantly above where our sample becomes incomplete, as discussed in Section 5.1. We compute an upper limit on the number density of galaxies at with bin width . This is calculated by , where is the volume probed by our survey at .
5.1 Completeness correction
The usable area after accounting for foreground objects and artefacts is 83% in both fields. This factor is incorporated into the calculation of .
The focus of this work is the bright end of the rest-frame UV LF. We expect that the brightest bins are close to complete (excluding area lost due to foreground objects) in a selection since they are much brighter than the detection threshold ( at ). We estimate the completeness of our initial selection (see Section 3.1) by comparing the number of objects per square degree as a function of apparent magnitude in in XMM-LSS and ECDF-S with the ‘ultradeep’ stripes from the UltraVISTA Survey (McCracken et al., 2012) in COSMOS, reaching depths of 26.3 in in the ultradeep stripes, mag deeper than VIDEO. We find, as expected, that our selection is 95 per cent complete by , so we choose our faintest bin to cut off at this absolute UV magnitude. This excludes two candidates from the LF calculation, VIDEO_z7_15 and VIDEO_z7_16.
SED fitting is in general more complete than a colour-colour selection (e.g. Adams et al., 2020), motivating its use in this work. To ensure our SED fitting selection is not overly conservative, we test the completeness of our SED fitting by estimating the fraction of genuine high-redshift galaxies incorrectly cut by our selection as a function of absolute UV magnitude and redshift. The values of used reaches one magnitude below the limit of each of our fields to account for up-scattering of objects into the sample. We use BAGPIPES to generate SEDs with ages varying between 50 Myr to 700 Myr (or the age of the Universe at a given redshift). We vary the dust attenuation between 0 - 0.5 mag and fix the metallicity at . We generate 26,000 galaxies for ECDF-S and each of XMM-LSS ‘deep’ and ‘ultradeep’. Mock photometry in the available bands is generated by perturbing the model photometry using local depths within each field. SED fitting is performed on a catalogue of mock objects, where we apply the cuts outlined in Sections 3.2 and 3.4. The completeness is then the fraction of galaxies recovered in each magnitude-redshift bin. We report the median completeness values for each LF bin in Table 6.
5.2 Cosmic variance
Galaxy surveys are a discrete sampling of the large scale structure of the Universe. Substructures such as voids and filaments can thus impact measurements of the LF if the dimensions of the survey are small. This effect has come to be known as ‘Cosmic Variance’. We make use of the Trenti & Stiavelli (2008) calculator to estimate additional uncertainties due to this. We find that the Poisson errors dominate: cosmic variance contributes just 7.1 per cent to the brightest bin at , going down to a 5.7 per cent contribution to our faintest bin at . We include these contributions in our LF errors by adding them in quadrature.
| Bin / mag | Completeness | ||
|---|---|---|---|
| -22.175 | 21 | 0.63 | |
| -22.925 | 4 | 0.76 | |
| -23.675 | 1 | 0.79 | |
| -24.425 | 0 | - |
5.3 Results
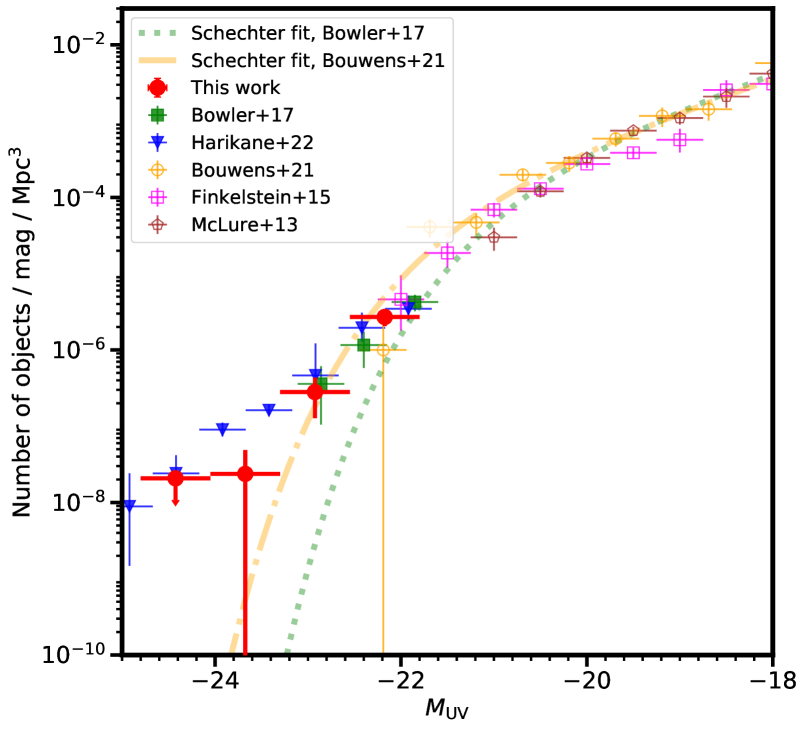
In this section we present our binned rest-frame UV LF measurement at and compare to measurements and best-fitting functions from other studies. In Fig. 5 we show the measurement of the rest-frame UV LF at from this work. The values of each bin are reported in Table 6.
5.3.1 Comparison of binned LF points
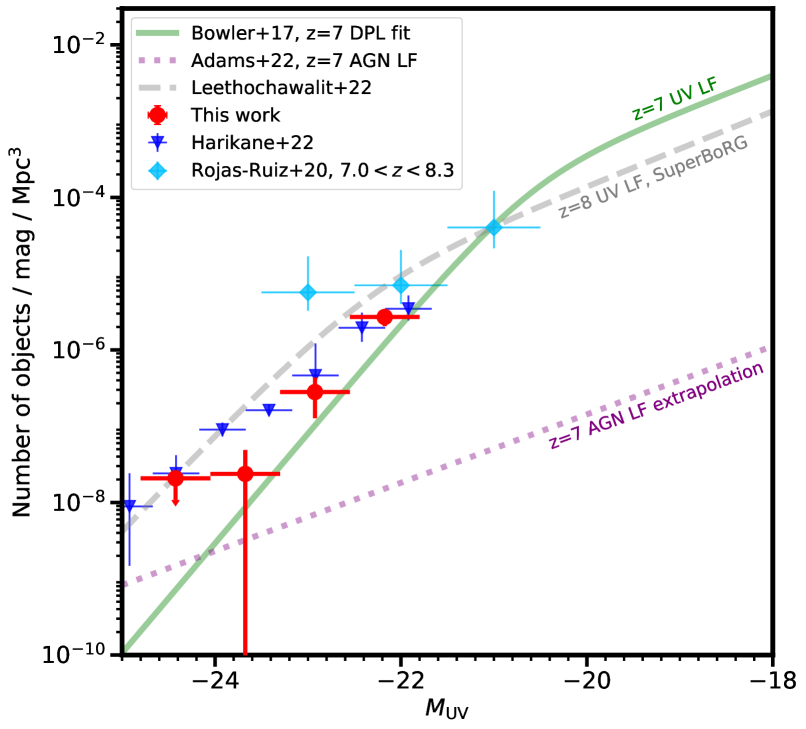
We compare our measurement of the UV LF to current wide-area studies from Harikane et al. (2022b) and Bowler et al. (2017), and add studies of the faint end using Hubble from McLure et al. (2013), Finkelstein et al. (2015) and Bouwens et al. (2021). Bowler et al. (2017) do not probe as bright as this work because they were limited to a smaller survey area of . Harikane et al. (2022b) use of survey data comparable to the depths of optical bands in this work, allowing them to provide the first constraints on the UV LF beyond .
Our faintest point at is in agreement with those found by Finkelstein et al. (2015), Bowler et al. (2017), Bouwens et al. (2021) and Harikane et al. (2022b). Galaxies at represent the brightest that can be found by the widest-area Hubble surveys, and close to the faintest that can be found from VIDEO. The brightest candidate in the current widest area space-based survey (Bouwens et al., 2021) has an absolute UV magnitude . Low number counts at this magnitude result in large error bars for their brightest bright bin, shown in yellow in Fig. 5. Our point at is in agreement with Bowler et al. (2017) and Harikane et al. (2022b), although errors between these three studies span over an order of magnitude. The Bowler et al. (2017) point lies roughly in the middle of our point and that of Harikane et al. (2022b). Our brightest point in the bin at is in tension with Harikane et al. (2022b) at the level, being four times lower than their determination at . In Fig. 2 we showed that the high-redshift solution of SED fitting for the two likely BDs in their sample (see Fig. 4 and Section 4.1) puts them at very bright absolute UV magnitudes of , explaining this tension. We note that our brightest bin contains only one galaxy, VIDEO_z7_28. This source could be a BD, as it is particularly luminous and at a similar redshift to the Harikane et al. (2022b) likely BDs (Fig. 2). If VIDEO_z7_28 is indeed shown to be a BD with later follow-up, this would change this point into an upper limit of objects / mag / , leaving our conclusions unchanged. Finally, we compute an upper limit for the UV LF in a bin at with width , shown in Fig. 5. The LF point derived by Harikane et al. (2022b) at lies on our upper limit, within the errors.
In summary, our determination of the UV LF agrees well with previous studies at . At brighter magnitudes, however, we find a deficit of sources in comparison to Harikane et al. (2022b). An analysis of the two brightest objects in their study suggests they are likely to be BDs. We therefore attribute this difference to contamination and emphasise the importance of NIR photometry in the selection of LBGs.
5.3.2 Schechter vs double power law fitting
In the top panel of Fig. 5 we show the best-fitting Schechter function fits as derived by Bouwens et al. (2021) and Bowler et al. (2017). Our results appear to agree with the bright-end of the Bouwens et al. (2021) Schechter fit, although this is due to large errors on our brightest bin. The Schechter function fit derived by Bowler et al. (2017) uses results from McLure et al. (2013). Similarly to Bowler et al. (2017) and Harikane et al. (2022b), we find that the Schechter function does not fully reproduce the number density of bright galaxies, which our results show continues beyond .
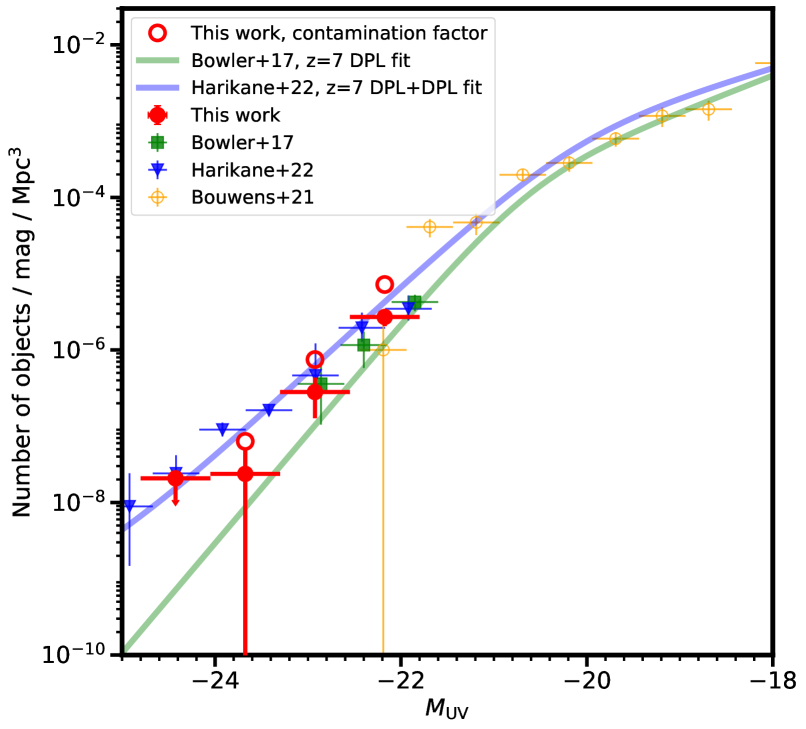
In the bottom panel of Fig. 5 we show the DPL derived by Bowler et al. (2017) and the DPL+DPL (galaxy and AGN component) derived by Harikane et al. (2022b). These functions provide a qualitative better fit to the UV LF measurements from our study. Furthermore, the reduced value we compute for the DPL of Bowler et al. (2017) is which is preferred to their Schechter fit (), as well as the Schechter fit of Bouwens et al. (2021) (), providing further evidence for a DPL as the form of the rest-UV LF at continuing out to . The DPL+DPL of Harikane et al. (2022b) is in excess of our results, with . Our faintest two bins are in agreement with both Bowler et al. (2017) and Harikane et al. (2022b). In particular, the faintest bin is in closer agreement with Harikane et al. (2022b) and the middle bin lies closer to the Bowler et al. (2017) DPL. The differences are more pronounced at brighter magnitudes, where our results are in tension with the Harikane et al. (2022b) fit at the level. The Bowler et al. (2017) DPL is a factor of 5 lower at , and a factor of 10 lower at than Harikane et al. (2022b). Our upper limit at lies just above the Harikane et al. (2022b) DPL+DPL. Assuming that AGN do not contribute to the bright end of rest-frame UV LF at (see Section 6.2) such that the number density continues to decline rapidly at brighter magnitudes, we expect that a measurement of the LF at this magnitude would lie closer to the DPL of Bowler et al. (2017), which is 20 times lower than predicted by Harikane et al. (2022b).
As shown in Section 4.1 and Fig. 4, the brightest objects from Harikane et al. (2022b) that lie in XMM-LSS are best fit by brown dwarf templates when photometry is included. This suggests contamination in their brightest bins. The impact of this contamination on the LF is discussed further in 6.1. By utilising VIDEO photometry we have thus provided a robust measurement of the rest-frame UV LF at out to .
5.4 Comparison to results
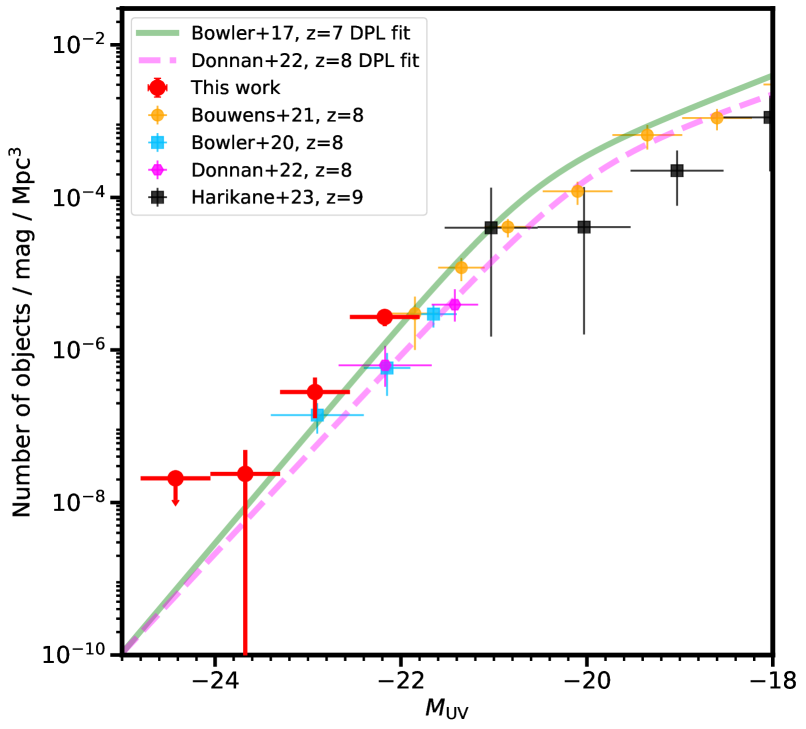
In this section compare our results to various measurements of the rest-frame UV LF at to ascertain whether we find any evidence for evolution in the LF from . In the top panel Fig. 6 we plot results from other ground-based studies (Bowler et al., 2020; Donnan et al., 2022) who both use deep optical and near-infrared imaging from VIDEO, UDS and UltraVISTA, in a similar manner to this work, to identify robust galaxy candidates. We also plot space-based results from Bouwens et al. (2021) of the faint-end of the LF. As expected, our results at are in excess of these results at . We show the DPLs measured at and by Bowler et al. (2017) and Donnan et al. (2022) respectively. Little evolution is expected in the bright-end between these epochs (Bowler et al., 2020; Harikane et al., 2022a), and this is reflected in the small differences between the DPLs and the slight excess of our results to those at .
In the bottom panel of Fig. 6 we show recent results from Hubble pure-parallel studies. Leethochawalit et al. (2022) measure the LF in 0.41 of the Search for the Brightest of Reionizing Galaxies and Quasars in HST Parallel Imaging Data (SuperBoRG), and Rojas-Ruiz et al. (2020) use similar data to derive comparable results. Both studies are in tension with this work. The DPL derived by Leethochawalit et al. (2022) is a factor of 2.5-8 higher than our results, with the excess more pronounced at brighter magnitudes. At , their DPL lies on the upper limit derived in this work. Similarly, the brightest LF point measured by Rojas-Ruiz et al. (2020) is 20 times higher than our measurement at .
6 Discussion
Our results agree with other ground-based deep optical+NIR studies at , but work using deep optical-only ground-based imaging and pure-parallel Hubble imaging derive an excess compared to our findings by up to an order of magnitude. In this section we discuss the potential contributions of quasars and brown dwarf contaminants, and implications of our results on the evolution of the bright-end of the rest-frame UV LF. We also consider how upcoming space-based wide-area missions can aid in building a clearer picture of bright LBG abundances at high redshift.
6.1 Contamination in the bright end of the LF
In Section 5.3 and Fig. 5 we showed that our results are in agreement with the steeper DPL found by Bowler et al. (2017) and are in tension with the flatter decline found by Harikane et al. (2022b). Without the bands, most candidates found in HSC imaging appear as single band detections, or at most have a detection in the - and -bands. Thus only a spectral break can be detected, leaving such samples more vulnerable to contamination. Moreover, by including the HSC narrowbands our objects in XMM-LSS further gain the advantage of the NB921 and filters that overlap with the and filters respectively, allowing for better determination of the nature of the break of an object. We find this to be powerful in detecting the slope of brown dwarf SEDs.
As discussed in Section 4.1, when the data is included in the SED fitting analysis, we found that 4 out of 8 objects from the GOLDRUSH catalogue that overlaps with our data have poor SED fits. The fainter two of these objects have best-fitting SEDs at , while the brighter two have best-fitting brown dwarf templates, as shown in Fig. 4. This gives us a fiducial contamination rate of 50 per cent. We apply this contamination factor to our derived LF points, shown as open red circles in Fig. 5, to assess the impact of contamination on our robust sample. For our faintest and middle bins, these contaminated points lie slightly above and on the fit derived by Harikane et al. (2022b), respectively. Our upper limit also suggests that their DPL+DPL is overestimated at . This implies that not using results in an overestimation of the bright end of the rest-UV LF at . Note that our brightest contaminated LF point still lies slightly below the Harikane et al. (2022b) value at . This suggests that the fiducial contamination rate of 50 per cent could be higher at brighter magnitudes, with brighter bins preferentially affected by brown dwarfs or low-redshift galaxies when only optical data is included. This is in tension with the contamination rate estimated by Harikane et al. (2022b), who claim this is negligible based on results from their spectroscopic catalogue. They are also unable to use SED fitting to remove interlopers at due to lack of bands redwards of the Lyman break. This contamination likely causes the unphysical crossing of the UV LFs as derived in their study at and between (see fig. 8 in Harikane et al., 2022b).
6.2 AGN contribution
In Section 5.3 we showed that the results of pure-parallel Hubble studies (Rojas-Ruiz et al., 2020; Leethochawalit et al., 2022) at are significantly in excess of our results at . Leethochawalit et al. (2022) attribute this excess to a contribution by AGN. The motivation for this comes from Harikane et al. (2022b) who suggest that the faint-end of the AGN LF dominates at at . Adams et al. (2022) measure the AGN LF in the same fields as this study at , as well as in the COSMOS field, and find that the AGN LF evolves more rapidly towards higher redshift. Matsuoka et al. (2018) find that this evolution continues to : their AGN LF crosses the DPL of Bowler et al. (2017) at . Thus, if this strong decline in number density of faint UV-selected AGN continues to (AGN are rare at this epoch, Mortlock et al., 2011; Bañados et al., 2018; Wang et al., 2021), it is unlikely AGN contribute to the galaxy LF at the brighter magnitudes probed by this work and the pure-parallel studies from HST. Furthermore, on the bottom panel of Fig. 6 we show the extrapolation of the AGN LF to as estimated by Adams et al. (2022). We extrapolate the AGN LF to our mean redshift assuming a conservative value of , providing a likely upper limit on the number density of faint AGN. Their extrapolation is times lower than the double power law computed by Bowler et al. (2017) at . Adams et al. (2022) conclude that the AGN number density at is insufficient to contribute to the galaxy LF as found by Bowler et al. (2017). Instead, our results are consistent with little evolution in the bright-end between , as determined by studies also using deep ground-based optical and NIR imaging (Bowler et al., 2020; Donnan et al., 2022). Contamination in the Leethochawalit et al. (2022) sample could be responsible for the excess of objects found in their work: for two thirds of their sample, only a single filter (F350LP) is available bluewards of the break. This is the same filter used in Rojas-Ruiz et al. (2020) to assert non-detections bluewards of the break, likely leading to imperfect removal of low-redshift galaxies and brown dwarfs. The true overlap between the galaxy and AGN LFs at therefore likely occurs somewhat brighter, at . We note that this discussion pertains to unobscured AGN - highly obscured AGN at have been discovered in the COSMOS field (Endsley et al., 2022).
6.3 Astrophysical interpretation
Robust measurements of the bright end of the rest-UV LF at are vital for understanding the evolution of the most star-forming and arguably massive galaxies between this epoch and the present day. The growth of massive galaxies must somehow be suppressed to account for the change in shape of the UV LF over cosmic time, with a DPL observed at high-redshift to the Schechter form seen at low-redshift. One mechanism that may govern the shape of the bright end of the LF is quenching by AGN, where feedback is driven by energetic release from their accretion disc (e.g. Davé et al., 2019; Lovell et al., 2022), removing gas reservoirs from galaxies and limiting star formation. The AGN number density increases rapidly between , thus we know that AGN activity becomes more common (e.g. Matsuoka et al., 2018; Niida et al., 2020; Adams et al., 2022). However, our results suggest that the contribution from AGN at to the rest-frame UV LF is minimal. This indicates that quenching of star formation by AGN is unlikely to impact bright galaxies at .
Alternatively, the build-up of dust may lead to significant obscuration of UV light from galaxies, modifying the intrinsic rest-frame UV LF and causing a steeper decline in the observed bright end of rest-frame UV LF. Star formation enriches the interstellar medium (ISM) with dust, thus preferentially impacting the most massive galaxies. For example, Vijayan et al. (2021) use a simple model linking dust attenuation with ISM metal content and find that dust attenuation becomes important for galaxies with at . Our results suggest dust obscuration does not significantly impact the bright end of the rest-frame UV LF at this epoch. Dust attenuation values are low on average (see Table 5) with no dependence on . These results suggest that a lack of dust attenuation at this epoch could explain the observed DPL shape and the almost constant number density of bright and sources (e.g. as shown in Ferrara et al., 2022). However, we note that the selection of rest-frame UV-bright galaxies can be blind to dust-obscured star formation, and recent studies are beginning to reveal the importance of this process (e.g. Bowler et al., 2022; Inami et al., 2022; Algera et al., 2023) and constrain dust properties at (e.g Inami et al., 2022; Sommovigo et al., 2022).
6.4 Outlook for upcoming surveys
At there is a need to bridge the gap between ground-based and space-based studies around the knee of the UV LF. A mismatch can be seen in Fig. 5 between the brightest bins of Bouwens et al. (2021) and the faintest bins of Bowler et al. (2017) and this work. At the knee, the former suffers from low number counts, and the latter suffers from a lack of depth. Euclid will be able to address this effectively: it will provide 50 of imaging down to depths of in its deep fields (van Mierlo et al., 2022), comparable to the depths of UltraVISTA (covering 1.5 ). It will also be instrumental in providing much more accurate measurements of the ultra-bright end of the LF. It will provide 15,000 of imaging down to (Euclid Collaboration et al., 2022b), slightly deeper than VIDEO. Simply providing thousands more sources will vastly improve number statistics. Additionally, with much greater spatial resolution that comes with space-based observatories, blending will be less of an issue, and will allow a more accurate deconfusion of the Spitzer/IRAC data. The morphology of objects may even be used to distinguish between high-redshift galaxies (extended) and brown dwarfs or AGN (point-like). Since AGN are very rare at , brown dwarf contaminants that appear as point sources could be efficiently removed from LBG samples via a size or morphology cut. We may also be able to finally probe bright enough to see contributions by the AGN LF, settling the debate about where the overlap between the AGN LF faint end and galaxy LF bright end begins.
Although is finding many ‘bright’ candidates at ultra-high redshifts (e.g. Naidu et al., 2022), it may struggle to probe the very bright end () of the UV LF during the Epoch of Reionization since the area it can survey is more limited than ground-based observations. In the top panel of Fig. 6 we plot the results of Harikane et al. (2022a) who measure the UV LF in square arcminutes of NIRCam imaging. The smaller area compared to this work means they are unable probe brighter than . Wider area studies such as COSMOS-Web (Casey et al., 2022) will be able to cover up to 0.5 , but this is still significantly smaller than what can be achieved from ground-based observatories and with Euclid and Roman. It is clear that within the next decade, the combination of JWST with wide-area space observatories will provide a revolution in the measurement of the LF over a broad magnitude range.
7 Conclusions
We have conducted a wide-area search for Lyman break galaxies using deep near-infrared photometry from the VIDEO survey combined with deep optical data and Spitzer/IRAC photometry over an area of . Candidates were selected in a stack reaching depths of in XMM-LSS and depths of in ECDF-S, with non-detections required in bands bluewards of the Lyman break. We show that the inclusion of NIR data from VISTA and Spitzer enables a robust removal of low-redshift galaxies and Galactic brown dwarf contaminants.
We found 28 galaxy candidates with a mean redshift and UV absolute magnitudes in the range . We recovered two spectroscopically confirmed sources from the REBELS Survey (Bouwens et al., 2022). The BAGPIPES SED fitting code was used to confirm the photometric redshifts and derive galaxy properties. We derived stellar masses of for objects with unconfused Spitzer/IRAC photometry, suggesting that these galaxies are some of the most massive at this epoch.
We measure the UV luminosity function at using our candidates and compare to the current widest area searches: Harikane et al. (2022b) who use optical-only data in an area of , and Bowler et al. (2017) who use optical and near-infrared data in an area of . Our results agree with the DPL fit of Bowler et al. (2017) to brighter magnitudes, however they lie significantly below the results of Harikane et al. (2022b). Through SED fitting of the Harikane et al. (2022b) candidates, utilizing the VIDEO photometry and Spitzer/IRAC, we find that the brightest galaxy candidates identified by Harikane et al. (2022b) are likely to be brown dwarfs. Our results suggest that using optical data alone to select galaxies leads to an overestimate by a factor of 2 at and by a factor of at due to contamination.
Extrapolating findings from Adams et al. (2022) predicts a negligible contribution of unobscured AGN at the magnitudes we probe. This is in tension with the conclusions of recent pure-parallel Hubble results at (Rojas-Ruiz et al., 2020; Leethochawalit et al., 2022), which we find to be in excess of our LF by a factor of . Our results provide a robust measure of the bright end of the UV LF, which does not evolve significantly from . This suggests a lack of dust attenuation and/or mass quenching between these epochs. Upcoming wide-area space missions such as Euclid and Roman will provide much larger samples extracted from thousands of of NIR imaging to depths comparable to VIDEO, allowing for determinations of the UV LF beyond at , whilst also providing superior resolution to ground-based imaging, permitting the removal point-like brown dwarf contaminants.
Acknowledgements
RGV acknowledges funding from the Science and Technology Facilities Council (STFC) [grant code ST/W507726/1]. RAAB acknowledges support from an STFC Ernest Rutherford Fellowship [grant number ST/T003596/1]. MJJ acknowledges support of the STFC consolidated grant [ST/S000488/1] and [ST/W000903/1] and from a UKRI Frontiers Research Grant [EP/X026639/1]. MJJ also acknowledges support from the Oxford Hintze Centre for Astrophysical Surveys which is funded through generous support from the Hintze Family Charitable Foundation. NJA acknowledges support from the European Research Council (ERC) Advanced Investigator Grant EPOCHS (788113).
This work is based on data products from observations made with ESO Telescopes at the La Silla Paranal Observatory under ESO programme ID 179.A-2006 and on data products produced by CALET and the Cambridge Astronomy Survey Unit on behalf of the VIDEO consortium.
The Hyper Suprime-Cam (HSC) collaboration includes the astronomical communities of Japan and Taiwan, and Princeton University. The HSC instrumentation and software were developed by the National Astronomical Observatory of Japan (NAOJ), the Kavli Institute for the Physics and Mathematics of the Universe (Kavli IPMU), the University of Tokyo, the High Energy Accelerator Research Organization (KEK), the Academia Sinica Institute for Astronomy and Astrophysics in Taiwan (ASIAA), and Princeton University. Funding was contributed by the FIRST program from the Japanese Cabinet Office, the Ministry of Education, Culture, Sports, Science and Technology (MEXT), the Japan Society for the Promotion of Science (JSPS), Japan Science and Technology Agency (JST), the Toray Science Foundation, NAOJ, Kavli IPMU, KEK, ASIAA, and Princeton University. This paper makes use of software developed for Vera C. Rubin Observatory. We thank the Rubin Observatory for making their code available as free software at http://pipelines.lsst.io/.
This paper is based on data collected at the Subaru Telescope and retrieved from the HSC data archive system, which is operated by the Subaru Telescope and Astronomy Data Center (ADC) at NAOJ. Data analysis was in part carried out with the cooperation of Center for Computational Astrophysics (CfCA), NAOJ. We are honored and grateful for the opportunity of observing the Universe from Maunakea, which has the cultural, historical and natural significance in Hawaii.
Data Availability
All imaging data was obtained from original sources in the public domain. Catalogues of the photometry of samples used in this study can be provided on request.
References
- Adams et al. (2020) Adams N. J., Bowler R. A. A., Jarvis M. J., Häußler B., McLure R. J., Bunker A., Dunlop J. S., Verma A., 2020, MNRAS, 494, 1771
- Adams et al. (2022) Adams N. J., Bowler R. A. A., Jarvis M. J., Varadaraj R. G., Häußler B., 2022, arXiv e-prints, p. arXiv:2207.09342
- Aihara et al. (2019) Aihara H., et al., 2019, PASJ, 71, 114
- Aihara et al. (2022) Aihara H., et al., 2022, PASJ, 74, 247
- Algera et al. (2023) Algera H. S. B., et al., 2023, MNRAS, 518, 6142
- Arnouts et al. (1999) Arnouts S., Cristiani S., Moscardini L., Matarrese S., Lucchin F., Fontana A., Giallongo E., 1999, MNRAS, 310, 540
- Arrabal Haro et al. (2023) Arrabal Haro P., et al., 2023, arXiv e-prints, p. arXiv:2303.15431
- Ashby et al. (2013) Ashby M. L. N., et al., 2013, ApJ, 769, 80
- Bañados et al. (2018) Bañados E., et al., 2018, Nature, 553, 473
- Behroozi et al. (2013) Behroozi P. S., Wechsler R. H., Conroy C., 2013, ApJ, 770, 57
- Benson et al. (2003) Benson A. J., Bower R. G., Frenk C. S., Lacey C. G., Baugh C. M., Cole S., 2003, ApJ, 599, 38
- Bertin (2006) Bertin E., 2006, in Gabriel C., Arviset C., Ponz D., Enrique S., eds, Astronomical Society of the Pacific Conference Series Vol. 351, Astronomical Data Analysis Software and Systems XV. p. 112
- Bertin (2011) Bertin E., 2011, in Evans I. N., Accomazzi A., Mink D. J., Rots A. H., eds, Astronomical Society of the Pacific Conference Series Vol. 442, Astronomical Data Analysis Software and Systems XX. p. 435
- Bertin & Arnouts (1996) Bertin E., Arnouts S., 1996, A&AS, 117, 393
- Bertin et al. (2002) Bertin E., Mellier Y., Radovich M., Missonnier G., Didelon P., Morin B., 2002, in Bohlender D. A., Durand D., Handley T. H., eds, Astronomical Society of the Pacific Conference Series Vol. 281, Astronomical Data Analysis Software and Systems XI. p. 228
- Bielby et al. (2012) Bielby R., et al., 2012, A&A, 545, A23
- Bouwens et al. (2021) Bouwens R. J., et al., 2021, AJ, 162, 47
- Bouwens et al. (2022) Bouwens R. J., et al., 2022, ApJ, 931, 160
- Bower et al. (2012) Bower R. G., Benson A. J., Crain R. A., 2012, MNRAS, 422, 2816
- Bowler et al. (2012) Bowler R. A. A., et al., 2012, MNRAS, 426, 2772
- Bowler et al. (2014) Bowler R. A. A., et al., 2014, MNRAS, 440, 2810
- Bowler et al. (2015) Bowler R. A. A., et al., 2015, MNRAS, 452, 1817
- Bowler et al. (2017) Bowler R. A. A., Dunlop J. S., McLure R. J., McLeod D. J., 2017, MNRAS, 466, 3612
- Bowler et al. (2018) Bowler R. A. A., Bourne N., Dunlop J. S., McLure R. J., McLeod D. J., 2018, MNRAS, 481, 1631
- Bowler et al. (2020) Bowler R. A. A., Jarvis M. J., Dunlop J. S., McLure R. J., McLeod D. J., Adams N. J., Milvang-Jensen B., McCracken H. J., 2020, MNRAS, 493, 2059
- Bowler et al. (2022) Bowler R. A. A., Cullen F., McLure R. J., Dunlop J. S., Avison A., 2022, MNRAS, 510, 5088
- Bradley et al. (2012) Bradley L. D., et al., 2012, ApJ, 760, 108
- Bruzual & Charlot (2003) Bruzual G., Charlot S., 2003, MNRAS, 344, 1000
- Bunker et al. (2023) Bunker A. J., et al., 2023, arXiv e-prints, p. arXiv:2302.07256
- Burgasser (2014) Burgasser A. J., 2014, in Astronomical Society of India Conference Series. pp 7–16 (arXiv:1406.4887), doi:10.48550/arXiv.1406.4887
- Cai et al. (2014) Cai Z.-Y., Lapi A., Bressan A., De Zotti G., Negrello M., Danese L., 2014, ApJ, 785, 65
- Calzetti et al. (2000) Calzetti D., Armus L., Bohlin R. C., Kinney A. L., Koornneef J., Storchi-Bergmann T., 2000, ApJ, 533, 682
- Cameron et al. (2023) Cameron A. J., et al., 2023, arXiv e-prints, p. arXiv:2302.04298
- Cano-Díaz et al. (2012) Cano-Díaz M., Maiolino R., Marconi A., Netzer H., Shemmer O., Cresci G., 2012, A&A, 537, L8
- Carnall et al. (2018) Carnall A. C., McLure R. J., Dunlop J. S., Davé R., 2018, MNRAS, 480, 4379
- Casey et al. (2022) Casey C. M., et al., 2022, arXiv e-prints, p. arXiv:2211.07865
- Chabrier (2003) Chabrier G., 2003, PASP, 115, 763
- Curti et al. (2023) Curti M., et al., 2023, MNRAS, 518, 425
- Curtis-Lake et al. (2022) Curtis-Lake E., et al., 2022, arXiv e-prints, p. arXiv:2212.04568
- Cushing et al. (2008) Cushing M. C., et al., 2008, ApJ, 678, 1372
- Davé et al. (2019) Davé R., Anglés-Alcázar D., Narayanan D., Li Q., Rafieferantsoa M. H., Appleby S., 2019, MNRAS, 486, 2827
- Donnan et al. (2022) Donnan C. T., et al., 2022, arXiv e-prints, p. arXiv:2207.12356
- Endsley et al. (2021) Endsley R., Stark D. P., Chevallard J., Charlot S., 2021, MNRAS, 500, 5229
- Endsley et al. (2022) Endsley R., et al., 2022, arXiv e-prints, p. arXiv:2206.00018
- Erben et al. (2009) Erben T., et al., 2009, A&A, 493, 1197
- Euclid Collaboration et al. (2022a) Euclid Collaboration et al., 2022a, A&A, 658, A126
- Euclid Collaboration et al. (2022b) Euclid Collaboration et al., 2022b, A&A, 662, A112
- Ferrara et al. (2022) Ferrara A., Pallottini A., Dayal P., 2022, arXiv e-prints, p. arXiv:2208.00720
- Finkelstein et al. (2015) Finkelstein S. L., et al., 2015, ApJ, 810, 71
- Finkelstein et al. (2022) Finkelstein S. L., et al., 2022, ApJ, 940, L55
- Fujimoto et al. (2023) Fujimoto S., et al., 2023, arXiv e-prints, p. arXiv:2301.09482
- Gaia Collaboration et al. (2018) Gaia Collaboration et al., 2018, A&A, 616, A1
- Guhathakurta et al. (1990) Guhathakurta P., Tyson J. A., Majewski S. R., 1990, ApJ, 357, L9
- Harikane et al. (2022a) Harikane Y., et al., 2022a, arXiv e-prints, p. arXiv:2208.01612
- Harikane et al. (2022b) Harikane Y., et al., 2022b, ApJS, 259, 20
- Ilbert et al. (2006) Ilbert O., et al., 2006, A&A, 457, 841
- Inami et al. (2022) Inami H., et al., 2022, MNRAS, 515, 3126
- Jarvis et al. (2013) Jarvis M. J., et al., 2013, MNRAS, 428, 1281
- Labbe et al. (2022) Labbe I., et al., 2022, arXiv e-prints, p. arXiv:2207.12446
- Langeroodi et al. (2022) Langeroodi D., et al., 2022, arXiv e-prints, p. arXiv:2212.02491
- Lawrence et al. (2007) Lawrence A., et al., 2007, MNRAS, 379, 1599
- Leethochawalit et al. (2022) Leethochawalit N., Roberts-Borsani G., Morishita T., Trenti M., Treu T., 2022, arXiv e-prints, p. arXiv:2205.15388
- Lovell et al. (2022) Lovell C. C., et al., 2022, arXiv e-prints, p. arXiv:2211.07540
- Madau (1995) Madau P., 1995, ApJ, 441, 18
- Marley et al. (2021) Marley M. S., et al., 2021, ApJ, 920, 85
- Matsuoka et al. (2018) Matsuoka Y., et al., 2018, ApJ, 869, 150
- Matthee et al. (2022) Matthee J., Mackenzie R., Simcoe R. A., Kashino D., Lilly S. J., Bordoloi R., Eilers A.-C., 2022, arXiv e-prints, p. arXiv:2211.08255
- Mauduit et al. (2012) Mauduit J. C., et al., 2012, PASP, 124, 714
- McCracken et al. (2012) McCracken H. J., et al., 2012, A&A, 544, A156
- McLure et al. (2010) McLure R. J., Dunlop J. S., Cirasuolo M., Koekemoer A. M., Sabbi E., Stark D. P., Targett T. A., Ellis R. S., 2010, MNRAS, 403, 960
- McLure et al. (2013) McLure R. J., et al., 2013, MNRAS, 432, 2696
- Mortlock et al. (2011) Mortlock D. J., et al., 2011, Nature, 474, 616
- Naidu et al. (2022) Naidu R. P., et al., 2022, ApJ, 940, L14
- Ni et al. (2019) Ni Q., Timlin J., Brandt W. N., Yang G., 2019, RNAAS, 3, 5
- Niida et al. (2020) Niida M., et al., 2020, ApJ, 904, 89
- Oke & Gunn (1983) Oke J. B., Gunn J. E., 1983, ApJ, 266, 713
- Ono et al. (2018) Ono Y., et al., 2018, PASJ, 70, S10
- Peng et al. (2010) Peng Y.-j., et al., 2010, ApJ, 721, 193
- Rojas-Ruiz et al. (2020) Rojas-Ruiz S., Finkelstein S. L., Bagley M. B., Stevans M., Finkelstein K. D., Larson R., Mechtley M., Diekmann J., 2020, ApJ, 891, 146
- Ryan et al. (2011) Ryan R. E., et al., 2011, ApJ, 739, 83
- Ryan et al. (2017) Ryan Russell E. J., et al., 2017, ApJ, 847, 53
- Schechter (1976) Schechter P., 1976, ApJ, 203, 297
- Schmidt (1968) Schmidt M., 1968, ApJ, 151, 393
- Smit et al. (2014) Smit R., et al., 2014, ApJ, 784, 58
- Smit et al. (2015) Smit R., et al., 2015, ApJ, 801, 122
- Sommovigo et al. (2022) Sommovigo L., et al., 2022, MNRAS, 513, 3122
- Sorahana et al. (2019) Sorahana S., Nakajima T., Matsuoka Y., 2019, ApJ, 870, 118
- Stanway et al. (2008) Stanway E. R., Bremer M. N., Squitieri V., Douglas L. S., Lehnert M. D., 2008, MNRAS, 386, 370
- Stefanon et al. (2019) Stefanon M., et al., 2019, ApJ, 883, 99
- Steidel et al. (1996) Steidel C. C., Giavalisco M., Pettini M., Dickinson M., Adelberger K. L., 1996, ApJ, 462, L17
- Stevans et al. (2018) Stevans M. L., et al., 2018, ApJ, 863, 63
- Trenti & Stiavelli (2008) Trenti M., Stiavelli M., 2008, ApJ, 676, 767
- Vaccari et al. (2016) Vaccari M., et al., 2016, in The 4th Annual Conference on High Energy Astrophysics in Southern Africa (HEASA 2016). p. 26 (arXiv:1704.01495)
- Vale & Ostriker (2006) Vale A., Ostriker J. P., 2006, MNRAS, 371, 1173
- Vijayan et al. (2021) Vijayan A. P., Lovell C. C., Wilkins S. M., Thomas P. A., Barnes D. J., Irodotou D., Kuusisto J., Roper W. J., 2021, MNRAS, 501, 3289
- Wang et al. (2021) Wang F., et al., 2021, ApJ, 907, L1
- Wechsler & Tinker (2018) Wechsler R. H., Tinker J. L., 2018, ARA&A, 56, 435
- Whitler et al. (2023) Whitler L., Stark D. P., Endsley R., Leja J., Charlot S., Chevallard J., 2023, MNRAS, 519, 5859
- Yang et al. (2009) Yang X., Mo H. J., van den Bosch F. C., 2009, ApJ, 695, 900
- van Mierlo et al. (2022) van Mierlo S. E., et al., 2022, A&A, 666, A200
- van der Burg et al. (2010) van der Burg R. F. J., Hildebrandt H., Erben T., 2010, A&A, 523, A74
Appendix A Adding inclusive candidates to the LF calculation
| ID | RA | DEC | Z | NB921 | y | Y | J | H | Ks | [3.6] | [4.5] |
|---|---|---|---|---|---|---|---|---|---|---|---|
| 170389 | 02:16:38.75 | -04:28:50.98 | > | > | > | > | > | ||||
| 1415071 | 02:25:49.21 | -04:02:38.00 | > | > | |||||||
| 1017553 | 02:22:52.86 | -05:04:37.97 | > | > | > | > | |||||
| 914913 | 02:22:07.26 | -05:24:02.32 | > | > | > | ||||||
| 1495402 | 03:35:25.99 | -28:38:19.13 | > | - | - | ||||||
| 705214 | 03:30:30.53 | -27:23:16.47 | > | - | - | > | > | ||||
| 1090797 | 03:32:28.28 | -27:48:02.25 | > | - | - | ||||||
| 834371 | 03:31:09.95 | -28:43:55.05 | > | - | - |
| ID | Stellar Type | |||||||
|---|---|---|---|---|---|---|---|---|
| / mag | / mag | |||||||
| 170389 | 0.0 | 5.3 | 9.0 | 26.5 | T8 | 9.8 | ||
| 914913 | 0.0 | 4.3 | 1.2 | 14.4 | T3 | 8.1 | ||
| 1017553 | 0.0 | 0.9 | 1.5 | 13.5 | T3 | 6.2 | ||
| 1415071 | 0.2 | 1.6 | 1.4 | 18.4 | T3 | 9.0 | ||
| 705214 | 0.2 | 3.8 | 1.45 | 11.5 | T8 | 9.8 | ||
| 834371 | 0.0 | 1.8 | 1.7 | 12.2 | L7 | 6.4 | ||
| 1090797 | 0.0 | 3.2 | 1.5 | 38.4 | T8 | 6.8 | ||
| 1495402 | 0.0 | 1.6 | 1.6 | 25.8 | L4 | 5.7 |
| Bin | Bin width | Completeness | ||
|---|---|---|---|---|
| / mag | / mag | |||
| -22.05 | 0.5 | 18 | 0.68 | |
| -22.55 | 0.5 | 10 | 0.74 | |
| -23.175 | 0.75 | 5 | 0.79 | |
| -23.925 | 0.75 | 1 | 0.82 |
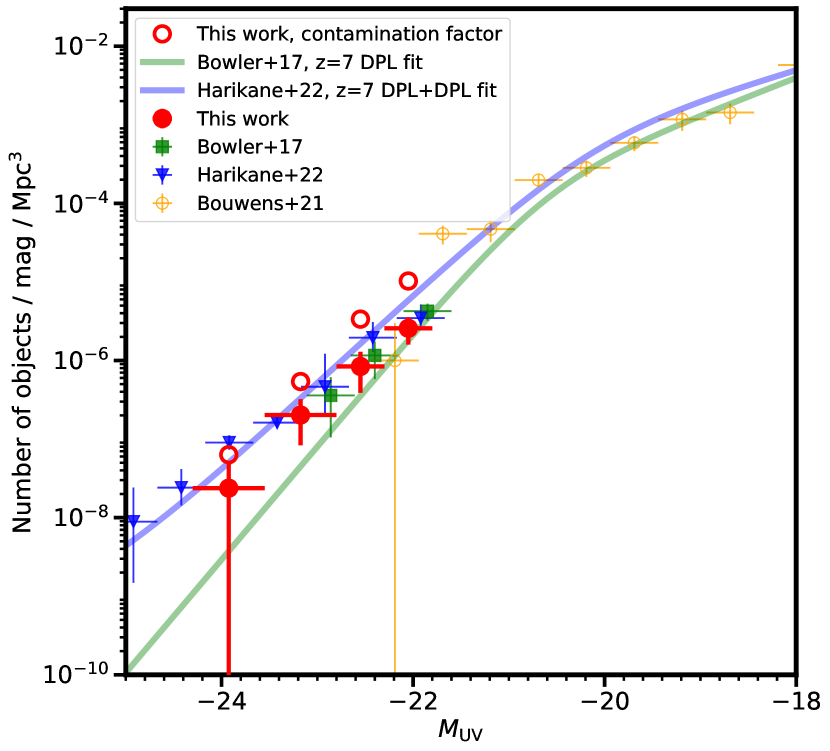
In this Appendix we present a more inclusive selection of candidates, which includes sources that have a plausible brown dwarf fit but are still better represented by a high-redshift galaxy model. Bowler et al. (2015) state that removing objects with a good brown dwarf fit , likely removes genuine high-redshift galaxies. We retain objects that have good brown dwarf fits and significantly better galaxy fits, . These candidates are not robust due to the well-fitted brown dwarf SEDs. However, they pass our other selection criteria. We find four inclusive candidates in XMM-LSS, and four in ECDF-S. Their photometry is shown in Table 7. The results of SED fitting analysis with LePhare is shown in Table 8. In ECDF-S the candidates are much brighter than our primary sample: 4 have absolute UV magnitudes , and 1 has . The SED fitting and stamps for the inclusive candidates are shown in Fig. 16 and Fig. 17. We add these objects to the primary sample and conduct a separate calculation of the rest-UV LF at , as outlined in Section 5. The result is shown in Fig. 7. We also plot the DPL fits derived by Bowler et al. (2017) and Harikane et al. (2022b), and their LF points. We include Bouwens et al. (2021) LF points to represent the faint end. The bins are centred at -22.05, -22.55, -23.175 and -23.925, with bin widths of for the two fainter bins and for the two brighter bins. The bins contain 18, 10, 5 and 1 candidate galaxies respectively. The LF points are summarised in Table 9. If we include the contamination factor of 50 per cent derived in Section 4.1, our three faintest bins lie slightly above the DPL+DPL derived by Harikane et al. (2022b). The brightest bin is consistent with both DPLs, although the Poisson errors are large. The value of the LF in our brightest bin is a factor of four lower than the Harikane et al. (2022b) bin at . The contamination factor pushes this bin onto their DPL. To summarise, the fiducial UV LF we present in Fig. 5 is our best estimate of the number density of genuine sources. However, even if we relax our selection criterion to allow sources which have a plausible brown dwarf fit into the sample, we still find the UV LF to be significantly lower than that found in optical-only surveys for our brightest bins.
Appendix B Object Stamps and SED fits
In this Appendix we present postage stamps and SED fitting of all candidates in this work. The first two sections are primary candidates in ECDF-S and XMM-LSS. The third section is Lyman- candidates, all in XMM-LSS. The final two sections are inclusive candidates in ECDF-S and XMM-LSS.
B.1 Primary Candidates
B.1.1 XMM-LSS
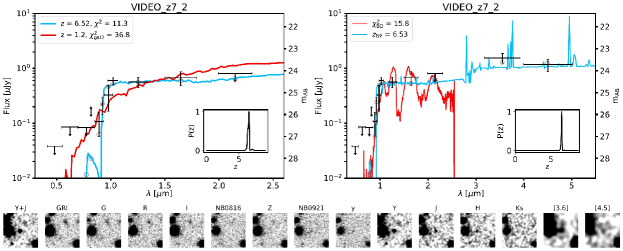
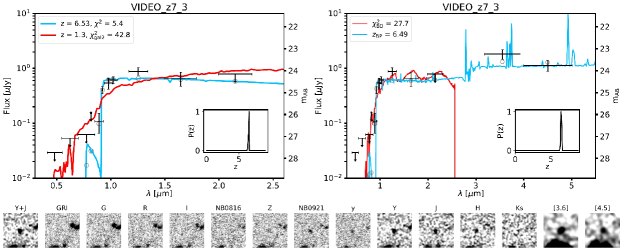
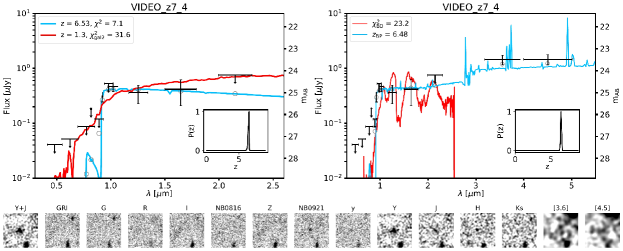
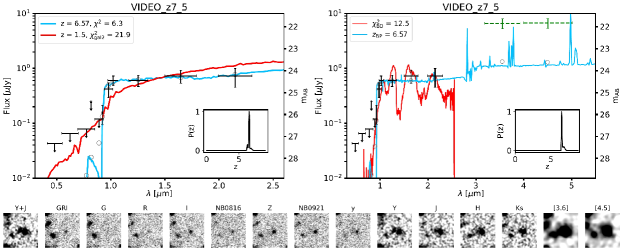
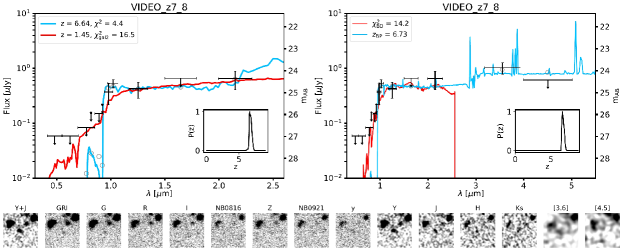
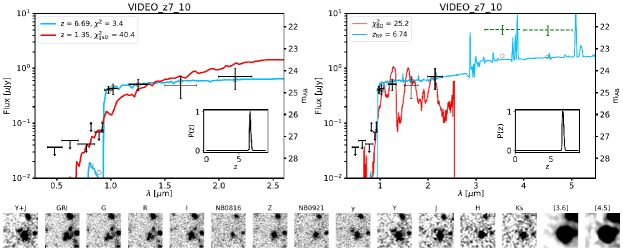
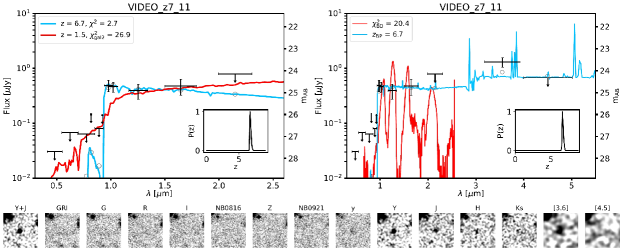
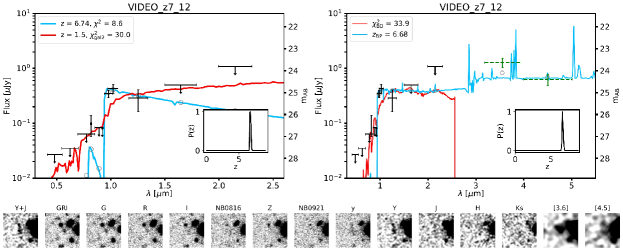
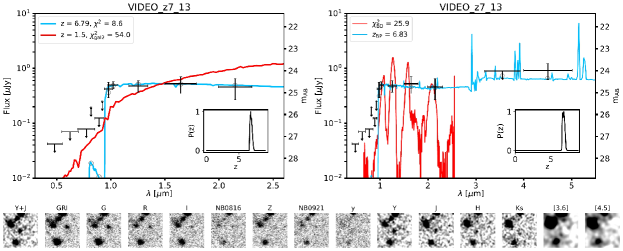
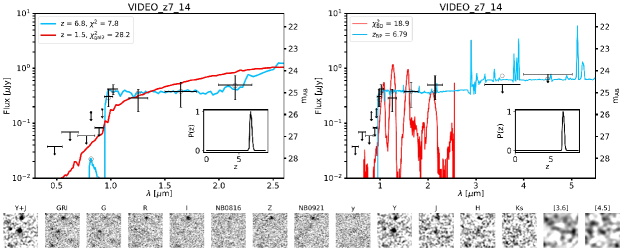
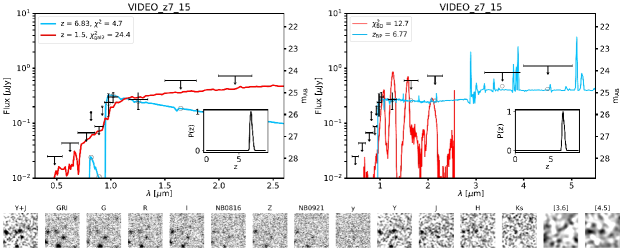
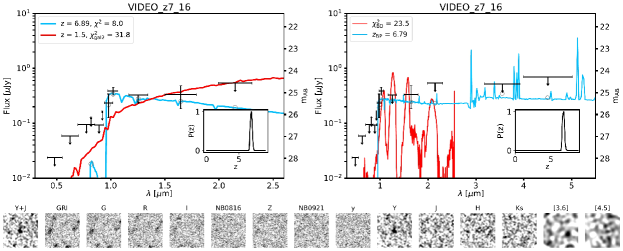
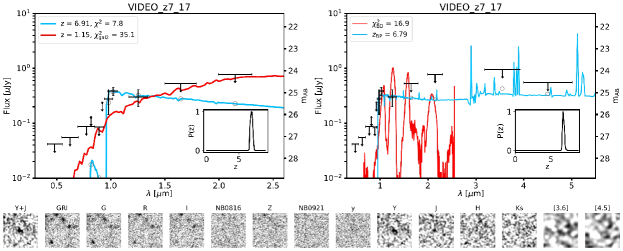
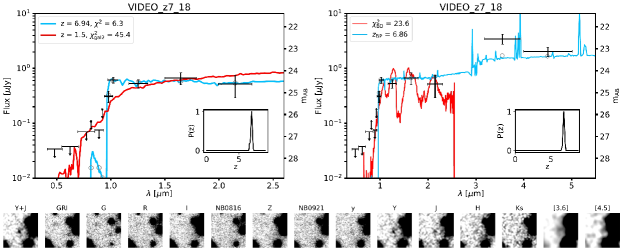
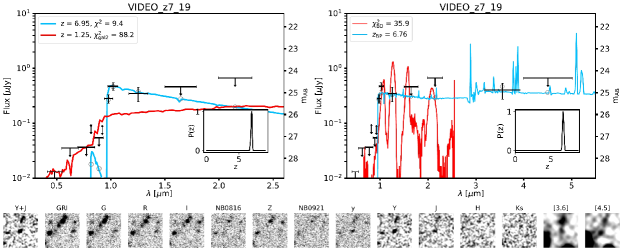
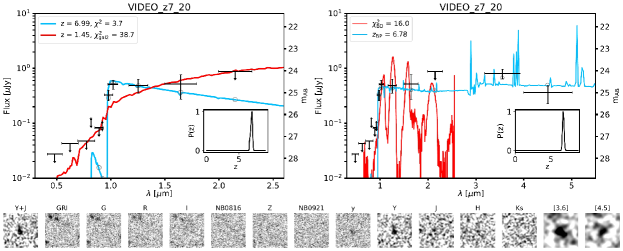
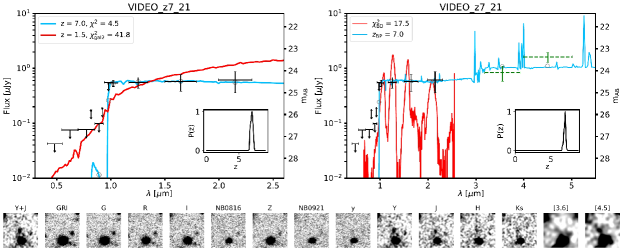
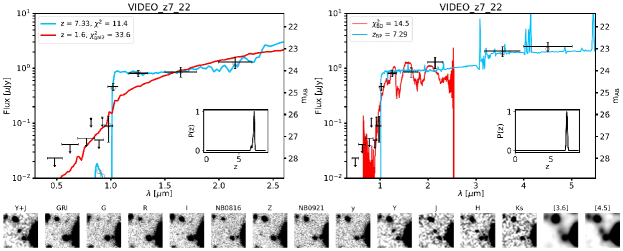
B.1.2 ECDF-S
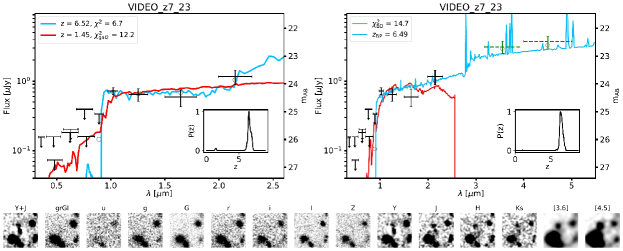
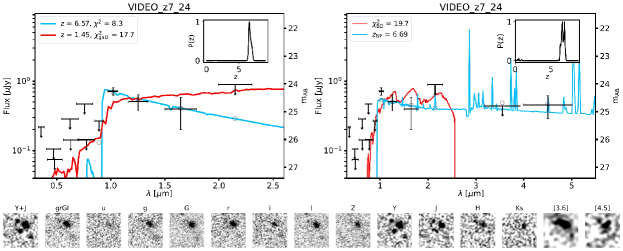
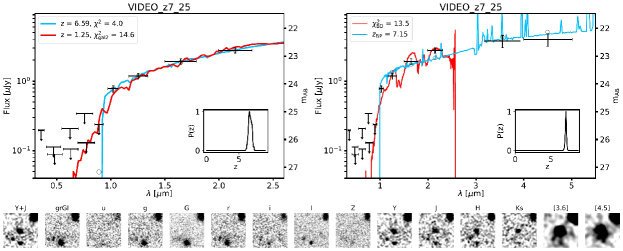
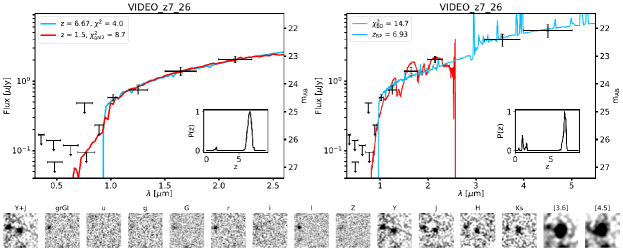
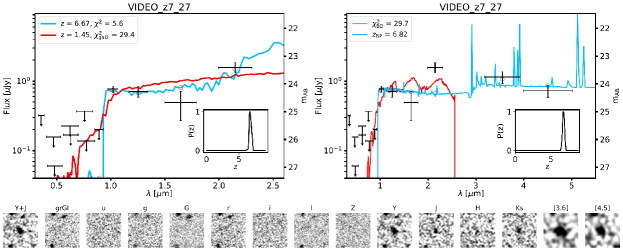
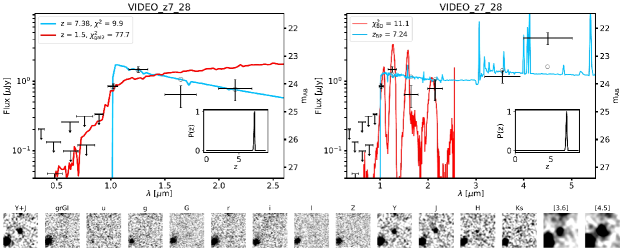
B.2 Lyman- Candidates
B.2.1 XMM-LSS
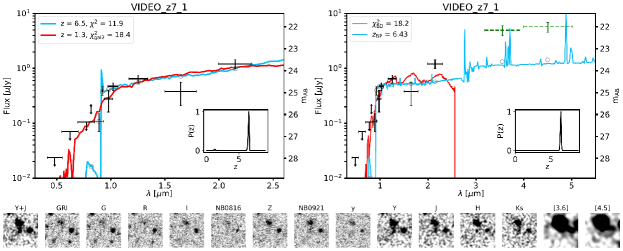
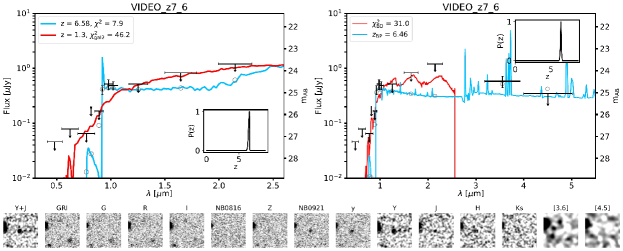
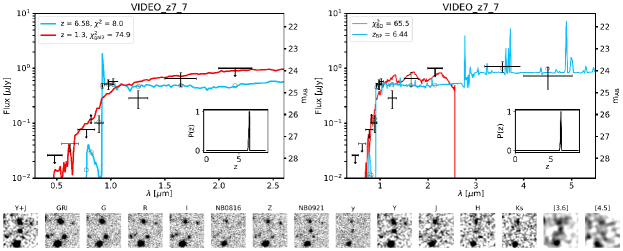
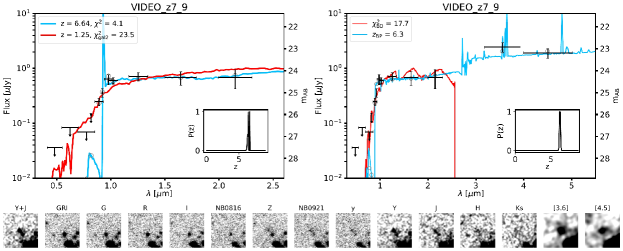
B.3 Inclusive candidates
B.3.1 XMM-LSS
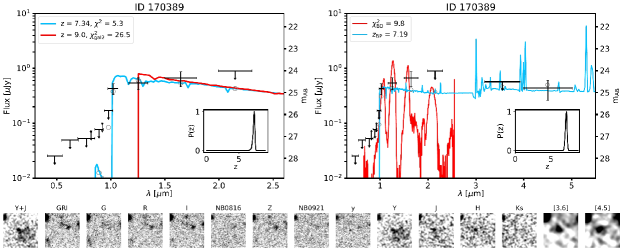
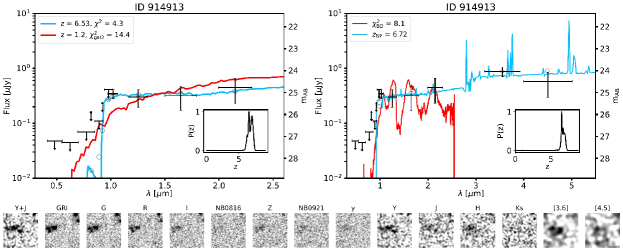
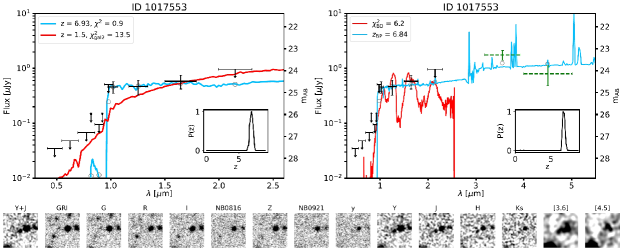
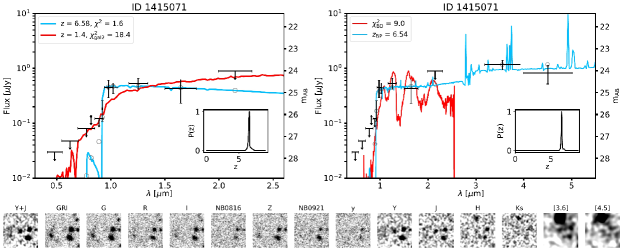
B.3.2 ECDF-S
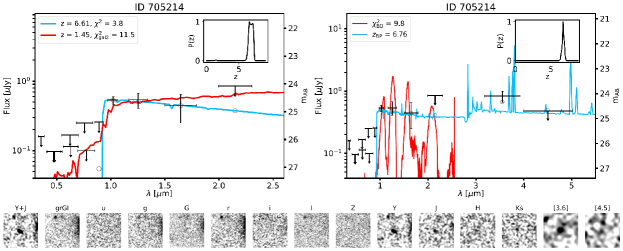
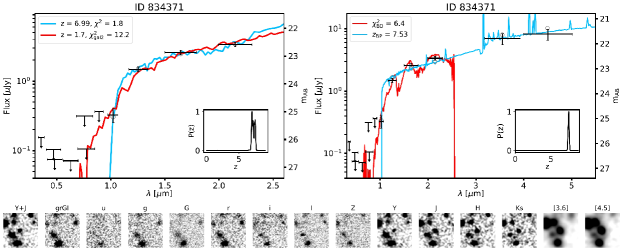
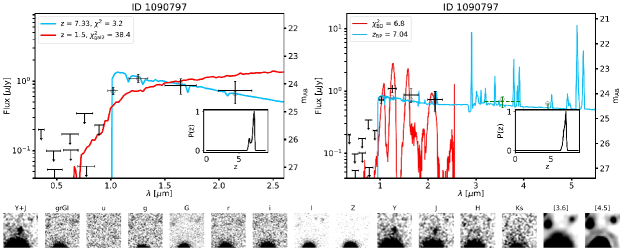
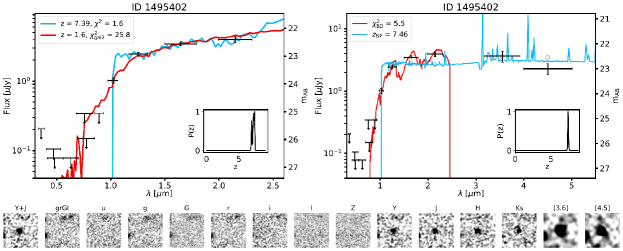
Appendix C Unusual object in XMM
In this Appendix we present the SED and postage stamp images of ID 1610530, an unusual object noted in Section 3.3. If this object is at high redshift, the rest-frame UV is very bright (), but the Spitzer/IRAC photometry appears unusually faint, around 3.5-4 mag fainter than suggested by the model. When Spitzer/IRAC photometry is included in the SED fitting, the fit becomes very poor with . A crosstalk artifact is perhaps ruled out by the detection in the [3.6] band. Additionally, the object is not detected in WIRDS-. In Fig. 18 we present a measurement of the WIRDS- flux in a 2 arcsec diameter aperture at the position of the object. The measured flux is mag lower than measured in VIDEO-.