Bayesian Meta-Analysis of Penetrance for Cancer Risk
Abstract
Multi-gene panel testing allows many cancer susceptibility genes to be tested quickly at a lower cost making such testing accessible to a broader population. Thus, more patients carrying pathogenic germline mutations in various cancer-susceptibility genes are being identified. This creates a great opportunity, as well as an urgent need, to counsel these patients about appropriate risk reducing management strategies. Counseling hinges on accurate estimates of age-specific risks of developing various cancers associated with mutations in a specific gene, i.e., penetrance estimation. We propose a meta-analysis approach based on a Bayesian hierarchical random-effects model to obtain penetrance estimates by integrating studies reporting different types of risk measures (e.g., penetrance, relative risk, odds ratio) while accounting for the associated uncertainties. After estimating posterior distributions of the parameters via a Markov chain Monte Carlo algorithm, we estimate penetrance and credible intervals. We investigate the proposed method and compare with an existing approach via simulations based on studies reporting risks for two moderate-risk breast cancer susceptibility genes, ATM and PALB2. Our proposed method is far superior in terms of coverage probability of credible intervals and mean square error of estimates. Finally, we apply our method to estimate the penetrance of breast cancer among carriers of pathogenic mutations in the ATM gene.
Key words: ATM gene, Bayesian hierarchical model, Multi-gene panel testing, Odds ratio, PALB2 gene, Relative risk
1 Introduction
Until recently, genetic testing for cancer-susceptibility genes was limited to a handful of well-known and well-studied genes such as BRCA1 and BRCA2 for hereditary breast and ovarian cancers. However, the advent of next generation DNA sequencing now allows testing a larger number (25 to 125) of cancer genes at a fraction of the cost and time compared to what was once needed. A landmark decision of the US Supreme Court in 2013 over-turning the patent for genetic testing has further fueled the availability of multi-gene panel testing to a broader population at a cheaper cost (Plichta et al.,, 2016). These developments, in turn, have set the stage for a paradigm shift in hereditary cancer risk assessment.
As increasing numbers of individuals are being tested via multi-gene panels, more patients are being identified with pathogenic mutations not only in well-studied genes such as BRCA1 or BRCA2 but also in relatively less-studied genes such as ATM, CHEK2, and PALB2. These patients need help in interpreting their test results and assessing their risks for various cancers. Indeed there is an unprecedented opportunity to help individuals with pathogenic variants in cancer susceptibility genes whose mutation status was unknown due to lack of testing and therefore were not helped in mitigating their cancer risk. Appropriate management strategies could include, for example, targeted surveillance or prophylactic options such as mastectomy or oophorectomy, and involve complex decisions for patients and their doctors. This has created an urgent need to streamline the process of counseling patients especially under the practical constraints of time and resources faced by clinicians. If this target population is appropriately counseled, morbidity and mortality rates associated with germline genetic mutations may be substantially reduced. To effectively counsel patients, a critical tool is accurate estimate of penetrance, i.e., age-specific risks of developing cancers associated with pathogenic variants in a specific gene.
One of the sources that provides age-specific penetrance is an online risk calculator called ASK2ME (All Syndromes Known to Man Evaluator) (Braun et al.,, 2018). ASK2ME takes as input a gene name in which a patient has a pathogenic variant and other relevant information (e.g., age, gender) and returns age-specific risks for cancers associated with that pathogenic variant. The risk assessment is based on an in-depth literature review for each gene-cancer association. More specifically, for each gene-cancer association, all relevant studies are curated. The study deemed to be of highest quality is used for deriving the age-specific risk of developing a specific cancer (i.e., penetrance). Ideally such a study should be a high quality meta-analysis of all relevant studies on that specific gene-cancer association. Yet, such meta-analyses for many gene-cancer associations are unavailable.
The PanelPRO R package is another tool for assessing cancer risk (Lee et al.,, 2021). The package models comprehensive cancer risk profiles for individuals with family history by integrating a large number of gene mutations and a wide range of potential cancer types to provide age-specific estimates of cancer risk. This calculation requires information about penetrances for the mutations, which are derived from peer-reviewed studies. Again, using meta-analysis estimates of penetrance is ideal for the PanelPRO model.
For many moderate- and high-risk cancer susceptibility genes, there is a substantial literature on the cancer risks that they confer. However, these published studies typically vary by their designs (e.g., family-based, case-control) and the corresponding summaries/results that they report for risk (e.g., age-specific penetrance, odds ratio (OR), relative risk (RR), standardized incidence ratio (SIR)). This vast amount of scientific knowledge needs to be synthesized and translated into accurate cancer risk assessment, but this is not trivial.
In particular, the motivation for this work comes from the need to accurately quantify the penetrance of breast cancer (BC) among carriers of pathogenic variants in the ATM gene, through the synthesis of all relevant evidence in a systematic and coherent manner while allowing for heterogeneity in study populations, study designs, and type of reported results. ATM is a moderate-risk gene that is relatively less-studied compared to the high-risk genes BRCA1/2. Approximately 1-2% of individuals in the U.S. are believed to carry a risk-conferring ATM mutation (Jerzak et al.,, 2018) and thus its penetrance is critical for clinical management of patients carrying these mutations. There are several published studies on BC risk conferred by ATM and the knowledge base for this gene-cancer association is rapidly expanding (Acevedo et al.,, 2018; Robson,, 2018; Marabelli et al.,, 2016).
To accomplish the challenging task of synthesizing relevant studies, the most commonly used meta-analysis methods based on either fixed or random-effects models, cannot be used because they require all studies to report the same type of summaries (DerSimonian and Laird,, 1986). Marabelli et al., (2016) developed a likelihood-based meta-analysis method that can incorporate different types of summaries, and used it for a meta-analysis to estimate BC penetrance for ATM mutation carriers. This estimate is currently used in ASK2ME. This approach is a major step in the direction of synthesizing heterogeneous studies and serves as a stepping stone for our proposed methodology. Nonetheless, it is a fixed-effects approach wherein studies are assumed to be independent and identically distributed (iid) given the penetrance parameters shared by them. It relies on strong modeling assumptions and ignores several sources of uncertainty resulting in potential underestimation of standard error (SE). Further, the approach has not been extensively tested through simulation studies.
Additionally, in their ATM-BC meta-analysis, Marabelli et al., (2016) did not exclude studies that failed to adjust for ascertainment criteria. Studies on cancer risk often tend to ascertain their sample based on family history or age of onset (Daly et al.,, 2017) and if that ascertainment information is not appropriately accounted for while estimating the cancer risk by the study (e.g., by conditioning the likelihood on ascertainment factors), the estimate can be biased (Kraft and Thomas,, 2000). For these reasons, we think it is timely to conduct a meta-analysis to estimate ATM-BC penetrance based on a more refined statistical model and a more rigorous selection of studies including only those studies that appropriately accounted for ascertainment. More specifically, we discard studies without proper ascertainment adjustment and include additional eligible studies published since the work of Marabelli et al., (2016).
There is a vast amount of literature on Bayesian methods for meta-analysis. De Geest et al., (2015) used a Bayesian zero-inflated random-effect model to estimate adverse effects associated with a technique for performing total hip arthroplasty. Another study proposed CPBayes (Cross-Phenotype Bayes) based on a spike and slab prior to simultaneously detect loci associated with multiple traits (overall pleiotropy) and an optimal subset of associated traits underlying a pleiotropic signal using GWAS (genome-wide association studies) sum- mary statistics (Majumdar et al.,, 2018). Bayesian network meta-analysis is another popular technique in randomized controlled trials to establish the most effective intervention (Gao et al.,, 2021; Jepsen et al.,, 2020). Nonetheless, there is no Bayesian meta-analysis approach available that can combine estimates of different types of risk measures.
In fact, there is no random-effects meta-analysis approach (in classical or Bayesian framework) that can integrate different types of risk measures such as age-specific penetrances, OR, RR, and SIR as well as account for uncertainties involved in such synthesis. Both aspects are important for an accurate synthesis of evidence from a wide range of study types while ensuring that the estimates are robust and valid across a spectrum of clinical scenarios in which risk assessments are typically made in practice. Our proposed Bayesian method will be the first of its kind. The Bayesian framework allows accounting for different sources of uncertainties and relaxing strong modeling assumptions in a natural way via hierarchical modeling and appropriate choice of priors (Parmigiani,, 2002). Further, studies with different designs and types of results can all be integrated in a seamless manner under one unified model (Dias et al.,, 2018). Such modeling allows studies to borrow information from each other resulting in penetrance estimates which are more likely to be accurate and robust. We evaluate the performance of our method and compare it with the method of Marabelli et al., (2016) through simulations that mimic real studies on ATM-BC association. To further assess the robustness of our method for other moderate-risk genes such as PALB2, we also performed simulations based on PALB2-BC penetrance. Finally, we apply our method to estimate the age-specific penetrance of BC for ATM.
2 Methods
2.1 Likelihood Formulation
Consider studies reporting point estimates as well as standard errors in one of four modalities: penetrance (age-specific risk) at some specific ages; RR; SIR or OR. We assume studies have no patient overlap and are conditionally independent given the study-specific parameters specified below. We use to index studies. Without loss of generality, we order studies so that the first report penetrances, the next report RR, and so forth.
We assume that, irrespective of the reporting modality, the cumulative penetrance at age for study is given by the c.d.f. of a Weibull distribution with shape parameter and scale parameter . The corresponding density function is . Jointly, the parameters are denoted by . The Weibull distribution is very popular in survival and reliability analysis as it is able to accurately model time to failure of real life events in a wide variety of populations (Plana et al.,, 2022), despite having only two parameters.
For each modality, we express the corresponding likelihood and of the reported results in terms of penetrance parameters as in Marabelli et al., (2016). Letting , we write the overall likelihood combining all the studies as
We now describe the formulation of the modality-specific likelihood terms.
2.1.1 Age-Specific Risk (Penetrance) Estimates
In this type of study, reported results include a vector of penetrance values at ages , ideally along with a corresponding covariance matrix quantifying estimation error. If penetrances are reported by age interval (e.g., decade) can be the midpoints. Note that can vary between studies (see Web Appendix A).
We specify the likelihood by modeling the joint distribution of given and . A more comprehensive likelihood specification would also acknowledge sampling variability in . This is not considered here, but would be a valuable extension. Specifically, we posit the following multivariate normal (MVN) distribution:
If is reported, can be obtained via, say, an application of the multivariate delta method. Typically, studies do not report but rather only 95 confidence intervals (CIs) of the individual components of . In these cases, we take the logit of the lower and upper limits of each age-specific CI and estimate variances in the diagonal of considering the interval width and assuming normality. The covariances in the off-diagonal elements of are approximated using the numerical method described in Marabelli et al., (2016).
2.1.2 Relative Risk
In this type of study, reported results include a scalar RR estimate with variance . Depending on the penetrance function, the estimated relative risk can vary considerably with age of study participants. To relate the reported RR to the penetrance curve more reliably, we explicitly consider the age distribution of individuals studied. Based on our experience we cannot count on studies to report individual-level data, but it is often possible to obtain means and and subject-to-subject variances and for carriers and non-carriers, respectively. Following Marabelli et al., (2016), we assume ages of onset among carriers and non-carriers have densities and . We also need to incorporate information about the distribution with density of the penetrance of breast cancer among non-carriers. This can be estimated using registry data, and can be considered known for our purposes.
We specify the likelihood by modeling the distribution of given and , where is an appropriate transformation of . We use the log transformation to facilitate the fit of the normal approximation. Expressing the mean of the RR approximately in terms of the penetrance, we posit the following distribution:
| (1) |
The derivations of equation (1) as well as equations (2) and (3) (to follow in later sub-sections) can be found in Web Appendix B. As studies typically do not report , we obtain directly by taking log of the lower and upper limits of the reported CI for RR, computing the width and back-solving using a normal approximation. Note that is unrelated to the assumed Weibull penetrance at age . The latter is the probability of getting cancer by age , i.e., it is conditional on age while is the marginal distribution of age of onset (of cancer) for carriers (see two equations preceding equation (1) of Web Appendix B).
2.1.3 Standardized Incidence Ratio
In this type of study, reported results include a scalar SIR estimate with variance . Similar to the RR case, using the log transformation, we express mean of SIR in terms of penetrance approximately using the following distribution.
| (2) |
where and are the prevalence of carriers and non-carriers, respectively and is obtained similar to as in the RR case. Note that for a rare gene mutation, we may assume that the incidence of BC in the general population is the same as in non-carriers, in which case equation (2) reduces approximately to equation (1).
2.1.4 Odds Ratio
In this type of study, reported results include a scalar OR estimate with variance . We assume
where is obtained similarly to the RR case and is an approximation of OR in terms of penetrance given by
| (3) |
where and are distributions of ages of onset for cases while and are the corresponding distributions of ages at inclusion in the study for healthy controls. We assume , , , and ; here, 1 and 0 in the subscript indicate carriers and non-carriers, respectively.
2.2 Prior Distributions
We assume that our study-specific and parameters follow Gamma priors and the hyper-parameters follow uniform distributions. In particular, we consider the following hierarchical priors: Gamma Gamma where and are shape parameters, and are scale parameters, and U U Uand U. A detailed description of the process used to determine the limits of the uniform distributions can be found in Web Appendix C.
2.3 MCMC Algorithm
We implement a Markov chain Monte Carlo (MCMC) algorithm for estimating posterior distributions. For this, we employ a standard (non-adaptive) Metropolis-Hastings algorithm within Gibbs sampling. As is the case with our prior specification, the algorithm is applicable to most gene-cancer combinations. We run 30,000 MCMC iterations with 15,000 burn-in. We carry out all analysis in statistical software system R (R Core Team,, 2020). Algorithm details and convergence statistics are provided in Web Appendix D.
Consensus Penetrance: Recall that the method assumes that irrespective of the modality, the reported risk estimate follows a normal distribution whose mean is expressed in terms of Weibull distribution (and hence its parameters and ) and variance is fixed at what was reported by the study. The and parameters are then assumed to follow gamma priors with their parameters having uniform hyper-priors. After estimating the posterior distributions of all parameters, we estimate the final meta-analysis penetrance curve. Specifically, at iteration : (1) We compute and and (2) Use the Weibull() cdf at ages 40, 50, 60, 70, and 80 as penetrance estimates at the iteration. Finally, for each age, the mean of the penetrance values over all iterations are computed, which serves as the meta-analysis estimate. We also obtain credible intervals (CrI) using these posterior distributions of penetrances at each age.
For ease of readability, we have listed the assumptions and details of the proposed method (as well as simulations and application to follow) in Web Appendix A.
3 Simulation Study
We investigate the performance of the proposed method through simulations. Further, we compare our method with the approach of Marabelli et al., (2016) (see Web Appendix E for details of this method). To evaluate the performance of our method under different BC susceptibility genes, we consider two settings for simulations, one based on the ATM gene and another based on the PALB2 gene. In combination, these two sets of simulations will illustrate the broad scope of our method.
As described in Section 2.1.3, for studies reporting SIR, we need the prevalence of the pathogenic gene mutations for equation 2. However, for many moderate BC penetrance genes, prevalence has not been well established. Therefore, following Marabelli et al., (2016), for studies providing SIR, we use equation (1) (used for studies reporting RR) under the assumption that incidence of BC in the general population is the same as in non-carriers, which is reasonable for rare gene mutations.
We require several distributions of age, namely, and , for equation (1) and , , , and for equation (3) as described in Section 2.1. These are assumed to be study-specific normal distributions with pre-specified mean and variance. In our actual meta-analysis (to follow in Section 4), for a given study, we rely on the mean and variance of these distributions reported in that study. However, not all RR and OR studies report age-related statistics. For example, Table 3 lists 17 studies that we use in our application among which five report RR. Out of these five, four studies report mean and SD of age of onset for carriers (); of these four, only two report mean and SD of age of onset for non-carriers (). The fifth study did not report any age-related statistics. Similarly, some studies reporting OR do not report any relevant age-related statistics.
To mimic such real scenarios in our simulations, we assume some studies report age-related statistics but not all. Therefore, although our data generation process (to follow in Section 3.1.1) allows obtaining relevant age-related summaries for all simulated studies, before applying the meta-analysis method, we replace some of the generated summaries by a fixed mean and SD. That is, we let some studies in our simulations not report the relevant age-related summaries (to mimic reality) and fill in those with a mean of 63 and an SD of 14.00726. These are the mean and SD of age of onset of BC in the US population obtained from Surveillance, Epidemiology, and End Results (SEER) program (Surveillance, Epidemiology, and End Results,, 2018). Due to lack of more specific information and given that pathogenic variants in ATM or PALB2 are rare, we assume this mean age and SD for all studies that do not provide age-related distributions , , , , , and/or .
Moreover, case-control studies usually only provide the mean age at diagnosis for cases and the mean age for controls. In fact, none of the ten OR studies listed in Table 3 report mean age of onset for carrier cases and non-carrier cases separately or separate mean age at inclusion in the study for carrier and non carrier controls. Thus, for case-control studies we set (age of onset for cases) and (age at inclusion in the study for healthy controls) before applying the Bayesian and Marabelli et al., (2016) methods.
In addition to the above scenario wherein we mimic the observed pattern in the literature, we also consider a simulation scenario with even less information available. In this scenario we assume none of the studies report any age-related statistics. In other words, for each of the two simulation settings (ATM and PALB2) we consider two scenarios. Scenario 1 mimics a realistic situation in the literature wherein only some RR and OR studies report the relevant age-related summaries and Scenario 2 serves as a situation with no age-related information available from any RR and OR studies. In Scenario 1, we use the fixed mean and SD for any missing (unreported) age-related summary. Under Scenario 2, all age-related summaries for all studies , , , and are assumed to have the same fixed mean and SD of and , respectively. Note that the above age-related statistics are used as inputs for both Bayesian and Marabelli et al., (2016) methods.
3.1 Simulations based on ATM
For the simulations based on ATM-BC associations, we borrow information from the 17 ATM-BC association studies identified and used in our meta-analysis data application (Section 4) and listed in Table 3. Specifically, for each simulation replicate, we simulate 17 studies whose sample sizes and reported risk measures (penetrance, RR, or OR) are the same as to those given in Table 3.
3.1.1 Data Generation Model
Each simulation replicate consists of two studies reporting penetrance, five reporting RR, and ten reporting OR (following Table 3). We generate time to BC for carriers using Weibull and a censoring time from . The study-specific and are generated from and , respectively. The choice of parameters is based on the observed range of and values of approximate Weibull curves fitted to each of the 17 studies; the details are explained in the Web Appendix F. Depending on whether a study reports age-specific penetrance, RR, or OR, we generate data and the corresponding measure in the following manner.
Age-Specific Penetrance
As mentioned above, we first generate two time points for each carrier in the study: (1) Time to BC and (2) Censoring time. The minimum of these two times and age 95 (assumed to be the maximum observed age in a study), and an indicator of censoring are considered to be the observed data for each carrier. Next, we fit a Kaplan-Meier curve and get penetrance estimates and their CIs at ages 40, 50, 60, 70, and 80. Note that we do not generate non-carriers because they are not needed for estimation of penetrance.
RR and OR
First, we generate a population of 2 million consisting of carriers and non-carriers with carrier probability of 0.01. Then, cancer status for each carrier is generated in the same manner as described above for studies reporting penetrance. In particular, a subject is affected if her time to BC is equal to the minimum of the three times (time to BC, censoring time, and 95) otherwise she is unaffected. Next, the process is repeated for non-carriers by generating time to BC using a truncated Weibull distribution, which is an approximation to BC risk estimates given by SEER. The Weibull distribution is truncated at age 185 to ensure that there are enough non-carrier cases at ages less than 80 such that the resulting RR and OR estimates are not excessively large (Web Figure 1 shows the distributions used in the data generation). Finally, for studies reporting RR, the estimate RR and its standard error are obtained for a randomly chosen sample of carriers and non-carriers.
When sampling we use the sample sizes of carriers and non-carriers in the studies listed in Table 3. For studies reporting OR, the estimate OR and its standard error are calculated for a randomly chosen sample of cases and controls with sample sizes the same as those of the ten OR studies listed in Table 3. Further, the age at which a given subject was either diagnosed, censored, or healthy is known at this point of data generation along with their carrier status. Using these information, we construct relevant normal age distributions for a study that does report age-related distributions under Scenario 1 by taking the mean and variance of the corresponding ages. However, when generating OR studies, our data generation process tends to yield a considerably higher mean and lower SD for controls than those for cases. As in most real studies the cases and controls are matched by age, we therefore set the generated mean and SD for the cases same as the corresponding ones for the controls. In Scenario 1, whenever a study (out of 17 listed in Table 3) did not report a given age-related distribution, that distribution was replaced by whereas in Scenario 2, we use for all age-related distributions for all studies.
The estimates and their standard errors obtained from all studies along with the relevant age distributions are then input to the Bayesian and Marabelli et al., (2016) methods to obtain overall meta-analysis estimates of penetrance and their CrIs. We generate 500 replicates for each combination of setting and scenario. Then we report average of the estimates, their mean square error (MSE), and coverage probabilities of CrIs.
To evaluate the results of the simulations from both our proposed approach and the approach by Marabelli et al., (2016), we need to know the true penetrance values. Note that as each study has its own penetrance curve whose study-specific parameters and were generated from common normal distributions, the true (overall) penetrance values (to which the simulation estimates need to be compared to) are not directly available. Thus, to obtain the true values, we generate a large number of and from their respective normal distributions (which were used in data generation process as described above). Then, for each pair of (, ), we obtain a large number of Weibull penetrance values at each age and compute their mean for each age. These mean penetrance values serve as true values for evaluation of the simulation results.
3.2 Simulations based on PALB2
To check that our proposed method is generally applicable to other gene-cancer associations as well, we conduct simulations based on PALB2-BC association. To obtain a realistic range of risk estimates for this association, we utilized four papers — two reported age-specific penetrance, one reported RR, and another reported OR (Aloraifi et al.,, 2015; Antoniou et al.,, 2014; Casadei et al.,, 2011; Erkko et al.,, 2008). The type and numeric values of the reported estimates in these four studies vary substantially from each other. In particular, the penetrance at age 70 reported by the two penetrance studies are 35 and 40 while the other two studies report RR = 3.4 and OR = 21.4. Based on these four studies, the normal distributions we use for data generation are and (more details can be found in the Web Appendix B).
As four studies may not be sufficient for a meaningful meta-analysis and conducting an exhaustive literature review for PALB2-BC association is beyond the scope of this work, we let a simulation replicate consist of 12 studies. Among these, we assume four studies report age-specific penetrance ( = 1000, 500, 1000, 500), four studies report RR ( = 1000, 1800, 2500, 5000), and four studies report OR ( = 500, 1000, 3000, 5000). Similar to the procedure described in Section 3.1.1, we use the above-mentioned normal distributions to generate the 12 study-specific and for each simulation replicate, based on which we further generate age-specific penetrance, OR, and RR in the same manner as described in the same section. Note that the four PALB2 studies described in the previous paragraph were utilized only to derive the parameters of the normal distributions used in the data generation. After deriving the parameters, the four studies are not used further in any manner.
Under Scenario 1, only the first two studies within each set of four RR and four OR studies are assumed to have reported the relevant age-related summaries, whereas under Scenario 2, we assume none of the RR and OR studies report the relevant age-related summaries.
3.3 Simulation Results
The results for Scenarios 1 and 2 based on ATM-BC associations are presented in Table 1 and Web Table 1, respectively. Compared with the method of Marabelli et al., (2016), two advantages of the Bayesian method stand out: (1) MSEs are smaller and (2) coverage probabilities are closer to . The latter is the most pronounced as the method of Marabelli et al., (2016) suffers from severe under-coverage. Table 2 contains the simulation results for Scenario 1 based on PALB2 gene. The results for Scenario 2 are in Web Table 2. These results are similar to what we found for Setting 1 (ATM-based) except slightly higher coverage of 95 CrI. We also investigated the sensitivity of our results to the choice of fixed hyper-parameters, different age-related distributions, and varying the values of (the number of time points at which penetrances are reported by different studies). Details and results of the sensitivity analyses are reported in Web Appendix G.
| Age | 40 | 50 | 60 | 70 | 80 |
| True Penetrance | 0.026 | 0.067 | 0.141 | 0.253 | 0.398 |
| Estimated Penetrance (Bayesian) | 0.028 | 0.068 | 0.140 | 0.251 | 0.401 |
| Estimated Penetrance (Marabelli) | 0.042 | 0.084 | 0.145 | 0.225 | 0.323 |
| MSE (Bayesian) | 0.0002 | 0.0006 | 0.0013 | 0.0026 | 0.0043 |
| MSE (Marabelli) | 0.0018 | 0.0039 | 0.0058 | 0.0081 | 0.0135 |
| 95% CrI coverage (Bayesian) | 0.986 | 0.98 | 0.968 | 0.94 | 0.932 |
| 95% CrI coverage (Marabelli) | 0.154 | 0.146 | 0.100 | 0.076 | 0.054 |
| Age | 40 | 50 | 60 | 70 | 80 |
| True Penetrance | 0.066 | 0.143 | 0.257 | 0.404 | 0.565 |
| Estimated Penetrance (Bayesian) | 0.071 | 0.151 | 0.272 | 0.426 | 0.594 |
| Estimated Penetrance (Marabelli) | 0.069 | 0.153 | 0.269 | 0.405 | 0.547 |
| MSE (Bayesian) | 0.0002 | 0.0005 | 0.0011 | 0.0021 | 0.0029 |
| MSE (Marabelli) | 0.0003 | 0.0010 | 0.0017 | 0.0022 | 0.0028 |
| 95% CrI coverage (Bayesian) | 1.00 | 1.00 | 1.00 | 0.996 | 0.988 |
| 95% CrI coverage (Marabelli) | 0.230 | 0.178 | 0.136 | 0.104 | 0.170 |
4 Meta-Analysis of ATM-BC Penetrance
Here, we apply the proposed Bayesian method to estimate the age-specific penetrance of female BC among carriers of pathogenic variants in the ATM gene.
4.1 Selection of Studies
We started by considering all studies utilized in Marabelli et al., (2016), which were primarily identified using a Pubmed search of following keywords in the title/abstract of the articles: [“ATM”] AND [“penetrance” OR “risk”] AND [“breast”] up to February 10, 2015. We extended the same search to cover until December 20, 2021. Additional studies were identified by a semi-automated natural language processing–based procedure for abstract screening (Deng et al.,, 2019). Our inclusion criteria for studies is similar to those of Marabelli et al., (2016), which included (1) family-based segregation analyses or epidemiological studies reporting cancer risk information, in terms of age-specific penetrance, RR, or SIR; (2) case-control studies comparing BC patients with healthy subjects and reporting either OR or sufficient data to estimate the OR and its 95 CI. However, unlike Marabelli et al., (2016), we exclude case-control studies that ascertained subjects based on family history of BC but did not adjust for this ascertainment criteria in their analysis. This eliminated eight out of 19 studies reporting OR that were included in Marabelli et al., (2016). On the other hand, we include five additional studies reporting OR estimates and one study reporting RR, which were published after Marabelli et al., (2016). We only included pathogenic variants for a study, whenever that information was available. Some studies included information on both pathogenic variants and variants of uncertain significance. The latter are variants for which the pathogenity is unknown; for such studies, we only included counts of pathogenic variants when computing the risk estimates. Moreover, pathogenicity of a given mutation can change over time in light of new findings. Therefore, whenever a study reported sufficient information, we tried to confirm whether a given variant initially classified as pathogenic remained pathogenic by using ClinVar (Landrum et al.,, 2018), a freely available NIH archive of reports of human genetic variants. Our meta-analysis includes 17 studies that are summarized in Table 3. Following Marabelli et al., (2016), we made several assumptions specific to meta-analysis of the ATM gene due to the limited information provided by individual studies and to incorporate as many studies as possible in our meta-analysis (See Web Appendix H).
| Study | Cases | Study Design | Sample Size | Risk and CI (Input for meta-analysis) | |
| 1 | Goldgar et al., (2011) | Familial BC BRCA1/2 negative | Family-based segregation analysis | 156 | Penetrance Curve (at ages 35 - 80) |
| 2 | Thompson et al., (2005) | One family member with ATM | Cancer incidence in relatives of ATM patients | 1160 | Penetrance Curve (at ages 40 - 80) |
| 3 | Swift and Lukin, (2008) | One family member with ATM | Cancer incidence in relatives of ATM patients | 919 | RR = 2.4 (1.3 - 4.3) |
| 4 | Renwick et al., (2006) | Familial BC BRCA1/2 negative | Case-control/family-based segregation analysis | 5173 | RR = 2.37 (1.51 - 3.78) |
| 5 | Li et al., (2016) | Familial BC BRCA1/2 negative | family-based segregation analysis | 660 | RR = 2.67 (0.82 - 10.56) |
| 6 | Olsen et al., (2005) | One family member with ATM | Cancer incidence in relatives of ATM patients | 712 | SIR = 2.9 (1.9 - 4.4) |
| 7 | Andrieu et al., (2005) | One family member with ATM | Cancer incidence in relatives of ATM patients | 708 | SIR = 2.43 (1.32 - 4.09) |
| 8 | Kurian et al., (2017) | Female patients who underwent panel testing | Case control study | 95561 | OR = 1.74 (1.46 - 2.07) |
| 9 | Momozawa et al., (2018) | Unselected BC | Case-control study | 18292 | OR = 2.10 (1.0 - 4.1) |
| 10 | Dorling et al., (2021) | Mainly unselected BC with a subset of early onset BC BRCA1/2 negative | Case-control study | 97997 | OR = 2.10a (1.71 - 2.57) |
| 11 | Hu et al., (2021) | Unselected BC | Case-control study | 64791 | OR = 1.82b,d (1.46 - 2.27) |
| 12 | Mangone et al., (2015) | Sporadic BC | Case-control study | 200 | OR = 3.03c,d,f (NA) |
| 13 | Brunet et al., (2008) | Unselected early-onset BC ( years) BRCA1/2 negative | Case-control study | 193 | OR = 18.13c,d (NA) |
| 14 | Pylkäs et al., (2007) | Familial and unselected BC | Case-control study | 2231 | OR = 6.93e,f,g (0.85 - 56.43) |
| 15 | Zheng et al., (2018) | Unselected BC | Case-control study | 2133 | OR = 4.40f (0.51 - 37.75) |
| 16 | Kreiss et al., (2000) | Unselected BC | Case-control study | 298 | OR = 3.09f (0.50 - 18.96) |
| 17 | Fitzgerald et al., (1997) | Early-onset BC ( years) | Case-control study | 603 | OR = 0.50f (0.07 - 3.58) |
| a Based on 30 studies in breast cancer association consortium (BCAC) unselected for family history. | |||||
| b Based on 12 studies in the CARRIERS consortium not enriched with patients with a family history or early onset of disease. | |||||
| c No mutations in controls, d Excluded VUSs, e Discarded subset with familial BC when calculating OR. | |||||
| f OR and CI were calculated using data reported in the paper. | |||||
| g Reported number of mutations for both familial and unselected cases. Only unselected cases were included. | |||||
4.2 Results
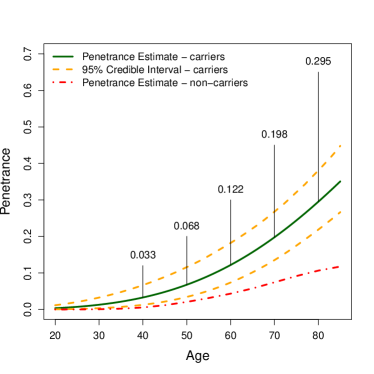
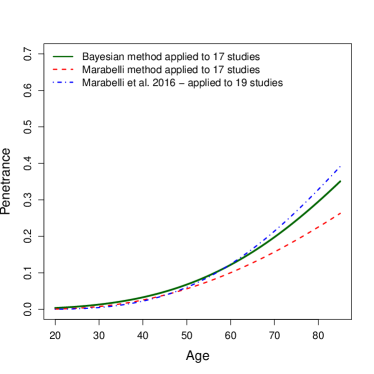
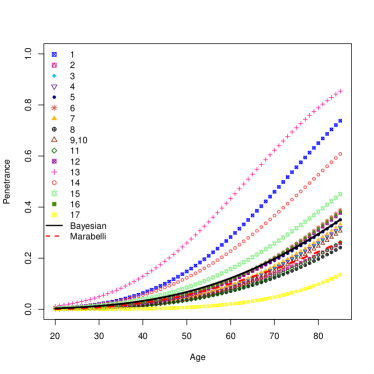
Figure 1(a) shows the consensus penetrance of BC for individuals with an ATM pathogenic variant obtained from the Bayesian meta-analysis. The risk of BC is by age 50 () and by age 80 (). For comparison, the figure also shows the penetrance estimates for non-carriers obtained using SEER data. We also apply the Marabelli et al., (2016) method to the same set of 17 studies. The resulting penetrance curve is lower than the one given by the proposed Bayesian method as shown Figure 1(b). The figure also shows the penetrance curve reported in Marabelli et al., (2016) based on their original 19 studies. To gain some insight into how the final Bayesian meta-analysis curve compares with the estimates provided by the individual 17 studies, in Figure 2, we separately plot the approximate Weibull penetrance curve for each study listed in Table 3. We also superimpose the penetrance curve given by the Marabelli et al., (2016) method applied on the 17 studies. The Bayesian consensus penetrance curve lies more or less at the center of the curves. However, we note that in addition to the risk estimate reported by a study, the sample size and variance of the estimate also dictate how much contribution an individual study makes to the final meta-analysis estimate.
Within our 17 selected studies, three studies that reported OR included early-onset BC cases (Fitzgerald et al.,, 1997; Brunet et al.,, 2008; Dorling et al.,, 2021) while one study included controls with ages greater than 60 (Momozawa et al.,, 2018). We investigate how sensitive our results are to these studies by removing them one at a time. The four penetrance curves obtained in this manner are very close to the curve based on all 17 studies (see Web Figure 2).
5 Discussion
The availability of multi-gene panel testing, wherein several cancer-susceptibility genes can be tested using next-generation sequencing, is shifting the paradigm of hereditary cancer risk assessment (Plichta et al.,, 2016). Panel testing allows identification of patients carrying pathogenic germline mutations in many cancer-susceptibility genes, bringing attention to not only high-risk genes such as BRCA1/2 but also moderate-risk genes like ATM, CHEK2, and PALB2 (Turnbull and Rahman,, 2008). Indeed, many studies are available that provide cancer risks associated with a particular gene mutation. However, their study designs and the reported risk measures can vary. Here we propose a novel Bayesian hierarchical random-effects model that integrates the information available from these different types of studies to provide a combined age-specific penetrance for carriers of pathogenic variants while taking into account the uncertainties involved in such an integration. Our simulation study shows that this approach provides estimates close to the true value with smaller MSE than the ones given by the Marabelli et al., (2016) approach. Moreover, the coverage probabilities of CrI remain around .
To the best of our knowledge, Marabelli et al., (2016) is the only study that conducted a meta-analysis by synthesizing studies reporting different types of risk measures. Notwithstanding this ground-breaking contribution, being a fixed effect meta-analysis approach, it does not allow for heterogeneity across the studies. Indeed, this is reflected in our simulation study wherein the coverage probability of CrIs given by this method is extremely low.
In our ATM-BC meta-analysis, we included only those studies that made an appropriate ascertainment adjustment or studies where such an adjustment was not necessary (population-based studies). Failure to account for study ascertainment may introduce bias in the final estimates (Ranola et al.,, 2019). Even though we did include four studies reporting OR where cases were ascertained by early age of onset and a study with older controls, our sensitivity analysis shows that our estimates are robust to such studies (refer to Web Figure 2). It should be noted that none of the RR/OR studies included in our ATM-BC meta-analysis report age-specific estimates. Moreover, in the two studies that reported penetrance curves (Goldgar et al.,, 2011; Thompson et al.,, 2005), the earliest age at which we could obtain estimates for penetrance was 35. Therefore, caution is warranted in interpreting the reported meta-analysis penetrance curve for ages less than 35.
As a result of our choice of priors that allow a wide spectrum of penetrance values, the proposed method can be readily employed for a broad range of gene-cancer combinations. Indeed, we have applied our method to estimate the age-specific risk for PALB2-BC (manuscript under preparation). Our final meta-analysis penetrance estimates of breast cancer among carriers of ATM and PALB2 genes have been integrated into a recently released version 1.0.0 of PanelPRO (Lee et al.,, 2021) and thus can be immediately used for clinical purposes through the PanelPRO tool. They can be also included in ASK2ME (Braun et al.,, 2018). Moreover, our R package BayesMetaPenetrance (link in Supporting Information) implementing the proposed method can be readily applied to other gene-cancer combinations.
We conclude by acknowledging some limitations of our work. First, our methodology does not directly account for ascertainment: studies that do not report ascertainment-adjusted estimates need to be excluded, unless individual level data are available to perform an adjusted analysis which can then be used as an input. Ascertainment adjustment based on summary information alone is quite challenging: improvements will be possible when more systematic databases of gene-cancer association become available. Second, our methodology does not account for sampling variability in variance estimates reported by the studies. However our simulations suggest that the coverage does not suffer, at least in our scenarios. Our simulations are rooted in real scenarios, but do assume Weibull data-generating mechanisms and normally distributed age distributions throughout. Our empirical analysis of ATM inherits limitations of the reporting practice of the studies considered, particularly with regard to the age distributions of recruited subjects. This limitation will hopefully be mitigated by more extensive reporting in future studies.
In summary, we provide the first random-effects meta-analysis approach that can integrate different types of risk measures such as age-specific penetrances, OR, RR, and SIR as well as account for several of the relevant uncertainties involved in such synthesis. We hope that this work will contribute to more efficient and accurate decision support for carriers of inherited susceptibility to cancer and other diseases.
Acknowledgements
This work is supported by NIH grant R03CA242562-01. We are thankful to the associate editor and two referees for their constructive comments and suggestions. We also thank Stephen Knapp for his help in checking pathogenicity status of some ATM mutations.
References
- Acevedo et al., (2018) Acevedo, F., Deng, Z., Armengol, V. D., and Hughes, K. (2018). Managing patient with mutations in PALB2, CHEK2, or ATM. Current Breast Cancer Reports, 10(2):74–82.
- Aloraifi et al., (2015) Aloraifi, F., McCartan, D., McDevitt, T., Green, A. J., Bracken, A., and Geraghty, J. (2015). Protein-truncating variants in moderate-risk breast cancer susceptibility genes: A meta-analysis of high-risk case-control screening studies. Cancer Genetics, 208(9):455–463.
- Andrieu et al., (2005) Andrieu, N., Cavaciuti, E., Laugé, A., Ossian, K., Janin, N., Hall, J., et al. (2005). Ataxia-telangiectasia genes and breast cancer risk in a French family study. Journal of Dairy Research, 72(S1):73–80.
- Antoniou et al., (2014) Antoniou, A. C., Casadei, S., Heikkinen, T., Barrowdale, D., Pylkas, K., Roberts, J., et al. (2014). Breast-cancer risk in families with mutations in PALB2. The New England Journal of Medicine, 371(6):497–506.
- Braun et al., (2018) Braun, D., Yang, J., Griffin, M., Parmigiani, G., and Hughes, K. S. (2018). A clinical decision support tool to predict cancer risk for commonly tested cancer-related germline mutations. Journal of Genetic Counselling, 27(5):1187–1199.
- Brunet et al., (2008) Brunet, J., Gutiérrez-Enríquez, S., Torres, A., Bérez, V., Sanjosé, S., Galceran, J., et al. (2008). ATM germline mutations in Spanish early-onset breast cancer patients negative for BRCA1/BRCA2 mutations. Clinical Genetics, 73(5):465–473.
- Casadei et al., (2011) Casadei, S., Norquist, B. M., Walsh, T., Stray, S., Mandell, J. B., Lee, M. K., et al. (2011). Contribution of inherited mutations in the BRCA2-interacting protein PALB2 to familial breast cancer. Cancer Research, 71(6):2222–2229.
- Daly et al., (2017) Daly, M. B., Pilarski, R., Berry, M., Buys, S. S., Farmer, M., Friedmanand, S., et al. (2017). Nccn guidelines insights: genetic/familial high-risk assessment: Breast and ovarian, version 2.2017. Journal of the National Comprehensive Cancer Network, 15(1):9–20.
- De Geest et al., (2015) De Geest, T., Fennema, P., Lenaerts, G., and De Loore, G. (2015). Adverse effects associated with the direct anterior approach for total hip arthroplasty: a Bayesian meta-analysis. Archives of Orthopaedic and Trauma Surgery, 135(8):1183–1192.
- Deng et al., (2019) Deng, Z., Yin, K., Bao, Y., Armengol, V. D., Wang, C., Tiwari, A., Barzilay, R., Parmigiani, G., Braun, D., and Hughes, K. S. (2019). Validation of a semiautomated natural language processing–based procedure for meta-analysis of cancer susceptibility gene penetrance. JCO Clinical Cancer Informatics.
- DerSimonian and Laird, (1986) DerSimonian, R. and Laird, N. (1986). Meta-analysis in clinical trials. Controlled Clincal Trials, 7(3):177–188.
- Dias et al., (2018) Dias, S., Ades, A., Welton, N., Jansen, J., and Sutton, A. (2018). Network Meta-Analysis for Decision-Making. Statistics in Practice. Wiley.
- Dorling et al., (2021) Dorling, L., Carvalho, S., Allen, J., González-Neira, A., Luccarini, C., Wahlström, C., et al. (2021). Breast cancer risk genes-association analysis in more than 113,000 women. The New England journal of medicine, 384(5):428–439.
- Erkko et al., (2008) Erkko, H., Dowty, J. G., Nikkila, J., Syrjakoski, K., Mannermaa, A., Pylkas, K., et al. (2008). Penetrance analysis of the PALB2 c.1592delT founder mutation. Clinical Cancer Research, 14(14):4667–4671.
- Fitzgerald et al., (1997) Fitzgerald, M. G., Bean, J. M., Hegde, S. R., Unsal, H., Macdonald, D. J., Harkin, D. P., et al. (1997). Heterozygous ATM mutations do not contribute to early onset of breast cancer. Nature genetics, 15(3):307–310.
- Gao et al., (2021) Gao, J., Dong, S., Li, J. J., Ge, L., Xing, D., and Lin, J. (2021). New technology-based assistive techniques in total knee arthroplasty: A Bayesian network meta-analysis and systematic review. The International Journal of Medical Robotics and Computer Assisted Surgery, 17(2):e2189.
- Goldgar et al., (2011) Goldgar, D. E., Healey, S., Dowty, J. G., Da Silva, L., Chen, X., Spurdle, A. B., et al. (2011). Rare variants in the ATM gene and risk of breast cancer. Breast Cancer Research, 13(4):1–9.
- Hu et al., (2021) Hu, C., Hart, S. N., Gnanaolivu, R., Huang, H., Lee, K. Y., Na, J., et al. (2021). A population-based study of genes previously implicated in breast cancer. New England Journal of Medicine, 384(5):440–451.
- Jepsen et al., (2020) Jepsen, S., Gennai, S., Hirschfeld, J., Kalemaj, Z., Buti, J., and Graziani, F. (2020). Regenerative surgical treatment of furcation defects: A systematic review and Bayesian network meta-analysis of randomized clinical trials. Journal of Clinical Periodontology, 47:352–374.
- Jerzak et al., (2018) Jerzak, K. J., Mancuso, T., and Eisen, A. (2018). Ataxia–telangiectasia gene (atm) mutation heterozygosity in breast cancer: a narrative review. Current Oncology, 25(2):176–180.
- Kraft and Thomas, (2000) Kraft, P. and Thomas, D. C. (2000). Bias and efficiency in family-based gene-characterization studies: Conditional, prospective, retrospective, and joint likelihoods. The American Journal of Human Genetics, 66(3):1119–1131.
- Kreiss et al., (2000) Kreiss, Y., Barak, F., Baruch, R. G., Levy-Lahad, E., Pras, E., and Friedman, E. (2000). The founder mutations in the BRCA1, BRCA2, and ATM genes in Moroccan Jewish women with breast cancer. Genetic Testing, 4(4):403–407.
- Kurian et al., (2017) Kurian, A. W., Hughes, E., Handorf, E. A., Gutin, A., Allen, B., Hartman, A.-R., et al. (2017). Breast and ovarian cancer penetrance estimates derived from germline multiple-gene sequencing results in women. JCO Precision Oncology, 1(1):1–12.
- Landrum et al., (2018) Landrum, M., Lee, J., Benson, M., Brown, G., Chao, C.and Chitipiralla, S., et al. (2018). Clinvar: improving access to variant interpretations and supporting evidence. Nucleic Acids Research, 46(D1):D1062–D1067.
- Lee et al., (2021) Lee, G., Liang, J. W., Zhang, Q., Huang, T., Choirat, C., Parmigiani, G., and Braun, D. (2021). Multi-syndrome, multi-gene risk modeling for individuals with a family history of cancer with the novel r package panelpro. eLife, 10:e68699.
- Li et al., (2016) Li, J., Meeks, H., Feng, B.-J., Healey, S., Thorne, H., Makunin, I., et al. (2016). Targeted massively parallel sequencing of a panel of putative breast cancer susceptibility genes in a large cohort of multiple-case breast and ovarian cancer families. Journal of Medical Genetics, 53(1):34–42.
- Majumdar et al., (2018) Majumdar, A., Haldar, T., Bhattacharya, S., and Witte, J. S. (2018). An efficient Bayesian meta-analysis approach for studying cross-phenotype genetic associations. PLOS Genetics, 14(2):e1007139.
- Mangone et al., (2015) Mangone, F. R., Miracca, E. C., Feilotter, H. E., Mulligan, L. M., and Nagai, M. A. (2015). ATM gene mutations in sporadic breast cancer patients from Brazil. Springerplus, 4(1):1–10.
- Marabelli et al., (2016) Marabelli, M., Cheng, S. C., and Parmigiani, G. (2016). Penetrance of ATM gene mutations in breast cancer: A meta-analysis of different measures of risk. Genetic Epidemiology, 40(5):425–431.
- Momozawa et al., (2018) Momozawa, Y., Iwasaki, Y., Parsons, M. T., Kamatani, Y., Takahashi, A., Tamura, C., et al. (2018). Germline pathogenic variants of 11 breast cancer genes in 7,051 Japanese patients and 11,241 controls. Nature communications, 9(1):1–7.
- Olsen et al., (2005) Olsen, J. H., Hahnemann, J. M. D., Børresen-Dale, A., Tretli, S., Kleinerman, R., Sankila, R., et al. (2005). Breast and other cancers in 1445 blood relatives of 75 Nordic patients with ataxia telangiectasia. British Journal of Cancer, 93(2):260–265.
- Parmigiani, (2002) Parmigiani, G. (2002). Modeling in Medical Decision Making: A Bayesian Approach. Statistics in practice. J. Wiley.
- Plana et al., (2022) Plana, D., Fell, G., Alexander, B. M., Palmer, A. C., and Sorger, P. K. (2022). Cancer patient survival can be parametrized to improve trial precision and reveal time-dependent therapeutic effects. Nature communications, 13(1):1–13.
- Plichta et al., (2016) Plichta, J. K., Griffin, M., Thakuria, J., and Hughes, K. S. (2016). What’s new in genetic testing for cancer susceptibility? Oncology (Williston Park, N.Y.), 30(9):787–799.
- Pylkäs et al., (2007) Pylkäs, K., Tommiska, J., Syrjäkoski, K., Kere, J., Gatei, M., Waddell, N., et al. (2007). Evaluation of the role of Finnish ataxia-telangiectasia mutations in hereditary predisposition to breast cancer. Carcinogenesis, 28(5):1040–1045.
- R Core Team, (2020) R Core Team (2020). R: A Language and Environment for Statistical Computing. R Foundation for Statistical Computing, Vienna, Austria.
- Ranola et al., (2019) Ranola, J. M. O., Tsai, G. J., and Shirts, B. H. (2019). Exploring the effect of ascertainment bias on genetic studies that use clinical pedigrees. European Journal of Human Genetics, 27(12):1800–1807.
- Renwick et al., (2006) Renwick, A., Thompson, D., Seal, S., Kelly, P., Chagtai, T., Ahmed, M., et al. (2006). Atm mutations that cause ataxia-telangiectasia are breast cancer susceptibility alleles. Nature Genetics, 38(8):873–875.
- Robson, (2018) Robson, M. (2018). Moderate-penetrance predisposition to breast cancer. Current Breast Cancer Reports, 10(3):232–239.
- Surveillance, Epidemiology, and End Results, (2018) Surveillance, Epidemiology, and End Results (2018). Cancer stat facts: Female breast cancer. Available at:. https://seer.cancer.gov/statfacts/html/breast.html. [accessed February 28, 2022].
- Swift and Lukin, (2008) Swift, M. and Lukin, J. L. (2008). Breast cancer incidence and the effect of cigarette smoking in heterozygous carriers of mutations in the ataxia-telangiectasia gene. Cancer Epidemiology and Prevention Biomarkers, 17(11):3188–3192.
- Thompson et al., (2005) Thompson, D., Duedal, S., Kirner, J., McGuffog, L., Last, J., Reiman, A., et al. (2005). Cancer risks and mortality in heterozygous ATM mutation carriers. Journal of the National Cancer Institute, 97(11):813–822.
- Turnbull and Rahman, (2008) Turnbull, C. and Rahman, N. (2008). Genetic predisposition to breast cancer: Past, present, and future. Annual Review of Genomics and Human Genetics, 9:321–345.
- Zheng et al., (2018) Zheng, Y., Walsh, T., Gulsuner, S., Casadei, S., Lee, M. K., Ogundiran, T. O., et al. (2018). Inherited breast cancer in Nigerian women. Journal of clinical oncology, 36(28):2820–2825.
Supporting Information
An R package BayesMetaPenetrance implementing the proposed method is available at https://personal.utdallas.edu/~sxb125731/ and https://github.com/LakshikaRuberu.