Sibling Rivalry: SNeIa Diversity and the Hubble Tension
Abstract
Thermonuclear supernovae, or Type-Ia supernovae (SNeIa), are an essential tool of cosmology. Precise cosmological constraints are extracted from a Hubble diagram defined by homogeneous distance indicators, but supernova homogeneity is not guaranteed. The degree of heterogeneity within the SNeIa parent population is unknown. In addition, event selections and standardization procedures are based on empirical, optically-measured observables rather than fundamental thermonuclear properties. Systematics are a natural consequence of event selection from a diverse parent population. Quantifying the impact of diversity-driven systematics is crucial to optimizing SNeIa as cosmic probes. In this work, the empirical observables are used to calibrate previously unidentified diversity-driven systematic uncertainties. The foundation of this approach is the concept of “supernova siblings”, two or more supernovae hosted by the same parent galaxy. Sibling-based calibrations isolate intrinsic differences between supernovae; they control for source distance and host galaxy dependencies that can conceal systematics or lead to their underestimation. Newly calibrated distance modulus uncertainties are approximately an order of magnitude larger than previously reported. The physical origin of these uncertainties is plausibly attributed to the diverse thermonuclear scenarios responsible for SNeIa and the inhomogeneous apparent magnitudes induced by this diversity. Systematics mitigation strategies are discussed. Cosmological parameter constraints extracted from a re-analysis of the Pantheon+ SNeIa dataset are weaker than previously reported. Agreement with early-Universe parameter estimates is achieved for a CDM cosmology, including a reduction of the Hubble Tension from 5 to 1.
1 Introduction
Thermonuclear, or Type-Ia, supernovae (SNeIa) are deeply connected to topics throughout astrophysics and cosmology. They have synthesized the majority of iron in the universe and have supplied much of the energy input to the interstellar medium. Thermonuclear supernovae are also effective distance indicators, making them one of the premiere probes of cosmology. Their treatment as standardizable candles and visibility out to high redshifts has had sweeping ramifications, including direct evidence for an accelerating universal expansion and the existence of dark energy (Riess et al., 1998; Perlmutter et al., 1999).
Supernovae continue to be used to constrain cosmological models. The most precise constraints are those extracted from a systematics-free Hubble diagram defined by a homogeneous sample of standard (or standardizable) candles (Goobar & Leibundgut, 2011). A homogeneous sample of supernovae is not guaranteed; event selections and optically-calibrated standardization procedures (Phillips, 1993; Guy et al., 2007) that homogenize these events are based on secondary observables, rather than thermonuclear scenarios that govern these cosmic beacons (Hillebrandt & Niemeyer, 2000; Maoz et al., 2014; Seitenzahl & Townsley, 2017; Clark et al., 2021). Rapid thermonuclear burning of a white dwarf is central to the SNeIa paradigm (e.g., Nomoto et al. (1984)), but the nature of progenitor(s) and the method(s) of ignition remain a topic of intense debate (Hillebrandt & Niemeyer, 2000; Maoz et al., 2014; Seitenzahl & Townsley, 2017; Clark et al., 2021).
Systematics are a natural consequence of event selection from a heterogenous (i.e., diverse) parent SNeIa population. Quantifying diversity-driven systematics is important. For example, over-constrained cosmological parameters are a direct result of a Hubble diagram defined by distance moduli with underestimated uncertainties. The imperative to understand systematics has taken on new relevance since there now exists an unresolved inconsistency between measurements of the Hubble-Lemaître parameter (), the fundamental metric of cosmic expansion (Freedman, 2021; Kamionkowski & Riess, 2022; Abdalla et al., 2022).
A comprehensive new analysis, and calibration, of SNeIa systematic uncertainties is presented here. The foundation of this work is the concept of “supernova siblings”, two or more supernovae hosted by the same parent galaxy. Galaxies that host multiple supernovae are unique cosmic laboratories; they isolate sibling-to-sibling differences by controlling for source distance and global host galaxy properties. These scientific controls mitigate the confounding effects that conceal diversity-driven systematics to reveal newly identified distance modulus uncertainties.
Previous sibling-based studies were motivated by the goal to characterize the distance modulus uncertainties that define Hubble diagram quality; these qualitative analyses identified evidence for correlations between sibling observables, but did not quantitatively account for them (Scolnic et al., 2020, 2022). Doing so is critical; incognito intrinsic correlations conceal the presence of systematics by artificially biasing statistical measures to low values. The sibling-based calibration procedures derived below fully account for intrinsic correlations to give a rigorous accounting of systematic uncertainties for SNeIa distance moduli and associated observables.
This paper is organized as follows: Supernova sibling datasets are described in Section 2. Sibling-based calibration procedures are presented in Section 3. The impact of newly calibrated distance modulus uncertainties is discussed in Section 4, with a focus on how the revised uncertainties resolve the tension between early- and late-time estimates of . Finally, the physical origin of the newly calibrated systematic distance modulus uncertainties is discussed in Section 5, along with recommendations for their mitigation.

2 Sibling Datasets
The primary challenge to compiling a statistically meaningful sample of supernova siblings is a low event rate (1 SNeIa galaxy-1 century-1; Horiuchi & Beacom (2010)). Large cosmic volumes must be surveyed over extended periods of time to compensate. This work focuses on previously identified siblings within the Dark Energy Survey (DES) and Pantheon+ datasets (Scolnic et al., 2020, 2022). The former carried out a deep, wide-area survey of millions of galaxies over six years (2013-2019); the latter includes 18 different samples, each defined as a single survey of supernovae over a discrete period of time. A total of thirty-one (31) sibling pairs were identified in twenty (20) host galaxies: eight (8) within the DES sample () and twenty-three (23) in Pantheon+ (). This accounting includes all pairwise combinations within a host; multiple observations of the same supernova are considered unique events, but sibling pairs consisting of the same object are excluded.
Additional sibling compilations exist; they are not included here for a variety of reasons. Individual sibling pairs identified within other surveys are insufficient to support a robust independent statistical analysis (Burns et al., 2020; Biswas et al., 2021). Spectroscopic twins are excluded because they do not meet the definition of siblings; their relationships are defined solely on the basis of their spectral properties (Boone et al., 2021). Lastly, siblings identified using combined historical datasets are excluded because the individual measurements require recalibration to a homogenous standard (e.g., Scolnic et al. (2015)).
All DES and Pantheon+ siblings were processed using the same analysis pipelines as their parent datasets; each was also spectroscopically confirmed as Type-Ia. The light curves of each supernova were fit using the SALT2 (Spectral Adaptive Light-curve Template) model (Guy et al., 2007) as part of event processing; this well-established empirical approach uses the emergent spectral energy distributions of SNeIa to standardize their apparent magnitudes. The fits return three parameters: an overall amplitude (), which is then converted to a brightness (), a light-curve stretch (), and a light-curve color (). A distance modulus is computed for each supernova using the Tripp relation (Tripp, 1998),
| (1) |
where are correlation coefficients of luminosity with and , respectively, and is the absolute magnitude of SNeIa; here, and (Brout et al., 2019). The Tripp estimate is intended to be a standardized measure of supernova distance in units of an apparent magnitude. Additional details associated with event selections, data processing, as well as tabulated fit parameters, distance moduli, their uncertainties, and host galaxy redshifts for all sibling supernovae can be found elsewhere (Scolnic et al., 2020, 2022).
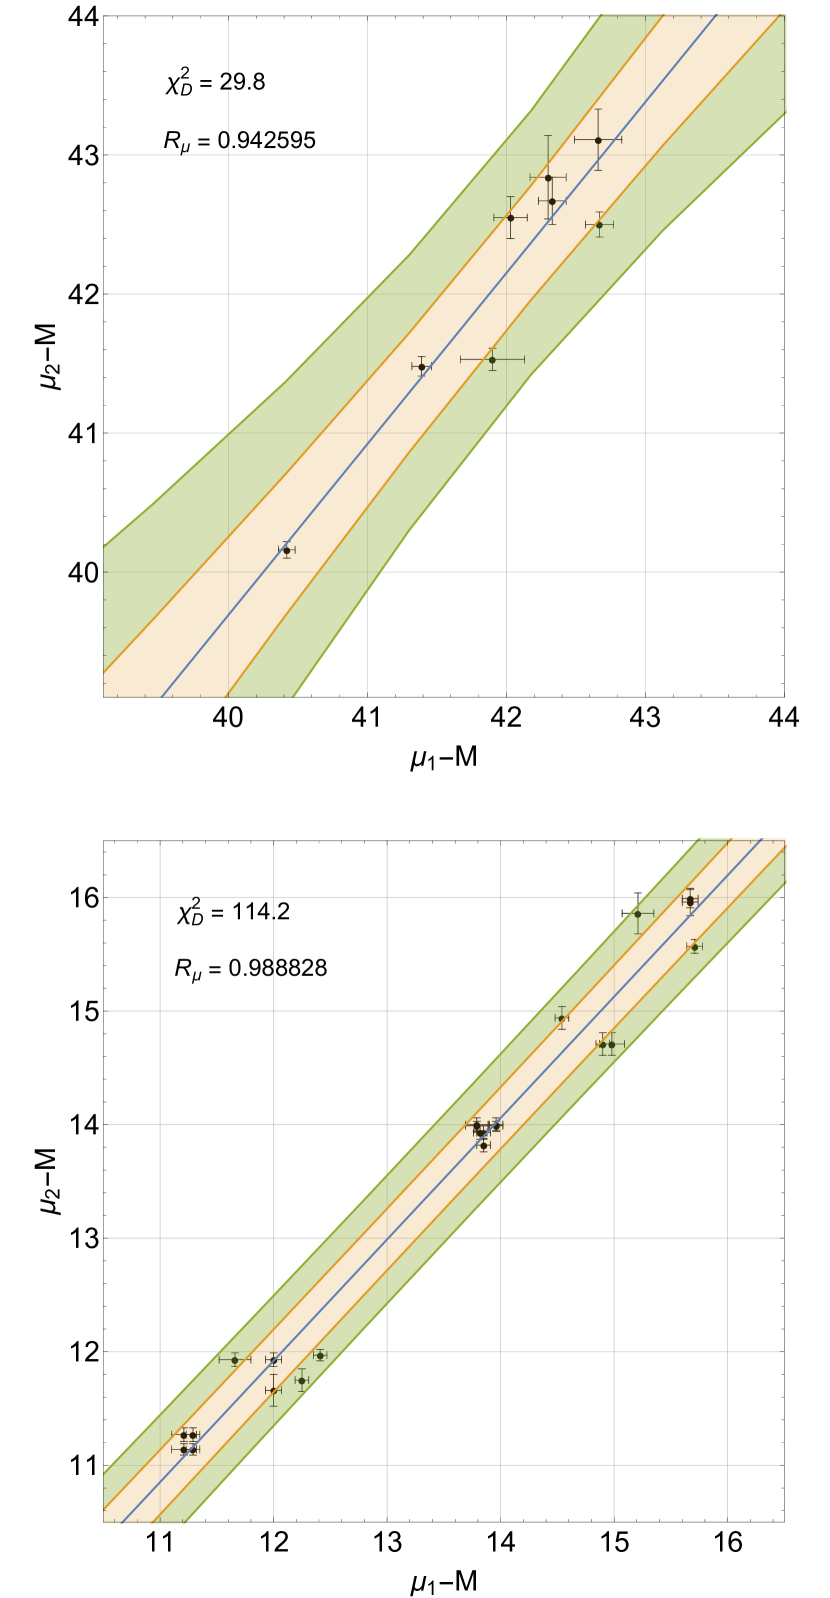
Sibling relationships are defined by the degree of similarity among their observables (). Sibling-to-sibling differences show a diversity that belies their fundamental relationship (Fig. 1). Intra-sibling observables are (imperfectly) correlated; inter-sibling connections are uncorrelated (Tab. 1). These links imply that siblings are distinguishable, with pair-to-pair differences governed by stochastic processes. In short, the supernova siblings are merely relatives, rather than twins.
| Observable, | KS -value | |||||||
|---|---|---|---|---|---|---|---|---|
| DES () | ||||||||
| 29.8 | 0.942 | 0.474 | 0.149 | 8.8 | 1.32 | |||
| 430.3 | 0.464 | 0.137 | 0.063 | 11.1 | 0.70 | |||
| 34.4 | 0.237 | 0.011 | 0.045 | 2.4 | 0.12 | |||
| 24.1 | 0.187 | 0.813 | 0.761 | 1.9 | 1.60 | |||
| Pantheon+ () | ||||||||
| 114.2 | 0.989 | 0.277 | 0.086 | 21.9 | 1.89 | |||
| 1104.2 | 0.985 | 0.022 | 0.056 | 58.2 | 3.26 | |||
| 67.8 | 0.552 | 0.187 | 0.037 | 2.4 | 0.10 | |||
| 1220.0 | 0.563 | 0.168 | 0.181 | 11.3 | 2.1 | |||
Note. — (1) Tripp/SALT2 parameter, and in units of magnitude; (2) from Eqn. 2; (3) probability of exceeding under baseline i.i.d. assumption; (4) intra-sibling (sibling-to-sibling) correlation; (5) Kolmogorov-Smirnov -value, inter-sibling (pair-to-pair) comparison to uniform distribution; (6) measurement error, pooled from measurement uncertainties reported by Scolnic et al. (2020, 2022); (7) sibling-derived systematic uncertainty; (8) systematic uncertainty-to-measurement error ratio; (9) total uncertainty, .
3 Calibration of Distance Modulus Uncertainties
Sibling-based experimental controls guarantee that the distance moduli of identical twins are equal, by definition. Any observed differences between them should be consistent with measurement errors; otherwise, the siblings must be considered members of an inhomogeneous sample. An ensemble measure of sibling-to-sibling differences in is given by
| (2) |
where and are the distance moduli of the -th sibling pair, and are the corresponding measurement uncertainties, and is the number of pairwise comparisons within the sibling ensemble under study. This test statistic follows a distribution ( degrees of freedom) if the observables are independent and identically distributed (i.i.d.), and measurement errors adequately characterize their uncertainties. These assumptions are inadequate, as evidence by the small probability of obtaining a value of that exceeds () for the sibling datasets considered here (Tab. 1). Alternative descriptions are required.
Sibling distance moduli are known to be highly correlated (Fig. 2). Correlations violate the premise of i.i.d.-based observables; they skew sample statistics (e.g., , root mean squared, standard error) to lower values and, as a result, may mask the presence of an unidentified systematic or lead to its underestimation. It is imperative to account for this effect in order to unmask the presence of, and quantify, a systematic uncertainty in .
A diverse collection of artificial datasets was generated, each a set of random variate pairs with a specified systematic uncertainty and degree of correlation imposed on them. Consistency with the data was determined by comparing to a bootstrapped distribution associated with each artificial dataset; this approach is model-independent and agnostic to the existence and origin of any systematic.
Variates for each evaluation scenario were drawn from a zero-mean normal distribution , where , , and are the total uncertainty, hypothesized systematic uncertainty, and known measurement error for the observable . Measurement errors were computed by pooling the measurement uncertainties reported for each observable (Tab. 1), i.e.,
| (3) |
Correlation between each normally distributed random variate pair was imposed using
| (4) |
where is the hypothesized degree of correlation among sibling distance moduli. A bootstrapped chi-squared distribution () was constructed from trials of each evaluation scenario, where
| (5) |
a modification of Equation 2, defined the test statistic for each trial. In toto, five hundred thousand () different ()-evaluation scenarios were considered. Allowed scenarios were those that satisfy , where is the desired confidence level (C.L.). The allowed ()-parameter space is shown in Figure 3; scenarios consisting of measurement errors alone (; Eqn. 2) are excluded at C.L.
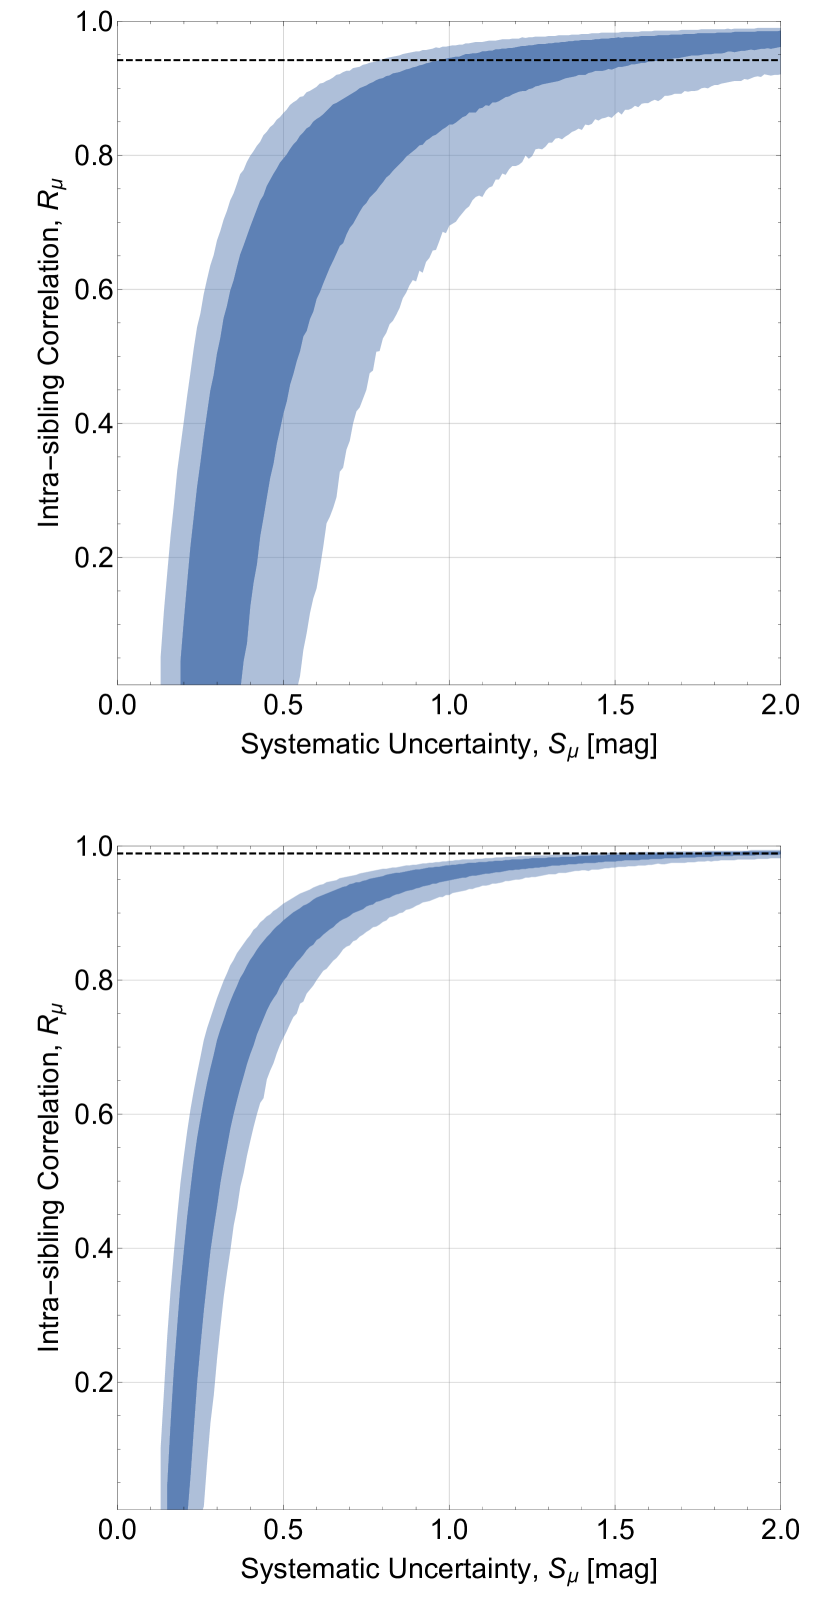
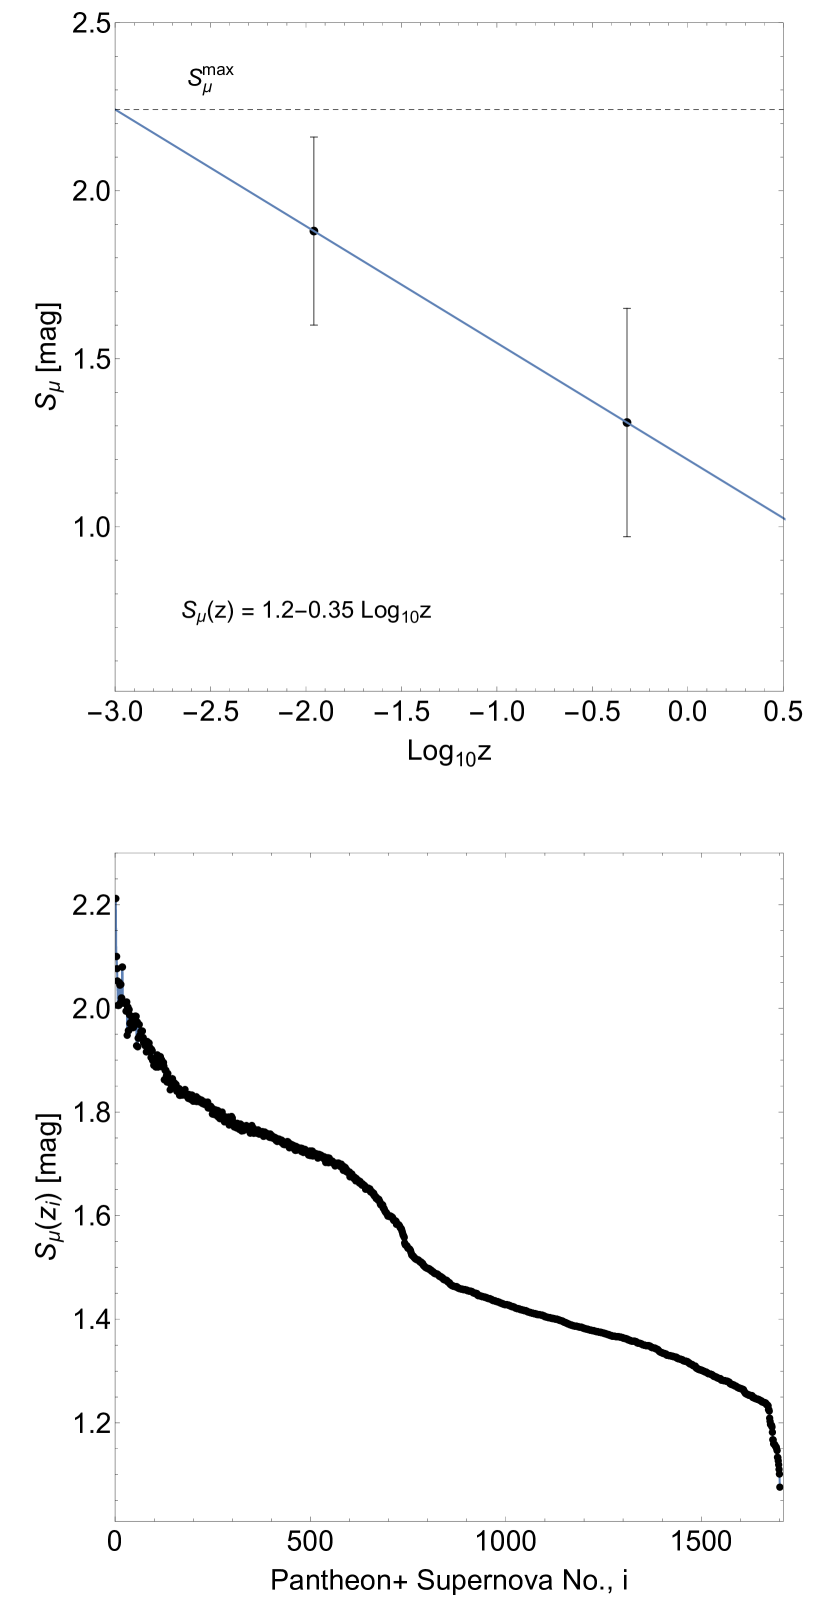
The required non-zero systematic distance modulus uncertainties are calibration measurements; they were extracted using measured intra-sibling correlations as an additional parameter space constraint (Tab. 1): mag and mag for the DES and Pantheon+ sibling ensembles, respectively. A constant is excluded at C.L.; the calibration measurements decrease as parent galaxy distance increases. Redshift dependence was characterized with a fit to the local () and deep () calibrations; -dependence was assumed to mimic distance moduli, i.e., (Fig. 4). Extrapolation to low- gives mag, the intrinsic distance modulus uncertainty in the absence of redshift effects.
3.1 Phenomenological Origin of Non-Zero
The origin of sibling-calibrated distance modulus uncertainties () was isolated with supplemental analyses of Tripp parameters. Each parameter (, , ) was analyzed independently, using procedures analogous to those described in Section 3. Scenarios consisting of measurement errors alone (i.e., ) were excluded at C.L. Key findings also include (Tab. 1): a redshift dependent (local and deep values of differ by ), absence of a -dependence for or , and an uncertainty-to-measurement error ratio () that is at least larger than the equivalent color or stretch ratios.
Evidence derived from the supplementary analyses supports the hypothesis that diversity is primarily responsible for sibling-to-sibling differences in and, ultimately, non-zero ; the observed redshift dependence is reasonably attributed to a degraded ability to differentiate sibling as a function of distance (likely due to instrument sensitivity limitations). Isolating apparent magnitudes as the principal driver of distance modulus uncertainties was uniquely enabled by sibling-based experimental controls that remove known dependencies between light curve parameters (, ) and host galaxy properties (e.g. Hamuy et al. (1995, 1996, 2000); Riess et al. (1999); Sullivan et al. (2003); Johansson et al. (2013); Henne et al. (2017); Kim et al. (2019); Pruzhinskaya et al. (2020)). The physical origin of diversity is discussed in Section 5.
3.2 Comparison with Previous Results
An earlier investigation of Pantheon+ siblings found no evidence that sibling distance moduli were correlated (Scolnic et al., 2022). This is inconsistent with the notion of siblings and in conflict with the findings presented here (e.g., Fig. 2). That work compared the standard deviation of sibling differences to random supernova pairs using a model-dependent bootstrap approach. Also noted in that work was weak evidence for sibling correlations, a result consistent with an earlier DES-sibling study (Scolnic et al., 2020); this is also inconsistent with the direct measures of correlation presented here (Tab. 1). The origin of these inconsistencies is unclear, but may stem from the use of inter-sibling statistics to make inferences about intra-sibling relationships. Analyses that do not account for intra-sibling correlations are susceptible to a numerical conspiracy: skewed statistics that influence data interpretation and mask systematics (Sec. 3).
4 Impact
Sibling-derived are direct, model-independent calibrations of SNeIa distance modulus uncertainties; they are different from, and exacerbate, the systematic effects known to dominate supernova-based cosmology studies (e.g., Scolnic et al. (2019)). Their impact is profound: larger distance modulus uncertainties dilute the relationship between (light curve-derived) distance moduli and independent measures of host-galaxy redshift, weakening cosmological model constraints derived from the SNeIa-defined Hubble diagram.
4.1 Hubble Tension
The so-called Hubble Tension refers to an inconsistency between early- and late-time determinations of . Early-time () estimates are extracted from model-dependent analyses of the cosmic microwave background (CMB). In contrast, local (late-time) estimates use a model-independent ladder of cross-calibrated distance metrics; SNeIa are an integral component of this approach.
The Hubble Tension is mitigated by the calibrated distance modulus uncertainties (Sec. 3). To quantify impact, cosmological parameter constraints were obtained by minimizing likelihoods, an approach commonly used in supernova cosmology analyses. In general, likelihoods are constructed from a vector of distance modulus residuals and a covariance matrix that includes statistical and systematic uncertainties; the residuals are differences between the distance modulus of each supernovae (Eqn. 1) and predicted redshift-dependent distances (Conley et al., 2011).
Two likelihoods were used here: the publicly available likelihood for the full Pantheon+ sample (1701 SNeIa, ) and a modified version of this likelihood that accommodates updated distance modulus uncertainties. Following Brout et al. (2022), likelihoods were evaluated using the PolyChord sampler (Handley et al., 2015) in the CosmoSIS package (Zuntz et al., 2015) with 250 live points, 30 repeats, and an evidence tolerance of 0.1. The minimization procedure was validated using the unmodified Pantheon+ likelihood; the resulting estimate of differs from the one reported by Brout et al. (2022) by only .
The modified likelihood was evaluated using the same procedure. Diagonal elements of the original Pantheon+ (statistical) covariance matrix, , give the square of the reported full distance error for each of the 1701 supernovae (Brout et al., 2022). These elements were modified to account for the newly identified uncertainties, i.e., , where is the tabulated redshift of the -th supernova; the are shown in Figure 4. No other changes were made to the likelihood. Modified full distance errors are approximately an order of magnitude larger than previously reported; they are also larger than the dispersions reported for SH0ES (Supernova and for the Equation of State of dark energy) calibrator SNeIa and Cepheids (0.130 mag) (Riess et al., 2022), the SH0ES Hubble flow sample (0.135 mag), and the RMS scatter of Hubble-diagram residuals for the full Pantheon+ dataset (0.17 mag) (Brout et al., 2022).
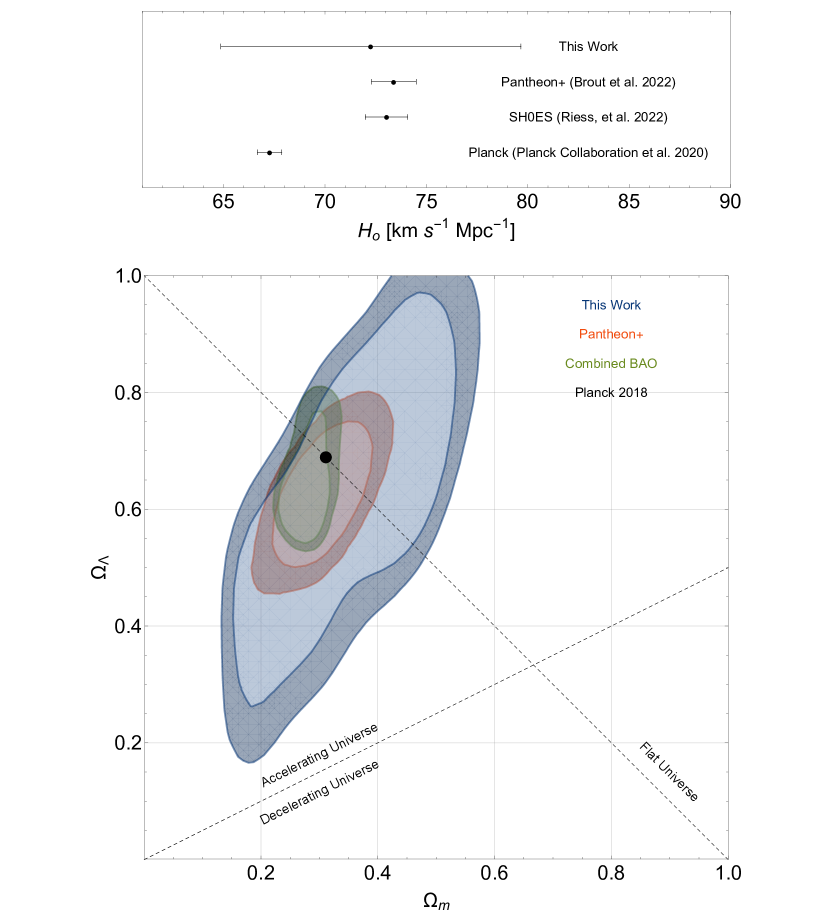
Minimization of the modified likelihood gives (68% C.L.). The central value of the Hubble-Lemaître parameter is essentially unchanged relative to SH0ES, but its uncertainty is larger. The tension between early- and late-universe estimates of is then
| (6) |
where previously reported late-time estimates of the Hubble Tension are provided for context (Fig. 5); the Planck constraint for a baseline CDM cosmology was used for the early-time estimate (Planck Collaboration et al., 2020).
4.2 Cosmological Model Constraints
Constraints on additional selected cosmological parameters were also obtained as part of the likelihood minimization procedure. For a CDM () cosmological model, the modified Pantheon+ likelihood gives , ; a flat universe is within the 68% confidence region. Confidence regions are less restrictive than those obtained using the unmodified Pantheon+ likelihood (Brout et al., 2022), a direct reflection of the larger calibrated distance modulus uncertainties identified here (Fig. 4). Parameter constraints do not change substantially if is reduced from its extrapolated value (2.24 mag; Sec. 3) to the measured maximum (1.89 mag; Tab. 1). Finally, it is notable that the three cosmological parameters considered here (, , ) are in concordance with early-Universe values after accounting for the newly calibrated systematic uncertainties.
5 Discussion
The phenomenological origin of the newly-calibrated systematic distance modulus uncertainties is diversity (Sec. 3.1). This inference is not surprising; diversity is known to exist at the UV-optical-infrared (UVOIR) wavelengths traditionally of interest to supernova cosmology investigations (Benetti et al., 2005; Parrent et al., 2014; Kromer et al., 2017). Event selections and empirical standardization procedures (like SALT2) mitigate the impact of SNeIa diversity, but it persists for a fundamental reason: UVOIR-based selectivity is not the same as selectivity based on a specific thermonuclear scenario. As noted above, sample inhomogeneity is a natural consequence of events selected from a diverse parent population.
Ideally, standard (or standardizable) candles are members of a homogeneous population; supernovae from a single progenitor class with a common explosion mechanism meet this criterion. Unfortunately, SNeIa selections based on specific thermonuclear scenarios are not currently possible, in part because of the physics responsible for UVOIR radiation and its light curves. Thermonuclear supernovae are fundamentally nuclear objects, governed by nuclear physics processes. During a supernova, a large fraction of the progenitor’s mass is fused into a single radioactive isotope (56Ni) in just a few seconds; the ensuing decay chain powers the UVOIR light curves. Emergent UVOIR radiation is reprocessed nuclear radiation.
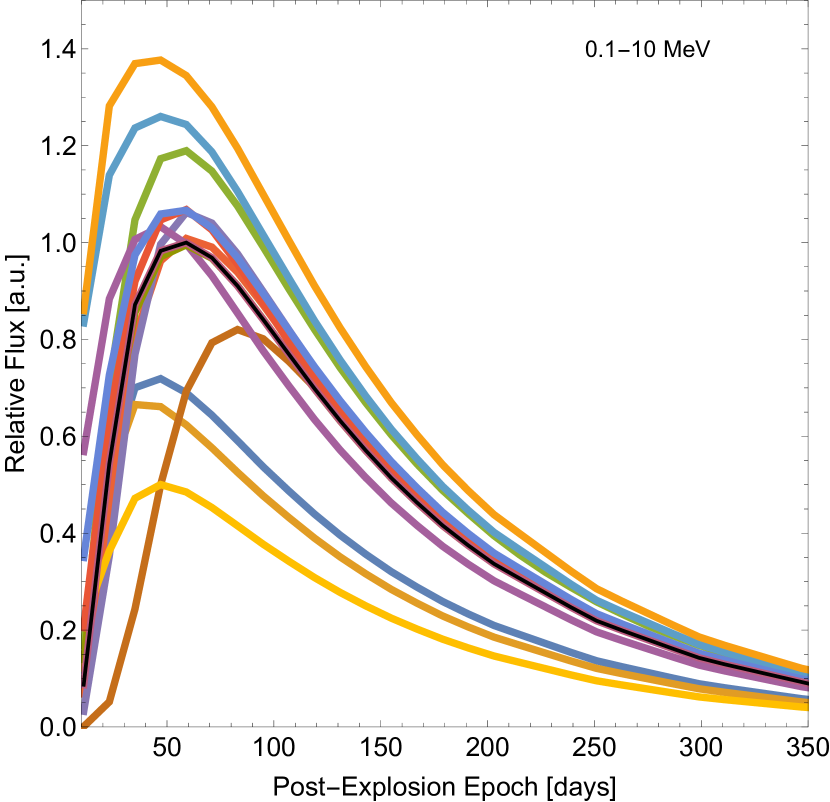
Information loss is a natural consequence of the nuclear radiation reprocessing responsible for the UVOIR signatures (Colgate & McKee, 1969). A diverse SNeIa population is expected to produce diverse nuclear light curves (Fig. 6) and, by extension, diverse low-energy light curves (e.g., Summa et al. (2013)). But the degree of information loss, the relation between peak luminosity and (“Arnett’s rule”), the effects of complex interstellar and circumstellar environments on UVOIR emission, and the impact of dependencies associated with distinct thermonuclear scenarios are currently unknown (Arnett, 1979, 1982; Sukhbold, 2019; Khatami & Kasen, 2019). As a result, the mapping between non-nuclear signatures and specific thermonuclear scenarios (if any) is unknown; the low-energy light curves alone are limited in their ability to differentiate thermonuclear scenarios.
Selectivity is an issue because SNeIa are believed to derive from multiple evolutionary pathways. Candidate progenitors include single and double-degenerate scenarios, corresponding to binaries with one or two white dwarf components; these are typically considered to be carbon/oxygen white dwarfs (e.g., Nomoto et al. (1984)), but hybrid systems have also been studied (e.g., Denissenkov et al. (2015); Augustine et al. (2019)). Nuclear burning ignition mechanisms include compression-heating in the core of a white dwarf (initially driving a deflagration), to detonations in a helium layer of an accreting white dwarf, and detonations produced through white dwarf collisions (Maoz et al., 2014). The shape and intensity of emergent nuclear light curves are dictated by the explosion process, progenitor central densities, the distribution of radioactive elements, internal structure and composition, as well as the temporal evolution of ejecta opacities.
Although the demographics of SNeIa thermonuclear scenarios are currently unknown, they are knowable. Emergent nuclear radiation is encoded with critical diagnostic evidence of the underlying thermonuclear scenario(s) and can travel great distances unscathed. Only measurements of this radioactivity – the ashes of nuclear burning – will unmask the true identities of thermonuclear supernovae to mitigate diversity-driven systematics. The tremendous potential of supernova radioactivity measurements is currently unrealized for the simple reason that instrument sensitivity has been inadequate. To date, gamma rays from just one SNeIa have been observed (Churazov et al., 2015; Diehl et al., 2015; Isern et al., 2016); this sample of one is inadequate to quantify demographic trends. An all-sky observing capability with sufficient sensitivity to characterize the temporal- and spectral-evolution signatures of emergent nuclear radiation from a representative sample of SNeIa is required. One such mission concept, the Lunar Occultation eXplorer (LOX) (e.g., Miller et al. (2019); Miller & Peplowski, in preparation) was recently proposed to fill this knowledge gap.
6 Conclusion
Newly calibrated distance modulus uncertainties are approximately an order of magnitude larger than previously reported by other supernova cosmology investigations. A reanalysis of the Pantheon+ SNeIa sample, updated with calibrated uncertainties, weakens constraints on cosmological parameters relative to the original Pantheon+ results; estimates of the Hubble-Lemaître parameter, matter- and dark energy-densities are in agreement for a CDM cosmology. The Hubble Tension was relieved after rigorous calibration of SNeIa distance modulus uncertainties. Calibration procedures leveraged the power of supernova siblings (i.e., multiple supernovae from the same host galaxy); their unique experimental controls mitigate the confounding effects that have concealed diversity-driven systematics and over-constrained cosmological parameters.
Refinements to the sibling-based calibrations are expected. Substantial resources have been committed to measure the UVOIR emission from supernovae; a key objective is to mitigate the systematics for cosmology and dark-energy studies. Future surveys by the Vera C. Rubin Observatory (Ivezic et al., 2009), the Nancy Grace Roman space telescope (Akeson et al., 2019), and other assets (both space- and ground-based) will increase the sample size of supernova and supernova siblings. The quality of sibling-based calibrations will naturally improve because of better sample statistics; as a result, the characterization of systematic distance modulus uncertainties and their redshift dependence () will be more precise.
Limitations will continue to persist due to a reliance on secondary, low-energy emission. Identifying the physical origin of diversity, the primary source of newly identified systematic uncertainties, must be a high-priority objective. The next-level precision required to address open questions in cosmology (e.g., cosmic expansion history, dark energy) requires an understanding of the fundamental nature of SNeIa progenitors and their engines, including the level of heterogeneity within their population. Formal connections between thermonuclear scenarios (identified using nuclear gamma-rays) and UVOIR-derived metrics (like the Tripp parameters) are required to inform new SNeIa event selections, mitigate the impact of intrinsic population diversity, reduce systematic uncertainties, and ultimately tighten cosmological model constraints. Intrinsic population diversity will continue to be a limiting factor without a detailed census of the thermonuclear scenarios that govern these cosmic beacons.
References
- Abdalla et al. (2022) Abdalla, E., Abellán, G. F., Aboubrahim, A., et al. 2022, Journal of High Energy Astrophysics, 34, 49, doi: 10.1016/j.jheap.2022.04.002
- Akeson et al. (2019) Akeson, R., Armus, L., Bachelet, E., et al. 2019, arXiv e-prints, arXiv:1902.05569, doi: 10.48550/arXiv.1902.05569
- Arnett (1979) Arnett, W. D. 1979, ApJ, 230, L37, doi: 10.1086/182957
- Arnett (1982) —. 1982, ApJ, 253, 785, doi: 10.1086/159681
- Augustine et al. (2019) Augustine, C. N., Willcox, D. E., Brooks, J., Townsley, D. M., & Calder, A. C. 2019, ApJ, 887, 188, doi: 10.3847/1538-4357/ab511a
- Benetti et al. (2005) Benetti, S., Cappellaro, E., Mazzali, P. A., et al. 2005, ApJ, 623, 1011, doi: 10.1086/428608
- Biswas et al. (2021) Biswas, R., Goobar, A., Dhawan, S., et al. 2021, Monthly Notices of the Royal Astronomical Society, 509, 5340, doi: 10.1093/mnras/stab2943
- Boone et al. (2021) Boone, K., Aldering, G., Antilogus, P., et al. 2021, ApJ, 912, 70, doi: 10.3847/1538-4357/abec3c
- Brout et al. (2019) Brout, D., Scolnic, D., Kessler, R., et al. 2019, ApJ, 874, 150, doi: 10.3847/1538-4357/ab08a0
- Brout et al. (2022) Brout, D., Scolnic, D., Popovic, B., et al. 2022, ApJ, 938, 110, doi: 10.3847/1538-4357/ac8e04
- Burns et al. (2020) Burns, C. R., Ashall, C., Contreras, C., et al. 2020, ApJ, 895, 118, doi: 10.3847/1538-4357/ab8e3e
- Churazov et al. (2015) Churazov, E., Sunyaev, R., Isern, J., et al. 2015, ApJ, 812, 62, doi: 10.1088/0004-637X/812/1/62
- Clark et al. (2021) Clark, P., Maguire, K., Bulla, M., et al. 2021, MNRAS, 507, 4367, doi: 10.1093/mnras/stab2038
- Colgate & McKee (1969) Colgate, S. A., & McKee, C. 1969, ApJ, 157, 623, doi: 10.1086/150102
- Conley et al. (2011) Conley, A., Guy, J., Sullivan, M., et al. 2011, ApJS, 192, 1, doi: 10.1088/0067-0049/192/1/1
- Denissenkov et al. (2015) Denissenkov, P. A., Truran, J. W., Herwig, F., et al. 2015, MNRAS, 447, 2696, doi: 10.1093/mnras/stu2589
- Diehl et al. (2015) Diehl, R., Siegert, T., Hillebrandt, W., et al. 2015, A&A, 574, A72, doi: 10.1051/0004-6361/201424991
- Freedman (2021) Freedman, W. L. 2021, ApJ, 919, 16, doi: 10.3847/1538-4357/ac0e95
- Goobar & Leibundgut (2011) Goobar, A., & Leibundgut, B. 2011, Annual Review of Nuclear and Particle Science, 61, 251, doi: 10.1146/annurev-nucl-102010-130434
- Guy et al. (2007) Guy, J., Astier, P., Baumont, S., et al. 2007, A&A, 466, 11, doi: 10.1051/0004-6361:20066930
- Hamuy et al. (1995) Hamuy, M., Phillips, M. M., Maza, J., et al. 1995, AJ, 109, 1, doi: 10.1086/117251
- Hamuy et al. (1996) Hamuy, M., Phillips, M. M., Suntzeff, N. B., et al. 1996, AJ, 112, 2398, doi: 10.1086/118191
- Hamuy et al. (2000) Hamuy, M., Trager, S. C., Pinto, P. A., et al. 2000, AJ, 120, 1479, doi: 10.1086/301527
- Handley et al. (2015) Handley, W. J., Hobson, M. P., & Lasenby, A. N. 2015, MNRAS, 453, 4384, doi: 10.1093/mnras/stv1911
- Henne et al. (2017) Henne, V., Pruzhinskaya, M. V., Rosnet, P., et al. 2017, New A, 51, 43, doi: 10.1016/j.newast.2016.08.009
- Hillebrandt & Niemeyer (2000) Hillebrandt, W., & Niemeyer, J. C. 2000, ARA&A, 38, 191, doi: 10.1146/annurev.astro.38.1.191
- Horiuchi & Beacom (2010) Horiuchi, S., & Beacom, J. F. 2010, ApJ, 723, 329, doi: 10.1088/0004-637X/723/1/329
- Hunter (2007) Hunter, J. D. 2007, Computing in Science and Engineering, 9, 90, doi: 10.1109/MCSE.2007.55
- Isern et al. (2016) Isern, J., Jean, P., Bravo, E., et al. 2016, A&A, 588, A67, doi: 10.1051/0004-6361/201526941
- Ivezic et al. (2009) Ivezic, Z., Tyson, J. A., Axelrod, T., et al. 2009, in American Astronomical Society Meeting Abstracts, Vol. 213, American Astronomical Society Meeting Abstracts #213, 460.03
- Johansson et al. (2013) Johansson, J., Thomas, D., Pforr, J., et al. 2013, MNRAS, 435, 1680, doi: 10.1093/mnras/stt1408
- Kamionkowski & Riess (2022) Kamionkowski, M., & Riess, A. G. 2022, arXiv e-prints, arXiv:2211.04492, doi: 10.48550/arXiv.2211.04492
- Khatami & Kasen (2019) Khatami, D. K., & Kasen, D. N. 2019, ApJ, 878, 56, doi: 10.3847/1538-4357/ab1f09
- Kim et al. (2019) Kim, Y.-L., Kang, Y., & Lee, Y.-W. 2019, Journal of Korean Astronomical Society, 52, 181, doi: 10.5303/JKAS.2019.52.5.181
- Kromer et al. (2017) Kromer, M., Ohlmann, S., & Röpke, F. K. 2017, Mem. Soc. Astron. Italiana, 88, 312, doi: 10.48550/arXiv.1706.09879
- Maoz et al. (2014) Maoz, D., Mannucci, F., & Nelemans, G. 2014, ARA&A, 52, 107, doi: 10.1146/annurev-astro-082812-141031
- Miller et al. (2019) Miller, R., Ajello, M., Beacom, J. F., et al. 2019, in Bulletin of the American Astronomical Society, Vol. 51, 123, doi: 10.48550/arXiv.1907.07005
- Nomoto et al. (1984) Nomoto, K., Thielemann, F. K., & Yokoi, K. 1984, ApJ, 286, 644, doi: 10.1086/162639
- Parrent et al. (2014) Parrent, J., Friesen, B., & Parthasarathy, M. 2014, Ap&SS, 351, 1, doi: 10.1007/s10509-014-1830-1
- Perlmutter et al. (1999) Perlmutter, S., Aldering, G., Goldhaber, G., et al. 1999, ApJ, 517, 565, doi: 10.1086/307221
- Phillips (1993) Phillips, M. M. 1993, ApJ, 413, L105, doi: 10.1086/186970
- Planck Collaboration et al. (2020) Planck Collaboration, Aghanim, N., Akrami, Y., et al. 2020, A&A, 641, A6, doi: 10.1051/0004-6361/201833910
- Pruzhinskaya et al. (2020) Pruzhinskaya, M. V., Novinskaya, A. K., Pauna, N., & Rosnet, P. 2020, MNRAS, 499, 5121, doi: 10.1093/mnras/staa3173
- Riess et al. (1998) Riess, A. G., Filippenko, A. V., Challis, P., et al. 1998, AJ, 116, 1009, doi: 10.1086/300499
- Riess et al. (1999) Riess, A. G., Kirshner, R. P., Schmidt, B. P., et al. 1999, AJ, 117, 707, doi: 10.1086/300738
- Riess et al. (2022) Riess, A. G., Yuan, W., Macri, L. M., et al. 2022, ApJ, 934, L7, doi: 10.3847/2041-8213/ac5c5b
- Scolnic et al. (2015) Scolnic, D., Casertano, S., Riess, A., et al. 2015, ApJ, 815, 117, doi: 10.1088/0004-637X/815/2/117
- Scolnic et al. (2019) Scolnic, D., Perlmutter, S., Aldering, G., et al. 2019, Astro2020: Decadal Survey on Astronomy and Astrophysics, 2020, 270, doi: 10.48550/arXiv.1903.05128
- Scolnic et al. (2020) Scolnic, D., Smith, M., Massiah, A., et al. 2020, ApJ, 896, L13, doi: 10.3847/2041-8213/ab8735
- Scolnic et al. (2022) Scolnic, D., Brout, D., Carr, A., et al. 2022, ApJ, 938, 113, doi: 10.3847/1538-4357/ac8b7a
- Seitenzahl & Townsley (2017) Seitenzahl, I. R., & Townsley, D. M. 2017, in Handbook of Supernovae, ed. A. W. Alsabti & P. Murdin, 1955, doi: 10.1007/978-3-319-21846-5_87
- Sukhbold (2019) Sukhbold, T. 2019, ApJ, 874, 62, doi: 10.3847/1538-4357/ab0701
- Sullivan et al. (2003) Sullivan, M., Ellis, R. S., Aldering, G., et al. 2003, MNRAS, 340, 1057, doi: 10.1046/j.1365-8711.2003.06312.x
- Summa et al. (2013) Summa, A., Ulyanov, A., Kromer, M., et al. 2013, A&A, 554, A67, doi: 10.1051/0004-6361/201220972
- The & Burrows (2014) The, L.-S., & Burrows, A. 2014, ApJ, 786, 141, doi: 10.1088/0004-637X/786/2/141
- Tripp (1998) Tripp, R. 1998, A&A, 331, 815
- Wolfram Research, Inc. (2022) Wolfram Research, Inc. 2022, Mathematica, Version 13.2. https://www.wolfram.com/mathematica
- Zuntz et al. (2015) Zuntz, J., Paterno, M., Jennings, E., et al. 2015, Astronomy and Computing, 12, 45, doi: 10.1016/j.ascom.2015.05.005