Interrelationships between nematicity, antiferromagnetic spin fluctuations and superconductivity: Role of hotspots in FeSe1-xSx revealed by high pressure 77Se NMR study
Abstract
The sulfur-substituted FeSe, FeSe1-xSx, is one of the unique systems that provides an independent tunability of nematicity, antiferromagnetism and superconductivity under pressure (). Recently Rana et al. [Phys. Rev. B 101, 180503(R) (2020)] reported, from 77Se nuclear magnetic resonance (NMR) measurements on FeSe0.91S0.09 under pressure, that there exists a clear role of nematicity on the relationship between antiferromagnetic (AFM) spin fluctuations and superconducting transition temperature () where the AFM spin fluctuations are more effective in enhancing in the absence of nematicity than with nematicity. Motivated by the work, we carried out 77Se NMR measurements on FeSe1-xSx with = 0.15 and 0.29 under pressure up to 2.10 GPa to investigate the relationship in a wide range of in the FeSe1-xSx system. Based on the new results together with the previously reported data for = 0 [P. Wiecki et al., Phys. Rev. B 96, 180502(R) (2017)] and 0.09 [K. Rana et al. Phys. Rev. B 101, 180503(R) (2020)], we established a - - temperature () phase diagram exhibiting the evolution of AFM spin fluctuations. From the systematic analysis of the NMR data, we found that the superconducting (SC) state in nematic state arises from a non Fermi liquid state with strong stripe-type AFM spin fluctuations while the SC state without nematicity comes from a Fermi liquid state with mild stripe-type AFM spin fluctuations. Furthermore, we show that the previously reported impact of nematicity on the relationship between AFM fluctuations and superconductivity holds throughout the wide range of from = 0 to 0.29 in FeSe1-xSx under pressure. We discuss the origin of the role of nematicity in terms of the different numbers of hotspots on Fermi surfaces with and without nematicity.
I Introduction
The interplay between magnetic fluctuations, electronic nematicity and the unconventional nature of superconductivity has received wide interest after the discovery of high superconductivity in iron pnictides Kamihara2008 . In most Fe-based superconductors (FeSCs), superconductivity appears close to the quantum phase transitions of two long-range orders: the nematic order, which is an electronically driven structural transition from high-temperature tetragonal (HTT) with C4 symmetry to low-temperature orthorhombic (LTO) having C2 symmetry, and the antiferromagnetic (AFM) order with spontaneously oriented Fe-3 spins characterized by stripe-type spin structure Scalipino2012 ; Johnston2010 ; Canfield2010 ; Stewart2011 . In those systems, the nematic transition temperature () is usually at or just above the transition temperature for the AFM state, (), and superconductivity emerges upon the simultaneous suppression of both the nematic and the AFM transitions by carrier doping and/or the application of pressure (). These results clearly indicate a close relationship between AFM and nematic phases, however, the individual contribution to superconductivity from these two phases is difficult to separate due to the close proximity of the two phases.
In this respect, the S-substituted FeSe system, FeSe1-xSx, provides a suitable platform to investigate the individual contribution of nematic and AFM fluctuations to superconductivity. FeSe1-xSx has the simplest of crystal structures among the Fe-based superconductors, with quasi-two dimensional Fe(Se,S) layers in the plane, stacked along the axis. At = 0, FeSe undergoes a nematic phase transition at 90 K followed by a superconducting (SC) transition at 8.5 K without AFM ordering at ambient pressure Bohmer2018 ; Hsu2008 ; McQueen2009 ; Baek2015 . This allows the study of magnetic fluctuations inside the nematic order and its relationship with superconductivity Imai2009 . The nematic phase in FeSe can be suppressed by pressure application, with decreasing down to 32 K at = 1.5 GPa Wiecki2018 ; Wang2017 . shows a complex multi-domed structure with , reaching a maximum 37 K at 6 GPa Mizuguchi2008 ; Margadonna2009 ; Medvedev2009 . At the same time, an AFM ordered state appears above = 0.8 GPa Terashima2015 ; Bendele2010 , and merges with above = 1.7 GPa Kothapalli2016 ; Bohmer2019 ; Gati2019 , limiting the range for studying the effects of nematicity on superconductivity without AFM state.
The S-substitutions for Se in FeSe1-xSx is also a well known way to control the nematic phase where is suppressed to zero at the critical value, 0.17, with increasing . first increases up to 10 K around = 0.09 making a maximum and then decreases gradually at higher close to Watson2015 ; Wiecki2018 ; Reiss2017 ; Abdel2015 . Although AFM order is not seen at ambient pressure in the FeSe1-xSx system, an enhancement of AFM fluctuations was found at 0.09 by nuclear magnetic resonance (NMR) measurements Wiecki2018 . The NMR study also suggested that AFM fluctuations are important in determining the superconductivity in FeSe1-xSx even in the vicinity of a nematic quantum phase transition (QPT) at 0.17. On the other hand, recent spectroscopic-imaging scanning tunneling microscopy Hanaguri2018 , thermal conductivity and specific heat Sato2018 measurements show an abrupt change in around Mizukami2021 and the considerable change in the size and anisotropy of the SC gap is observed at the nematic QPT, implying different SC states inside and outside nematic states Coldea2021 . These results may indicate that the nematicity also plays an important role in the SC states of FeSe1-xSx.
In fact, nematicity has been reported to affect superconductivity by changing the symmetry Fernandes2012 ; Fernandes2014 and magnitude Wiecki2018 ; Tanatar2016 of AFM spin fluctuations. AFM spin fluctuations in FeSCs are characterized by the in-plane stripe-type wave vectors: and/or (using the single-iron Brillouin zone notation) Paglione2010 ; Dai2015 . In the HTT C4 symmetric state where nematicity is absent, the AFM spin fluctuations may originate from both and wave vectors. In contrast, in the C2 symmetric state when nematicity is present, only one of the two wave vectors, either or , will contribute to AFM spin fluctuations, due to the breaking of symmetry equivalency Fernandes2012 ; Fernandes2014 . Recent 77Se NMR studies on FeSe1-xSx under pressure actually showed the large change in the magnitude of AFM spin fluctuations with and without nematicity Rana2020 ; Kuwayama2021 ; Kuwayama2019 ; Kuwayama2020 . In addition, from 77Se NMR studies on FeSe1-xSx with = 0.09 under pressure, the impact of nematicity on the relationship between AFM spin fluctuations and has been proposed, where the AFM spin fluctuations are more effective in enhancing superconductivity in the absence of nematicity as compared to when it is present Rana2020 ; Rana2022 . On the other hand, as described above, the importance of nematicity for the appearance in superconductivity has been discussed in FeSCs Kontani2010 ; Shibauchi2020 ; Yang2015 ; Kuo2016 ; Lederer2015 ; Lederer2017 . Therefore it is important to investigate the relationships between AFM spin fluctuations, nematicity, and superconductivity in a wide range of in FeSe1-xSx.
In this paper, we carried out 77Se NMR studies under pressure up to 2.1 GPa for and compounds to investigate the universality of the role of nematicity on the relationship for a wide range of in FeSe1-xSx. From the analysis of the NMR data for the two compounds together with the previous data for Wiecki2017 and Rana2020 systems under , we report that the SC state in nematic state arises from a non-Fermi liquid (nFL) with strong AFM spin fluctuations while the SC state without nematicity arises from a Fermi liquid (FL) with moderate AFM spin fluctuations in these systems. Furthermore, we confirm that nematicity has a clear impact on the relationship between AFM spin fluctuations and superconductivity throughout the FeSe1-xSx system under as previously suggested Rana2020 . The AFM spin fluctuations in the C4 phase were found to be more effective in enhancing compared to AFM spin fluctuations in the C2 phase by a factor of . We provide a possible explanation for this observation in terms of the higher total number of hotspots in the Fermi surface that meet the nesting condition in the C4 symmetric state, in comparison with the case of the C2 symmetric state by a factor of 8. Finally it suggested that AFM correlation length () in the C2 states is generally longer than in the C4 phase which could be related to the different nature of SC states with and without nematicity.
II Experimental Details
NMR measurements of 77Se nuclei (=1/2, MHz/T) were carried out using a laboratory-built phase-coherent spin-echo pulse spectrometer. The measurements were carried out under a fixed magnetic external field of = 7.4089 T applied either along the axis or the tetragonal [110] direction in the plane. The single crystals with sulfur contents and 0.29 in FeSe1-xSx were grown using chemical vapor transport as outlined in Refs. Wiecki2018 ; Bohmer2016 . Multiple small single crystals were oriented and stacked with spacers inside the NMR coil. A NiCrAl/CuBe piston-cylinder was used for application of up till 2 GPa. Daphne 7373 was used as the mediating fluid, and the nuclear quadrupolar resonance (NQR) of Cu in Cu2O at 77 K was used for calibration Fukazawa2007 ; Reyes1992 . Spectra were obtained from spin-echo signals by using fast Fourier transform. was measured with a saturation-recovery method and at each was determined by fitting the nuclear magnetization versus time using the single exponential function , where and are the nuclear magnetization at after saturation and the equilibrium nuclear magnetization at , respectively.
III Results
III.1 77Se NMR Spectrum and Knight shift
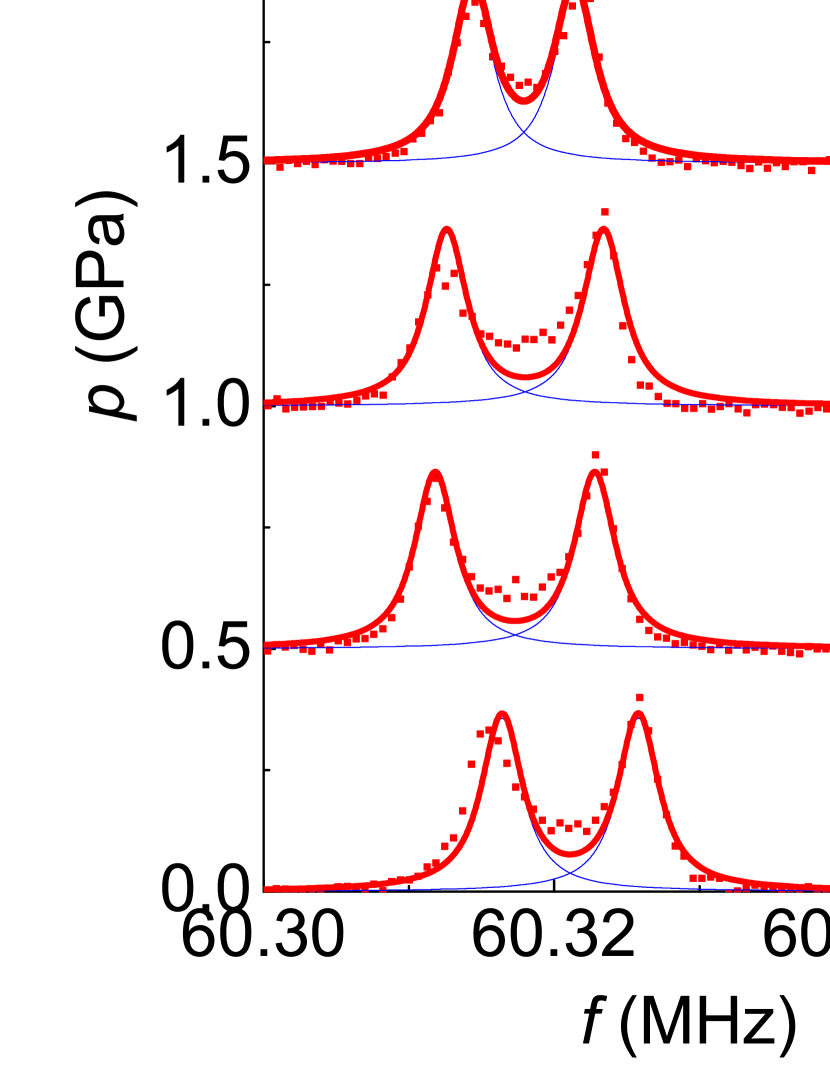
Figures 1(a)-1(d) show the 77Se NMR spectra measured at = 20 K under various pressures ( = 0 - 2.10 GPa) for = 0.15 and 0.29, together with those for = 0 and 0.09 reported previously Wiecki2017 ; Rana2020 . Here we applied magnetic field along [110] direction in the HTT phase (). As in the case of = 0 ( = 90 K) and 0.09 ( = 65 K) at ambient , the two split lines of the NMR spectrum (shown in red) are observed in nematic state for = 0.15 ( K at ambient ) as shown at the bottom of Fig. 1(c). Those two peak structures are due to the twinned nematic domains Baek2015 ; Bohmer2015 ; Wiecki2017 . As can be seen in Fig. 1(c) for = 0.15, the splitting in the NMR spectra is not seen at = 0.2 GPa and higher (even down to 1.7 K at 0.2 GPa, as shown in the supplementary Sup ). This indicates a very small critical pressure of 0.2 GPa for nematic QPT at = 0.15. In the case of ( 0.17), no split of the NMR spectra is observed from ambient pressure up to 1.95 GPa as shown in Fig. 1(d), showing no-nematic state in the compound. NMR spectra for nonzero values are broader than those for due to the introduction of inhomogeneity with sulfur substitution of selenium.
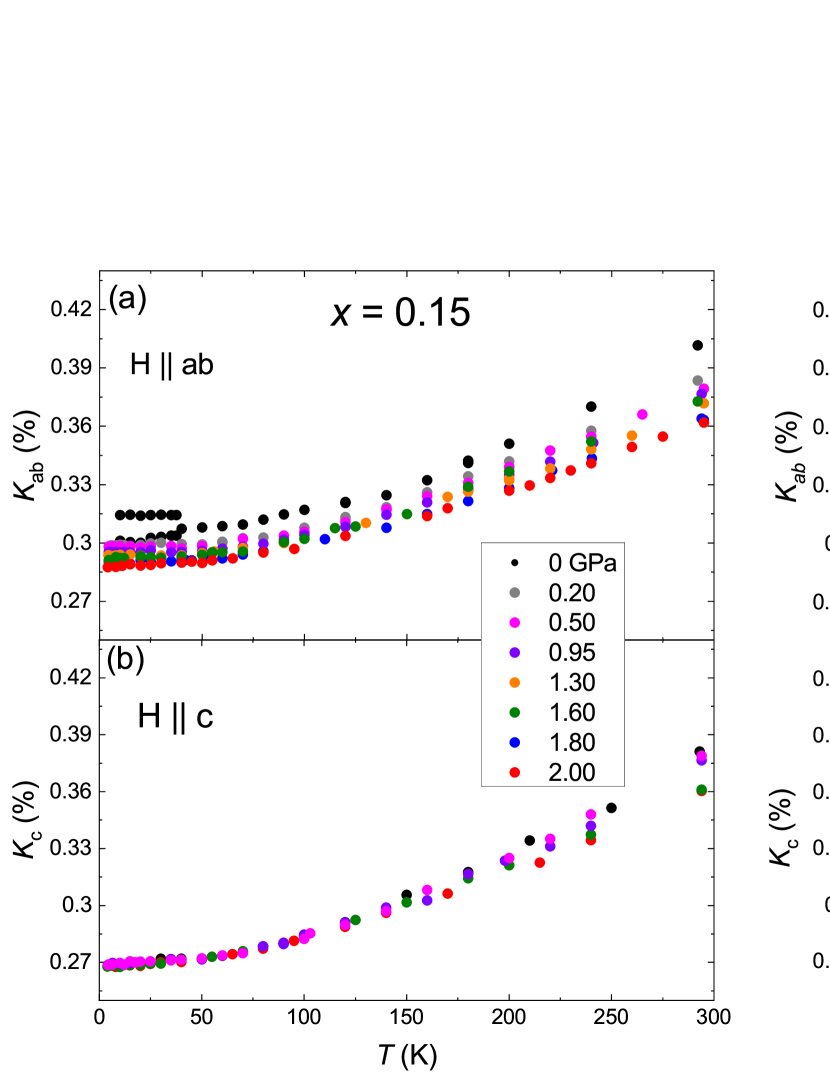
Figures 2(a) and 2(b) show the dependences of for () and for () of at various pressures from ambient up to 2.0 GPa. With decreasing , both and decrease and become nearly constant below 50 K. The values of decrease slightly with increasing while shows less dependence. In particular, no clear dependence is observed in at low below 150 K within our experimental uncertainty. Similar and dependences of and are observed for as shown in Figs. 2(c) and 2(d).
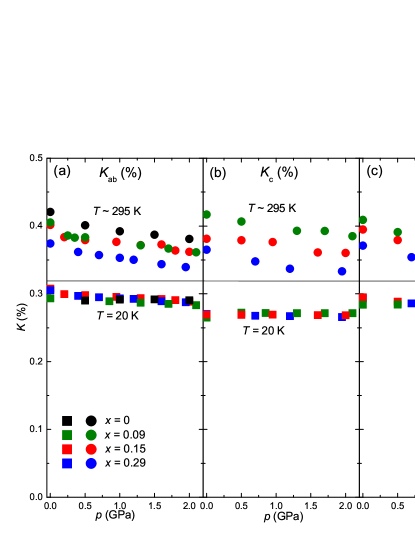
To see the and dependences of at high and low temperatures more clearly, we plot the and measured at 295 K (top) and at 20 K (bottom) in Fig. 3(a) and 3(b), respectively. We also plot the average values of Knight shift () in Fig. 3(c). Here the values of for and 0.09 were taken from Refs. Wiecki2017 and Rana2020 , respectively. The average values of for the two peaks were used when nematic state was present. In general, consists of the -independent orbital component () and the -dependent spin component () which is proportional to static uniform magnetic susceptibility and thus to the density of states at the Fermi energy . As we show later in Sec. IV, is nearly independent of and . Therefore the and dependences of , and can be attributed to the spin part of . Given those dependences, the in FeSe1-xSx system has a slight suppression at 295 K with increasing and/or up to 2.0 GPa. In contrast, the is nearly independent of at low temperatures with a tiny decrease with . We note that the change in due to a Lifshitz transition under pressure suggested in the quantum oscillations measurements for = 0.11 Reiss2019 and inferred from NMR measurements for = 0.12 Kuwayama2021 was not detected in the dependence of values within our experimental uncertainty in the measured FeSe1-xSx systems. It is interesting to point out that varies significantly with and even though the is nearly independent of those. This is in contrast to conventional BCS superconductors, in which generally correlates with . These results strongly indicate that AFM spin fluctuations play an important role in the appearance of SC in FeSe1-xSx, as will be discussed below.
III.2 77Se Spin-lattice Relaxation Rates ()
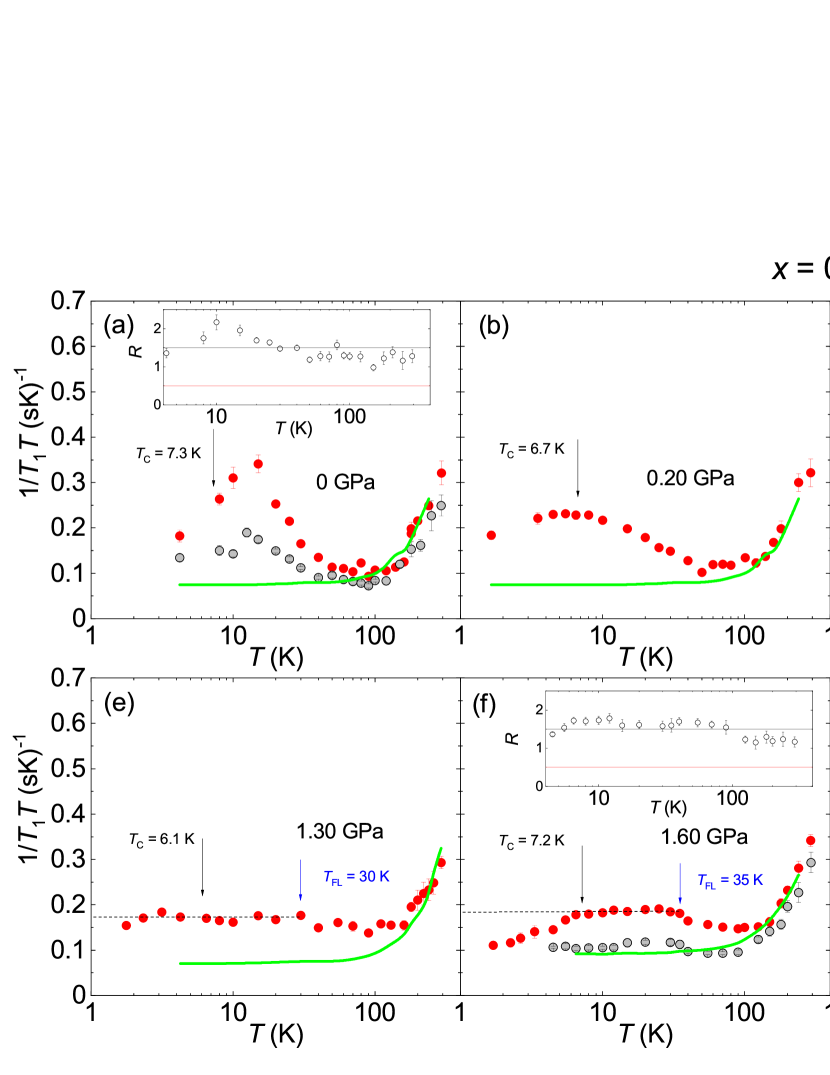
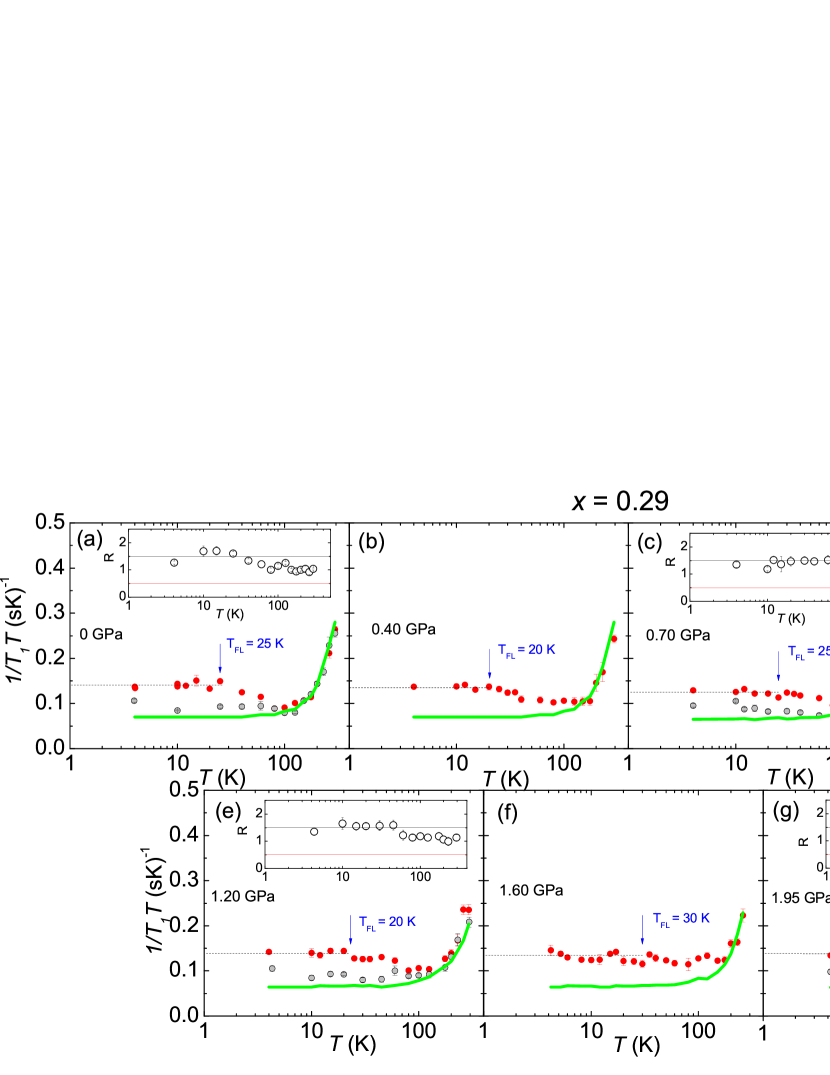
Figures 4(a)-4(h) show the dependence of 77Se for [] by red circles for the various pressures at . In general, 1/ is related to the dynamic magnetic susceptibility as , where is the wave-vector dependent form factor and is the imaginary part of at the Larmor frequency Moriya1963 . Since measures the uniform magnetic susceptibility, by comparing the dependencies between 1/ and , one can obtain information on the evolution of with respect to that of . Above 100 K, decreases monotonically with decreasing similar to and . In contrast, different dependences below 100 K were observed: and continue to decrease on lowering and show a nearly constant behavior below 50 K for and 25 K for respectively, whereas starts increasing around 100 K when decreasing . This deviation is attributed to the presence of AFM spin fluctuations as in and 0.09 in FeSe1-xSx Wiecki2018 ; Rana2020 . The decrease in observed around or below marked by black arrows is due to SC transition. The suppression of 1/ above is also observed [see Fig. 4(a)] whose origin has been discussed in terms of a possible SC fluctuation effect Kasahara2016 or pseudogap behavior Shi2018 .
The temperature dependence of at low temperatures changes when is passed 0.2 GPa for = 0.15. As shown in Fig. 4(a), at ambient , the at low shows a Curie-Weiss like enhancement which is expected for two-dimensional AFM spin fluctuations Moriya1963 . On the other hand, for shown in Figs. 4(c)-4(h), moderately increases below 100 K before exhibiting a constant behavior below a characteristic temperature marked by blue arrows. Here we determined from the data for since are more sensitive to AFM fluctuations for than Wiecki2018 . A similar temperature dependence of 1/ has been reported for Rana2020 and the state below was regarded as a Fermi liquid (FL) state because it follows the Korringa behavior where both and are constant, similar to the FL state in exchange enhanced metals Moriya1963 ; Narath1968 . It is important to note that while the SC state with C4 symmetry arises from a FL state with AFM spin fluctuations, the SC state with C2 symmetry arises from the nematic state with AFM spin fluctuations that show a Curie-Weiss-like behavior.
Similarly, Figs. 5(a)-5(g) show the dependence of by red circles for the measured pressures at . At high temperatures above 100 K, increases monotonically with increasing , similar to and for all the measured region up till 1.95 GPa. As in the case of = 0.15, the deviation between and is seen below 100 K. The characteristic is also observed at 20–30 K for all values, where a constancy in and (both and ) is observed.
Since the dependence of 1/ at low temperatures seems to be different below and above and/or , it is important to see whether the wave vectors associated with the AFM spin fluctuations change or not. According to previous NMR studies on Fe pnictides KitagawaSrFe2As2 ; Kitagawa2010 ; FukazawaKBaFe2As2 and related materials Furukawa2014 ; Pandey2013 ; Ding2016 , the ratio, provides valuable information on the dependence of the AFM spin fluctuations, where and represent the measured under and , respectively. If AFM spin fluctuations are characterized by stripe-type with and/or , an = 1.5 is expected for isotropic fluctuations while, in the case of Néel type AFM spin fluctuations with the wave vector = (, ), is expected to be 0.5. Therefore we measured for for both and 0.29. The results are shown by gray circles in Figs. 4 and Figs. 5, respectively where the dependence of at different pressures is shown in the corresponding inset. At high temperatures above 100 K, values are nearly same for and directions and 1 for both and 0.29. When AFM spin fluctuations start developing as is lowered below 100 K, a difference is seen for the two measured directions, and becomes 1.5 or more. This is very similar to what was observed for Rana2020 and suggests that AFM spin fluctuations are characterized by the stripe-type ones with and/or in FeSe1-xSx throughout the measured region up to 2 GPa.
IV Discussion
In this section, we show the relationship between AFM spin fluctuations, nematicity and superconductivity in FeSe1-xSx. To discuss the magnitude of AFM spin fluctuations, we estimate the contribution of AFM spin fluctuations from the observed assuming that the observed can be decomposed into two components of the AFM [] and the independent [] components: 1/ = + . The second term is expected to be proportional to . Here is given by where is the -independent orbital shift. Therefore, by comparing 1/ to , one can estimate . The green curves in Figs. 4 and 5 are the estimated temperature dependence of ; the values are shown on right axes. is a proportional constant introduced to fit the temperature dependence of at high temperatures above 100 K. From the fittings, we found that = 0.175 % is independent of and and the independent values of = 8.5 and 7.75 for for = 0.15 and 0.29, respectively. Here we used data to compare the temperature dependence of since the enhancements in due to the stripe-type AFM spin fluctuations are prominent along the axis Kitagawa2010 . For the cases where values were not available as in Figs. 4(b), 4(e), 4(g) and Figs. 5 (b), 5(e), 5(f), smooth extrapolations were made to estimate based on the data at nearest pressures for each compound. Thus, the differences between (red circles) and green curves are attributed to the contributions of AFM spin fluctuations, .
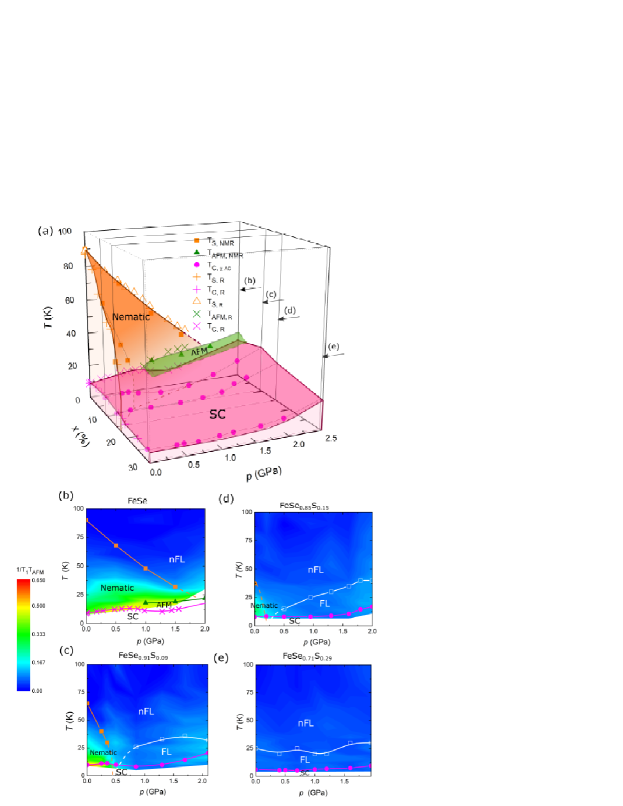
The estimated AFM contributions to are shown with the phase diagram in Figs. 6(b)-6(d) where contour plots of are shown for = 0.15 and 0.29 as a function of together with the data for = 0 and 0.09 estimated from our previous papers Wiecki2017 ; Rana2020 . The phase diagram of FeSe1-xSx in Fig. 6(a) was constructed from NMR measurements from ambient to 2 GPa as well as the data available from literature. (closed magenta circles) Sup ; Rana2020 and (closed green triangles) Wiecki2017 were deduced using ac susceptibility measurements at zero field, and (closed orange squares) Wiecki2017 ; Rana2020 were determined from the NMR spectra. For FeSe under pressure, transition temperatures for the nematic (open orange triangles), AFM (green crosses) and superconducting states (magenta crosses) determined from resistivity curves were taken from Ref. Udhara2016 . Similarly, for = 0 in FeSe1-xSx, the transition temperatures for the nematic (orange pluses) and superconducting (magenta pluses) were taken from Ref. Reiss2017 which were also based on resistivity measurements.
In the contour plots [Figs. 6(b)-6(e)], we also show and by symbols in orange and magenta, respectively. The white squares represent the characteristic temperature () below which FL states are observed. It is clearly seen in the contour plots that AFM spin fluctuations are more enhanced inside the nematic state than outside the nematic state. One of the interesting phenomena in FeSe1-xSx is that a FL state is observed only in the C4 state after suppressing the nematic state with or throughout the presented phase diagram. A FL behavior was also seen through resistivity measurements for under pressure Reiss2019 . This was recently attributed as the signatures of quantum Griffiths phase close to the nematic quantum phase transition through magnetoresistivity measurements Reiss2021 . It is interesting to note that the smooth extrapolation of to = 0 seems to cross the nematic QPT pressure of 0.5 and 0.2 GPa for = 0.09 and 0.15, respectively. Therefore our results also suggest the strong connection between nematic QPT and the appearance of FL states.
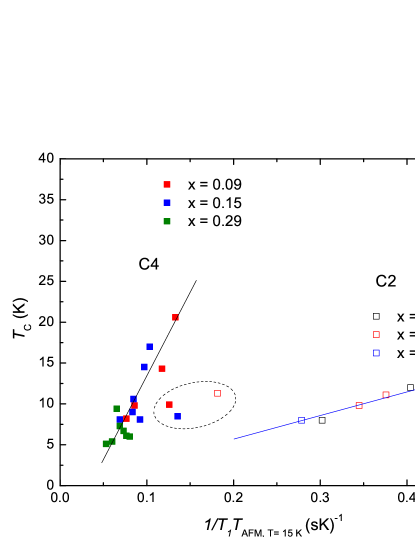
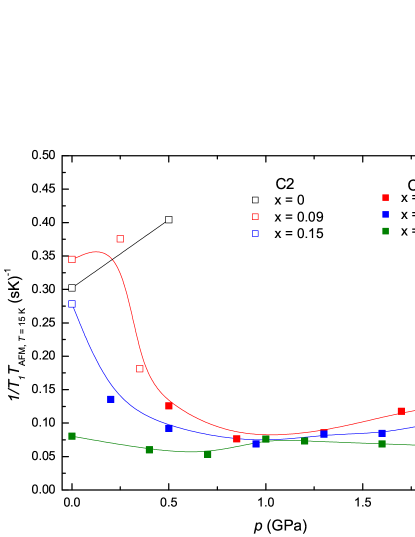
Now we discuss the relationship between and the magnitude of AFM spin fluctuations. In Fig. 7, we plot at zero magnetic field against the magnitude of AFM spin fluctuations. Here we used the values of (1/ at = 15 K to represent the magnitude of AFM spin fluctuations. As has been pointed out in Ref. Rana2020 , the data points are mainly divided into two groups with the open (C2 state) and closed (C4 state) squares, and seems to be proportional to AFM spin fluctuations in both C2 and C4 states as shown in the blue and black lines, respectively. However, clearly the slope for the C4 states is higher that that for the C2 state. This indicates that the AFM spin fluctuations without nematicity enhance much more than those with nematicity. Here, the black line has a times higher slope than the blue line. It is interesting to point out that the three points inside the black dashed oval between the two lines correspond to the data close to , suggesting a smooth crossover between the two linear behaviors at the nematic QPT.
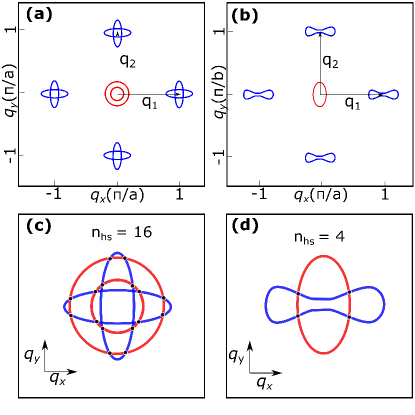
One of the reasons why AFM spin fluctuations in the C4 state lead to higher compared to those in the C2 state in FeSe1-xSx could be due to the different Fermi surfaces in the paramagnetic tetragonal and nematic orthorhombic phases. Figures 8(a) and 8(b) show the schematic Fermi surfaces at = 0 for the C4 and C2 states based on Refs. Reiss2017 ; Watson2017 . The main differences are seen at ( point) and at and (Z points in the C4 state and A points in the C2 state). For simplification, the orbital contribution to the Fermi surface are not indicated.
In the C4 state of FeSe, two circular hole pockets (red lines) at point and two oval shaped electron pockets (blue lines) at the Z points are found in ARPES measurements Watson2017 . This structure of the Fermi surface is also observed in ARPES measurements with at the low of 10 K where nematicity is absent Reiss2017 . When the hole pocket at point is translated by either or , 16 intersections with the electron pockets at the Z points can exist as shown in Fig. 8(c). Here denotes the number of intersections when the hole pockets are translated by one wave vector. Since the four wave vectors ( and ) are allowed for C4 symmetry, a total of possible intersections can be found.
In the C2 nematic state, on the other hand, an oval hole pocket (red line) at the point and a single peanut shaped electron pocket (blue line) at the A points are present as shown in Fig. 8(b) Watson2017 . When the hole pocket at is translated by either or to the electron pocket at A points in the nematic state, there are 4 possible intersections (that is, = 4) for one wave vector as shown in Fig. 8(d). Since two wave vectors (either or ) are prominent in the nematic state, a total of intersections can be present.
These intersections that meet the nesting conditions are called hotspots and are deemed important in determining in high- cuprates where AFM spin fluctuations are relevant Wang2017 . The total number of the hotspots in the C4 symmetric tetragonal state increases by a factor of 64/8=8 with respect to the C2 orthorhomibc nematic state. This number seems to be consistent with the experimentally determined factor of in the slopes of the lines of Fig. 7. Although this is quite qualitative, our results suggest that “hotspots” are one of the key parameters to determine in Fe-based superconductors. More detailed theoretical studies for quantitative analysis about the dependency of on are highly called for.
Finally we comment on the and dependences of AFM correlation length . Figure 9 shows the and dependent of at = 15 K in FeSe1-xSx where the open and closed symbols represent the C2 and C4 states, respectively. It is clearly seen that the values of in the C2 phase are higher than those in the C4 phase. According to Millis-Monien-Pines (MMP) model, is proportional to the square of in real space () Millis1990 ; Baek2020 . Therefore our results may suggest the in the C4 state is shorter than in the nematic C2 state. It is interesting to point out that SC states with nematicity (C2 state) and without nematicity (C4 state) are induced by AFM spin fluctuations with different values of . It would also be interesting if the change in between the C4 and C2 states relate to the BCS-BEC transition at 0.17 observed by ARPES measurements at ambient pressure Hashimoto2021 where longer is suggested when BCS superconductivity is present and a shorter is suggested in the BEC case. If so, the shortening of under in FeSe1-xSx would be compatible to the BCS-BEC transition at the respective critical pressure for nematic QPT around 0.5 GPa for and 0.2 GPa for . Further studies are called for searching BCS-BEC transition under pressure in FeSe1-xSx.
V Summary
In summary, 77Se-NMR measurements were carried out in the FeSe1-xSx system under pressure for = 0.15 and 0.29, and were analyzed together with the previously reported measurements for = 0 Wiecki2017 and 0.09 Rana2020 , to provide a comprehensive study of the interrelationships between nematicity, magnetism and superconductivity in this system. We established the phase diagram featuring the presence of nematic quantum phase transitions, the appearance of Fermi liquid phases, superconductivity with C4 and C2 rotational symmetries and the contour plots of the magnitude of AFM spin fluctuations. When analyzing the dependence of superconducting transition temperature on the magnitude of AFM spin fluctuations, the different linear relationships on the basis of symmetry are apparent. The C4 symmetric AFM spin fluctuations are more effective in enhancing by a factor of 7 2 higher than compared to their C2 symmetric counterparts. This was explained in terms of the presence of higher total number of hotspots in the C4 symmetric Fermi surface compared to the Fermi surface with C2 symmetry in the FeSe1-xSx system by a factor of 8. These results indicate that the hotspots may play an important role in determining in FeSe1-xSx. Future theoretical investigations will be interesting to clarify the relationship between the total number of hotspots and , leading a step closer towards understanding the details of Cooper-pairing mechanism in unconventional superconductors.
VI Acknowledgments
We appreciate Rafael Fernandes for helpful discussions. The research was supported by the U.S. Department of Energy (DOE), Office of Basic Energy Sciences, Division of Materials Sciences and Engineering. Ames Laboratory is operated for the U.S. DOE by Iowa State University under Contract No. DE-AC02-07CH11358.
References
- (1) Y. Kamihara, T. Watanabe, M. Hirano, and H. Hosono, J. Am. Chem. Soc. 130, 3296 (2008).
- (2) D. J. Scalapino, Rev. Mod. Phys. 84, 1383 (2012).
- (3) D. C. Johnston, Adv. Phys. 59, 803 (2010).
- (4) P. C. Canfield and S. L. Bud’ko, Annu. Rev. Condens. Matter Phys. 1, 27 (2010).
- (5) G. R. Stewart, Rev. Mod. Phys. 83, 1589 (2011).
- (6) F.-C. Hsu, J.-Y. Luo, K.-W. Yeh, T.-K. Chen, T.-W. Huang, P. M. Wu, Y.-C. Lee, Y.-L. Huang, Y.-Y. Chu, D.-C. Yan and M.-K. Wu, Proc. Natl. Acad. Sci. U.S.A. 105, 14262 (2008).
- (7) T. M. McQueen, A. J. Williams, P. W. Stephens, J. Tao, Y. Zhu, V. Ksenofontov, F. Casper, C. Felser and R. J. Cava, Phys. Rev. Lett. 103, 057002 (2009).
- (8) A. E. Böhmer and A. Kreisel, J. Phys.: Condens. Matter 30, 023001 (2018).
- (9) S-H. Baek, D. V. Efremov, J. M. Ok, J. S. Kim, J. van den Brink, and B. Büchner, Nat. Mater. 14, 210 (2015).
- (10) T. Imai, K. Ahilan, F. L. Ning, T. M. McQueen and R. J. Cava, Phys. Rev. Lett. 102, 177005 (2009).
- (11) X. Wang, Y. Schattner, E. Berg and R. M. Fernandes, Phys. Rev. B 95, 174520 (2017).
- (12) P. Wiecki, K. Rana, A. E. Böhmer, Y. Lee, S. L. Bud’ko, P. C. Canfield and Y. Furukawa, Phys. Rev. B 98 020507(R) (2018).
- (13) S. Margadonna, Y. Takabayashi, Y. Ohishi, Y. Mizuguchi, Y. Takano, T. Kagayama, T. Nakagawa, M. Takata, and K. Prassides, Phys. Rev. B 80, 064506 (2009).
- (14) Y. Mizuguchi, F. Tomioka, S. Tsuda, T. Yamaguchi and Y. Takano, Appl. Phys. Lett. 93, 152505 (2008).
- (15) S. Medvedev, T. M. McQueen, I. A. Troyan, T. Palasyuk, M. I. Eremets, R. J. Cava, S. Naghavi, F. Casper, V. Ksenofontov, G. Wortmann, and C. Felser, Nat. Mater. 8, 630 (2009)
- (16) T. Terashima, N. Kikugawa, S. Kasahara, T. Watashige, T. Shibauchi, Y. Matsuda, T. Wolf , A. E. Böhmer, F. Hardy, C. Meingast, H. v. Löhneysen, and S. Uji, J. Phys. Soc. Jpn. 84 063701 (2015).
- (17) M. Bendele, A. Amato, K. Conder, M. Elender, H. Keller, H.-H. Klauss, H. Luetkens, E. Pomjakushina, A. Raselli, and R. Khasanov, Phys. Rev. Lett. 104, 087003 (2010).
- (18) K. Kothapalli, A. E. Böhmer, W. T. Jayasekara, B. G. Ueland, P. Das, A. Sapkota, V. Taufour, Y. Xiao, E. Alp, S. L. Bud’ko, P. C. Canfield, A. Kreyssig, and A. I. Goldman, Nat. Commu. 7, 12728 (2016).
- (19) A. E. Böhmer, K. Kothapalli, W. T. Jayasekara, J. M. Wilde, B. Li, A Sapkota, B. G. Ueland, P. Das, Y. Xiao, W. Bi, J. Zhao, E. E. Alp, S. L. Bud’ko, P. C. Canfield, A. I. Goldman, and A. Kreyssig, Phys. Rev. B. 100, 064515 (2019).
- (20) E. Gati, A. E. Böhmer, S. L. Bud’ko, and P. C. Canfield, Phys. Rev. Lett. 123, 167002 (2019).
- (21) M. D. Watson, T. K. Kim, A. A. Haghighirad, S. F. Blake, N. R. Davies, M. Hoesch, T. Wolf and A. I. Coldea, Phys. Rev. B 92, 121108(R) (2015).
- (22) P. Reiss, M. D. Watson, T. K. Kim, A. A. Haghighirad, D. N. Woodruff, M. Bruma, S. J. Clarke and A. I. Coldea, Phys. Rev. B 96, 121103(R) (2017).
- (23) M. Abdel-Hafiez, Y.-Y. Zhang, Z-Y Cao, C.-G. Duan, G. Karapetrov, V. M. Pudalov, V. A. Vlasenko, A. V. Sadakov, D. A. Knyazev, T. A. Romanova, D. A. Chareev, O. S. Volkova, A. N. Vasiliev and Xiao-Jia Chen, Phys. Rev. B 91, 165109 (2015).
- (24) T. Hanaguri, K. Iwaya, Y. Kohsaka, T. Machida, T. Watashige, S. Kasahara, T. Shibauchi, and Y. Matsuda, Sci. Adv. 4, eaar6419 (2018).
- (25) Y. Sato, S. Kasahara, T. Taniguchi, X. Z. Xing, Y. Kasahara,Y. Tokiwa, T. Shibauchi, and Y. Matsuda, Proc. Natl. Acad. Sci. U.S.A. 115, 1227 (2018).
- (26) Y. Mizukami, M. Haze, O. Tanaka, M. Matsuura, D. Sano, J. Bok̈er, I. Eremin, S. Kasahara, Y. Matsuda, and T. Shibauchi, ArXiv:2105.00739 (2021)
- (27) A. I. Coldea, Front. Phys. 8, 594500 (2021)
- (28) R. M. Fernandes, A. V. Chubukov, J. Knolle, I. Eremin and J. Schmalian, Phys. Rev. B 85, 024534 (2012).
- (29) R. M. Fernandes, A. V. Chubukov and J. Schmalian, Nature Phys. 10, 97 (2014).
- (30) M. A. Tanatar, A. E. Böhmer, E. I. Timmons, M. Schuẗt, G. Drachuck, V. Taufour, K. Kothapalli, A. Kreyssig, S. L. Bud’ko, P. C. Canfield, R. M. Fernandes and R. Prozorov, Phys. Rev. Lett. 117, 127001 (2016).
- (31) J. Paglione and R. L. Greene, Nat. Phys. 6, 645–658 (2010).
- (32) P. Dai, Rev. Mod. Phys. 87, 855–896 (2015).
- (33) K. Rana, L. Xiang, P. Wiecki, R. A. Ribeiro, G. G. Lesseux, A. E. Boḧmer, S. L. Bud’ko, P. C. Canfield and Y. Furukawa, Phys. Rev. B 101 180503(R) (2020).
- (34) T. Kuwayama, K. Matsuura, Y. Mizukami, S. Kasahara, Y. Matsuda, T. Shibauchi, Y. Uwatoko, and N. Fujiwara, Mod. Phys. Lett. B 34, 2040048 (2020)
- (35) T. Kuwayama, K. Matsuura, J. Gouchi, Y. Yamakawa, Y. Mizukami, S. Kasahara, Y. Matsuda, T. Shibauchi, H. Kontani, Y. Uwatoko and N. Fujiwara Sci. Rep. 11, 17265 (2021).
- (36) T. Kuwayama, K. Matsuura, Y. Mizukmami, S. Kasahara, Y. Matsuda, T. Shibauchi, Y. Uwatoko and N. Fujiwara, J. Phys. Soc. Jpn. 88, 033703 (2019).
- (37) K. Rana and Y. Furukawa, Front. Phys. 10 849284 (2022).
- (38) H. Kontani and S. Onari, Phys. Rev. Lett. 104, 157001 (2010).
- (39) T. Shibauchi, T. Hanaguri, and Y. Matsuda, J. Phys. Soc. Jpn. 89, 102002 (2020).
- (40) J. Yang, R. Zhou, L.-L. Wei, H.-X. Yang, J.-Q. Li, Z.-X. Zhao, and G.-Q. Zheng, Chin. Phys. Lett. 32, 107401 (2015).
- (41) H.-H. Kuo, J.-H. Chu, J. C. Palmstrom, S. A. Kivelson, and I. R. Fisher, Science 352, 958 (2016).
- (42) S. Lederer, Y. Schattner, E. Berg, and S. A. Kivelson, Phys. Rev. Lett. 114, 097001 (2015).
- (43) S. Lederer, Y. Schattner, E. Berg, and S. A. Kivelson, Proc. Natl. Acad. Sci. USA 114, 4905 (2017).
- (44) P. Wiecki, M. Nandi, A. E. Böhmer, S. L. Bud’ko, P. C. Canfield and Y. Furukawa, Phys. Rev. B 96 180502(R) (2017).
- (45) A. E. Böhmer, V. Taufour, W. E. Straszheim, T. Wolf and P. C. Canfield, Phys. Rev. B 94, 024526 (2016).
- (46) A. P. Reyes, E. T. Ahrens, R. H. Heffner, P. C. Hammel, and J. D. Thompson, Rev. Sci. Instrum. 63, 3120 (1992).
- (47) H. Fukazawa, N. Yamatoji, Y. Kohori, C. Terakura, N. Takeshita, Y. Tokura and H. Takagi, Rev. Sci. Instrum. 78, 015106 (2007).
- (48) A. E. Böhmer, T. Arai, F. Hardy, T. Hattori, T. Iye, T. Wolf, H. V. Löhneysen, K. Ishida and C. Meingast, Phys. Rev. Lett. 114, 027001 (2015).
- (49) See supplemental material (SM) for ac susceptibility measurements for and using NMR coil as well as the 77Se NMR spectra at 1.7 K for under = 7.4089 T parallel to the tetragonal [110] direction in the ab plane. Typical nuclear relaxation cures and NMR spectra in the SC and normal states are also given in the SM.
- (50) P. Reiss, D. Graf, A. A. Haghighirad, W. Knafo, L. Drigo, M. Bristow, A. J. Schofield, A.I. Coldea, Nat. Phys., 16, 89-94 (2020).
- (51) S. Kasahara, T. Yamashita, A. Shi, R. Kobayashi, Y. Shimoyama, T. Watashige, K. Ishida, T. Terashima, T. Wolf, F. Hardy, C. Meingast, H. v. Loḧneysen, A. Levchenko, T. Shibauchi, and Y. Matsuda, Nat. Commun. 7, 12843 (2016).
- (52) A. Shi, T. Arai, S. Kitagawa, T. Yamanaka, K. Ishida, A. E. Böhmer, C. Meingast, T. Wolf, M. Hirata, and T. Sasaki, J. Phys. Soc. Jpn. 87, 013704 (2018).
- (53) T. Moriya, J. Phys. Soc. Jpn. 18, 516 (1963).
- (54) A. Narath and H. T. Weaver, Phys. Rev. 175, 373 (1968).
- (55) K. Kitagawa, N. Katayama, K. Ohgushi and M. Takigawa, J. Phys. Soc. Jpn. 78, 063706 (2009).
- (56) S. Kitagawa, Y. Nakai, T. Iye, K. Ishida, Y. Kamihara, M. Hirano and H. Hosono, Phys. Rev. B 81, 212502 (2010).
- (57) M. Hirano, Y. Yamada, T. Saito, R. Nagashima, T. Konishi, T. Toriyama, Y. Ohta, H. Fukazawa, Y. Kohori, Y. Furukawa, K. Kihou, C.-H. Lee, A. Iyo and H. Eisaki, J. Phys. Soc. Jpn. 81, 054704 (2012).
- (58) Y. Furukawa, B. Roy, S. Ran, S. L. Bud’ko and P. C. Canfield, Phys. Rev. B 89, 121109(R) (2014).
- (59) A. Pandey, D. G. Quirinale, W. Jayasekara, A. Sapkota, M. G. Kim, R. S. Dhaka, Y. Lee, T. W. Heitmann, P. W. Stephens, V. Ogloblichev, A. Kreyssig, R. J. McQueeney, A. I. Goldman, A. Kaminski, B. N. Harmon, Y. Furukawa and D. C. Johnston, Phys. Rev. B 88, 014526 (2013).
- (60) Q.-P. Ding, P. Wiecki, V. K. Anand, N. S. Sangeetha, Y. Lee, D. C. Johnston and Y. Furukawa, Phys. Rev. B 93, 140502(R) (2016).
- (61) U. S. Kaluarachchi, V. Taufour, A. E. Böhmer, M. A. Tanatar, S. L. Bud’ko, V. G. Kogan, R. Prozorov, and P. C. Canfield, Phys. Rev. B 94, 064503 (2016).
- (62) P. Reiss, D. Graf, A. A. Haghighirad, T. Vojta, and A. I. Coldea, Phys. Rev. Lett. 127, 246402 (2021).
- (63) M. D. Watson, A. A. Haghighirad, L. C. Rhodes, M. Hoesch and T. K. Kim, New J. Phys 19 103021 (2017).
- (64) A. J. Millis, H. Monien and D. Pines, Phys. Rev. B 42, 167 (1990).
- (65) S-H. Baek, J. M. Ok, J. S. Kim, S. Aswartham, I. Morozov, D. Chareev, T. Urata, K. Tanigaki, Y. Tanabe, B. Buc̈hner and D. V. Efremov, npj Quant. Mater. 5, 8 (2020).
- (66) T. Hashimoto, Y. Ota, A. Tsuzuki, T. Nagashima, A. Fukushima, S. Kasahara, Y. Matsuda, K. Matsuura, Y. Mizukami, T. Shibauchi, S. Shin and K. Okazaki, Sci. Adv. 118, 20, e2020585118 (2021).