Lack of Correlations between Cold Molecular Gas and AGN Properties in Type 1 AGNs at
Abstract
We present new NOrthern Extended Millimeter Array (NOEMA) observations of the CO(2–1) emission in eight of the brightest Palomar-Green quasars at to investigate the role of active galactic nuclei (AGN) feedback in luminous quasars detected at low redshifts. We detect CO(2–1) emission in three objects, from which we derive CO luminosities, molecular gas masses and fractions, and gas depletion times. In combination with data available in the literature, we build a total sample of 138 local type 1 AGNs with CO(2–1) measurements. We compare the AGN properties with the host galaxy molecular gas properties, considering the systems non-detected in CO emission. We find that the CO luminosity does not correlate with AGN luminosity and Eddington ratio, while the molecular gas fraction is weakly correlated with Eddington ratio. The type 1 AGNs can be roughly separated into two populations in terms of infrared-to-CO luminosity ratio, one population presenting values typically found in normal star-forming systems, while the other have lower ratio values, comparable to those measured for starbursts. We find no evidence that AGN feedback rapidly quenches star formation in type 1 AGNs. Our results may imply an underlying the role of host galaxy gravitational instabilities or the fast inflow of cold gas in triggering AGN activity.
1 Introduction
The evolution of galaxies is tightly correlated with the growth of the supermassive black holes (BHs) as evidenced by the correlations between the BH mass and the host galaxy bulge properties (Magorrian et al., 1998; Ferrarese & Merritt, 2000; Gebhardt et al., 2000). The connection between BH accretion and the host galaxy growth naturally arises because both depend on the same fuel reservoir, replenished largely by similar processes that drive gas inward (Kormendy & Kennicutt, 2004). The co-evolution of the BH and host galaxy (Kormendy & Ho, 2013) is widely accepted to be regulated by the feedback of the active galactic nuclei (AGN; Fabian 2012). During the accretion of mass onto the BH, vast amounts of energy are released, and a merely minor fraction of this power coupled to the BH surroundings can heat and/or expel the gas from the host galaxy (e.g., Somerville et al. 2008; Schaye et al. 2015; Sijacki et al. 2015; Nelson et al. 2018), thereby halting the ongoing star formation activity (Dubois et al., 2016). The AGN feedback can also affect the galaxy halo, preventing the condensation of cold and warm gas, and further hamper the star formation over long timescales (Bower et al., 2006; Croton et al., 2006; Fabian, 2012; Gaspari et al., 2020).
During the last decade, numerous efforts have been focused to test whether AGN feedback effectively removes sufficient cold gas from the host galaxy to curtail ongoing star formation activity. Studies focusing on comparisons with control samples and/or the main-sequence of star-forming galaxies have reported no difference between the inactive galaxies and those hosting AGNs (Rosario et al. 2018; Kirkpatrick et al. 2019; Schulze et al. 2019; Florez et al. 2020; Koss et al. 2021; Salvestrini et al. 2022; Smirnova-Pinchukova et al. 2022, but see Vito et al. 2014; Scholtz et al. 2018; Stemo et al. 2020). Correlations between key host galaxy properties, such as molecular hydrogen (H2) content, star formation rate (SFR), and/or star formation efficiency, with AGN luminosity suggest that low- luminous AGNs are mainly hosted in typical star-forming galaxies (e.g., Harrison et al. 2012; Rosario et al. 2012, 2013; Zhang et al. 2016; Stanley et al. 2017; Husemann et al. 2017; Bernhard et al. 2019; Grimmett et al. 2020; Yesuf & Ho 2020; Jarvis et al. 2020; Koss et al. 2021; Vietri et al. 2022), while the more luminous active systems tend to be found in starbursts (e.g., Young et al. 2014; Bernhard et al. 2016; Pitchford et al. 2016; Kirkpatrick et al. 2020; Shangguan et al. 2020a; Xie et al. 2021; Zhuang et al. 2021). Only a few studies of high- AGNs () suggest reduced molecular gas content in AGN hosts (Kakkad et al., 2017; Perna et al., 2018; Circosta et al., 2021; Bischetti et al., 2021). Whether or how the luminous AGN does efficiently remove or heat the gas from host galaxy and affect the ongoing star formation is still uncertain (Harrison et al., 2017).
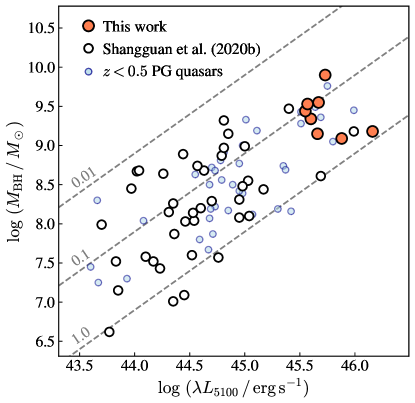
Optically visible and largely unobscured quasars–the most luminous AGNs– allows us to study possible effects of AGN feedback on their host galaxies. An unobscured quasar is thought to arise after the overwhelming release of energy from the AGN that expels the gas and dust enshrouding the nucleus (e.g., Sanders et al. 1988; Hopkins et al. 2008). Strikingly, the study of the global IR (m) spectral energy distribution (SED) emission in a set of 87 local () Palomar-Green (PG) quasars (Boroson & Green, 1992) suggested that most of these unobscured AGNs have dust-based molecular gas masses comparable to normal star-forming galaxies with similar stellar mass (Shangguan et al., 2018). Follow-up Atacama compact array (ACA) observations targeting the carbon-monoxide molecule (12CO) emission and previous literature observations confirmed the results from the global IR SED analysis. The CO transition [GHz; hereafter CO(2–1)] emission was detected in a total 34 out of 40 PG quasars. The global CO emission line shapes further suggested that the molecular gas appears kinematically regular within the host galaxies (Shangguan et al. 2020a, b, see also Molina et al. 2021). However, the PG quasar sample observed in CO is admittedly biased toward the less luminous local PG quasars (erg s-1; Figure 1). Luminous AGNs can drive multi-phase outflows and deposit its energy into the host galaxy interstellar medium (ISM; Cicone et al. 2014; Feruglio et al. 2015; Perna et al. 2015; Morganti 2017; Cicone et al. 2018; Fluetsch et al. 2019; Veilleux et al. 2020; Girdhar et al. 2022). The outflow energetics correlate with AGN luminosity (molecular gas mass outflow rates and kinetic power ; Fiore et al. 2017) meaning that the AGN feedback effect on the host galaxy ISM, if any, should be more easily detected in more luminous AGNs.
In this work, we report new NOrthern Extended Millimeter Array (NOEMA) observations targeting the CO(2–1) for a sub-sample of eight PG quasars selected from Shangguan et al. (2018). Those targets correspond to the more luminous PG quasars at . By using complementary data taken from the literature, we build a total sample of 138 unobscured local AGNs covering the erg s-1 range to study the relation between the host galaxy molecular gas content and AGN activity, and to explore whether AGN feedback is effectively operating in those sources. The paper is organized as follows. Section 2 presents our sample, observation strategy and data reduction. The data analysis is described in Section 3, and the subsequent results are described in Section 4. We further discuss our findings in Section 5. Section 6 is the conclusion. We adopt a CDM cosmology with , , and km sMpc-1 (Planck Collaboration et al., 2016).
| Object | R.A. | Decl. | Morphology | |||||
|---|---|---|---|---|---|---|---|---|
| (J2000.0) | (J2000.0) | () | (erg s-1) | () | ||||
| (1) | (2) | (3) | (4) | (5) | (6) | (7) | (8) | (9) |
| PG 1049005 | 10:51:51.45 | 00:51:17.7 | 0.357 | Merger | 11.1∗ | 45.60 | 9.34 | 0.14 |
| PG 1100772 | 11:04:13.86 | 76:58:58.2 | 0.313 | Elliptical | 11.27 | 45.55 | 9.44 | 0.10 |
| PG 1259593 | 13:01:12.96 | 59:02:06.7 | 0.472 | Elliptical | 10.99 | 45.88 | 9.09 | 0.49 |
| PG 1425267 | 14:19:03.82 | 26:32:14.5 | 0.366 | Elliptical | 11.15 | 45.73 | 9.90 | 0.05 |
| PG 1512370 | 15:14:43.07 | 36:50:50.3 | 0.371 | Elliptical | 11.01 | 45.57 | 9.53 | 0.09 |
| PG 1704608 | 17:04:41.37 | 60:44:30.5 | 0.371 | Elliptical | 11.52 | 45.67 | 9.55 | 0.10 |
| PG 2112059 | 21:14:52.58 | 06:07:42.4 | 0.466 | Elliptical | 10.8∗ | 46.16 | 9.18 | 0.76 |
| PG 2251113 | 22:54:10.42 | 11:36:38.7 | 0.323 | Elliptical | 11.05 | 45.66 | 9.15 | 0.26 |
Note— (1) Source name. (2) Right ascension. (3) Declination. (4) Redshift. (5) Morphology of the host galaxy (Zhang et al., 2016; Zhao et al., 2021) (6) Stellar mass; the uncertainty is 0.3 dex (Shangguan et al., 2018). (7) AGN monochromatic luminosity at 5100 Å. We assume a error of 0.05 dex (Vestergaard & Peterson, 2006). (8) Black hole mass, estimated by applying the calibration of Ho & Kim (2015) and taken from Shangguan et al. (2018); the uncertainty is 0.3 dex. (9) Eddington ratio, where (Richards et al., 2006) is the bolometric luminosity, and erg s-1 is the Eddington luminosity. (∗) The stellar mass values are taken from Zhao et al. (2021), but carry large uncertainty (dex).
| Object | Observation | Bandpass & | Amplitude & | PWV | Observing | Beam Size | Beam Position | Half-power | Maximum Recoverable |
|---|---|---|---|---|---|---|---|---|---|
| Date | Flux Calibrator | Phase Calibrator | (mm) | Time∗ (h) | () | Angle (∘) | Beamwidth () | Scale∗∗ () | |
| (1) | (2) | (3) | (4) | (5) | (6) | (7) | (8) | (9) | (10) |
| PG 1049005 | 10 Apr. 2022 | 3C84 | 1044+018 / J10280236 | 3 | 1.5 | 11 | 29.7 | 9.9 | |
| PG 1100772 | 6/14 Apr. 2022 | 3C345 | 1039+811 / 1044+719 | 4 | 4.1 | 40 | 28.7 | 12.1 | |
| PG 1259593 | 13 Apr. 2022 | 3C279 | 1300+580 / J1259+516 | 5–6 | 2.6 | 127 | 32.2 | 12.8 | |
| PG 1425267 | 6 Apr. 2022 | 3C273 | 1417+273 / J1422+323 | 4 | 1.1 | 110 | 29.9 | 14.5 | |
| PG 1512370 | 10 Apr. 2022 | 3C279 | 3C345 / 1504+377 / 1505+428 | 2 | 2.6 | 71 | 30.0 | 11.3 | |
| PG 1704608 | 14/15 Apr. 2022 | 0851+202 / 2013+370 | 1637+574 / 1645+635 | 3–6 | 2.2 | 98 | 30.0 | 11.7 | |
| PG 2112059 | 6 Apr. 2022 | 3C345 | 2059+034 / 2121+053 | 4 | 1.5 | 18 | 32.0 | 13.8 | |
| PG 2251113 | 17/18 Apr. 2022 | 2013+270 / 2230+114 | 3C454.3 / 2230+114 | 1–3 | 6.4 | 12 | 29. 5 | 14.5 |
Note— (*) Including overheads.
2 Sample and Observations
We focus on observing 8 PG quasars taken from the broader sample of 87 quasars belonging to the PG survey (Boroson & Green, 1992). The PG quasars were selected by their optical/ultraviolet colors, and correspond to luminous, broad-lined (type 1) AGNs. Multi-wavelength data are available across the entire electromagnetic spectrum range, from X-ray (Reeves & Turner, 2000; Bianchi et al., 2009) through optical (Boroson & Green, 1992; Ho & Kim, 2009), mid-IR (Shi et al., 2014; Xie et al., 2021; Xie & Ho, 2022), far-IR (Petric et al., 2015; Shangguan et al., 2018; Zhuang et al., 2018), mm (Shangguan et al., 2020a, b), and radio (Kellermann et al., 1989, 1994; Silpa et al., 2020) wavelengths, allowing detailed SED characterization and accurate estimation of the global SFR and gas content of the host galaxies (Shangguan et al., 2018). A major fraction of the sample has been already observed in the optical and near-IR by the Hubble Space Telescope (HST) at resolution (Kim et al., 2008; Zhang et al., 2016; Kim & Ho, 2019; Zhao et al., 2021), while arcsecond resolution interferometric and integral field unit data are accessible for a few of these (Molina et al., 2021, 2022a).
Shangguan et al. (2020a) presented CO(2–1) observations for a representative sample of 40 PG quasars, 23 newly observed host galaxies using ACA (synthesized beam FWHM ). They reported line emission detection in 34 host galaxies, 21 sources detected from their ACA campaign. For the ACA data, Shangguan et al. (2020a) computed the global CO velocity integrated fluxes by spatially collapsing the spectra over the contour region of the imaged data, to then fit the emission line using a single Gaussian or double-horn profile functions.
We selected the 8 PG quasar host galaxies to complement and expand the sample already observed in CO(2–1) emission, specially at high AGN luminosity ( erg s-1) where Shangguan et al. (2020a) only reported CO(2–1) measurements for 3 host galaxies (Figure 1). Our selection was based on requiring: (1) PG quasars with AGN monochromatic luminosities at 5100 Å () higher than erg s-1; and (2) targets with robust AGN/host galaxy far-IR SED decomposition performed by Shangguan et al. (2018). The first criterion implies that we build a combined sample of PG quasars spanning orders of magnitude in terms of and BH masses (Figure 1). The second criterion ensures that the host galaxies have accurate estimates for the dust 8 to 1000m far-IR luminosity, so that their SFR could be reliably computed. We show the properties of our targets in Table 2.
The CO(2–1) emission line was observed with NOEMA on 6–18 April, 2022, as part of the program W21CI (PI: J. Molina). The observations were carried out using 10 or 11 antennas in compact array (D) configuration, dual polarization, and for total sample observing time of 22 h. We used the autocorrelator PolyFix, which covers a total bandwidth of 15.5 GHz in each linear polarization, and split between the lower sideband (LSB) and the upper sideband (USB). The channel width is 2 MHz, namely 3.4 km s-1 at the tuning frequency (set in the USB) of our observations. The synthesized beam FWHM size is , corresponding to scales between 5 and 21 kpc at the redshift of our sources. The observational setup for each source is detailed in Table 2.
2.1 Data Reduction
We reduced the data following the standard procedure using the GILDAS software (Guilloteau & Lucas, 2000). The data were calibrated using the Institute for Radio Astronomy in the Millimeter Range (IRAM) package Continuum and Line Interferometer Calibration (CLIC). The standard pipeline reduction and calibration was implemented to a large extent, but some minor fraction of data scans were flagged following the astronomer on duty report.111https://www.iram.fr/IRAMFR/GILDAS/doc/pdf/pdbi-cookbook.pdf We imaged the data using the MAPPING software of GILDAS. We used the uv_cont task to combine all the line-free channels in both sidebands (we also avoided the noisy channels), and then we merged those using uv_merge to produce the continuum table for each source. To produce the emission line table we subtracted the continuum using uv_base from the calibrated tables in the USB. Then, we used the task uv_compress to set the data spectral resolution. For PG 1049005 and PG 1259593 we set the channel width km s-1 as both were detected in CO emission at high signal-to-noise. For the rest of the sample we set a channel width km s-1 after exploring different spectral setup aiming to maximize CO line detection.222The target PG 2251+113 was found offset by and in right ascension and declination, respectively, from the expected location. We corrected the observation pointing by this offset using uv_shift before proceeding with the continuum and emission line tables construction. For both, the continuum and the emission line tables, we produced the dirty images using the task uvmap and estimated the data rms level (Table 3). Those values broadly correspond to our observation sensitivity requirements. The image pixel size is set to following uvmap task recommendation. We used the CLEAN algorithm in the version of Högbom (1974) to do the data deconvolution. We use natural weighting to maximize the observation sensitivity. We set CLEAN down to the data rms level by doing many iterations as needed. After doing the cleaning, we visually checked the residual maps, finding no emission higher than the noise level in any target. The data are corrected for primary beam. Finally, the imaged data was converted to the usual FITS format using the task vectorfits. We consider a conservative systematic NOEMA flux calibration uncertainty of 20 % at 2 mm.1
2.2 IR Spectral Energy Distribution
To estimate the IR luminosity decontaminated from AGN effects for our targets, we benefit from the panchromatic IR SED from to 500 m, complemented by mid-IR (m) spectra from the Spitzer Infrared Spectrometer (IRS), and available radio data collated in Shangguan et al. (2018). Briefly, in the near-IR the fluxes were re-derived by Shangguan et al. (2018) from the 2MASS (Skrutskie et al., 2006) , and bands (Cohen et al., 2003) images using aperture radius with the sky annulus set to a radius of 25 to . Shangguan et al. (2018) also re-estimated the mid-IR WISE (Wright et al., 2010; Jarrett et al., 2011) (m) and (m) fluxes for the PG quasars, but avoided to include the (m) and (m) data due to known systematic uncertainties associated to the red color of the targets, plus the bands wavelength overlap with the bandpass of the Spitzer IRS spectra. The WISE and fluxes were computed using a similar method to that used for the 2MASS images. An aperture radius of , plus a sky annulus of were adopted. Coadded PSFs for the WISE bands were used to compute the aperture correction factors. The Herschel Photodetector Array Camera and Spectrometer (PACS, Poglitsch et al. 2010) and Spectral and Photometric Imaging Receiver (SPIRE; Griffin et al. 2010) observations were formally presented in Shangguan et al. (2018) for the PG quasars. For the PACS data, point-source aperture photometry were performed using 12, 12, and aperture radius for the 70, 100, and m bands. Sky annulus radius were set to to minimize PSF wing contamination, and aperture corrections were also applied. From the SPIRE data, the sources flux density values or upper limits were computed following Savage & Oliver (2007). The Spitzer data were processed by Shi et al. (2014), who scaled the short-low (m) spectrum, the long-low (m) spectrum, and the overall flux of the spectrum to match the Spitzer MIPS m photometry. Shangguan et al. (2018) also found that the density flux scale of the Spitzer spectra were well-matched with respect to the WISE data. The radio data were updated from that presented in Shangguan et al. (2018) considering newer literature data. We present the radio data in Appendix A.
2.3 Complementary AGN Sample
We complement our PG quasar CO survey with literature data taken from two main surveys, the BAT-AGN Spectroscopic Survey (BASS) sample presented in Koss et al. (2022) and the Close AGN Reference Survey (CARS; Husemann et al. 2022). In their data-release 2, the BASS AGNs consist of 858 nearby () AGNs selected by their ultrahard (14–195 keV) X-ray emission. We select a sub-sample of BASS AGNs presenting H and H broad-lines,333Mejía-Restrepo et al. (2022) refer to those systems as Seyfert 1, 1.2, 1.5, and 1.8, based on the ratio between the broad H and [O iii] line luminosity. Here, we only refer to those BASS AGNs as “Sy1–1.8”. but we discard all the BASS AGNs with poor optical spectra models following Mejía-Restrepo et al. (2022). From this sub-sample, we further select the host galaxies with CO(2–1) line emission detection or upper limit. Those BASS AGN host galaxies were observed with the Atacama Pathfinder Experiment telescope (APEX; 46 sources), the James Clerk Maxwell Telescope (JCMT; 7 sources) and the Caltech Submillimeter Observatory (CSO; 3 sources). At the observed frequencies (GHz), the APEX, JCMT, and CSO observations have effective primary beam size of , , and , respectively, corresponding to scales of kpc at the sources redshift (Koss et al., 2021). Specifically, we adopt the CO velocity integrated fluxes computed by fitting the line profiles with a single Gaussian or double-horn functions. We note that Koss et al. (2021) show that those values are in good agreement with estimates computed by simply summing the CO emission over the line spectral range (see their Appendix D). The BASS AGN measurement uncertainties are 10 % and 15 % for flux calibration and aperture correction, respectively. We take the BASS AGN host galaxy properties from Koss et al. (2021). For the CARS survey, we take the AGN and host galaxy properties from Husemann et al. (2022) and Smirnova-Pinchukova et al. (2022), respectively. We note that the CO(2–1) line flux measurements were carried out using the IRAM 30–m telescope (Bertram et al., 2007). The IRAM 30–m telescope primary beam size is at the observed frequencies (GHz), and correspond to a physical scale kpc. Bertram et al. (2007) estimate the CO line velocity integrated fluxes by simply summing the flux density over the full velocity range of the emission line. The IRAM 30–m telescope flux calibration uncertainty is %.
In consistency with the estimates presented for the PG quasars (Table 1), for both BASS and CARS AGN surveys we use the AGN monochromatic luminosity at 5100 Å and broad H line width values to estimate and following Richards et al. (2006) and Shangguan et al. (2018), respectively. The host galaxy CO luminosity and SFR values are estimated by using the conventions adopted in this work, and the stellar masses are scaled assuming the Kroupa (2001) initial mass function (IMF; see Section 3). The BH masses estimated by us and the values reported by Mejía-Restrepo et al. (2022) for the BASS AGNs are in good agreement with an average BH mass ratio of and 0.25 dex scatter. For the CARS sample there are several systems with fewer than two SED data points at m, implying inaccurate far-IR emission luminosity estimates. Those correspond to 19 out of 38 host galaxies that were excluded whenever was involved in our analysis. On average, the discarded systems have slightly lower stellar mass ( dex) and CO(2–1) luminosity ( dex) compared to the full CARS sample, but present no systematic offset in terms of average molecular gas fraction, bolometric luminosity, BH mass, and Eddington ratio estimates (offset dex in terms of absolute value). However, we caution that by discarding those CARS host galaxies we may result with a sub-sample biased toward the most IR luminous systems. The excluded CARS AGNs tend to be found at slightly higher redshifts () compared to the sample average (). We further exclude few duplicated objects among the BASS, CARS and PG quasar surveys.
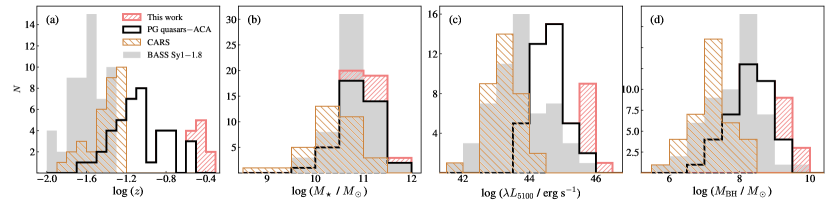
Figure 2 presents the properties of our sample, the PG quasars with previous CO line measurements (Shangguan et al., 2020b), the sub-sample of broad-lined BASS AGNs, and the CARS targets. The BASS sub-sample correspond 56 host galaxies (21 upper-limit estimates) . The CARS sub-sample consists of 34 systems (9 upper-limit estimates). The PG quasars and BASS AGNs cover similar host galaxy stellar mass range, while the CARS host galaxies tend to be less massive. Compared to those three AGN samples, our targets tend to be slightly biased toward the more massive systems in terms of stellar mass, expected as we selected the local quasars with the most massive BHs, hence the host galaxies presenting the most massive bulges. The sample of 8 PG quasars presented here probes the high BH mass and AGN luminosity tail of the AGN population.
| Object | FWHM | ||||||||
| (mJy) | (mJy beam-1) | (Jy km s-1) | GHz | km s-1 | (mJy) | (erg s-1) | (K km s-1 pc2) | ||
| (1) | (2) | (3) | (4) | (5) | (6) | (7) | (8) | (9) | (10) |
| PG 1049005 | 0.04 | 170.300 | 0.52 | 45.4 | 9.640.09 | 10.13 | |||
| PG 1100772 | 0.24 | 2.00 | 44.8 | ||||||
| PG 1259593 | 0.03 | 157.403 | 0.75 | 44.7 | 9.350.10 | 9.85 | |||
| PG 1425267 | 0.06 | 0.54 | 44.9 | ||||||
| PG 1512370 | 0.04 | 0.36 | 44.6 | ||||||
| PG 1704608 | 0.07 | 0.77 | 45.1 | ||||||
| PG 2112059 | 0.05 | 157.093 | 0.68 | 45.2 | 9.350.17 | 9.85 | |||
| PG 2251113 | 0.13 | 0.49 | 44.6 |
Note— (1) Source name. (2) Millimeter continuum flux density at restframe 230 GHz. (3) Noise level of the continuum image. (4) CO(2–1) velocity integrated intensity. (5) CO(2–1) emission line observed frequency. (6) Full width at half maximum. (7) Noise level of the cleaned data cube. (8) Total infrared luminosity of the host galaxy calculated following Shangguan et al. (2018). The typical uncertainty is dex. (9) CO(2–1) line luminosity. (10) Molecular gas mass derived from the CO luminosity, assuming K km s-1 pc. The 1 errors are dominated by the CO-to- conversion factor uncertainty (0.3 dex). We note that the error estimates of the mm continuum flux density, the CO(2–1) line velocity integrated intensity, and line luminosity consider a conservative NOEMA flux calibration uncertainty of % at 2 mm.
3 Methods
3.1 CO(2–1) Emission-line and Millimeter Continuum Characterization
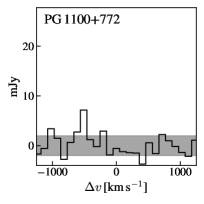
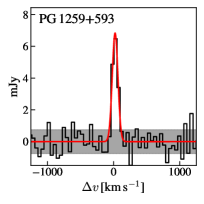
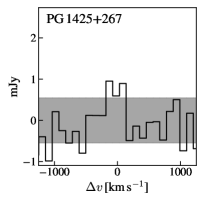
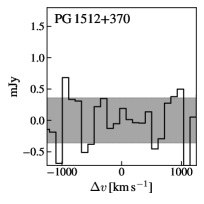
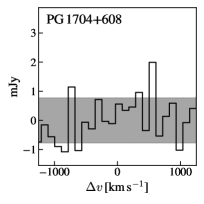
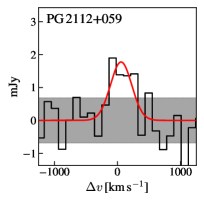
To estimate the CO(2–1) velocity integrated intensity, first, we get a spectrum by spatially collapsing the data cube within a beam-sized region centered at the expected target location (Figure 3). This aperture selection was set after exploring different values aiming to maximize the CO line S/N detection, and roughly corresponds to the host galaxy stellar component size reported by Zhao et al. (2021). Then, we fit the line emission by simply using a Gaussian function deriving the line velocity integrated intensity (), center () and FWHM. We quantify the total continuum flux density () by simply fitting a two-dimensional Gaussian model to the continuum image (Figure 4). We found a good agreement between and the continuum flux density values estimated by summing the individual pixel values within an aperture of (similar to that used for the Herschel data) centered on the continuum peak location (average ratio , scatter dex). In both cases, we estimate the uncertainties by re-sampling the data in 1000 iterations using the rms of the residuals as the noise level. The 1 errors are obtained from the distributions build for each parameter. In the case of non-detection, the CO(2–1) emission line and continuum 3 upper limits were calculated as
| (1) |
and
| (2) |
respectively, where is the RMS level of the data cube, is the velocity resolution, is the number of channels sampling the CO line FWHM (assumed to be 400 km s-1 given the stellar masses of our targets and the –FWHM trend reported by Shangguan et al. 2020b for the local PG quasars), is the aperture size in pixel units, and is the number of pixels for the synthesized beam. We assume for estimating the CO flux density upper limits (Hainline et al., 2004; Michiyama et al., 2021), while for the continuum. We list the estimates (or upper limits) for each source in Table 3.
The CO(2–1) line luminosity is calculated following (Solomon & Vanden Bout, 2005)
| (3) |
where is in units of Jy km s-1, is the luminosity distance in Mpc, is the observed frequency of the line in GHz, and is the redshift. We estimate the luminosity of the CO(1–0) line transition () by adopting the median luminosity ratio found by Shangguan et al. (2020b) for PG quasars at .444For the BASS AGNs Lamperti et al. (2020) report an average value, with a median absolute deviation of 0.17. For the CARS sample, we use the CO(1–0) and CO(2–1) velocity integrated intensity values provided by Bertram et al. (2007) for 25 sources and estimate a median value. The molecular gas masses are estimated under the assumption of (K km s-1 pc2)-1, as suggested by the comparison of and the dust-based gas masses for the PG quasars (Shangguan et al., 2020b), and in consistency with the recommendation by Sandstrom et al. (2013) for nearby star-forming galaxies.


3.2 Far-IR SED modeling and IR-based SFRs
We use our estimates to complement the far-IR SED (Section 2.2) and update the AGN-decontaminated IR luminosity values previously estimated by Shangguan et al. (2018) for our targets. Our measurements provide key information for constraining the targets far-IR SED flux density at low frequencies.
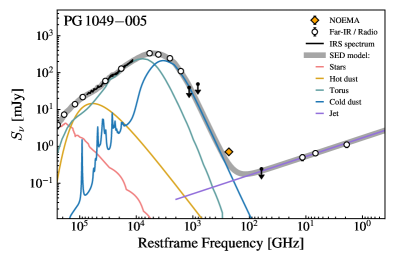
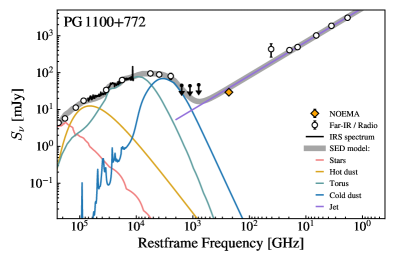
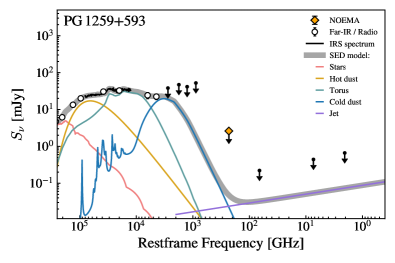
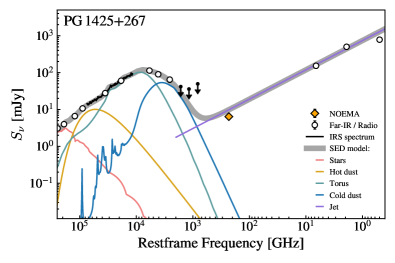
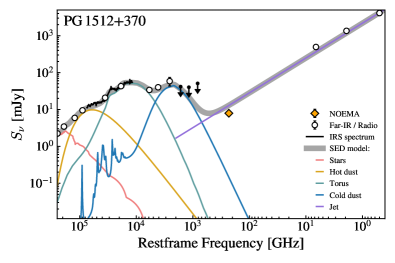
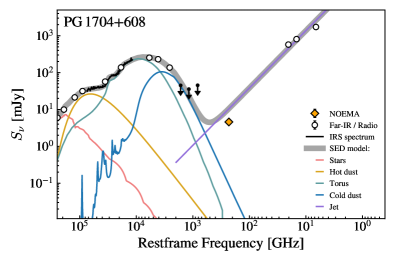
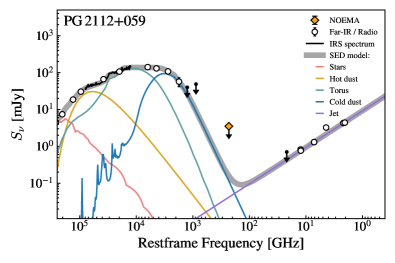
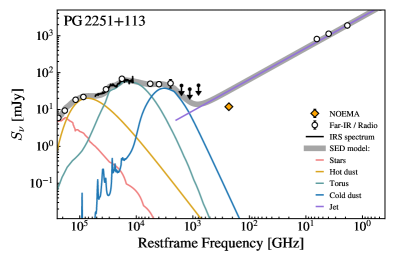
Shangguan et al. (2018) modeled the far-IR SED by adopting physically motivated emission components for the AGN dusty torus, host galaxy cold dust, and starlight. The torus emission is modeled by using the CLUMPY model (Nenkova et al., 2008a, b), plus a complementary blackbody component that accounts for emission from the torus very hot dust (Zhuang et al., 2018). The far-IR models adopt a fixed dust emissivity index () within the Draine & Li (2007) models (roughly ). The far-IR modeling also handle a synchrotron emission component, but its addition to the SED is optional to the radio data availability. The synchrotron emission is modeled as a power-law spectrum with fixed spectral index (). A 5 Gyr stellar population with a Kroupa (2001) IMF from Bruzual & Charlot (2003) is assumed for the starlight component. We refer to Shangguan et al. (2018), for more details. The SED data and models are presented in Figure 5.
We compute the IR luminosity by integrating the host galaxy far-IR SED sub-component corresponding to the cold dust emission and over m (Table 3). To estimate SFRs, we use Kennicutt (1998)’s calibration, re-normalized to a Kroupa (2001) IMF,
| (4) |
We note that the systematic uncertainties of the far-IR SED model decomposition dominate the SFR errors. Xie et al. (2021) found that the IR-based SFRs correlate with the estimates from the mid-IR neon emission lines within dex scatter for the PG quasar hosts.555While Xie et al. (2021) analyzed the full sample of PG quasars with Herschel data (Shangguan et al., 2018), the most distant host galaxy detected in mid-IR neon emission is at (PG 2251+113). Hereafter, we assume this scatter value as the 1 error of our SFR estimates.
4 Results
Our main goal is to study whether the AGN may affect the cold molecular gas content in a sample of the most powerful unobscured quasars observed at low-. From the sub-sample of 8 quasars presented in this work, we detect the CO(2–1) emission coming from 3 host galaxies (Figure 3). Those 3 systems tend to have the less massive BHs and higher Eddington ratios among the sample of 8 objects. Considering both the NOEMA and ACA campaigns, we detect line emission in 36 out of 48 host galaxies. All 17 disk-like host galaxies are detected in CO, while we detect CO emission in 7 out of 9 merger systems, and in 5 ellipticals from a total of 12 (5 non-detections from this campaign). We detect the CO emission in 7/10 host galaxies with uncertain morphology classification. Using the qualitative radio spectra classification for the PG quasars (Shangguan et al., 2018), we find that 33/38 radio-quiet systems are detected in CO, 3 out of 4 PG quasars with flat radio spectra present line detection, and no CO emission was detected in systems with steep radio spectra (6 in total).
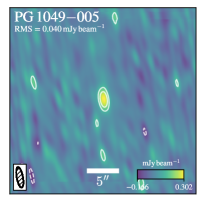
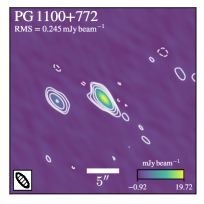
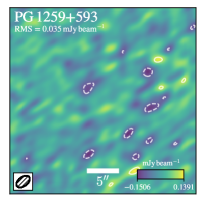
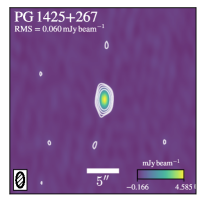
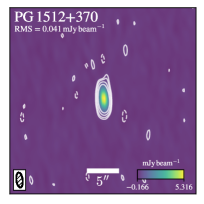
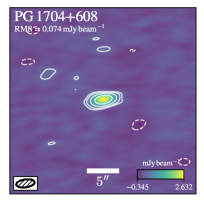
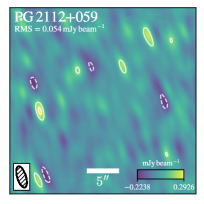
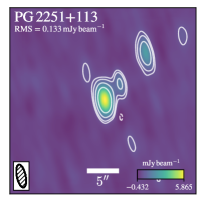
Thanks to the large frequency coverage of NOEMA, we detect the restframe mm continuum in 6 systems (Figure 4). The modeling of the global far-IR SEDs (Figure 5) suggests that the restframe mm continuum can be associated with synchrotron emission from a jet in 5 sources. We now proceed to analyze the data in detail.
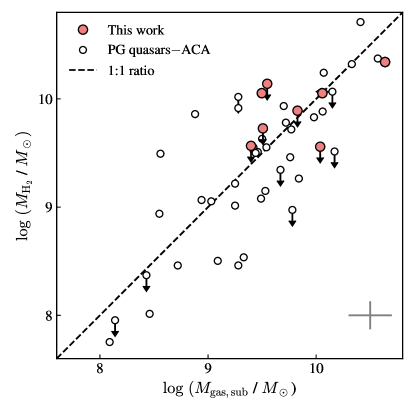
4.1 Total Gas Mass Content Estimated from Cold Dust Emission
The far-IR SED of galaxies can be used to predict the dust masses, which are closely related to their total gas content (Draine et al., 2007; Leroy et al., 2011). Shangguan et al. (2018) provided total gas mass () estimates for the PG quasar host galaxies, finding that those closely correlate with direct measurements from CO emission plus atomic gas (H i) for the closer systems. Here, we extend their analysis by comparing both the molecular gas masses estimated from the CO(2–1) emission-line luminosity and values for the PG quasar host galaxy sample. The latter quantity is computed by converting the dust masses to using the dust-to-gas ratio values derived by Shangguan et al. (2018), but avoiding the correction factor ( dex) for extended atomic hydrogen gas content (). Hence, the estimates correspond to the atomic plus molecular gas mass within roughly the same host galaxy area where the dust emission comes from (Shangguan et al., 2018). The values have a systematic uncertainty of dex, while the CO-based estimates have a typical uncertainty of dex inherent to (dex), and (dex). We remind that the uncertainty is dominated by the flux calibration uncertainties.
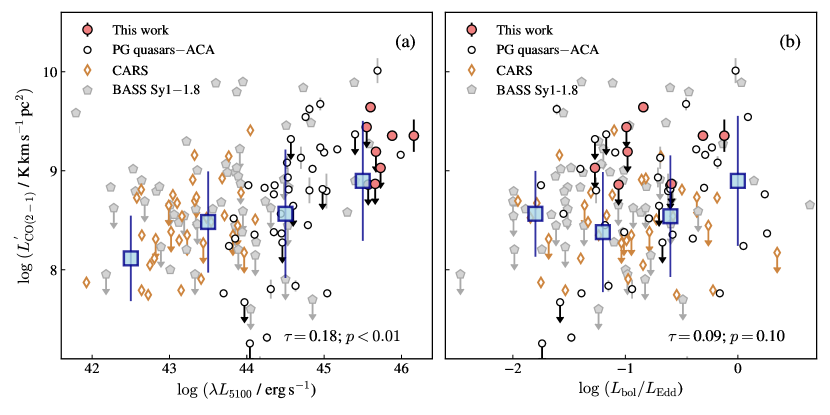
Figure 6 shows against for the full sample of PG quasars (NOEMA plus ACA campaigns). Both quantities closely match, in agreement with the previous finding of Shangguan et al. (2018, their Figure 10). We compute a mean ratio of 0.93 with scatter dex. The scatter is consistent with the mass ratio systematic uncertainty (dex), but we note that it may be larger considering the upper limits. Among the PG quasars, the disk-like host galaxies present an average and scatter slightly reduced to dex. tends to be larger than in mergers. For such systems, the data average ratio and scatter is 0.80 and dex, respectively; however, we caution the low statistics (7 host galaxies). We only detect the CO emission in 5 elliptical host galaxies, so we do not provide any statistical measurement. For the PG quasar hosts with uncertain morphological classification, we find an average mass ratio of , with scatter dex. Our sample is too small to statistically characterize the sub-sample of PG quasar host galaxies presenting a flat or steep radio spectra. The radio-quiet quasars are characterized by an average , with scatter of dex. Our observations suggest low atomic gas content inside the stellar disks of the PG quasar host galaxies, but this result sensibly depends on the correction factor applied to the dust-to-gas ratio, namely the extended H i mass value subtracted to . Only 13 PG quasars hosts have H i global measurements from literature, most of these host galaxies are ongoing mergers where the emission line exhibit complex profiles and suggest dynamical disturbance, or have neighboring companions (e.g., PG 0007+106 and PG 1119+120) inducing signal confusion (Shangguan et al., 2018). Detailed observations resolving the H i content in PG quasars hosts are needed to draw deeper conclusions.
4.2 AGN Properties Compared to
We compare the CO(2–1) luminosity with respect to and the Eddington ratio in Figure 7 for the PG, BASS, and CARS type 1 AGNs. We use pymccorrelation (Privon et al., 2020) to compute the generalized Kendall’s rank correlation coefficient () considering the censored data (Isobe et al., 1986). We assume to determine if the quantities are correlated. We find that the CO luminosity does not correlate with the Eddington ratio with and a -value of . This is consistent with the results from the previous ACA campaign targeting the PG quasar hosts (Shangguan et al., 2020a), but inconsistent with the findings of Koss et al. (2021), who found a tentative increase of molecular gas mass (hence, ) with Eddington ratio for the full BASS AGN sample (their Figure 15). Nevertheless, Koss et al. (2021) analyzed type 1 and type 2 AGNs, while we only analyze type 1 AGNs. We find that and are weakly correlated (, ). This result agrees with that reported by Shangguan et al. (2020a), but the correlation coefficient is times lower due to the inclusion of the less luminous BASS and CARS AGNs.
We also provide median trends by computing median values over bins of 1.0 dex in and 0.6 dex in using the Kaplan-Meier estimator implemented in the Python package lifelines,666https://lifelines.readthedocs.io/en/latest/index.html# including CO(2–1) upper limits. The median trend between and is nearly constant, as expected because both quantities are not correlated. In terms of and , the median trend suggests an dex increase of for AGNs with erg s-1. Such an increase of with is not artificially produced by host galaxy mass selection bias as most of these AGNs tend to be hosted in galaxies with . We note that, the AGNs with erg s-1 tend to be observed in the nearby Universe (), while the more luminous quasars with erg s-1 tend to be found at higher redshifts () where galaxies have molecular gas fractions () about twice higher than the local ones (Tacconi et al., 2018),meaning that the possible increase of with could be due to the cosmic evolution of the molecular gas content in galaxies.777There is no significant bias with host galaxy redshift when considering the Eddington ratio estimates. To test this possibility, we correct the host galaxy CO(2–1) luminosity by adopting the parametrization of Tacconi et al. (2018) for the cosmic evolution of for main-sequence galaxies and a constant value. In this case, we find no correlation between the corrected and (, ).
4.3 The relation
In Figure 8 we show the relation between and for the AGNs in our sample. We find that the more powerful quasars observed in this work ( erg s-1) follow the best-fit relation of Shangguan et al. (2020a, their Equation 4, after correcting by ). The five systems with upper limits provided by NOEMA tend to be on or above the best-fit relation of Shangguan et al. (2020a), suggesting even lower values. However, we caution that due to the presence of strong synchrotron emission and Herschel photometry upper limits, their estimates are somewhat more uncertain than for the rest of our targets.
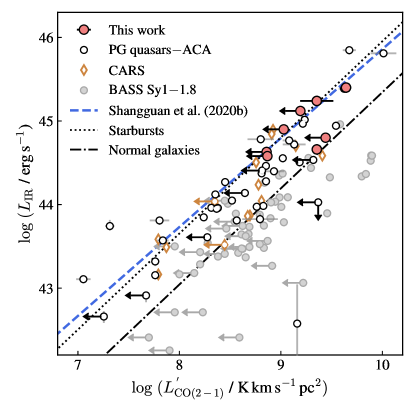
Surprisingly, we find that the BASS sample of type 1 AGNs is in offset with respect to the best-fit provided by Shangguan et al. (2020a) for the PG quasars. We quantify this offset dex in terms of . We report a similar result when including the BASS type 2 AGN data (not shown). The CARS host galaxies follow a trend similar to that reported for the PG quasars, but this result could be the affected by IR luminosity bias induced when discarding the systems with poorly sampled far-IR SED. The redshift difference between the BASS AGN and PG quasar samples is not high enough to explain this offset. Among the PG quasar sample, 13 out of 48 host galaxies are at , similarly as the BASS AGN systems, while 27 PG quasar host galaxies are at , making these practically immune to any cosmic evolutionary effect. We also note that the offset for the BASS type 1 AGNs cannot be explained by incorrect aperture correction when deriving the CO(2–1) luminosity (Koss et al., 2021). The NOEMA- and ACA-based CO(2–1) emission-line measurements for the PG quasars do not suffer from any systematics in aperture (Shangguan et al., 2020a). Nor does the offset arise from the use of different far-IR SED models when estimating . The PG quasar far-IR modeling is detailed in Section 3.2, and here we only highlight that this method is consistent with fitting a modified black-body (MBB) to the far-IR SED (see Appendix of Shangguan et al. 2018). For the BASS sample, the far-IR luminosity was computed mainly by Shimizu et al. (2017), with some few systems taken from Ichikawa et al. (2019). Both methods are consistent between each other (see Appendix of Shimizu et al. 2017). We fitted the far-IR SED of our targets following the method outlined in Shimizu et al. (2017), namely by considering a MBB plus an additional sub-component modeling the emission from the warm dust heated by the AGN and intense star formation activity. We found no significant discrepancy between the values provided by those fits and the estimates reported in Table 3, notwithstanding a scatter of dex. For the CARS sample, we obtain similar results when comparing the IR luminosity reported by Smirnova-Pinchukova et al. (2022) and the result of our MBB fits. Therefore, we find that the BASS AGNs tend to be offset with respect to the PG sample in the plane.
Compared to the non-active systems, represented by the fits for normal star-forming galaxies and starbursts (Genzel et al., 2010), the less-luminous PG quasars follow the relation of starbursts (Shangguan et al., 2020a, b). The same picture holds for the most luminous PG quasars at . The sub-sample of BASS type 1 AGNs follows the relation of normal star-forming galaxies.
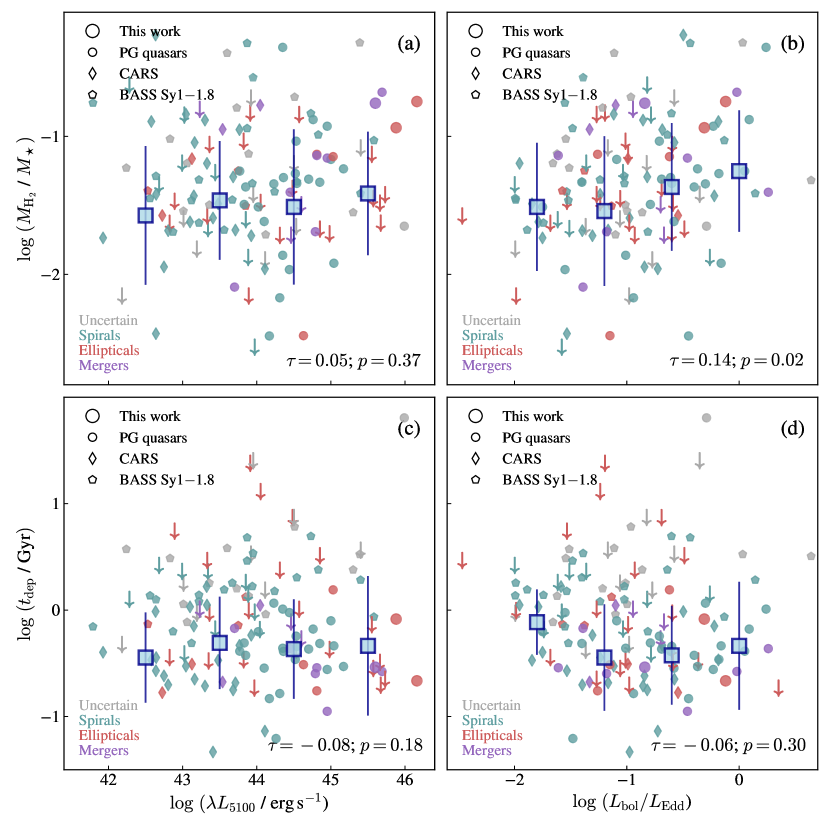
4.4 Molecular Gas Fraction and Depletion time
Figure 9 shows the molecular gas fraction as a function of and Eddington ratio. We find no significant correlation between and (, -value = 0.37). This result does not change after taking into account the host galaxy redshift bias with (, -value = 0.21). The constant – median trend further highlights this. On the other hand, we find a weak correlation between with Eddington ratio (, -value = 0.02), but the corresponding –Eddington ratio median trend does not suggest any significant correlated increase.
Figure 9 also presents the depletion time (SFR) as a function of and Eddington ratio. We find no correlations with (, -value = 0.18) or Eddington ratio (, -value = 0.30). Considering the depletion time cosmic evolution (Tacconi et al., 2018) has a negligible effect on the correlation coefficient values. If anything, the median trend suggests a somewhat minor decrease from 1.0 Gyr to 0.4 Gyr at , but note that the median trend may only reflect the Eddington ratio range at which the CARS and PG quasar sample dominate the median bin statistics.
5 Discussion
The properties of the molecular gas in AGN host galaxies provide important clues regarding the role of BH accretion in shaping the evolution of galaxies. Early studies already suggested that the local luminous quasars are hosted in galaxies with significant gas reservoirs (Scoville et al., 2003; Evans et al., 2006; Bertram et al., 2007). These findings were subsequently supported by the many new observations detecting CO emission for broader samples of local type 1 and type 2 AGNs (Husemann et al., 2017; Rosario et al., 2018; Shangguan et al., 2020b; Koss et al., 2021; Ramos Almeida et al., 2022; Salvestrini et al., 2022). The large amounts of cold gas content detected in type 1 AGN hosts are at odds with the idea of negative AGN feedback affecting the host galaxies globally (e.g., Husemann et al. 2017; Jarvis et al. 2020; Shangguan et al. 2020a, but see Ellison et al. 2021; Ward et al. 2022), with conflicting results regarding how the AGN properties correlate with the molecular gas properties in the AGN host galaxies. Koss et al. (2021) reported that the BASS AGNs with higher Eddington ratio tend to have on average larger molecular gas reservoir, which disagrees with the findings of Shangguan et al. (2020a) who report that the CO luminosity does not correlate with Eddington ratio for the local PG quasars (see also Husemann et al. 2017). This disagreement seems to arise because both samples are complementary in terms of AGN luminosity, with the PG quasars representative of more luminous AGNs (Figure 2). It should be noted that Shimizu et al. (2016) already suggested that the BASS AGN sample may not extend to high enough AGN luminosity to reveal correlations with the host galaxy properties. Conversely, artificial correlations between host galaxy and AGN properties could also arise because of sample selection bias, with targets covering a narrow range in terms of AGN properties (Zhuang & Ho, 2020). When combining the BASS type 1 AGNs, CARS, and the PG quasar samples, including our observations, we further confirm the lack of correlation between CO luminosity (i.e., molecular gas mass) with Eddington ratio, in agreement with Husemann et al. (2017) and Shangguan et al. (2020a). On the other hand, we find a weaker correlation between CO emission and AGN luminosity than that reported by Shangguan et al. (2020a), mainly because the inclusion of the less luminous BASS and CARS AGN data to the analysis. This correlation is mainly driven by the more luminous AGNs (erg s-1) observed at higher redshift, and it vanishes when correcting the CO luminosity by the cosmic evolution of the molecular gas content in galaxies. The observed trends suggest the lack of negative AGN feedback effects on the molecular gas content of the host galaxies.
Even though we report a lack of correlation between and for the full sample of type 1 AGNs (after correcting by redshift), we note that there is still a stronger link remaining for the PG quasar sample alone (Shangguan et al., 2020a). Such trend is reminiscent of that found between AGN luminosity and SFR for local AGNs, where the processes that drive and regulate most of the star formation in low-luminosity AGN hosts presumably do not strongly affect the BH fueling, while in high luminosity AGNs it may be the opposite (Rosario et al., 2012). If there is any correspondence between the global SFR and BH accretion events in high luminosity AGNs, it should occur over timescales short compared to the AGN duty cycle ( Myr; Hopkins et al. 2005), requiring that most of the star formation activity being triggered on the central region of the host galaxies. Under this scenario, the trends reported for the full sample of type 1 AGNs and PG quasar sample alone may reflect how differently the gas is distributed within the PG quasar hosts compared with the BASS AGN host galaxies, in addition to a closer connection between the AGN properties and the molecular gas content on the central scales of the quasar hosts. Note that the more gas-rich PG quasars have compact molecular gas distributions (Molina et al., 2021). In AGN hosts, the cold dust emission mainly arises from compact nuclear scales (Mushotzky et al., 2014; Lutz et al., 2018; Molina et al., 2023). Additionally, our measurements for the BASS AGNs and PG quasars presume a difference in the gas distribution between both type 1 AGN samples. Similarly to Bertram et al. (2007), we find that type 1 AGNs can be roughly separated into two populations in terms of (proxy of the star formation efficiency or ), with one population, most of the BASS AGNs, following the typical ratio found in normal star-forming galaxies, and a second population, the PG quasars, and some CARS AGNs, presenting values comparable to those measured for luminous infrared galaxies (Figure 8). It is well known that luminous infrared galaxies have molecular gas distributions mainly concentrated in their central kpc and sub-kpc regions (e.g., Downes & Solomon 1998; Iono et al. 2009; Bellocchi et al. 2022), while normal star-forming galaxies have more extended gas distributions (e.g., Bolatto et al. 2017). Accounting for the difference in gas distribution for both type 1 AGN samples would imply adopting different and CO-to-H2 conversion factor values when estimating the host galaxy molecular gas masses, further decreasing the values for the PG quasars, and amplifying both AGN sample differences in terms of or star formation efficiency.
Recent findings suggest the more luminous and more efficiently growing BHs tend to be hosted in starbursts (Bernhard et al., 2016; Shangguan et al., 2020a; Xie et al., 2021). The position of an AGN host relative to the main-sequence of star-forming galaxies seems to be correlated with Eddington ratio (e.g., Shimizu et al. 2016; Ellison et al. 2016; Woo et al. 2020; Zhuang & Ho 2020; Torbaniuk et al. 2021; Zhuang & Ho 2022). How does BH accretion connect to the galaxy’s star formation activity on much larger scales? A straightforward possibility is the common dependence of BH growth and star formation on the molecular gas supply (Jarvis et al., 2020; Shangguan et al., 2020b), replenished by the gravitational instabilities that drive the gas inward (Kormendy & Kennicutt, 2004; Romeo & Fathi, 2016). Another possibility could be triggering of star formation due to positive AGN feedback, with in-situ star formation in AGN-driven outflows (Maiolino et al., 2017; Gallagher et al., 2019), and more luminous AGNs producing more frequent and stronger outflows (Fiore et al. 2017; Rakshit & Woo 2018; Fluetsch et al. 2019; but see Baron & Netzer 2019; Davies et al. 2020; Shangguan et al. 2020a; Molina et al. 2022a; Ramos Almeida et al. 2022). The role of gas-rich major mergers cannot be overlooked, as they offer a natural explanation for the triggering of an AGN (e.g., Hopkins et al. 2008), specially for more luminous active galaxies (Treister et al., 2012). However, not all the galaxies hosting a luminous AGN present evidence of merger activity (e.g., Koss et al. 2011; Kim et al. 2017; Zhao et al. 2019, 2021). The relative fraction of early-type and late-type low- quasar hosts depends only on stellar mass, and not on bolometric luminosity or Eddington ratio (Zhuang & Ho, 2022). We highlight this in Figure 9 where, apart from the mergers likely presenting shorter depletion times, we find no trend between and the AGN properties with galaxy morphology. The only clue that remains is the weak correlation between the Eddington ratio and the host galaxy molecular gas fraction, possibly implying an underlying role of gravitational instabilities or the fast inflow of cold gas in producing nuclear starbursts and the fueling of the BHs.
6 Conclusions
We present new NOEMA observations of the CO(2–1) line for the most luminous eight Palomar-Green quasar host galaxies at . We detect CO(2–1) emission in three objects, doubling the number of most luminous PG quasar host galaxy with line emission detection. Combined with already published observations for active galaxies, we assemble CO measurements for a broad sample of type 1 AGNs covering decades in AGN luminosity. This sample is used to investigate the relations between AGN properties, molecular gas properties, and star formation efficiency of the host galaxies. The systems with non-detected CO emission are treated as censored data. We summarize our conclusions as follows:
-
•
The luminous AGNs ( erg s-1) observed by NOEMA possesses CO emission consistent with the expectations from the far-IR emission. Overall, the total gas mass predicted from the cold dust emission, and after subtracting the extended atomic gas content, is well-matched with the molecular gas mass within an accuracy of dex, with some small variation depending on the host galaxy morphological type.
-
•
The PG quasar and CARS AGN host galaxies follow a tight, linear correlation consistent with that found for starbursts galaxies (Shangguan et al., 2020b). The BASS AGNs follow a similar correlation, but they show a zero-point offset placing them on the relation for normal star-forming galaxies.
-
•
We find a weak correlation between CO(2–1) line luminosity and AGN luminosity, as well as between molecular gas fraction and Eddington ratio. The former correlation vanishes when considering the cosmic evolution of the gas content in galaxies and that the more luminous AGN hosts are found at higher redshifts, meaning that the AGN luminosity is not correlated with host galaxy global molecular gas content. The second correlation points to the role of host galaxy gravitational instabilities or the fast inflow of cold gas in triggering AGN activity. Both findings suggest an ineffective role of negative AGN feedback.
Appendix A Radio Continuum Measurements
Radio continuum measurements collated from the literature for the eight sources presented in this work.
| Object | Frequency | Reference | |
|---|---|---|---|
| (GHz) | (mJy) | ||
| (1) | (2) | (3) | (4) |
| PG 1049005 | 1.4 | Becker et al. (1995) | |
| 5.0 | Kellermann et al. (1989) | ||
| 8.5 | Baldi et al. (2022) | ||
| 45 | Baldi et al. (2022) | ||
| PG 1100+772 | 1.4 | Condon et al. (1998) | |
| 2.7 | Laing & Peacock (1980) | ||
| 5.0 | Laing & Peacock (1980) | ||
| 10.7 | Laing & Peacock (1980) | ||
| 14.9 | Laing & Peacock (1980) | ||
| 31.4 | Geldzahler & Kuhr (1983) | ||
| PG 1259+593 | 1.4 | Condon et al. (1998) | |
| 5.0 | Baldi et al. (2022) | ||
| 45 | Baldi et al. (2022) | ||
| PG 1425+267 | 0.074 | Cohen et al. (2007) | |
| 0.151 | Waldram et al. (1996) | ||
| 0.365 | Douglas et al. (1996) | ||
| 1.4 | Condon et al. (1998) | ||
| 4.85 | Gregory & Condon (1991) | ||
| PG 1512+370 | 0.074 | Cohen et al. (2007) | |
| 0.365 | Douglas et al. (1996) | ||
| 1.4 | Condon et al. (1998) | ||
| 4.85 | Gregory & Condon (1991) | ||
| PG 1704+608 | 1.49 | Kuehr et al. (1981) | |
| 4.85 | Gregory & Condon (1991) | ||
| 10.7 | Kuehr et al. (1981) | ||
| PG 2112+059 | 1.4 | Condon et al. (1998) | |
| 1.49 | Barvainis et al. (1996) | ||
| 4.89 | Barvainis et al. (1996) | ||
| 4.9 | Kellermann et al. (1989) | ||
| 8.4 | Barvainis et al. (2005) | ||
| 8.48 | Barvainis et al. (1996) | ||
| 14.9 | Barvainis et al. (1996) | ||
| PG 2251+113 | 0.074 | Cohen et al. (2007) | |
| 0.365 | Douglas et al. (1996) | ||
| 1.4 | Condon et al. (1998) | ||
| 2.7 | Wright & Otrupcek (1990) | ||
| 4.85 | Gregory & Condon (1991) |
Note— (1) Source name. (2) Restframe frequency. (3) Flux density. (4) Reference. If available, we provide a flux density upper limit. (∗) Upper limit values were calculated by using the observation rms as input to Equation 2 and assuming an aperture size equal to 3 times the observation synthesized beam size ().
References
- Astropy Collaboration et al. (2013) Astropy Collaboration, Robitaille, T. P., Tollerud, E. J., et al. 2013, A&A, 558, A33
- Baldi et al. (2022) Baldi, R. D., Laor, A., Behar, E., et al. 2022, MNRAS, 510, 1043
- Baron & Netzer (2019) Baron, D., & Netzer, H. 2019, MNRAS, 482, 3915
- Barvainis et al. (2005) Barvainis, R., Lehár, J., Birkinshaw, M., Falcke, H., & Blundell, K. M. 2005, ApJ, 618, 108
- Barvainis et al. (1996) Barvainis, R., Lonsdale, C., & Antonucci, R. 1996, AJ, 111, 1431
- Becker et al. (1995) Becker, R. H., White, R. L., & Helfand, D. J. 1995, ApJ, 450, 559
- Bellocchi et al. (2022) Bellocchi, E., Pereira-Santaella, M., Colina, L., et al. 2022, A&A, 664, A60
- Bernhard et al. (2019) Bernhard, E., Grimmett, L. P., Mullaney, J. R., et al. 2019, MNRAS, 483, L52
- Bernhard et al. (2016) Bernhard, E., Mullaney, J. R., Daddi, E., Ciesla, L., & Schreiber, C. 2016, MNRAS, 460, 902
- Bertram et al. (2007) Bertram, T., Eckart, A., Fischer, S., et al. 2007, A&A, 470, 571
- Bianchi et al. (2009) Bianchi, S., Guainazzi, M., Matt, G., Fonseca Bonilla, N., & Ponti, G. 2009, A&A, 495, 421
- Bischetti et al. (2021) Bischetti, M., Feruglio, C., Piconcelli, E., et al. 2021, A&A, 645, A33
- Bolatto et al. (2017) Bolatto, A. D., Wong, T., Utomo, D., et al. 2017, ApJ, 846, 159
- Boroson & Green (1992) Boroson, T. A., & Green, R. F. 1992, ApJS, 80, 109
- Bower et al. (2006) Bower, R. G., Benson, A. J., Malbon, R., et al. 2006, MNRAS, 370, 645
- Bruzual & Charlot (2003) Bruzual, G., & Charlot, S. 2003, MNRAS, 344, 1000
- Cicone et al. (2018) Cicone, C., Brusa, M., Ramos Almeida, C., et al. 2018, Nature Astronomy, 2, 176
- Cicone et al. (2014) Cicone, C., Maiolino, R., Sturm, E., et al. 2014, A&A, 562, A21
- Circosta et al. (2021) Circosta, C., Mainieri, V., Lamperti, I., et al. 2021, A&A, 646, A96
- Cohen et al. (2007) Cohen, A. S., Lane, W. M., Cotton, W. D., et al. 2007, AJ, 134, 1245
- Cohen et al. (2003) Cohen, M., Wheaton, W. A., & Megeath, S. T. 2003, AJ, 126, 1090
- Condon et al. (1998) Condon, J. J., Cotton, W. D., Greisen, E. W., et al. 1998, AJ, 115, 1693
- Croton et al. (2006) Croton, D. J., Springel, V., White, S. D. M., et al. 2006, MNRAS, 365, 11
- Davies et al. (2020) Davies, R., Baron, D., Shimizu, T., et al. 2020, MNRAS, 498, 4150
- Douglas et al. (1996) Douglas, J. N., Bash, F. N., Bozyan, F. A., Torrence, G. W., & Wolfe, C. 1996, AJ, 111, 1945
- Downes & Solomon (1998) Downes, D., & Solomon, P. M. 1998, ApJ, 507, 615
- Draine et al. (2007) Draine, B. T., Dale, D. A., Bendo, G., et al. 2007, ApJ, 663, 866
- Draine & Li (2007) Draine, B. T., & Li, A. 2007, ApJ, 657, 810
- Dubois et al. (2016) Dubois, Y., Peirani, S., Pichon, C., et al. 2016, MNRAS, 463, 3948
- Ellison et al. (2016) Ellison, S. L., Teimoorinia, H., Rosario, D. J., & Mendel, J. T. 2016, MNRAS, 458, L34
- Ellison et al. (2021) Ellison, S. L., Wong, T., Sánchez, S. F., et al. 2021, MNRAS, 505, L46
- Evans et al. (2006) Evans, A. S., Solomon, P. M., Tacconi, L. J., Vavilkin, T., & Downes, D. 2006, AJ, 132, 2398
- Fabian (2012) Fabian, A. C. 2012, ARA&A, 50, 455
- Ferrarese & Merritt (2000) Ferrarese, L., & Merritt, D. 2000, ApJ, 539, L9
- Feruglio et al. (2015) Feruglio, C., Fiore, F., Carniani, S., et al. 2015, A&A, 583, A99
- Fiore et al. (2017) Fiore, F., Feruglio, C., Shankar, F., et al. 2017, A&A, 601, A143
- Florez et al. (2020) Florez, J., Jogee, S., Sherman, S., et al. 2020, MNRAS, 497, 3273
- Fluetsch et al. (2019) Fluetsch, A., Maiolino, R., Carniani, S., et al. 2019, MNRAS, 483, 4586
- Gallagher et al. (2019) Gallagher, R., Maiolino, R., Belfiore, F., et al. 2019, MNRAS, 485, 3409
- Gaspari et al. (2020) Gaspari, M., Tombesi, F., & Cappi, M. 2020, Nature Astronomy, 4, 10
- Gebhardt et al. (2000) Gebhardt, K., Bender, R., Bower, G., et al. 2000, ApJ, 539, L13
- Geldzahler & Kuhr (1983) Geldzahler, B. J., & Kuhr, H. 1983, AJ, 88, 1126
- Genzel et al. (2010) Genzel, R., Tacconi, L. J., Gracia-Carpio, J., et al. 2010, MNRAS, 407, 2091
- Girdhar et al. (2022) Girdhar, A., Harrison, C. M., Mainieri, V., et al. 2022, MNRAS, 512, 1608
- Gregory & Condon (1991) Gregory, P. C., & Condon, J. J. 1991, ApJS, 75, 1011
- Griffin et al. (2010) Griffin, M. J., Abergel, A., Abreu, A., et al. 2010, A&A, 518, L3
- Grimmett et al. (2020) Grimmett, L. P., Mullaney, J. R., Bernhard, E. P., et al. 2020, MNRAS, 495, 1392
- Guilloteau & Lucas (2000) Guilloteau, S., & Lucas, R. 2000, in Astronomical Society of the Pacific Conference Series, Vol. 217: Imaging at Radio through Submillimeter Wavelengths, ed. J. G. Mangum & S. J. E. Radford (California Astronomical Society of the Pacific 2000), 299
- Hainline et al. (2004) Hainline, L. J., Scoville, N. Z., Yun, M. S., et al. 2004, ApJ, 609, 61
- Harrison et al. (2012) Harrison, C. M., Alexander, D. M., Mullaney, J. R., et al. 2012, ApJ, 760, L15
- Harrison et al. (2017) Harrison, C. M., Johnson, H. L., Swinbank, A. M., et al. 2017, MNRAS, 467, 1965
- Ho & Kim (2009) Ho, L. C., & Kim, M. 2009, ApJS, 184, 398
- Ho & Kim (2015) Ho, L. C., & Kim, M. 2015, ApJ, 809, 123
- Högbom (1974) Högbom, J. A. 1974, A&AS, 15, 417
- Hopkins et al. (2008) Hopkins, P. F., Hernquist, L., Cox, T. J., & Kereš, D. 2008, ApJS, 175, 356
- Hopkins et al. (2005) Hopkins, P. F., Hernquist, L., Martini, P., et al. 2005, ApJ, 625, L71
- Hunter (2007) Hunter, J. D. 2007, Computing in Science & Engineering, 9, 90
- Husemann et al. (2017) Husemann, B., Davis, T. A., Jahnke, K., et al. 2017, MNRAS, 470, 1570
- Husemann et al. (2022) Husemann, B., Singha, M., Scharwächter, J., et al. 2022, A&A, 659, A124
- Ichikawa et al. (2019) Ichikawa, K., Ricci, C., Ueda, Y., et al. 2019, ApJ, 870, 31
- Iono et al. (2009) Iono, D., Wilson, C. D., Yun, M. S., et al. 2009, ApJ, 695, 1537
- Isobe et al. (1986) Isobe, T., Feigelson, E. D., & Nelson, P. I. 1986, ApJ, 306, 490
- Jarrett et al. (2011) Jarrett, T. H., Cohen, M., Masci, F., et al. 2011, ApJ, 735, 112
- Jarvis et al. (2020) Jarvis, M. E., Harrison, C. M., Mainieri, V., et al. 2020, MNRAS
- Kakkad et al. (2017) Kakkad, D., Mainieri, V., Brusa, M., et al. 2017, MNRAS, 468, 4205
- Kellermann et al. (1994) Kellermann, K. I., Sramek, R., Schmidt, M., Green, R. F., & Shaffer, D. B. 1994, AJ, 108, 1163
- Kellermann et al. (1989) Kellermann, K. I., Sramek, R., Schmidt, M., Shaffer, D. B., & Green, R. 1989, AJ, 98, 1195
- Kennicutt (1998) Kennicutt, R. C. 1998, ARA&A, 36, 189
- Kim & Ho (2019) Kim, M., & Ho, L. C. 2019, ApJ, 876, 35
- Kim et al. (2017) Kim, M., Ho, L. C., Peng, C. Y., Barth, A. J., & Im, M. 2017, ApJS, 232, 21
- Kim et al. (2008) Kim, M., Ho, L. C., Peng, C. Y., et al. 2008, ApJ, 687, 767
- Kirkpatrick et al. (2019) Kirkpatrick, A., Sharon, C., Keller, E., & Pope, A. 2019, ApJ, 879, 41
- Kirkpatrick et al. (2020) Kirkpatrick, A., Urry, C. M., Brewster, J., et al. 2020, ApJ, 900, 5
- Kormendy & Ho (2013) Kormendy, J., & Ho, L. C. 2013, ARA&A, 51, 511
- Kormendy & Kennicutt (2004) Kormendy, J., & Kennicutt, R. C., 2004, ARA&A, 42, 603
- Koss et al. (2011) Koss, M., Mushotzky, R., Veilleux, S., et al. 2011, ApJ, 739, 57
- Koss et al. (2021) Koss, M. J., Strittmatter, B., Lamperti, I., et al. 2021, ApJS, 252, 29
- Koss et al. (2022) Koss, M. J., Trakhtenbrot, B., Ricci, C., et al. 2022, ApJS, 261, 1
- Kroupa (2001) Kroupa, P. 2001, MNRAS, 322, 231
- Kuehr et al. (1981) Kuehr, H., Witzel, A., Pauliny-Toth, I. I. K., & Nauber, U. 1981, A&AS, 45, 367
- Laing & Peacock (1980) Laing, R. A., & Peacock, J. A. 1980, MNRAS, 190, 903
- Lamperti et al. (2020) Lamperti, I., Saintonge, A., Koss, M., et al. 2020, ApJ, 889, 103
- Leroy et al. (2011) Leroy, A. K., Bolatto, A., Gordon, K., et al. 2011, ApJ, 737, 12
- Lutz et al. (2018) Lutz, D., Shimizu, T., Davies, R. I., et al. 2018, A&A, 609, A9
- Magorrian et al. (1998) Magorrian, J., Tremaine, S., Richstone, D., et al. 1998, AJ, 115, 2285
- Maiolino et al. (2017) Maiolino, R., Russell, H. R., Fabian, A. C., et al. 2017, Nature, 544, 202
- Mejía-Restrepo et al. (2022) Mejía-Restrepo, J. E., Trakhtenbrot, B., Koss, M. J., et al. 2022, ApJS, 261, 5
- Michiyama et al. (2021) Michiyama, T., Saito, T., Tadaki, K.-i., et al. 2021, ApJS, 257, 28
- Molina et al. (2023) Molina, J., Ho, L. C., Wang, R., et al. 2023, ApJ, 944, 30
- Molina et al. (2022a) Molina, J., Ho, L. C., Wang, R., et al. 2022a, ApJ, 935, 72
- Molina et al. (2021) Molina, J., Wang, R., Shangguan, J., et al. 2021, ApJ, 908, 231
- Morganti (2017) Morganti, R. 2017, Nature Astronomy, 1, 596
- Mushotzky et al. (2014) Mushotzky, R. F., Shimizu, T. T., Meléndez, M., & Koss, M. 2014, ApJ, 781, L34
- Nelson et al. (2018) Nelson, D., Pillepich, A., Springel, V., et al. 2018, MNRAS, 475, 624
- Nenkova et al. (2008a) Nenkova, M., Sirocky, M. M., Ivezić, Ž., & Elitzur, M. 2008a, ApJ, 685, 147
- Nenkova et al. (2008b) Nenkova, M., Sirocky, M. M., Nikutta, R., Ivezić, Ž., & Elitzur, M. 2008b, ApJ, 685, 160
- Oliphant (2006) Oliphant, T. E. 2006, A guide to NumPy, Vol. 1 (Trelgol Publishing USA)
- Perna et al. (2015) Perna, M., Brusa, M., Cresci, G., et al. 2015, A&A, 574, A82
- Perna et al. (2018) Perna, M., Sargent, M. T., Brusa, M., et al. 2018, A&A, 619, A90
- Petric et al. (2015) Petric, A. O., Ho, L. C., Flagey, N. J. M., & Scoville, N. Z. 2015, ApJS, 219, 22
- Pitchford et al. (2016) Pitchford, L. K., Hatziminaoglou, E., Feltre, A., et al. 2016, MNRAS, 462, 4067
- Planck Collaboration et al. (2016) Planck Collaboration, Ade, P. A. R., Aghanim, N., et al. 2016, A&A, 594, A13
- Poglitsch et al. (2010) Poglitsch, A., Waelkens, C., Geis, N., et al. 2010, A&A, 518, L2
- Price-Whelan et al. (2018) Price-Whelan, A. M., Sipőcz, B. M., Günther, H. M., et al. 2018, AJ, 156, 123
- Privon et al. (2020) Privon, G. C., Ricci, C., Aalto, S., et al. 2020, ApJ, 893, 149
- Rakshit & Woo (2018) Rakshit, S., & Woo, J.-H. 2018, ApJ, 865, 5
- Ramos Almeida et al. (2022) Ramos Almeida, C., Bischetti, M., García-Burillo, S., et al. 2022, A&A, 658, A155
- Reeves & Turner (2000) Reeves, J. N., & Turner, M. J. L. 2000, MNRAS, 316, 234
- Richards et al. (2006) Richards, G. T., Lacy, M., Storrie-Lombardi, L. J., et al. 2006, ApJS, 166, 470
- Romeo & Fathi (2016) Romeo, A. B., & Fathi, K. 2016, MNRAS, 460, 2360
- Rosario et al. (2012) Rosario, D. J., Santini, P., Lutz, D., et al. 2012, A&A, 545, A45
- Rosario et al. (2013) Rosario, D. J., Santini, P., Lutz, D., et al. 2013, ApJ, 771, 63
- Rosario et al. (2018) Rosario, D. J., Burtscher, L., Davies, R. I., et al. 2018, MNRAS, 473, 5658
- Salvestrini et al. (2022) Salvestrini, F., Gruppioni, C., Hatziminaoglou, E., et al. 2022, A&A, 663, A28
- Sanders et al. (1988) Sanders, D. B., Soifer, B. T., Elias, J. H., et al. 1988, ApJ, 325, 74
- Sandstrom et al. (2013) Sandstrom, K. M., Leroy, A. K., Walter, F., et al. 2013, ApJ, 777, 5
- Savage & Oliver (2007) Savage, R. S., & Oliver, S. 2007, ApJ, 661, 1339
- Schaye et al. (2015) Schaye, J., Crain, R. A., Bower, R. G., et al. 2015, MNRAS, 446, 521
- Scholtz et al. (2018) Scholtz, J., Alexander, D. M., Harrison, C. M., et al. 2018, MNRAS, 475, 1288
- Schulze et al. (2019) Schulze, A., Silverman, J. D., Daddi, E., et al. 2019, MNRAS, 488, 1180
- Scoville et al. (2003) Scoville, N. Z., Frayer, D. T., Schinnerer, E., & Christopher, M. 2003, ApJ, 585, L105
- Shangguan et al. (2020a) Shangguan, J., Ho, L. C., Bauer, F. E., Wang, R., & Treister, E. 2020a, ApJ, 899, 112
- Shangguan et al. (2020b) Shangguan, J., Ho, L. C., Bauer, F. E., Wang, R., & Treister, E. 2020b, ApJS, 247, 15
- Shangguan et al. (2018) Shangguan, J., Ho, L. C., & Xie, Y. 2018, ApJ, 854, 158
- Shi et al. (2014) Shi, Y., Rieke, G. H., Ogle, P. M., Su, K. Y. L., & Balog, Z. 2014, ApJS, 214, 23
- Shimizu et al. (2016) Shimizu, T. T., Meléndez, M., Mushotzky, R. F., et al. 2016, MNRAS, 456, 3335
- Shimizu et al. (2017) Shimizu, T. T., Mushotzky, R. F., Meléndez, M., et al. 2017, MNRAS, 466, 3161
- Sijacki et al. (2015) Sijacki, D., Vogelsberger, M., Genel, S., et al. 2015, MNRAS, 452, 575
- Silpa et al. (2020) Silpa, S., Kharb, P., Ho, L. C., et al. 2020, MNRAS, 499, 5826
- Skrutskie et al. (2006) Skrutskie, M. F., Cutri, R. M., Stiening, R., et al. 2006, AJ, 131, 1163
- Smirnova-Pinchukova et al. (2022) Smirnova-Pinchukova, I., Husemann, B., Davis, T. A., et al. 2022, A&A, 659, A125
- Solomon & Vanden Bout (2005) Solomon, P. M., & Vanden Bout, P. A. 2005, ARA&A, 43, 677
- Somerville et al. (2008) Somerville, R. S., Hopkins, P. F., Cox, T. J., Robertson, B. E., & Hernquist, L. 2008, MNRAS, 391, 481
- Stanley et al. (2017) Stanley, F., Alexander, D. M., Harrison, C. M., et al. 2017, MNRAS, 472, 2221
- Stemo et al. (2020) Stemo, A., Comerford, J. M., Barrows, R. S., et al. 2020, ApJ, 888, 78
- Tacconi et al. (2018) Tacconi, L. J., Genzel, R., Saintonge, A., et al. 2018, ApJ, 853, 179
- Torbaniuk et al. (2021) Torbaniuk, O., Paolillo, M., Carrera, F., et al. 2021, MNRAS, 506, 2619
- Treister et al. (2012) Treister, E., Schawinski, K., Urry, C. M., & Simmons, B. D. 2012, ApJ, 758, L39
- Veilleux et al. (2020) Veilleux, S., Maiolino, R., Bolatto, A. D., & Aalto, S. 2020, A&A Rev., 28, 2
- Vestergaard & Peterson (2006) Vestergaard, M., & Peterson, B. M. 2006, ApJ, 641, 689
- Vietri et al. (2022) Vietri, G., Garilli, B., Polletta, M., et al. 2022, A&A, 659, A129
- Vito et al. (2014) Vito, F., Maiolino, R., Santini, P., et al. 2014, MNRAS, 441, 1059
- Waldram et al. (1996) Waldram, E. M., Yates, J. A., Riley, J. M., & Warner, P. J. 1996, MNRAS, 282, 779
- Ward et al. (2022) Ward, S. R., Harrison, C. M., Costa, T., & Mainieri, V. 2022, MNRAS, 514, 2936
- Woo et al. (2020) Woo, J.-H., Son, D., & Rakshit, S. 2020, ApJ, 901, 66
- Wright & Otrupcek (1990) Wright, A., & Otrupcek, R. 1990, PKS Catalog (1990), 0
- Wright et al. (2010) Wright, E. L., Eisenhardt, P. R. M., Mainzer, A. K., et al. 2010, AJ, 140, 1868
- Xie & Ho (2022) Xie, Y., & Ho, L. C. 2022, ApJ, 925, 218
- Xie et al. (2021) Xie, Y., Ho, L. C., Zhuang, M.-Y., & Shangguan, J. 2021, ApJ, 910, 124
- Yesuf & Ho (2020) Yesuf, H. M., & Ho, L. C. 2020, ApJ, 901, 42
- Young et al. (2014) Young, J. E., Eracleous, M., Shemmer, O., et al. 2014, MNRAS, 438, 217
- Zhang et al. (2016) Zhang, Z., Shi, Y., Rieke, G. H., et al. 2016, ApJ, 819, L27
- Zhao et al. (2019) Zhao, D., Ho, L. C., Zhao, Y., Shangguan, J., & Kim, M. 2019, ApJ, 877, 52
- Zhao et al. (2021) Zhao, Y., Ho, L. C., Shangguan, J., et al. 2021, ApJ, 911, 94
- Zhuang & Ho (2020) Zhuang, M.-Y., & Ho, L. C. 2020, ApJ, 896, 108
- Zhuang & Ho (2022) Zhuang, M.-Y., & Ho, L. C. 2022, ApJ, 934, 130
- Zhuang et al. (2018) Zhuang, M.-Y., Ho, L. C., & Shangguan, J. 2018, ApJ, 862, 118
- Zhuang et al. (2021) Zhuang, M.-Y., Ho, L. C., & Shangguan, J. 2021, ApJ, 906, 38