Is More Always Better? The Effects of Personal Characteristics and Level of Detail on the Perception of Explanations in a Recommender System
Abstract.
Despite the acknowledgment that the perception of explanations may vary considerably between end-users, explainable recommender systems (RS) have traditionally followed a one-size-fits-all model, whereby the same explanation level of detail is provided to each user, without taking into consideration individual user’s context, i.e., goals and personal characteristics. To fill this research gap, we aim in this paper at a shift from a one-size-fits-all to a personalized approach to explainable recommendation by giving users agency in deciding which explanation they would like to see. We developed a transparent Recommendation and Interest Modeling Application (RIMA) that provides on-demand personalized explanations of the recommendations, with three levels of detail (basic, intermediate, advanced) to meet the demands of different types of end-users. We conducted a within-subject study (N=31) to investigate the relationship between user’s personal characteristics and the explanation level of detail, and the effects of these two variables on the perception of the explainable RS with regard to different explanation goals. Our results show that the perception of explainable RS with different levels of detail is affected to different degrees by the explanation goal and user type. Consequently, we suggested some theoretical and design guidelines to support the systematic design of explanatory interfaces in RS tailored to the user’s context.
1. Introduction
The explainability of recommendation systems (RS) has attracted considerable attention in recent years. Explainable recommendation refers to personalized recommendation algorithms that not only provide the user with the recommendations, but also provide explanations to make the user aware of why such items are recommended (Zhang and Chen, 2018). An explanation seeks to answer questions, also called intelligibility queries or types, such as what, why, how, what-if, why-not, how-to, and what-else (Lim and Dey, 2009; Mohseni et al., 2018). Research on explainable recommendation has been focused on different dimensions and design choices. In addition to the intelligibility types, these include (a) explanation goal (e.g., transparency, scrutability, trust, effectiveness, persuasiveness, efficiency, satisfaction), (b) explanation style (e.g., content-based, collaborative-based, social, hybrid), (c) explanation scope (i.e. input: user model, process: algorithm, output: recommended items), and (d) explanation format (e.g., textual, visual) (Ain et al., 2022; Nunes and Jannach, 2017; Tintarev and Masthoff, 2015; Zhang and Chen, 2018). Another crucial design choice in explainable recommendation relates to the level of explanation detail that should be provided to the end-user. Different explanation design choices, such as explanation style, scope, format, and level of detail will be affected by the explanation goal and user type (Mohseni et al., 2018). Users may not be interested in all the information that the explanation can produce (Miller, 2019). Different users have different needs for explanation and explanations may cause negative effects (e.g., high cognitive load, confusion, lack of trust) if they are difficult to understand (Zhao et al., 2019; Gedikli et al., 2014; Yang et al., 2020; Kulesza et al., 2015; Kizilcec, 2016). Thus, it is important to provide explanations with enough details to allow users to build accurate mental models of how the RS operates without overwhelming them.
The effect of individual user differences and human factors on behaviors with explainable RS has only been studied very recently (Kouki et al., 2019; Millecamp et al., 2019; Hernandez-Bocanegra and Ziegler, 2020; Szymanski et al., 2021). These studies showed that personal characteristics may have an impact on the perception of explanations, and provided motivation for the selection of different explanation information (i.e., content) for different users, depending on their context, i.e., goals and personal characteristics. However, in terms of design choice (i.e., intelligibility type, explanation style, scope, format, or level of detail), the majority of current designs of explainable RS still follow a one-size-fits-all approach that does not attempt to identify and address the needs and preferences of different users. As design choices in explainable recommendation will be affected by the user’s context, one natural direction is the advancement of current explanation techniques to meet the demands of different types of end-users. Like the recommendations themselves, explanations should be personalized for different end-users (Millecamp et al., 2019). Thus, explainable RS are expected to provide the right explanations for the right group of users (Mohseni et al., 2018). This requires a shift from a one-size-fits-all to a personalized approach to explainable recommendation, tailored to the needs and preferences of different users.
In this paper, we are particularly interested in the explanation level of detail as an important design choice in explainable recommendation. Recognizing that it is generally insufficient to take the explanation level of detail and user’s personal characteristics separately, we conducted a user study where we investigated the dependencies between these two factors and their effects on the user perception of different explanation goals (transparency, scrutability, trust, effectiveness, persuasiveness, efficiency, satisfaction). As a result, we derived some design guidelines to be considered when designing explanations with different levels of detail that align with explanation goals and user’s personal characteristics.
To conduct this study, we developed a transparent Recommendation and Interest Modeling Application (RIMA) that provides on-demand personalized explanations of the recommendations with three different levels of detail (basic, intermediate, advanced), in order to meet the needs and preferences of different users. The objective of the study was to answer the following research question: How do personal characteristics impact user perceptions of the explanation level of detail in terms of different explanation goals?
The results of our study show that (1) it is important to provide explanations with different levels of detail to meet the demands of different users, (2) explanations should be designed with respect to specific explanation goals and specific user types, and (3) explanation content should be tailored to user data.
The main contribution of this paper is twofold: first, we take personalized explanation in RS to the design choice level by providing on-demand explanations with different levels of detail. Second, we provide evidence for a dependency relation between explanation goal, user type, and explanation level of detail.
This paper is organized as follows. We first outline the background for this research and discuss related work. We then present the implementation of the different explanations in RIMA. Afterwards, we describe the user study, present the results, and discuss the implications of our findings. Based on these findings, we then present some design guidelines for providing personalized explanations in RS. Finally, we point out limitations, summarize the work, and outline future research plans.
2. Related work
2.1. Explanation with different levels of detail
The explanation level of detail is an important factor in the design process of explainable RS. In this work, the level of detail refers to the amount of information exposed in an explanation. In the field of explainable AI (XAI) in general, Mohseni et al. (2018) argue that different user groups will have other goals in mind while using XAI systems. In the same direction, Miller (2019) argue that providing the exact algorithm which generated the specific recommendation is not necessarily the best explanation. People tend not to judge the quality of explanations around their generation process, but instead around their usefulness.
Besides the goals of the users, another vital aspect that will influence their understanding of explanations are their cognitive capabilities. Results of previous research on XAI showed that for specific users or user groups, the detailed explanation does not automatically result in higher trust and user satisfaction because the provision of additional explanations increases cognitive effort (Kizilcec, 2016; Kulesza et al., 2015; Zhao et al., 2019; Yang et al., 2020). Kulesza et al. (2015) outlined a set of principles for designing explanations to personalize interactive machine learning. These principles include ”Be Sound”, “Be Complete” and “Don’t Overwhelm” implying a tradeoff between the amount of information in an explanation and the level of perceived transparency, trust, and satisfaction users develop when interacting with the AI system. Soundness means telling nothing but the truth. It refers to the explanation fidelity, i.e., “the extent to which each component of an explanation’s content is truthful in describing the underlying system”. Evaluating soundness requires to compare the explanation with the learning system’s mathematical model, “the more these explanations reflect the underlying model, the more sound the explanation is”. Completeness means telling the whole truth. It refers to “the extent to which all of the underlying system is described by the explanation”. A complete explanation informs users about all the information the learning system had at its disposal and how it used that information. The authors suggest that one method for evaluating completeness is via Lim and Dey’s intelligibility types (e.g., input, model, why, what if, certainty) (Lim and Dey, 2009), with more complete explanations including more of these intelligibility types (Kulesza et al., 2015). In an earlier study, Kulesza et al. (2013) considered ways intelligent agents should explain themselves to end users, especially focusing on how the soundness and completeness of the explanations impacts the end users’ mental models. The authors found that increasing completeness helped participants’ mental models and their perception of the cost/benefit tradeoff of attending to the explanations. On the other hand, when soundness was very low, participants experienced more mental demand and lost trust in the explanations. The study shows that there is a need to provide explanations with enough soundness and completeness in order to help users build an accurate mental model of how the system works without overwhelming them. In another study, Kizilcec (2016) investigated the effects of three levels of system transparency on trust in an algorithmic interface in the context of peer assessment and concluded that designing for trust requires balanced interface transparency, i.e., “not too little and not too much”. In their study, Yang et al. (2020) also observed that participants’ understanding of visual explanation was correlated with their trust. The authors showed that different visual explanations lead to different levels of trust and may cause inappropriate trust if an explanation is difficult to understand. In summary, these studies suggest that (1) different users demand different levels of explanation information, (2) the right explanation level of detail depends on the user’s context, i.e., goals and personal characteristics, and (3) providing the inappropriate explanation level of detail may cause negative effects.
While increasingly popular in XAI research, providing explanation with different levels of detail remains rare in the literature on explainable recommendation. Only the work presented in (Millecamp et al., 2019) provided explanations with varying level of details. Drawing on the findings from their study, the authors suggested that (1) users should be able to choose whether or not they wish to see explanations and (2) explanation components should be flexible enough to present varying level of details depending on users’ preferences. Following these design guidelines, the authors developed a music RS that not only allows users to choose whether or not to see the explanations by using a ”Why?” button but also to select the level of detail by clicking on a ”More/Hide” button.
2.2. Effects of personal characteristics
Recent studies on explainable recommendation showed that personal characteristics have an effect on the perception of explanations and that it is important to take personal characteristics into account when designing explanations (Millecamp et al., 2019; Kouki et al., 2019; Hernandez-Bocanegra and Ziegler, 2020; Szymanski et al., 2021). These studies investigated the effect of human factors, such as Big Five traits, need for cognition, and visualization familiarity and confirmed that users with specific personal characteristics will perceive and interact in different ways with an explainable RS. In particular, prior research investigated the effects of personal characteristics on the perception of different explanation styles (e.g., user-based, item-based, content-based, social) (Kouki et al., 2019) and different explanation formats (textual, visual) (Hernandez-Bocanegra and Ziegler, 2020; Szymanski et al., 2021). However, the effects of personal characteristics on the perception of explanation with different levels of detail are under-explored in explainable recommendation research.
3. RIMA
We developed the transparent Recommendation and Interest Modeling Application (RIMA) with the goal of explaining the recommendations with varying level of details. RIMA is a content-based RS that produces content-based explanations. It follows a user-driven personalized explanation approach by providing explanations with different levels of detail and empowering users to steer the explanation process the way they see fit (Guesmi et al., 2021b, a). The application provides on-demand explanations, that is, the users can decide whether or not to see the explanation and they can also choose which level of explanation detail they want to see (Guesmi et al., 2021c). In this work, we focus on recommending tweets and leveraging explanatory visualizations to provide insights into the recommendation process.
3.1. Interest model inference
The interest models in RIMA are inferred from users’ publications. The application uses Semantic Scholar IDs provided by users to gather their publications and the Semantic Interest Modeling Toolkit (SIMT) presented in (Chatti et al., 2021) to infer users’ interest models based on their publications. It applies unsupervised keyphrase extraction algorithms on the collected publications to generate keyphrase-based interests. In order to address semantic issues, Wikipedia is leveraged as a knowledge base to map the keyphrases to Wikipedia pages and generate Wikipedia-based interests.
3.2. Recommendation generation
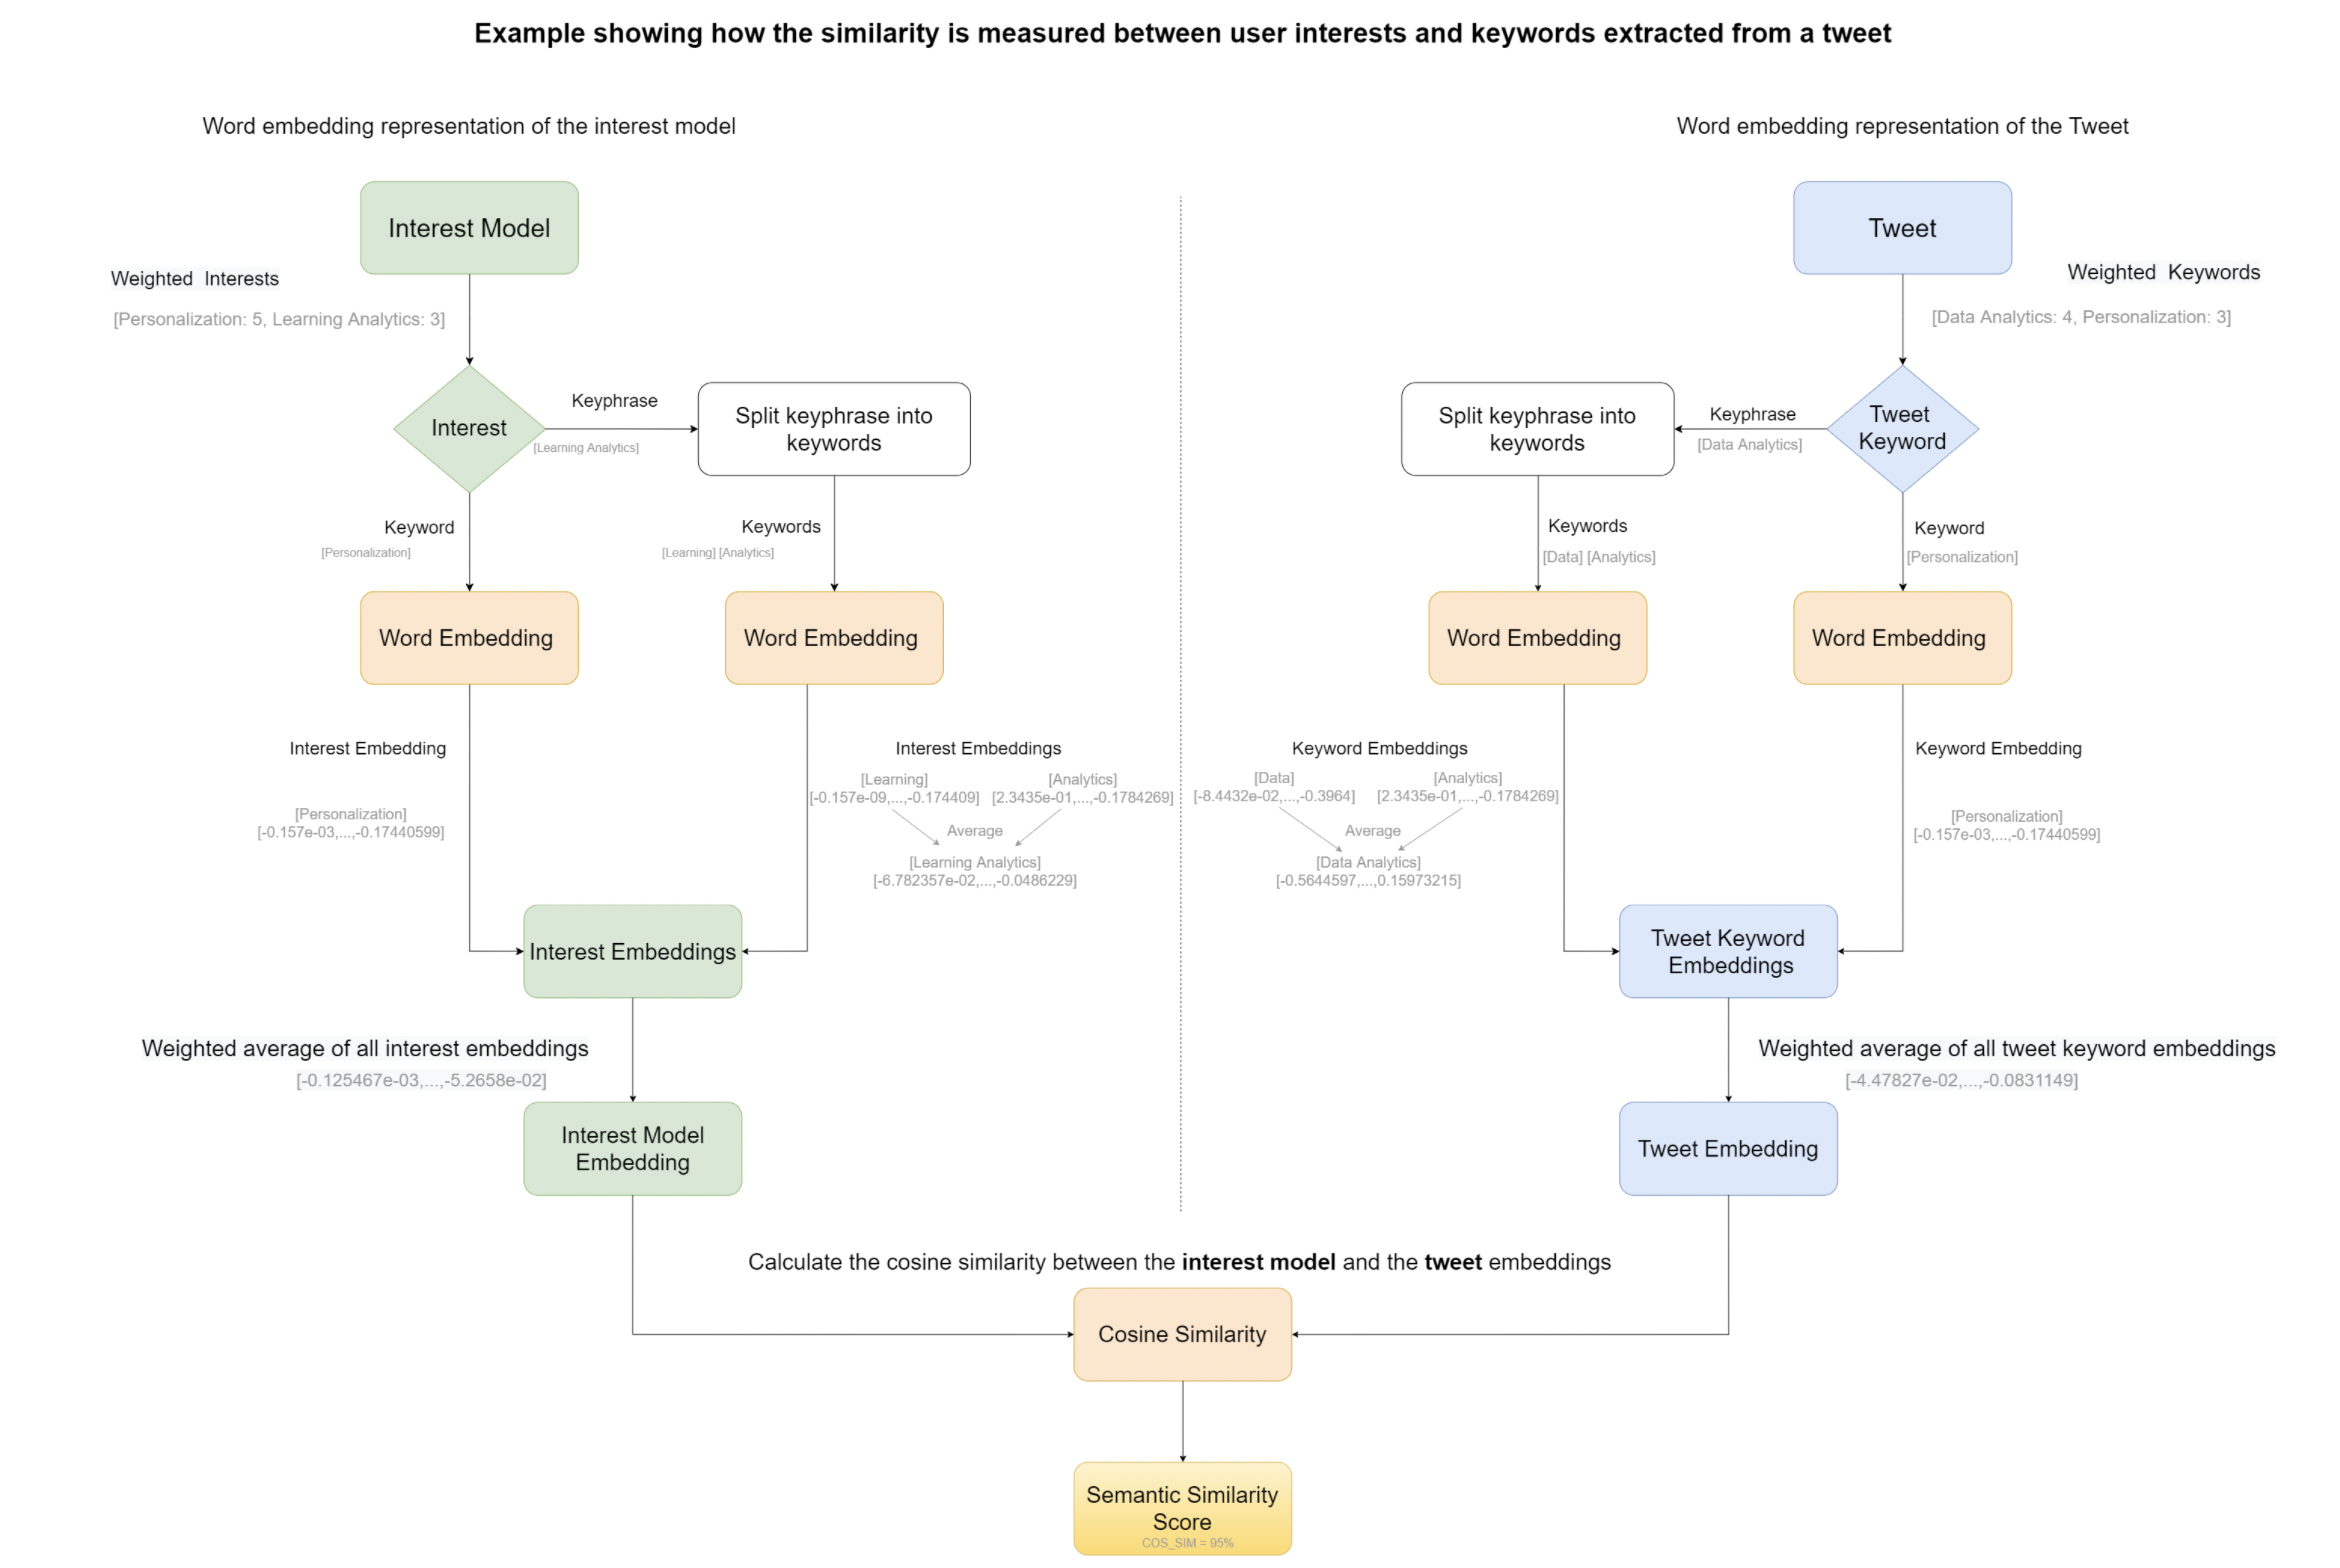
The aim of this part of the application is to provide tweet recommendations based on the inferred interest model. For obtaining the candidate tweets, we use the Twitter API to fetch tweets that contain one or more user interests that are used as input for the recommendation. We then apply an unsupervised keyphrase extraction algorithm on the fetched tweets to extract keywords from the tweet text. In order to compare the similarity between the user interests and the candidate tweets, we use word embedding techniques to generate vector representations of the interest model and the tweets. After getting the two embedding representations (i.e., interest model embedding and tweet embedding), we calculate the cosine similarity between them in order to obtain a semantic similarity score. Tweets with a semantic similarity score above a threshold of 40 % will then be displayed to the user.
3.3. Explanation design
The current explanation design was mainly the result of several brainstorming sessions involving the authors and students from the local university. In order to systematically design the explanations at different levels of details, we built upon Kulesza et al.’s principles of explanatory debugging (Kulesza et al., 2015) and Lim and Dey’s schema of intelligibility types (Lim and Dey, 2009). The visual design of the explanations was inspired by popular visualizations used in the literature on explainable RS, such as heatmaps and node-link diagrams (Gedikli et al., 2014). RIMA aims to provide explanation with different levels of detail by varying the explanation soundness and completeness. Soundly explaining the recommendations requires accurately explaining the different components of the underlying recommendation algorithm in a detailed manner. Providing a complete explanation requires to inform users about all the information the RS knows about the user and how it used that information. Kulesza et al. (2015) suggest that a complete explanation should include Lim and Dey’s input (information the system is aware of), why (the reasons underlying a specific decision), and how (an overview of the system’s decision making process) intelligibility types (Lim and Dey, 2009). RIMA provides three layered explanations (i.e., basic, intermediate, advanced) that the users can choose from, depending on whether they want more or less information. The intermediate and advanced explanations are hidden by default, but users are able to view these explanations on demand. Varying the explanation level of detail is achieved through manipulating and combining three levels of soundness and completeness (i.e., low, medium, high).
3.3.1. Basic explanation
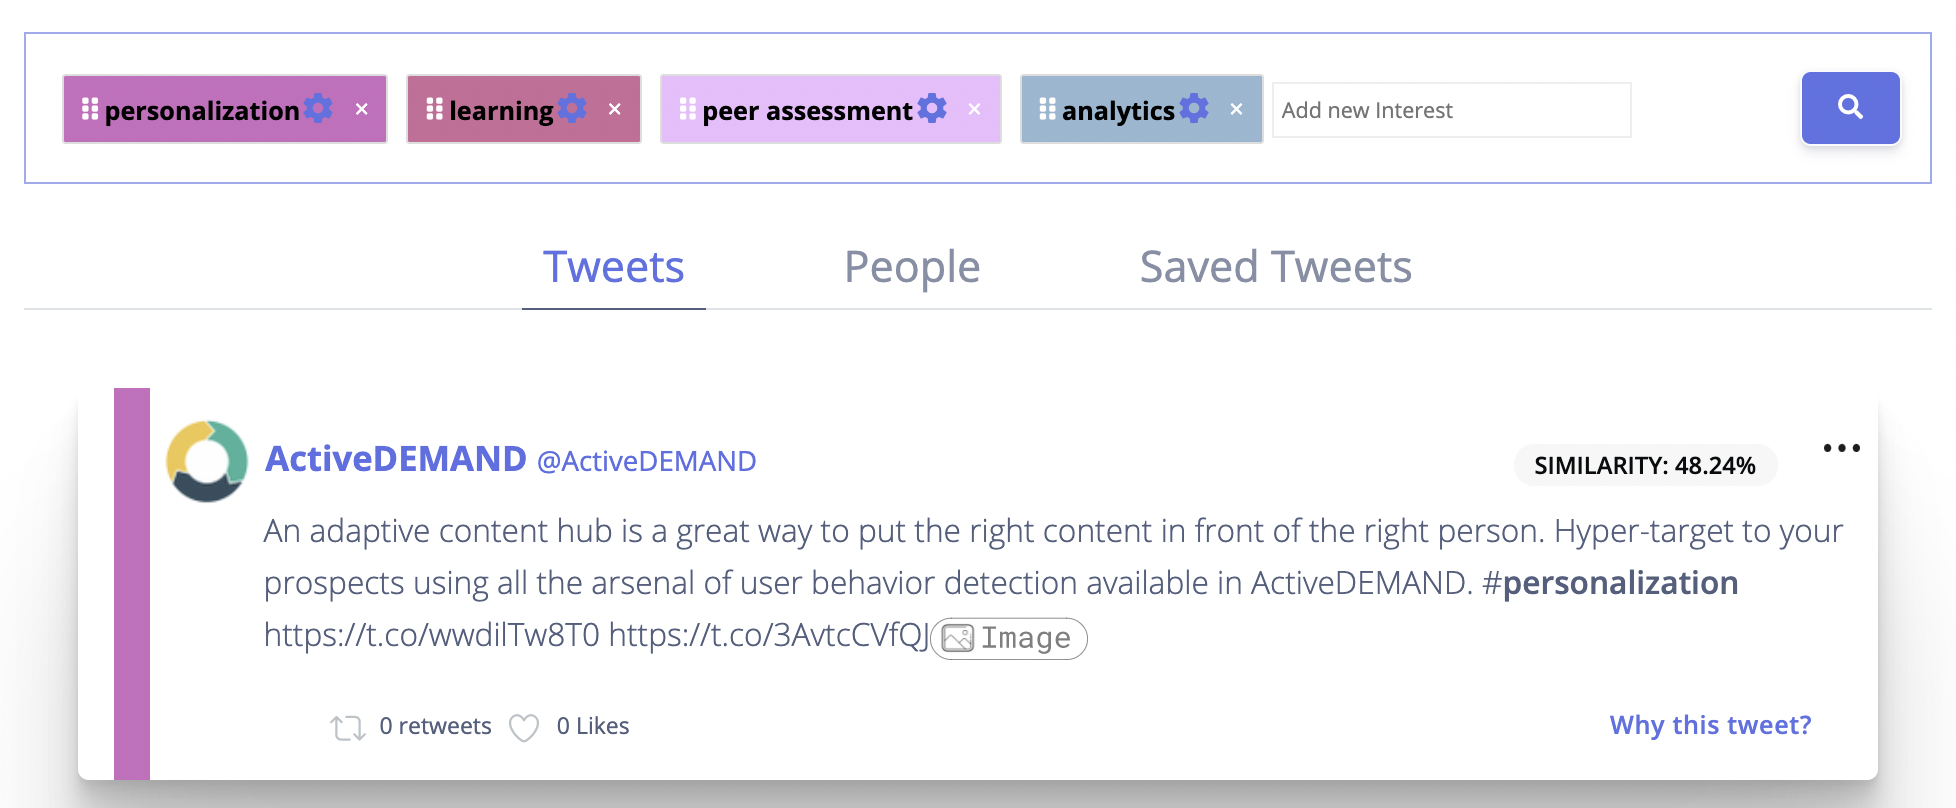
We designed the basic explanation to explain the RS with low soundness and medium completeness. It provides a simple, broad, and low-fidelity explanation of the RS that does not provide concrete details about the underlying recommendation algorithm. In terms of completeness, this explanation includes input and why intelligibility types. It tells the user about the interest model available as input to the RS as well as the RS’ reasons for a specific recommendation, in an abstract manner. As shown in Figure 1(a), the search box is initially populated with the user’s top five interests, ordered by their weights as generated by the system. Users can also add new interests in the search box or remove existing ones. The system will use these interests as input for the recommendation process. The basic explanation is achieved using a color band to map the tweet to the related interest(s). Also, the interest will be highlighted in the text of the tweet to show that this tweet contains this specific word (interest). In addition to these two visual elements, we display the similarity score on the top right corner of the tweet to show the level of similarity between the user interests and the recommended tweet . The answer to the why intelligibilty type at this level is a visual representation of ”because the tweet text contains your interest X and this tweet is Y% similar to your interest profile”.
3.3.2. Intermediate explanation
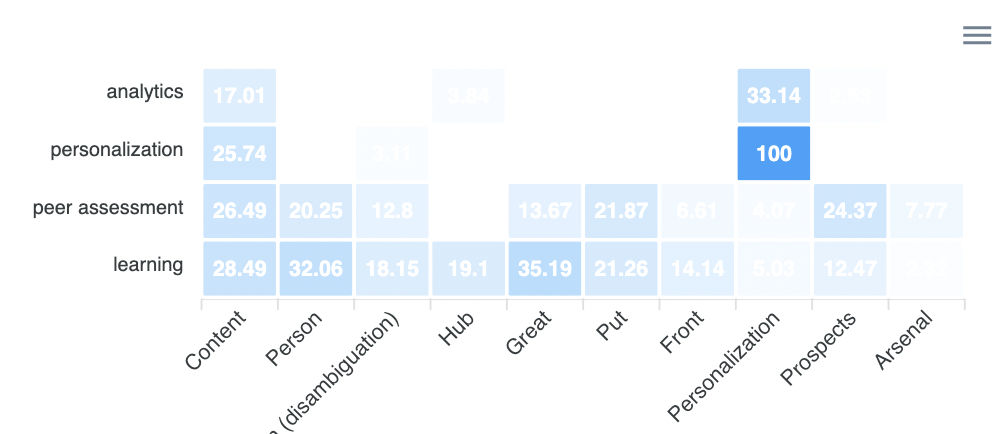
For more details, the user can choose the intermediate explanation level by clicking on ”Why this tweet?” on the bottom right of the tweet. The intermediate explanation is an instantiation of an explanation with medium soundness and medium completeness. It provides a more concrete, mid-fidelity explanation of the underlying recommendation algorithm by showing the results of the computed similarities between user interests and keywords extracted from a recommended tweet. However, it does not accurately disclose the detailed steps of the recommendation process to users. In terms of completeness, only the input and why intelligibility types are included in this explanation. The intermediate explanation tells users about the sources of information available to the RS (i.e., user interests and tweets) and that the similarity between individual user interests and tweet keywords played a role in each recommendation. As shown in Figure 1(b), we used a Heatmap chart to show the semantic similarities between user interests and the keywords extracted from the text of the tweet. The x-axis represents the keywords extracted from the tweet and the y-axis represents the user’s interests used in the recommendation. The cells show the computed semantic similarity scores between each interest and keyword. At this level, the answer to the why intelligibilty type is a visual representation of the similarities between all user interests used as input for the recommendation and all the keywords extracted from the tweet.
3.3.3. Advanced explanation
To move to the advanced explanation level, the user has to click on the ”more” button on the bottom right of the intermediate explanation window. The advanced explanation further increases soundness and completeness. This explanation aims to achieve high soundness by providing a high-fidelity explanation of the underlying recommendation process, as well as accurately detailing all the algorithmic steps used to compute the similarity between user interests and keywords extracted from a recommended tweet. To help ensure high completeness, we exposed more information by adding the how intelligibility type, in addition to the input and why intelligibility types. Following an explanation by example approach, the advanced explanation tells that the RS algorithm uses word embedding representations of a user’s interest model and a tweet as inputs to calculate a semantic similarity score between interest model and tweet embeddings. A tweet with a high similarity score will then be recommended (see Figure 1(c)).
4. Empirical Study
4.1. Participants
The target groups of our study were researchers and students who have at least one scientific publication. Participants were recruited via e-mail, word-of-mouth, and groups in social media networks and had to fulfill two participation requirements: they had to have at least one scientific publication and a Semantic Scholar ID, which is required for the interest model inference step. To obtain a diverse sample, the study included participants from different countries, educational levels, and study backgrounds. A total of 36 participants completed the study. We ensured the data quality through the examination of redundant answering patterns (e.g., consistent selection of only one answering option) and attention checks (i.e., ”Please answer ’disagree’ on this question”). Accordingly, five participants were excluded. The final sample consisted of N = 31 participants (14 males, 17 females) with an average age of 32 years. Out of the 31 participants, 19 (61.3%) reported to live in Germany, where 12 (38.7%) were international users from eight different countries. All participants had sufficient English language skills to participate in the study. The highest level of education reported by most participants was master’s degree (61.3%). The majority of participants (38.7%) had a study background in Computer Science. 17 participants (54.8%) were considered as Twitter users who reported to use Twitter at least 1 hour a week, where 14 (45.2%) reported to never use Twitter in a typical week.
4.2. Study procedure
While the study was originally planned as a laboratory experiment, due to the COVID-19 pandemic and its restrictions, we decided to conduct an online study. Each session was accompanied by a research assistant for technical support. The ethics motion to conduct the user study was approved by the Ethics Committee of the Department of Computer Science and Applied Cognitive Science of the Faculty of Engineering at the University of Duisburg-Essen on February 10, 2021. All participants gave informed consent to study participation. Participants first answered a questionnaire in SosciSurvey111https://www.soscisurvey.de which asks for their Semantic Scholar ID and included questions about their demographics and personal characteristics. Next, participants were given a short demo video on how to use the RIMA application. Afterwards, participants were asked to (1) create an account using their Semantic Scholar ID, (2) explore the system and find matching recommendations to their interests, and (3) take a close look at each explanation provided by the system. After that, participants were asked to evaluate each of the six explanations in terms of seven explanation goals, namely transparency, scrutability, trust, effectiveness, persuasiveness, efficiency, and satisfaction (Tintarev and Masthoff, 2015). All participants evaluated the explanations in an iterative approach, by answering the same set of questions for each explanation. To avoid any order-related biases, the order in which participants rated the explanations was randomized. They needed on average 48.09 minutes to complete the questionnaire (SD = 9.40, range = 24.08-65.23). At the end of the session, participants were debriefed and compensated with the possibility to win one of five Amazon vouchers.
4.3. Measurements
4.3.1. Personal Characteristics
Our study included measurements of six personal characteristics, namely: need for cognition, visualization familiarity, personal innovativeness, trust propensity, domain knowledge, and technical expertise. For each personal characteristic, answers were given on a 5-point Likert scale, ranging from 1 (”strongly disagree”) to 5 (”strongly agree”). Table 1 shows the definitions and example items for each of the six measured personal characteristics.
Need for Cognition: Need for cognition (NFC) refers to the tendency for an individual to engage in and enjoy effortful cognitive activities (Cacioppo et al., 1984). To measure NFC, the NCS-6 by Lins de Holanda Coelho et al. (Lins de Holanda Coelho et al., 2020) was used, which is a short 6-item version of the original 18-item Need for Cognition Scale (NCS-18) by Cacioppo et al. (Cacioppo et al., 1984). By providing significant time savings, the NCS-6 benefits from reducing participant fatigue and enhancing the data quality for longer surveys (Lins de Holanda Coelho et al., 2020). The reliability and validity of the NCS-6 are comparable to the original NCS-18, with an excellent internal consistency (Cronbach’s between .90 and .94).
Visualization Familiarity: Visualization Familiarity (VF) refers to the extent to which users have experience with analyzing and graphing data visualizations. To measure VF, this study adopted the scale proposed in the work by Kouki et al. (Kouki et al., 2019). The internal consistency of this scale is excellent (Cronbach’s = .92).
Personal Innovativeness: Personal innovativeness (PI) is a personality trait that represents an individual’s confidence or optimism regarding adoption of new technologies or ideas. Depending on their degree of PI, individuals will be either more or less willing to adopt new technologies (Agarwal and Prasad, 1998). To measure PI, the scale by McKnight et al. (McKnight et al., 2002) was used. The scale has good internal consistency (Cronbach’s = .89).
Trust Propensity: Trust propensity (TP) describes the level of intensity of an individual’s natural inclination to trust other parties in general (Komiak, 2003) and is related to the distribution to trust (McKnight et al., 2002). To measure TP, the scale by Lee and Turban (Lee and Turban, 2001) was used. The scale has excellent internal consistency (Cronbach’s = .90).
Domain Knowledge: Domain knowledge (DK) refers to the users’ knowledge about or experience with the type of recommended items (i.e., tweets). To measure DK, this study adopted the scale used in the work by Al-Natour et al. (Al-Natour et al., 2008). The scale was adapted to the context of this study by changing the word ”computer” to ”Twitter”. The internal consistency of this scale is excellent (Cronbach’s = .95).
Technical Expertise: In this work, technical expertise (TE) refers to users’ knowledge about artificial intelligence and recommender systems. To measure TE, this study adopted the scale used in the work by Kunkel et al. (Kunkel et al., 2021).
| Personal characteristics (PC) | Definition | Example item | Source |
|---|---|---|---|
| Need for Cognition (NFC) | Tendency for an individual to engage in and enjoy effortful cognitive activities (Cacioppo et al., 1984) | I would prefer complex to simple problems. | (Lins de Holanda Coelho et al., 2020) |
| Visualization Familiarity (VF) | Extent to which users have experience with analyzing and graphing data visualizations | I frequently analyze data visualizations. | (Kouki et al., 2019) |
| Personal Innovativeness (PI) | Confidence or optimism regarding adoption of new technologies (Agarwal and Prasad, 1998) | I like to explore new Web sites. | (McKnight et al., 2002) |
| Trust Propensity (TP) | Level of intensity of an individual’s natural inclination to trust other parties in general (Komiak, 2003) | It is easy for me to trust a person/thing. | (Lee and Turban, 2001) |
| Domain Knowledge (DK) | Knowledge about or experience with the type of recommended items | I am knowledgeable about Twitter. | (Al-Natour et al., 2008) |
| Technical Expertise (TE) | Knowledge about artificial intelligence and recommender systems | In the past I learned about how recommender systems work. | (Kunkel et al., 2021) |
4.3.2. Explanation Goals
The measurements for the seven explanation goals were adopted from different previous works (Balog and Radlinski, 2020; Kouki et al., 2019; Tintarev and Masthoff, 2008, 2011, 2012; Wang and Benbasat, 2007; Zhao et al., 2019). The first six explanation goals were measured using a 5-point Likert-scale, while satisfaction was measured using a 7-point Likert-scale. An overview of used questionnaire items is shown in Table 2. Besides quantitatively measuring the explanation goals, participants could provide qualitative feedback to each explanation and the overall RS by answering a set of open-ended questions.
| Metric | Statement | Source |
| This explanation … | ||
| Transparency | helps me to understand what the recommendations are based on. | (Balog and Radlinski, 2020) |
| Scrutability | allows me to give feedback on how well my preferences have been understood. | (Balog and Radlinski, 2020) |
| Trust (Competence) | shows me that the system has the expertise to understand my needs and preferences. | (Wang and Benbasat, 2007) |
| Trust (Benevolence) | shows me that the system keeps my interests in mind. | (Wang and Benbasat, 2007) |
| Trust (Integrity) | shows me that the system is honest. | (Wang and Benbasat, 2007) |
| Effectiveness | helps me to determine how well the recommendations match my interests. | (Tintarev and Masthoff, 2011) |
| Persuasiveness | is convincing. | (Kouki et al., 2019) |
| Efficiency | helps me to determine faster how well the recommendations match my interests. | (Tintarev and Masthoff, 2011) |
| Question | ||
| Satisfaction | How good do you think this explanation is? | (Tintarev and Masthoff, 2008, 2012) |
4.4. Study design
The RIMA application explains the recommendations with three different levels of detail (basic, intermediate, advanced). Following a within-subjects design, participants rated the three explanations in terms of the seven explanation goals outlined above. We calculated scores of the measured personal characteristics as the average of the values reported for the corresponding items. Further, we calculated the evaluation score for trust as the average of the individual values reported for the three trusting beliefs (i.e., competence, benevolence, and integrity).
5. Results
5.1. Interaction effects
To address our research question, we performed seven repeated measures ANCOVA analyses, where the evaluation scores of the seven explanation goals were included as dependent variables (DV), the explanation level (basic, intermediate, advanced) as independent variable (IV), and the personal characteristics scores as covariates. To stress here that we did not use ANCOVA to assess the overall effect of the IV (level of detail) on the DV (perception of explanation goal) while controlling for the covariate (personal characteristics), which would assume that there is no interaction between the IV and the covariate (i.e., homogeneity of regression slopes), but rather to find potential interactions between level of detail and personal characteristics. To visualize the significant interaction effects, we performed a median split for each personal characteristics dividing the participants in a low and high group for each of them.
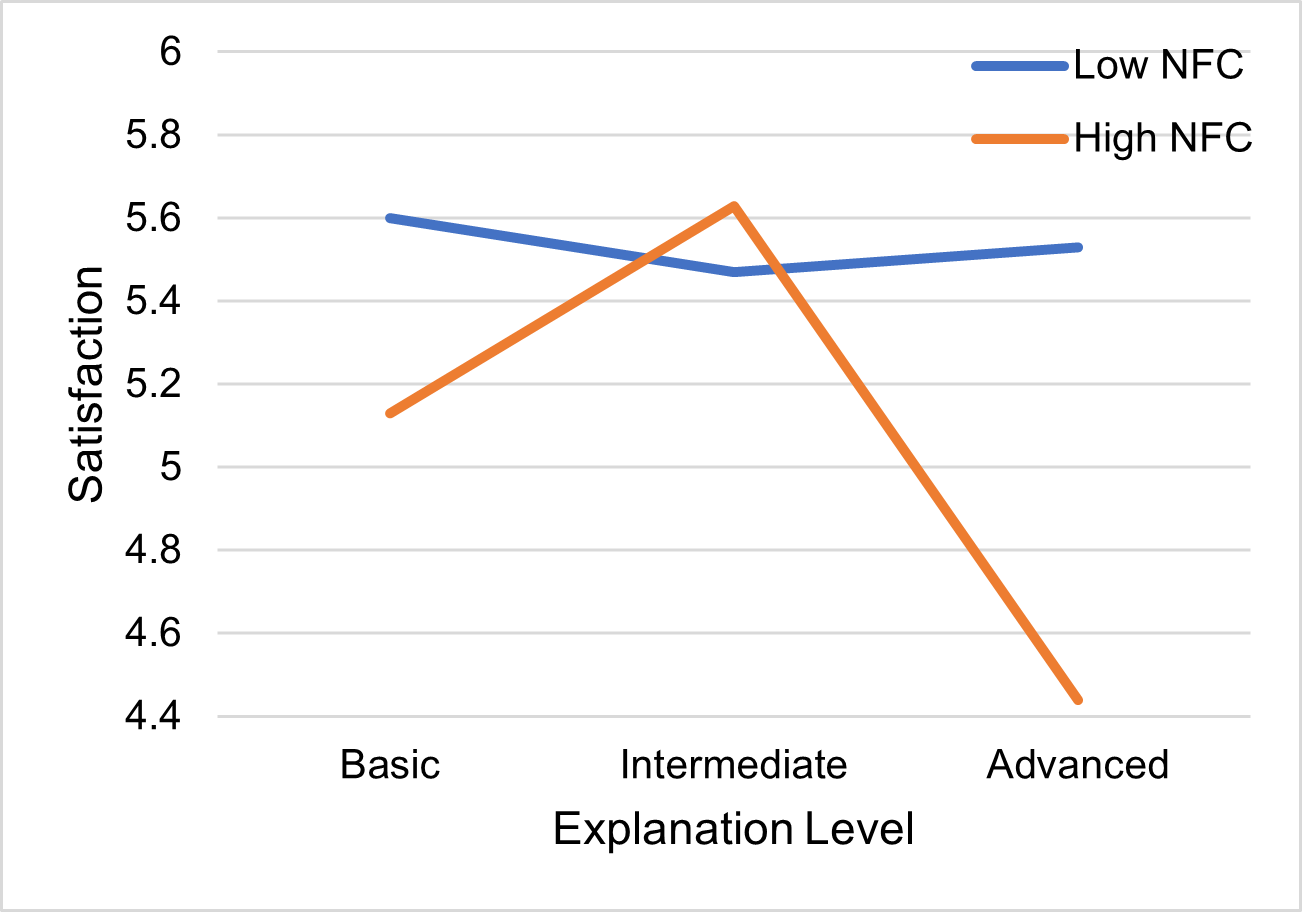
Need for Cognition: A significant interaction was found between NFC and explanation level in terms of satisfaction (F(2,48) = 3.654, p = .033, f = .39). The effect size corresponds to a moderate effect (Cohen, 1988). Figure 2(a) shows that for users with high NFC, satisfaction first increased, while the advanced explanation had the lowest average satisfaction. No significant interactions between NFC and explanation level in terms of the other explanation goals were found.
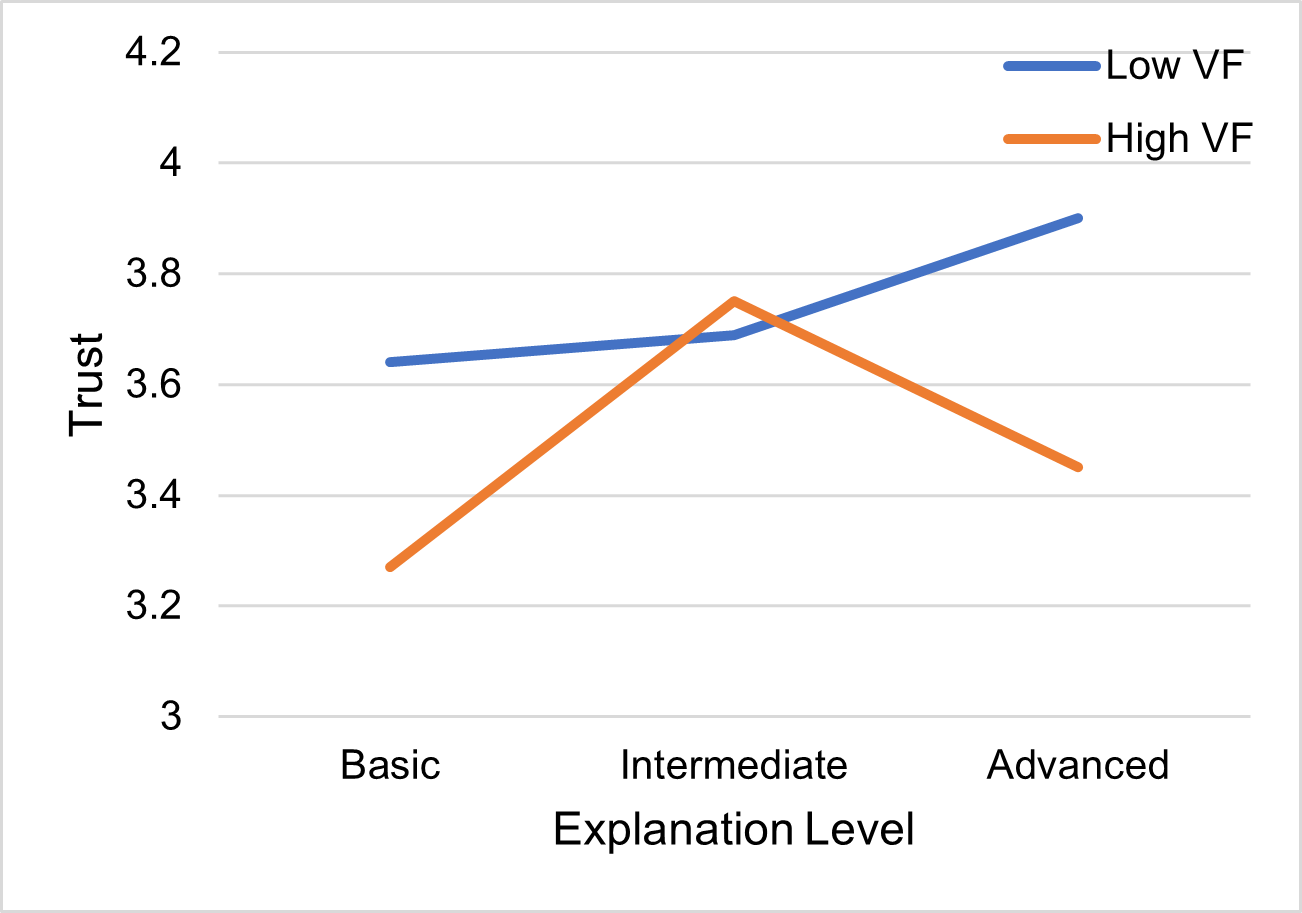
Visualization Familiarity: A significant interaction was found between VF and explanation level in terms of trust (F(2,48) = 3.639, p = .034, f = .39). The effect size corresponds to a moderate effect (Cohen, 1988). Figure 2(b) shows that, for users with low VF, trust increased with the explanation levels, while users with high VF had the average highest trust for the intermediate explanation. There were no significant interactions between VF and explanation level in terms of the other explanation goals.
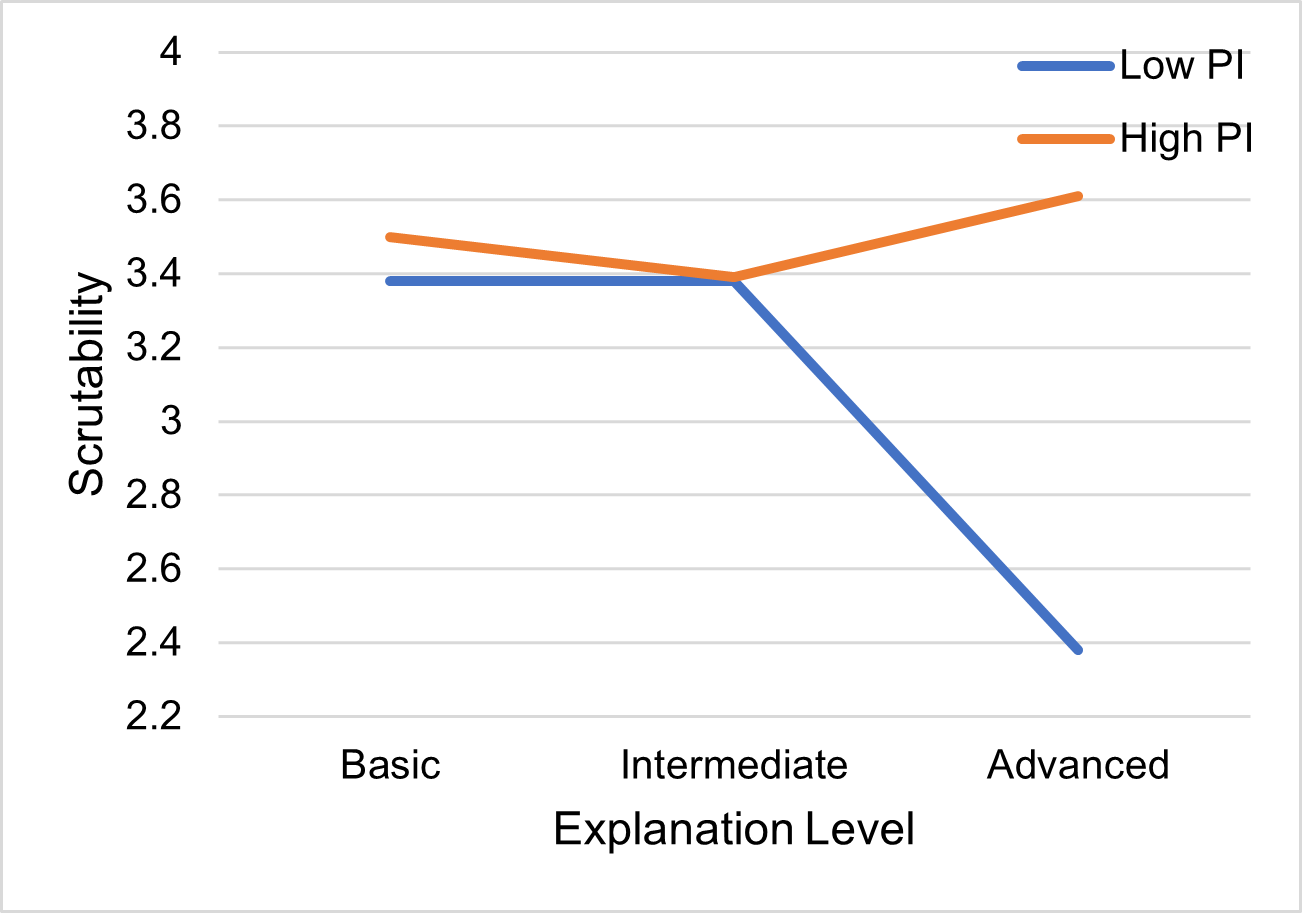
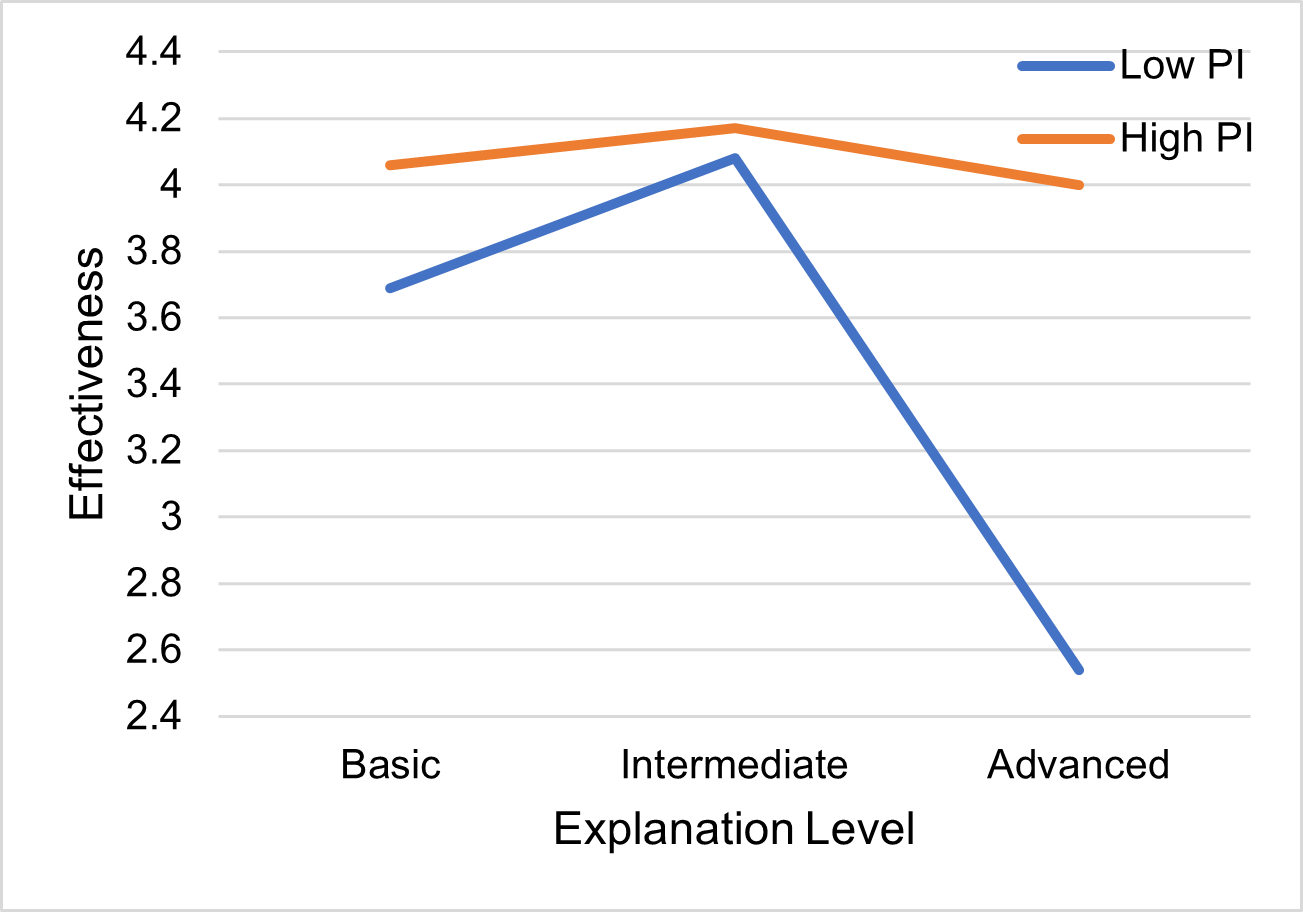
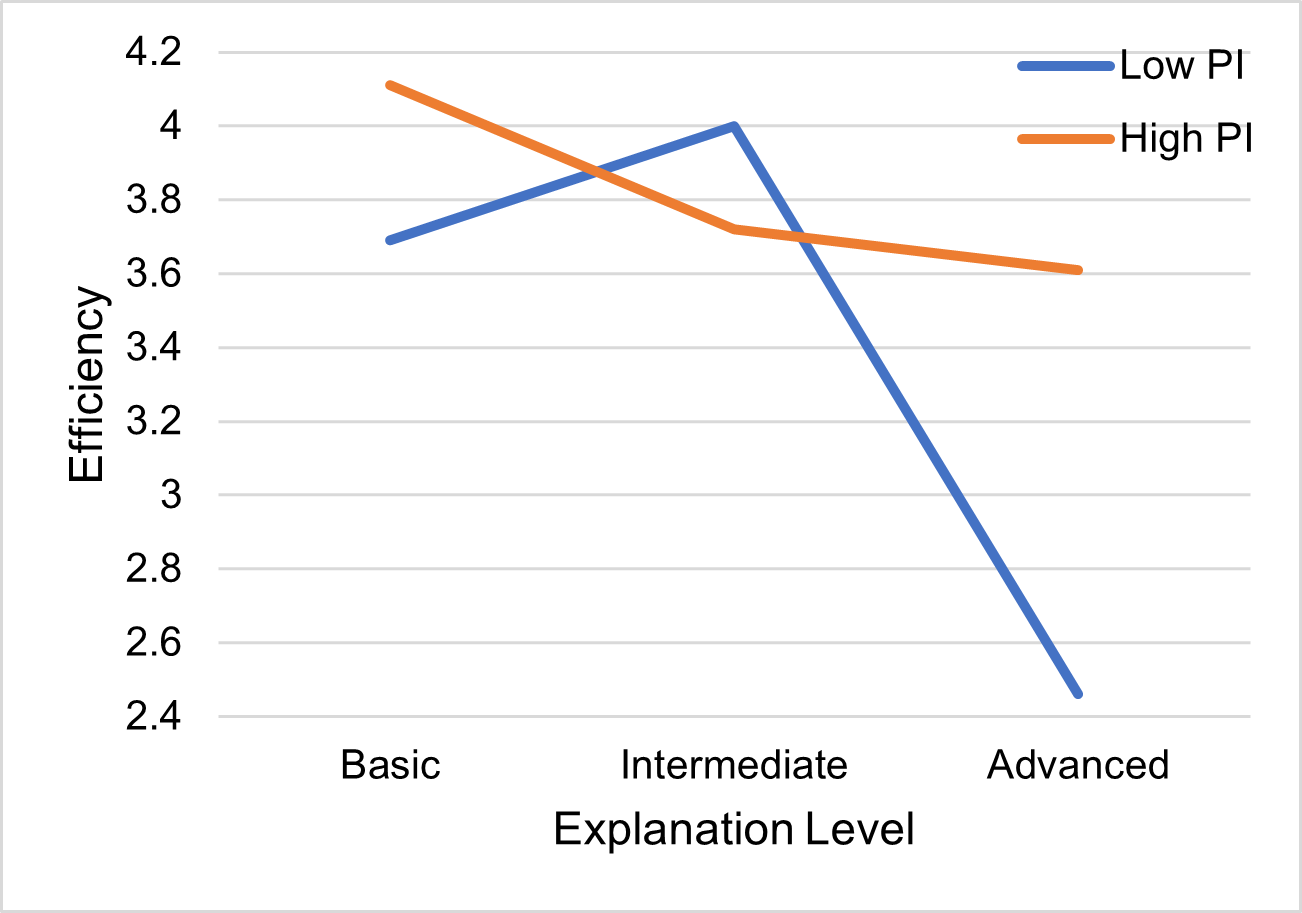
Personal Innovativeness: A significant interaction was found between PI and explanation level in terms of scrutability (F(2,48) = 3.478, p = .039, f = .38), effectiveness (F(2,48) = 4.231, p = .030, f = .42), and efficiency (F(2,48) = 3.237, p = .048, f = .37). The effects are moderate for scrutability and efficiency, and strong for effectiveness (Cohen, 1988). The interaction plots in Figure 2(c), 2(d), and 2(e) show that users with low PI had lowest average perception of scrutability, effectiveness and efficiency for the advanced explanation. There were no significant interactions between PI and explanation level in terms of transparency, trust, persuasiveness, or satisfaction.
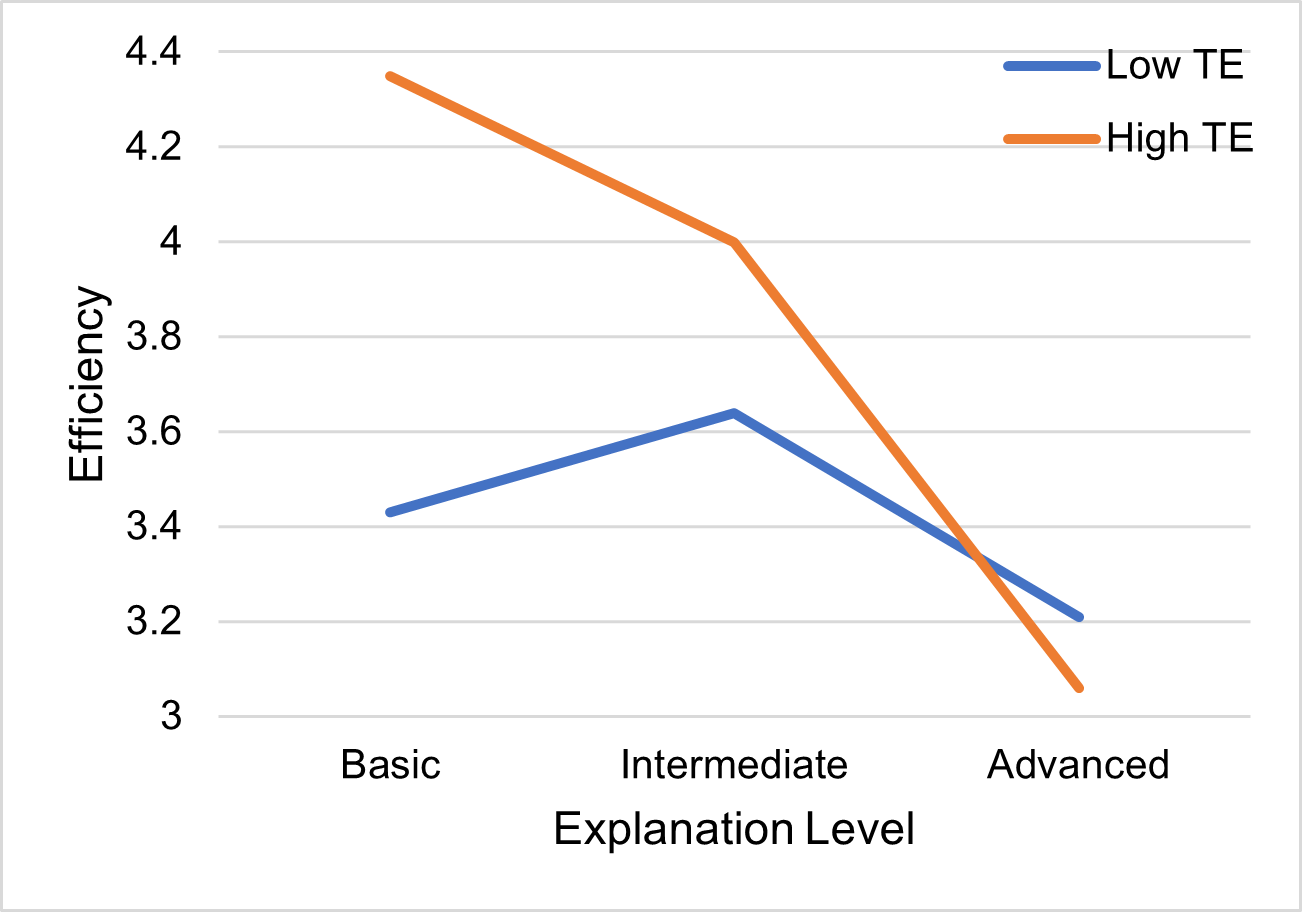
Technical Expertise: A significant interaction was found between TE and explanation level in terms of efficiency (F(2,48) = 3.262, p = .047, f = .37). The effect size corresponds to a moderate effect (Cohen, 1988). Figure 2(f) shows that users with high TE had higher average perceptions of efficiency for the basic and intermediate explanation than users with low TE. No significant interactions between TE and explanation level in terms of the other explanation goals were found.
Finally, there were no significant interactions between both Trust Propensity and Domain Knowledge and explanation level in terms of the seven explanation goals.
5.2. Qualitative analysis
Besides our quantitative analysis, we also conducted a qualitative analysis of the open-ended questions to gain further insights into the reasons behind the individual differences in the perception of explanations. We followed the instruction proposed by Braun and Clarke (2006). To do so, we started by familiarizing ourselves with the depth and breadth of the qualitative data. Next, we worked systematically through the data set and coded each answer to identify patterns in the data set. Then, we organized the codes into meaningful groups. The analysis was rather deductive as we aimed to find additional explanations for the findings of our quantitative analysis.
5.2.1. Explanations with different levels of detail
One major theme reported by 26 participants in the open-ended questions was related to the general feature of providing explanations with different levels of detail. Particularly, the majority of participants (23 of 26) reported that it is helpful to choose ”which amount of information is enough for the respective recommendation” (P24) and that it ”gives the user the opportunity to learn/discover as much or as little as they want” (P12). Nine participants agreed that the advanced explanation “might by a bit too much for a normal user” (P17). Therefore, participants argued that it is better to provide different levels of detail to “satisfy the needs of different people” (P2) so that “everyone can handle the system” (P4), instead of “providing all info in a single step” (P5). Besides individual differences, a number of participants believed that the required amount of information will also depend on the specific context and situation: users will choose the required level of detail “based on one’s curiosity” (P7) and depending on ”what is helpful at the moment” (P3) or “when something goes wrong, I might be interested in more detailed explanations to fully understand the mistakes” (P1). Only five participants reported that they do not wish to see explanations with different levels of detail, as they would only need one explanation ”that the system thinks is ”right” for me” (P21) instead of offering “so many on the plate” (P16).
5.2.2. Need for Cognition
One surprising finding of the quantitative analysis is that the overall average satisfaction with the advanced explanation of the recommendations was significantly lower for users with high than low NFC. After analyzing their answers, we observed that out of the comments criticizing the advanced explanation of the recommendations, the majority (12 of 15) came from users with high NFC. For instance, P1 reported “I was not able to fully read the explanation because some letters were too small” and P2 reported “I recommend optimizing the view and the formatting of the figure”. Further, three participants with high NFC disliked that the advanced explanation is “static” (P22) and “just about the algorithm” (P26), so it “does not differ from tweet to tweet” (P9). Overall, it seems that users with high NFC wanted to explore the explanation in detail, but were disappointed when they realized that it shows example values which were hardly readable, while users with low NFC had no need to read every small detail.
5.2.3. Visualization Familiarity
Similarly, the quantitative analysis revealed that users with high VF perceived the advanced explanation of the recommendations as less trustworthy than users with low VF. The qualitative analysis revealed that users with high VF disliked the static appearance of the advanced explanation of the recommendations. For instance, P18 reported “it looks like a standard explanation of the system” and P28 reported “they do not show actual formulas (i.e. vector model) or complete data (length of feature vector and values)”. In addition, one participant with high VF perceived the advanced explanation to be “a bit hidden” and that it ”should be made more prominent” (P21). One possible explanation for the reduced trust is that users with more knowledge about data visualization spent more time to explore the explanation in detail and understand the interplay between the recommendation input and output. They might have imagined how the chart could look like if it showed the values of their actual feature vectors. As their expectations could not be met, this might have created beliefs that the system is not honest about how it calculates the similarity scores of their own recommendations, thus they had lower perceptions of trust. This assumption, however, requires further investigation.
5.2.4. Personal Innovativeness
Another pattern that we identified in our quantitative analysis is that users with low PI perceived the advanced explanation of the recommendations to be least scrutable, effective, and efficient, and their perceptions of the advanced explanation were much lower than those of users with high PI. We observed that the majority (10 of 13) of participants with low PI reported to prefer the intermediate explanation as it is relates to their actual interests, which ”leads to a quick validation of crossed interests” (P5). One participant with low PI perceived the intermediate explanation to be more scrutable than the advanced explanation: “Intermediate one was what really helped me to understand why a strange tweet was recommended” and “the advanced one in the tweets view was the less useful” (P23). This seems to indicate that an explanation via example reduces their perceptions of scrutability, effectiveness, and efficiency.
5.2.5. Technical Expertise
We found that users with high TE had higher perceptions of efficiency of the basic and intermediate explanation of the recommendations than users with low TE. After comparing their answers, we observed that users with high TE indeed perceived the basic and intermediate explanation as efficient: “The similarity score is sufficient for a quick review of the recommended tweets” (P20) and “the Intermediate gives useful data quickly and easily” (P12). In contrast, users with low TE seemed to have more difficulties in understanding the basic and intermediate explanation: “Found it difficult to fully understand the visualization” (P4)” and “It’s a little overwhelming at first” (P18).
6. Discussion
We discuss the findings of our study in relation to our research question: ”How do personal characteristics impact user perceptions of the explanation level of detail in terms of different explanation goals?”. Our results show that there is no universal rule such as “not too little and not too much” (Kizilcec, 2016) to be applied when providing explanations with different levels of detail. It depends. The perception of explainable RS with different levels of detail is affected to different degrees by the explanation goal and user type. These effects are summarized in Table 3 and discussed below.
6.1. Main findings
Satisfaction. One main finding is that NFC influenced satisfaction with the explanations of the interest model. Users with a low NFC were more satisfied with the basic explanation. In contrast to the findings in (Cacioppo et al., 1984) indicating that users with high NFC preferred the highly detailed advanced explanation, our analysis revealed that users with high NFC were dissatisfied with the advanced explanation of the tweet recommendations as they expected it to explain the reasoning behind the recommendations using their actual interest and tweet keywords instead of example values. Thus, the explanation could not meet their increased need to understand the recommendation. Overall, the results indicate that users with high NFC are more satisfied with detailed explanations that are personalized to their own data.
Trust. Similarly, we found that the advanced explanation of the recommendations led to reduced trust of users with high VF. The qualitative analysis showed that these users were disappointed by the static appearance of the advanced explanation. Moreover, our analysis indicated that they also needed the explanation to be more visible. Thus, as the advanced explanation was the one that required most interaction steps to see, this might as well has created beliefs that the system is not honest about its inner logic which further reduced its trustworthiness. Overall, our finding confirms that, besides the level of detail, other aspects such as the general design or usability also contribute to the perception of explanations.
Efficiency. Another finding is that users with low TE perceived the basic and intermediate explanation of the recommendations as less efficient than users with prior knowledge about RS. We believe that users who already know how RS work needed less time to understand the explanations (e.g. similarity score and heatmap), thus they could determine faster how well a recommendation matches their interests. In contrast, users with low TE might have needed more time to understand the explanations, thus perceived them as less efficient. This shows that users’ expertise is an important influencing factor that should be considered when designing explanations to improve efficiency.
Scrutability. Our analysis also indicated that the intermediate explanation of the recommendations (i.e., heatmap) improved perceptions of scrutability for users with low PI, as this explanation helped them to validate the matching between their interests and the tweet recommendation. Thus, it seems that users with low PI need the explanation to be tailored to their actual data to give feedback about how well a recommendation relates to their interest.
| Goal | PC | Level of detail | Like (+) / Dislike (-) |
|---|---|---|---|
| Satisfaction | low NFC | Basic | simple (+), easy to understand (+) |
| Satisfaction | high NFC | Advanced | design (-), static (-) |
| Trust | high VF | Intermediate | relates to profile (+) |
| Trust | high VF | Advanced | static (-), hidden (-) |
| Efficiency | high TE | Basic, Intermediate | quick overview (+), easy to understand (+) |
| Efficiency | low TE | Basic, Intermediate | difficult to understand (-), overwhelming (-) |
| Scrutability | low PI | Intermediate | relates to profile (+) |
6.2. Design guidelines
To summarize the insights gathered through our study, we have compiled some suggestions for the effective design of explanations in RS.
6.2.1. Explanation with different levels of detail
In general, our work has confirmed that different users have different needs for explanation and require different explanation levels of detail. Thus, it is important that explanations should be tailored to the user type and that RS should provide explanations with different levels of detail to meet the demands of different users, as also suggested in (Millecamp et al., 2019). Further, our analysis also showed that, besides user characteristics, other aspects, such as the specific context and situation, influence how much detail a user wants to see. For instance, when users detect wrong assumptions made by the system or receive unexpected recommendations, they may be interested in seeing more details to understand why the system came to its decision. This supports previous findings that users need explanations for a variety of reasons (e.g., curiosity or system errors (Putnam and Conati, 2019)). Similarly, Gedikli et al. (2014) found that users have a higher need to understand a recommendation when the recommendation is questionable or unexpected.
6.2.2. Goal-oriented, human-centered explanation design
As different design choices such as explanation style, scope, format, or level of detail can be affected by the explanation goal and user type, it is crucial to follow a goal-oriented, human-centered approach to explanation design that starts with an understanding of the users’ goals and personal characteristics and then work backward to design explanations that best meet these goals and personal characteristics. To get at this, we need to provide mappings related to “which design choice instance is good for which explanation goal?” (mapping: Goal Design choice) and “which design choice instance is good for which user type” (mapping: User Design choice). As in general there is an interaction effect of design choice and user type on the perception of the explanation goal, we need to explore triplets of the form (G, U, D) to illustrate these interaction effects, where G is the explanation goal (e.g., transparency, scrutability, trust, effectiveness, persuasiveness, efficiency, satisfaction), U is a pair representing a personal characteristic of a user, e.g., (need for cognition, high) or (visualization familiarity, low), and D is a pair representing an instance of a design choice, e.g., (level of detail, intermediate) or (explanation format, textual). The (G, U, D) triplet can be interpreted as an association rule G, U D, e.g., satisfaction, (need for cognition, low) (level of detail, basic) to express that “in order to achieve higher satisfaction, provide explanation with an advanced level of detail to users with high need for cognition”. In our study, we found few such association rules (see Table 3). We encourage our fellow researchers to conduct more user studies to evaluate explanations designed for different explanation goals and user types, and to use (G, U, D) triplets in order to formally model the relationships they might find in their studies between the explanation goals, personal characteristics, and design choices, in different application domains.
6.2.3. Personalized explanation
It is essential to provide explanations by following a personalization-by-design approach to tailor the explanations to the user’s context, i.e., goals and personal characteristics, as also pointed out by Ain et al. (2022) who recently proposed a multi-dimensional conceptualization framework for personalized explanations in RS. Personalization should not only happen at the design choice level (i.e., tailor the explanation style, scope, format, or level of detail) but also at the content level (i.e., tailor the explanation’s content to user data). We can think of two strategies for promoting personalized explanation in RS. The first one is to support manual personalization by providing tools that enable users to control and tailor the explanations based on their needs and preferences (user-driven personalized explanation). For example, provide different explanation levels of detail and then hand over control to the user to actively choose the level of detail that she wants to see. The second strategy is to build automatic personalization controlled by the explainable RS (system-driven personalized explanation). The (G, U, D) triplets can be used as association rules to provide automatic personalized explanation taking into consideration individual user’s context.
7. Limitations
Although immense cares have been put into the planning of the user study, this work has some limitations. Firstly, the small sample size of the study. Therefore, the results of the study should be interpreted with caution and cannot be generalized. A larger sample would probably have yielded more significant and reliable results. Unfortunately, due to the study requirements that a participant should have at least one scientific publication and a Semantic Scholar ID, it was not possible to find more participants in time. Secondly, the measurement of personal characteristics and the evaluation of the system were based solely on self-report. Even though the data was carefully collected, this method has some error influences, such as dishonesty due to social desirability, which can lead to bias. Thirdly, some explanation goals could have been measured using objective instead of subjective measurements. For instance, efficiency can also be measured using log-data such as the total interaction time. Moreover, there were some technical issues that some participants have encountered during the study, which may have negatively influenced their perception of the RIMA application and the explanations. Finally, the current design of the different levels of detail was mainly the result of brainstorming sessions involving the authors and students from the local university. The results of this study could have been different if we had designed and presented other explanations (e.g., personalized advanced explanation instead of just explanation by example).
8. Conclusion and Future Work
In this paper, we aimed to shed light on an aspect that remains under-researched in the literature on explainable recommendation, namely the effects of personal characteristics and level of detail on the perception of explanations in a recommender system (RS). To this end, we developed and evaluated a transparent Recommendation and Interest Modeling Application (RIMA) that explains the recommendations with three different levels of detail (basic, intermediate, advanced). The results of our study demonstrated that the explanation design should foremost be tailored to user’s context, i.e. goals and personal characteristics. From our findings, we suggested some design guidelines to be considered when designing explanatory interfaces that align with user’s context. Our work has implications for theory on personalized explanation interfaces in RS. It demonstrates the interaction effects of personal characteristics and level of detail on the perception of explainable RS and it provides evidence for a dependency relation between explanation goal, user type, and design choice. Further, this work contributes to the practice by offering suggestions for the appropriate design of personalized explanation interfaces in RS. In future work we will assess the generalizability of the results in different application domains. We will also explore other possible visualizations to provide explanations at the three levels of detail. In particular, we will develop and evaluate advanced explanations that are tailored to user data. Further, we will investigate the interaction effects of personal characteristics and other design choices such as explanation style, scope, and format on the perception of explainable RS.
References
- (1)
- Agarwal and Prasad (1998) Ritu Agarwal and Jayesh Prasad. 1998. A conceptual and operational definition of personal innovativeness in the domain of information technology. Information systems research 9, 2 (1998), 204–215.
- Ain et al. (2022) Qurat Ul Ain, Mohamed Amine Chatti, Mouadh Guesmi, and Shoeb Joarder. 2022. A Multi-Dimensional Conceptualization Framework for Personalized Explanations in Recommender Systems. In Companion Proceedings of the 27th International Conference on Intelligent User Interfaces.
- Al-Natour et al. (2008) Sameh Al-Natour, Izak Benbasat, and Ronald T Cenfetelli. 2008. The effects of process and outcome similarity on users’ evaluations of decision aids. Decision Sciences 39, 2 (2008), 175–211.
- Balog and Radlinski (2020) Krisztian Balog and Filip Radlinski. 2020. Measuring Recommendation Explanation Quality: The Conflicting Goals of Explanations. In Proceedings of the 43rd International ACM SIGIR Conference on Research and Development in Information Retrieval. 329–338.
- Braun and Clarke (2006) Virginia Braun and Victoria Clarke. 2006. Using thematic analysis in psychology. Qualitative research in psychology 3, 2 (2006), 77–101.
- Cacioppo et al. (1984) John T Cacioppo, Richard E Petty, and Chuan Feng Kao. 1984. The efficient assessment of need for cognition. Journal of personality assessment 48, 3 (1984), 306–307.
- Chatti et al. (2021) Mohamed Amine Chatti, Fangzheng Ji, Mouadh Guesmi, Arham Muslim, Ravi Kumar Singh, and Shoeb Ahmed Joarder. 2021. SIMT: A Semantic Interest Modeling Toolkit. In Adjunct Proceedings of the 29th ACM Conference on User Modeling, Adaptation and Personalization. 75–78.
- Cohen (1988) J. Cohen. 1988. Statistical power analysis for the behavioral sciences. Lawrence Erlbaum Associates, Hillsdale, New Jersey.
- Gedikli et al. (2014) Fatih Gedikli, Dietmar Jannach, and Mouzhi Ge. 2014. How should I explain? A comparison of different explanation types for recommender systems. International Journal of Human-Computer Studies 72, 4 (2014), 367–382.
- Guesmi et al. (2021a) Mouadh Guesmi, Mohamed Amine Chatti, Yiqi Sun, Shadi Zumor, Fangzheng Ji, Arham Muslim, Laura Vorgerd, and Shoeb Joarder. 2021a. Open, scrutable and explainable interest models for transparent recommendation. In Companion Proceedings of the 26th International Conference on Intelligent User Interfaces.
- Guesmi et al. (2021b) Mouadh Guesmi, Mohamed Amine Chatti, Laura Vorgerd, Shoeb Joarder, Qurat Ul Ain, Thao Ngo, Shadi Zumor, Yiqi Sun, Fangzheng Ji, and Arham Muslim. 2021b. Input or Output: Effects of Explanation Focus on the Perception of Explainable Recommendation with Varying Level of Details. In Proceedings of the 8th Joint Workshop on Interfaces and Human Decision Making for Recommender Systems, Vol. 2948. 55–72.
- Guesmi et al. (2021c) Mouadh Guesmi, Mohamed Amine Chatti, Laura Vorgerd, Shoeb Joarder, Shadi Zumor, Yiqi Sun, Fangzheng Ji, and Arham Muslim. 2021c. On-demand Personalized Explanation for Transparent Recommendation. In Adjunct Proceedings of the 29th ACM Conference on User Modeling, Adaptation and Personalization. 246–252.
- Hernandez-Bocanegra and Ziegler (2020) Diana C Hernandez-Bocanegra and Jürgen Ziegler. 2020. Explaining Review-Based Recommendations: Effects of Profile Transparency, Presentation Style and User Characteristics. i-com 19, 3 (2020), 181–200.
- Kizilcec (2016) René F Kizilcec. 2016. How much information? Effects of transparency on trust in an algorithmic interface. In Proceedings of the 2016 CHI Conference on Human Factors in Computing Systems. 2390–2395.
- Komiak (2003) Sherrie Yi Xiao Komiak. 2003. The impact of internalization and familiarity on trust and adoption of recommendation agents. Ph.D. Dissertation. University of British Columbia.
- Kouki et al. (2019) Pigi Kouki, James Schaffer, Jay Pujara, John O’Donovan, and Lise Getoor. 2019. Personalized explanations for hybrid recommender systems. In Proceedings of the 24th International Conference on Intelligent User Interfaces. 379–390.
- Kulesza et al. (2015) Todd Kulesza, Margaret Burnett, Weng-Keen Wong, and Simone Stumpf. 2015. Principles of explanatory debugging to personalize interactive machine learning. In Proceedings of the 20th international conference on intelligent user interfaces. 126–137.
- Kulesza et al. (2013) Todd Kulesza, Simone Stumpf, Margaret Burnett, Sherry Yang, Irwin Kwan, and Weng-Keen Wong. 2013. Too much, too little, or just right? Ways explanations impact end users’ mental models. In 2013 IEEE Symposium on visual languages and human centric computing. IEEE, 3–10.
- Kunkel et al. (2021) Johannes Kunkel, Thao Ngo, Jürgen Ziegler, and Nicole Krämer. 2021. Identifying Group-Specific Mental Models of Recommender Systems: A Novel Quantitative Approach (submitted). (2021).
- Lee and Turban (2001) Matthew KO Lee and Efraim Turban. 2001. A trust model for consumer internet shopping. International Journal of electronic commerce 6, 1 (2001), 75–91.
- Lim and Dey (2009) Brian Y Lim and Anind K Dey. 2009. Assessing demand for intelligibility in context-aware applications. In Proceedings of the 11th international conference on Ubiquitous computing. 195–204.
- Lins de Holanda Coelho et al. (2020) Gabriel Lins de Holanda Coelho, Paul HP Hanel, and Lukas J. Wolf. 2020. The very efficient assessment of need for cognition: Developing a six-item version. Assessment 27, 8 (2020), 1870–1885.
- McKnight et al. (2002) D Harrison McKnight, Vivek Choudhury, and Charles Kacmar. 2002. Developing and validating trust measures for e-commerce: An integrative typology. Information systems research 13, 3 (2002), 334–359.
- Millecamp et al. (2019) Martijn Millecamp, Nyi Nyi Htun, Cristina Conati, and Katrien Verbert. 2019. To explain or not to explain: the effects of personal characteristics when explaining music recommendations. In Proceedings of the 24th International Conference on Intelligent User Interfaces. 397–407.
- Miller (2019) Tim Miller. 2019. Explanation in artificial intelligence: Insights from the social sciences. Artificial Intelligence 267 (2019), 1–38.
- Mohseni et al. (2018) Sina Mohseni, Niloofar Zarei, and Eric D Ragan. 2018. A Multidisciplinary Survey and Framework for Design and Evaluation of Explainable AI Systems. arXiv (2018), arXiv–1811.
- Nunes and Jannach (2017) Ingrid Nunes and Dietmar Jannach. 2017. A systematic review and taxonomy of explanations in decision support and recommender systems. User Modeling and User-Adapted Interaction 27, 3-5 (2017), 393–444.
- Putnam and Conati (2019) Vanessa Putnam and Cristina Conati. 2019. Exploring the Need for Explainable Artificial Intelligence (XAI) in Intelligent Tutoring Systems (ITS).. In IUI Workshops, Vol. 19.
- Szymanski et al. (2021) Maxwell Szymanski, Martijn Millecamp, and Katrien Verbert. 2021. Visual, textual or hybrid: the effect of user expertise on different explanations. In 26th International Conference on Intelligent User Interfaces. 109–119.
- Tintarev and Masthoff (2008) Nava Tintarev and Judith Masthoff. 2008. The effectiveness of personalized movie explanations: An experiment using commercial meta-data. In International Conference on Adaptive Hypermedia and Adaptive Web-Based Systems. Springer, 204–213.
- Tintarev and Masthoff (2011) Nava Tintarev and Judith Masthoff. 2011. Designing and evaluating explanations for recommender systems. In Recommender systems handbook. Springer, 479–510.
- Tintarev and Masthoff (2012) Nava Tintarev and Judith Masthoff. 2012. Evaluating the effectiveness of explanations for recommender systems. User Modeling and User-Adapted Interaction 22, 4-5 (2012), 399–439.
- Tintarev and Masthoff (2015) Nava Tintarev and Judith Masthoff. 2015. Explaining recommendations: Design and evaluation. In Recommender systems handbook. Springer, 353–382.
- Wang and Benbasat (2007) Weiquan Wang and Izak Benbasat. 2007. Recommendation agents for electronic commerce: Effects of explanation facilities on trusting beliefs. Journal of Management Information Systems 23, 4 (2007), 217–246.
- Yang et al. (2020) Fumeng Yang, Zhuanyi Huang, Jean Scholtz, and Dustin L Arendt. 2020. How do visual explanations foster end users’ appropriate trust in machine learning?. In Proceedings of the 25th International Conference on Intelligent User Interfaces. 189–201.
- Zhang and Chen (2018) Yongfeng Zhang and Xu Chen. 2018. Explainable recommendation: A survey and new perspectives. arXiv preprint arXiv:1804.11192 (2018).
- Zhao et al. (2019) Ruijing Zhao, Izak Benbasat, and Hasan Cavusoglu. 2019. Do users always want to know more? Investigating the relationship between system transparency and users’ trust in advice-giving systems. In Proceedings of the 27th European Conference on Information Systems.