Transmission ERDA of ubiquitous deuterium in H-containing materials
Hiroshi Kudo1
***Corresponding author E-mail address: kudo@tac.tsukuba.ac.jp
, Hiroshi Naramoto1, Masao Sataka1, Satoshi Ishii1, Kimikazu Sasa1,2, Shigeo Tomita2
1CRiES, University of Tsukuba, 1-1-1 Tennodai, Tsukuba, Ibaraki 305-8577, Japan
2Institute of Pure and Applied Sciences, University of Tsukuba, 1-1-1 Tennodai, Tsukuba, Ibaraki 305-8571, Japan
ABSTRACT
Transmission-type elastic recoil detection analysis (T-ERDA) using 8.02 MeV He has been successfully applied to determine the concentration of ubiquitous deuterium in mylar and PPS films, both containing hydrogen as a component. The determined D/H ratios of and for mylar and PPS, respectively, are only slightly deviated from the Standard Mean Ocean Water value of . These results indicate potential sensitivity of T-ERDA for analysis of the variation of ubiquitous deuterium in hydrogen-containing materials. Such deuterium analysis might be useful for unique characterization of not only natural, but also synthesized hydrogen-containing materials.
I Introduction
The hydrogen isotope D (deuterium, 2H), mixed in H (protium, 1H), has been of particular significance in astrophysics [1][2] and geoscience [3][4], because the ratio of D to H content in matter (so-called D/H ratio) provides information about the formation process of the Solar System. The D/H ratio is changeable, for example, it increases if there are natural or artificial processes at work that concentrate it, such as distillation (because of higher boiling point of D-water than that of H-water) or electrolysis of water [5]. Change in the D/H ratio is expected to occur in H-containing materials chemically synthesized on the earth, in which ubiquitous, i.e., naturally mixed, D is contained inherently. The D/H ratio seems to be a very similar fraction on the order of . The similar ratio is expected to be observed, for example, for synthetic resin containing H as a component. It is likely that analysis of ubiquitous D can be used to characterize synthesized materials.
The recently developed T-ERDA for H is probably used for analysis of ubiquitous D in a thin solid sample if the background signals can be reduced enough to identify D signals [6][7], The major advantage of T-ERDA is that for both H and D the recoil cross sections at a recoil angle of 0∘ are enhanced to as large as 1–2 b/sr for projectile 4He energy of 8–10 MeV [8][9][10], which allows detection of trace amount of D and, accordingly, determination of the D/H ratio. Furthermore, T-ERDA requires no reference sample in the analysis procedure [7]. This feature is in contrast to the reported case of coincidence ERDA applied to the analysis of H and D in meteorite and mineral samples [11]. On the basis of these characteristic aspects of T-ERDA, the purpose of the present study is to investigate the applicability of T-ERDA to the trace amount of D, i.e., on the order of D/H , in an H-containing material.
II Experiments
The samples used in the present experiments are thin H-containing films of mylar (polyethylene terephthalate, (C10H8O) of 2.5 m thickness, and PPS (polyphenylene sulfide, (C6H4S)n) of 1.35 m thickness. These chemically synthesized products were chosen as typical samples containing hydrogen. The PPS sample was cut from the same sheet as that previously used in the quantitative H analysis by T-ERDA [7]. The mylar and PPS films are underlaid with a Ni foil of 20 or 25 m thickness to prevent the incident He from entering the particle detector. In this paper, the samples are labeled as mylar/Ni(20), PPS/Ni(20), and PPS/Ni(25), where the numbers in the parentheses denote the thicknesses in m.
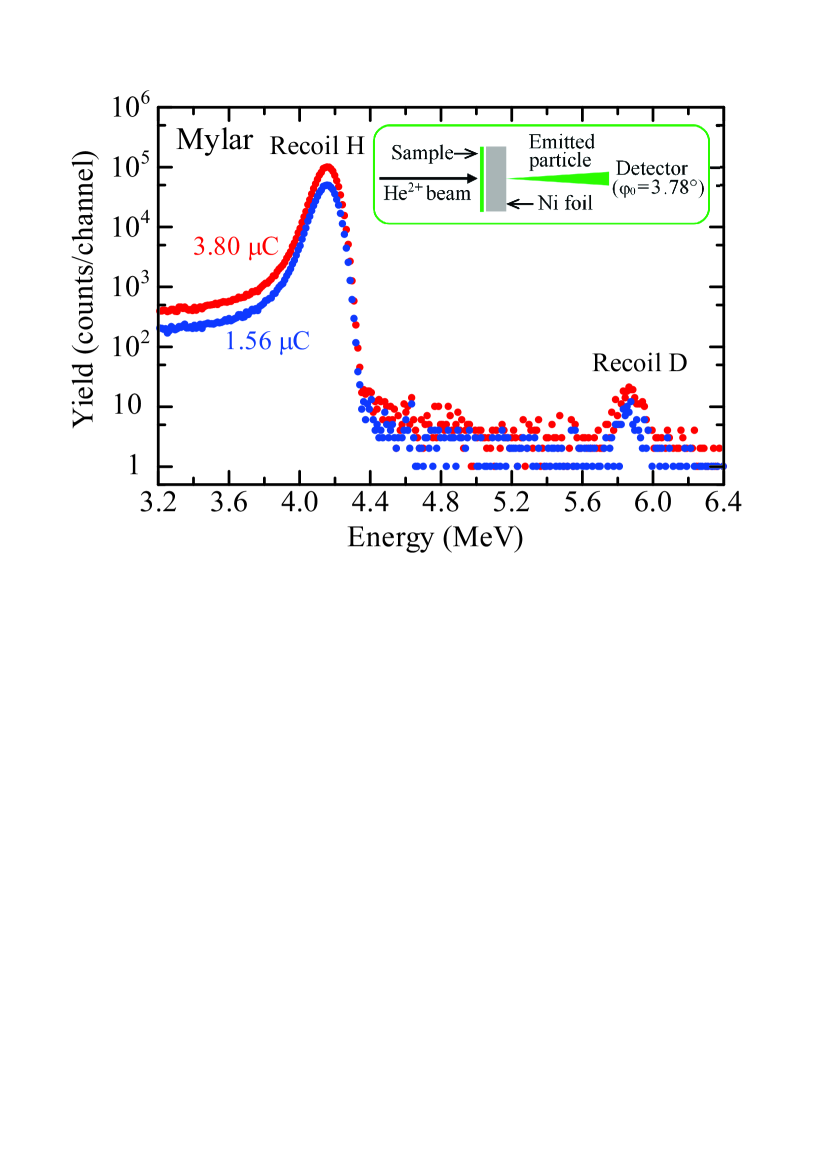
The experimental setup is similar to that described previously [7]. By using an incident beam of 8.02 MeV 4He2+ from the UTTAC 6MV tandem accelerator, the experiments were carried out under the pressure of Pa. The beam was focused typically to 0.10.1 mm2 on the samples. The energy-measuring system was calibrated with 5.48 MeV particles emitted from 241Am. The energies of recoil H and D were measured after passing through the Ni foil mainly by the surface-barrier silicon detector of 33 keV resolution for 5 MeV particles, which accepts an angular range of 0 to , see the inset of Fig. 1. In a few cases, a pin-photodiode detector was successfully used for collecting the data. It is noted that the estimated angular spread of the incident He2+ beam is 0.2∘, which is much less than .
The beam current was frequently monitored during the measurements by the Faraday cup attached to the sample holder. The integrated beam current (incident charge) for 15 minutes was measured repeatedly with a current integrator, from which the typical uncertainty of the incident charge % was obtained. The T-ERDA spectra were accumulated for 15–60 min for the He2+ beam current of 0.5–0.7 nA. Sometimes, short-time measurements for fresh beam spots on the sample were repeated two or three times and, after confirming the reproducibility, these spectra were summed up to obtain the final data. This is because the H content in mylar and PPS decreases appreciably by the He2+ irradiation under the present experimental conditions, which will be noted in §III.1.
III Results and discussion
III.1 Ratio of D to H yield
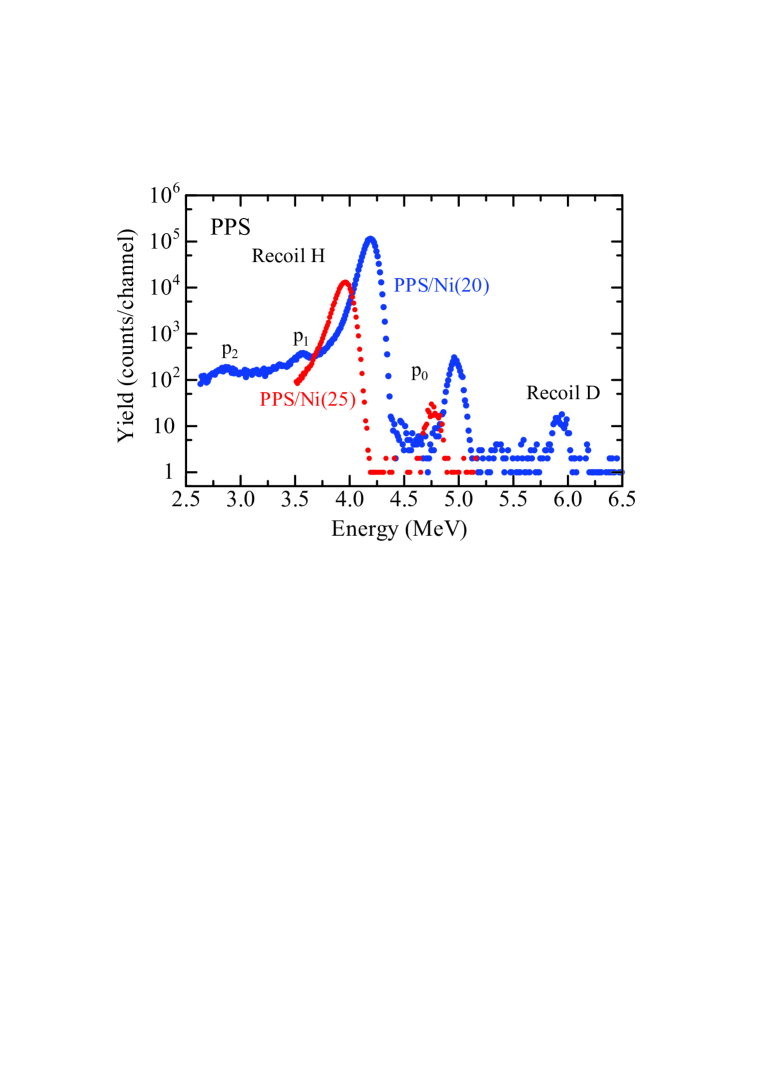
Figure 1 shows T-ERDA spectra of the mylar/Ni(20) sample, measured for the incident He2+ charges of 1.56 and 3.80 C. The two spectra are shown to confirm the appearance of a small peak at 5.87 MeV. From the estimate based on the stopping powers by SRIM [12], the two peaks at 4.16 and 5.87 MeV are identified as recoil H and D from the mylar film, respectively. Figure 2 shows T-ERDA spectra of the PPS/Ni(20) and PPS/Ni(25) samples, measured for the incident He2+ charges of 4.00 and 0.90 C, respectively. For PPS/Ni(20), the two peaks at 4.19 and 5.93 MeV are due to recoil H and D, respectively, from the PPS film, according to the similar estimate as for mylar/Ni(20). It is noteworthy that in Figs. 1 and 2 the D peaks have been successfully observed on the suppressed background yield by adopting the Ni foil of higher Coulomb barrier than that of the Al foil used previously. The prominent peak at 4.97 MeV and relatively small peaks at 3.6 and 2.9 MeV will be discussed in III.3 by referring to the spectrum of PPS/Ni(25), in which the observed peak energies shift to the low-energy side because of the increased thickness of Ni by 5 m.
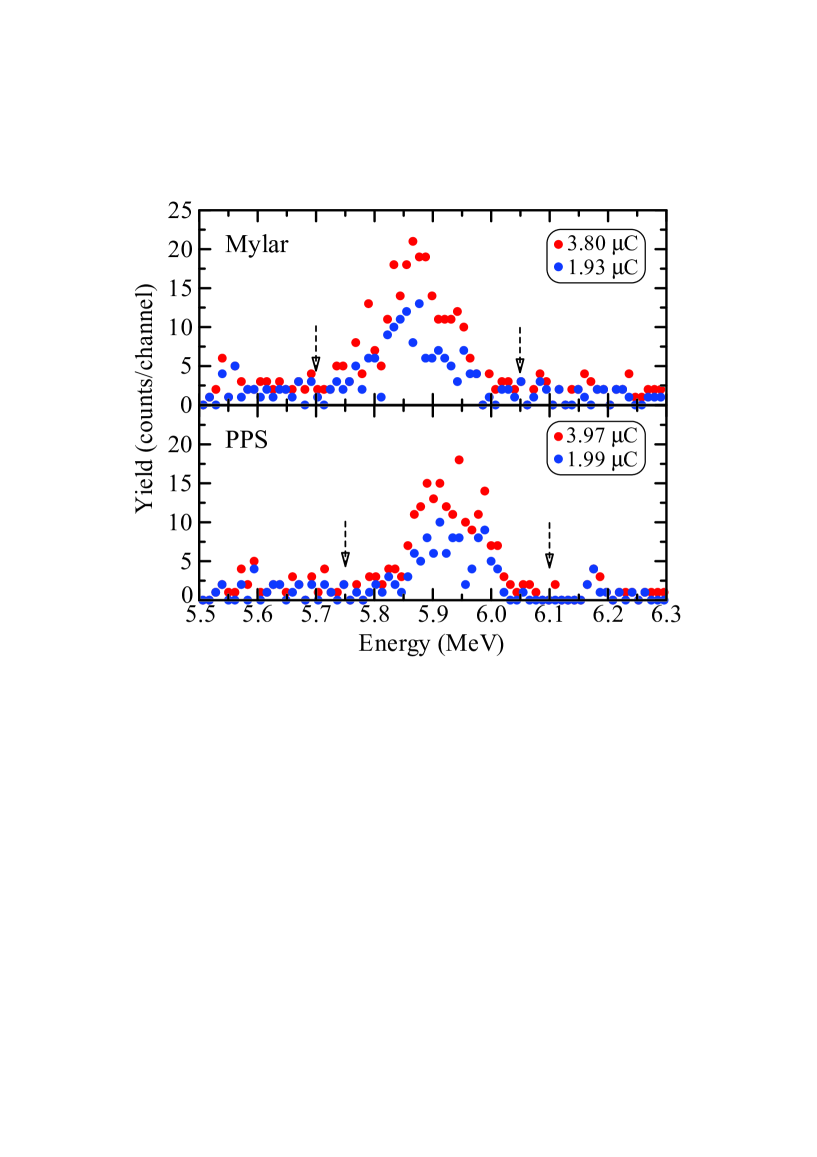
From the T-ERDA spectra, D and H yields are obtained from the areas under the peaks after subtracting the discernible background yield in Figs. 1 and 2. The background subtraction has been carried out by using the straight baseline connecting the low- and high-energy background levels of each peak, which were obtained by averaging the yield over the 0.05 MeV range of the assumed low- and high-energy ends of the peak. Note that such ends of the peak are clearly recognized in every spectrum plotted in the linear scale, as shown for the D peaks in Fig. 3.
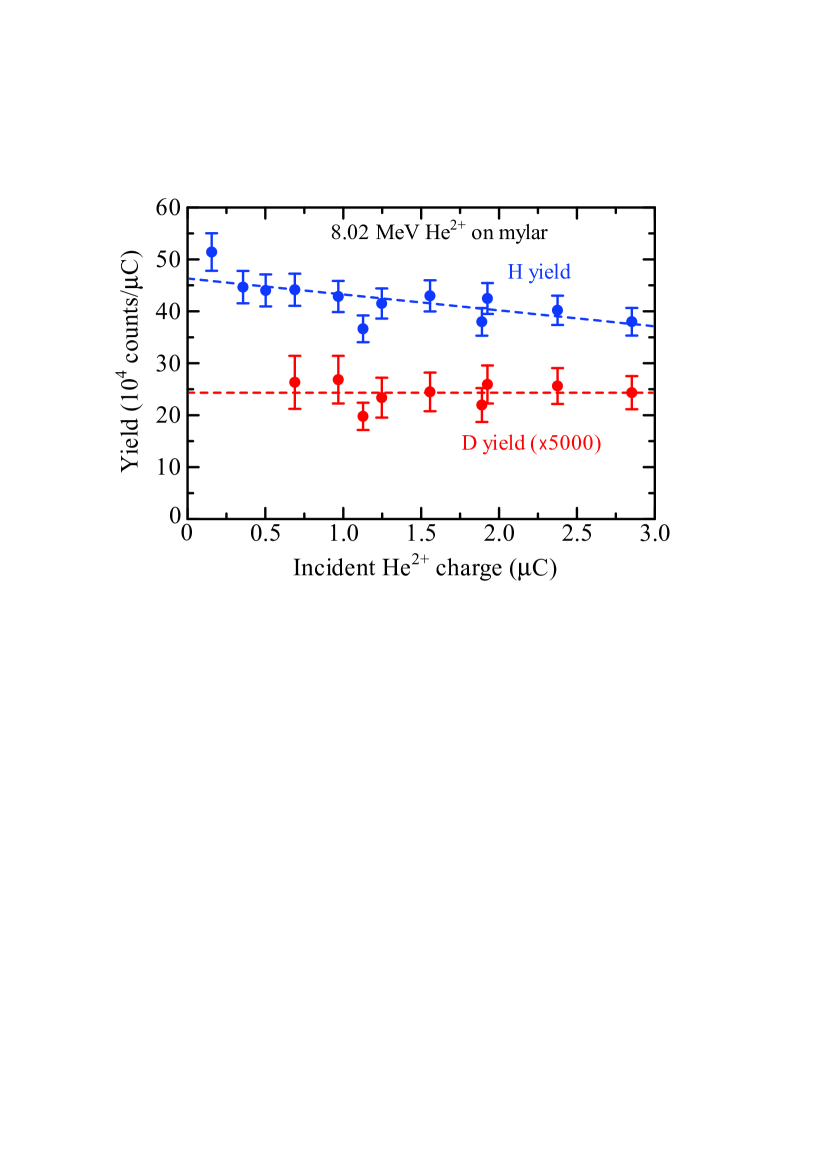
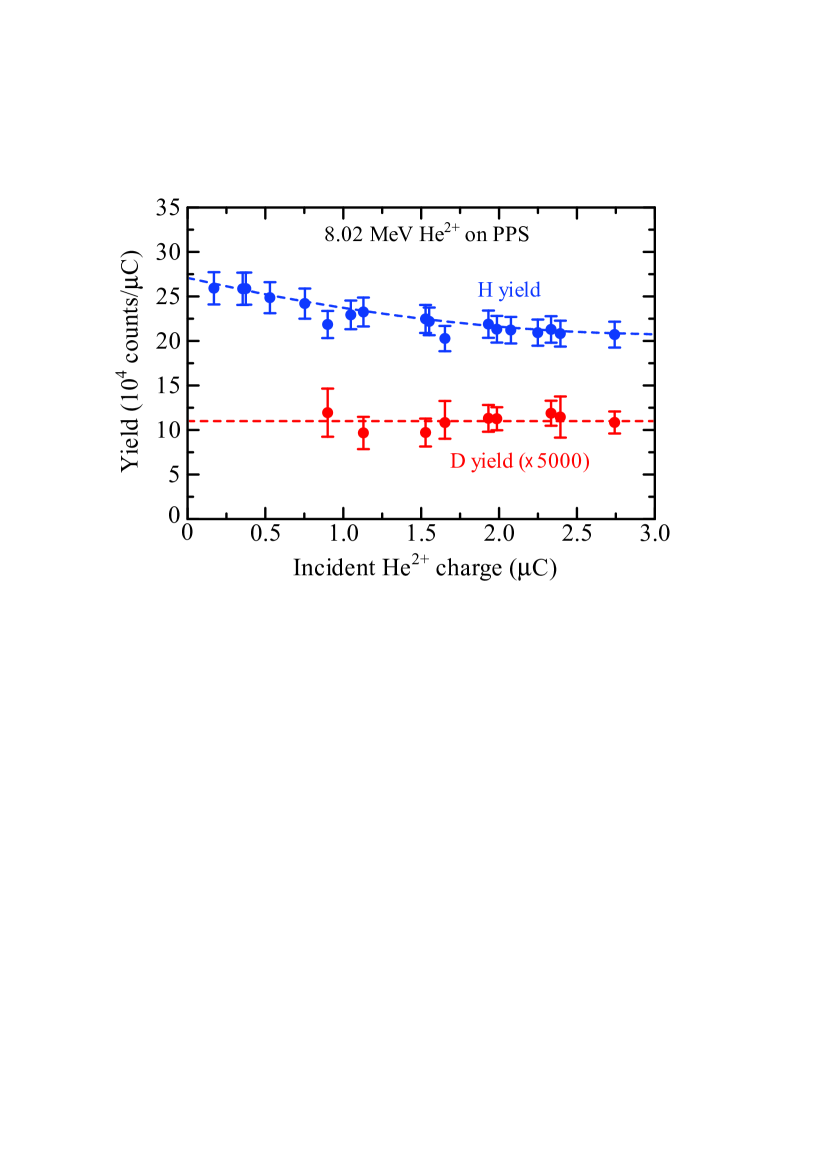
Figures 4 and 5 show dependence of the H and D yields on the incident He2+ charge on mylar and PPS, respectively. The vertical axes in counts/C represent the yields normalized to the incident charge, which were obtained from the measured yields typically on the order of 102 and 106 counts for D and H, respectively. The error bars of the D yield are predominantly due to the uncertainty arising from the limited counts of the yield (statistical uncertainty), while those of the H yield are mainly due to the stability of the incident He2+ charge (% noted in §II).
In Figs. 4 and 5, we see appreciable decrease of the H yield with increasing the incident He2+ charge. Such radiation-induced loss of H has been already reported for mylar [13], and for PPS [14]. In contrast to the H yield, the D yield seems to remain unchanged up to 3.0 C. It is notable that such immobile behavior of deuterium under irradiations of ions of MeV energies has been reported for deuterated polystyrene films [15]. Irrespective of such different behavior of H and D, the quantity needed in the present analysis is the ratio of D to H yield in the limit of zero incident He2+ charge. The values of can be determined from the extrapolated yield onto the vertical axes in Figs. 4 and 5. Actually, the dashed lines shown in Figs. 4 and 5 were used for the extrapolation. For mylar and PPS, the dashed lines for the D yield show the average of the measured values plotted in Figs. 4 and 5, and therefore, the statistical errors of result from the total, rather than individual, values of the D yield. The values of thus obtained are listed in Table 1.
| Sample | () | D/H ratio () | D concentration (atoms/cm3) |
|---|---|---|---|
| Mylar | 1.04 0.05 | 1.60 0.08 | |
| PPS | 0.82 0.05 | 1.23 0.08 |
III.2 D/H ratio
The D/H ratios can be determined from the measured values of . Actually, we may write
| (1) |
where and are the recoil cross sections in the laboratory system for H and D, respectively, which are given by integrating the differential recoil cross sections over the solid acceptance angle of the detector .
In the present narrow angular range of acceptance from 0 to , for H can be assumed to be constant. Actually, it varies only 2% or less, according to the numerical table given by IBANDL [8]. Similar behavior of for D is expected from a few available experimental data [10]. Therefore, the ratio of to in Eq. (1) can be replaced by the corresponding ratio of at a representative value of the recoil angle less than . For D, we may use the experimental data by Galonsky and coworkers [9], from which at a recoil angle of 3.2∘ can be obtained by coordinate transformation from their deuteron–4He differential scattering cross sections at 173.6∘ in the center of mass system.
In the above procedure, the He2+ energies to be considered are not only 8.02 MeV at the surfaces of the films, but also 7.81 and 7.92 MeV at the backsurfaces of the mylar and PPS films, respectively. The values of at 3.2∘ obtained for D are 1.28, 1.19, and 1.11 b/sr †††The corresponding values in the center of mass system, given in [9], are 0.320, 0.296, and 0.276 b/sr, respectively. for the He2+ energies of 8.02, 7.92, and 7.81 MeV, respectively, while the corresponding values for H from IBANDL are 1.87, 1.83, and 1.79 b/sr, respectively. Therefore, we obtain , 1.54, and 1.63 for He energies of 8.02, 7.92, and 7.81 MeV, respectively. By taking into account the small energy losses of He when passing through the mylar and PPS films, the suitable values of to be used are and for mylar and PPS, respectively. The values of D/H obtained from Eq. (1) are summarized in Table 1, together with the corresponding D concentrations obtained using known concentrations of H in mylar and PPS ( and cm-3, respectively). It is noted that the uncertainty of 2.2% in the experimental cross sections by Galonsky and coworkers is only a minor factor in determining the D/H ratios.
The determined values of D/H in the mylar and PPS films are slightly deviated from the Standard Mean Ocean Water (V-SMOW) value of [16]. To discuss such deviation from the V-SMOW value, accumulation of T-ERDA data with higher sensitivity than in the present case is required. Nevertheless, the present work has confirmed the wide applicability of T-ERDA to non-destructive determination of D/H ratios in solids.
Considering the whole analysis procedure to determine the D/H ratios in Table 1, we recognize that the advantageous features of T-ERDA is certainly due to the one-dimensional layout of the measurement. This simplifies the analysis procedure, for example, the constant discussed before, hence allows to determine the D/H values without using a reference sample. In the present T-ERDA, the uncertainties of the D concentrations noted in Table 1 corresponds to the sensitivity to the amount of D, i.e., D/cm3. Typically, the sensitivity is limited by the background yield under the D peak in the spectrum, which stems mainly from nuclear reactions occurring in the sample.
III.3 (4He, p) reaction of 32S
We see in Fig. 2 that the prominent peak at 4.97 MeV shifts to 4.77 MeV for PPS/Ni(25), hence the stopping power of Ni is estimated as keV/m. This value agrees with the stopping power for 5 MeV protons, hence the peak of interest is due to the protons produced possibly by a nuclear reaction in PPS. Indeed, the protons result from the 32S(4He, pCl reaction with the Q value equal to MeV [17], where the subscript of p0 represents the p-emission with the nuclear transition to the ground level of 35Cl.
By considering the energy-loss processes of incident He and p0 protons in PPS/Ni(20), the conservation of momentum and energy including the Q value concludes that the p0 yield appears at 4.96–5.06 MeV. The energy width of 0.10 MeV originates from the energy difference of He at the surface and the backsurface of PPS of 1.35 m thickness, mentioned in §III.2. Similarly, the corresponding energies for protons of p1 and p2 which result from transitions to the first (1.22 MeV) and the second (1.76 MeV) excited levels of 35Cl are 3.58–3.69 and 2.95–2.99 MeV, respectively. These values certainly reproduce the observed peak energies.
It is important to note that even a 50 keV shift of the 4He energy causes a considerable change in the reaction cross section of 32S(4He, pCl [18]. Because the energy of He in collision with S is in the range of 100 keV (7.92–8.02 MeV) in the PPS film (§III.2), the observed three peaks cannot be directly related to the reaction cross section as a function of He energy.
IV Conclusions
The D/H ratios of mylar and PPS films have been determined by T-ERDA without using a reference sample. The D/H ratios obtained are only slightly deviated from the Standard Mean Ocean Water (V-SMOW) value (1.55), indicating potential sensitivity of the present T-ERDA for analysis of the variation of ubiquitous deuterium in hydrogen-containing materials. Since D/H ratios should reflect chemically synthesized processes experienced by the H-containing materials, T-ERDA might lead to unique characterization of not only natural, but also synthesized H-containing materials. As a D-sensitive analysis technique, T-ERDA will be also useful for development of materials with a controlled amount of deuterium. For analysis of spatial distribution of D in a foil sample, we may also make use of three-dimensional T-ERDA [19], if necessary.
ACKNOWLEDGEMENTS
The authors thank the technical staff of UTTAC for operating the
6MV tandem accelerator and Toray KP Films Inc. for providing the PPS films.
This work was supported in part by JSPS KAKENHI (Grant Number 23K17873) for
K. Sasa and S. Tomita.
References
- [1] F. Robert, Solar System Deuterium/Hydrogen Ratio METEORITES AND THE EARLY SOLAR SYSTEM II (The University of Arizona Space Science Series) 341–351 ed. Dante S. Lauretta and Harold Y. McSween Jr. (Tucson, Arizona: The University of Arizona Press, 2006)
- [2] H. Genda, M. Ikoma, Icarus 194 (2008) 42.
- [3] C. Lécuyer, P. Gillet, F. Robert, Chem. Geol. 145 (1998) 249.
- [4] M. M. Lehmann, P. Schuler, M. A. Cormier, S. T. Allen, M. Leuenberger, S. Voelker (2022). The Stable Hydrogen Isotopic Signature: From Source Water to Tree Rings. In: R. T. W. Siegwolf, J. R. Brooks, J. Roden, M. Saurer (eds) Stable Isotopes in Tree Rings. Tree Physiology, vol 8. Springer, Cham. https://doi.org/10.1007/978-3-030-92698-4 11
- [5] G. N. Lewis and R. T. Macdonald, J. Chem. Phys. 1 (1933) 341. https://doi.org/10.1063/1.1749300
- [6] H. Kudo, H. Naramoto, M. Sataka, S. Ishii, K. Sasa, S. Tomita, J. Phys.: Condens. Matter 33 (2021) 465901.
- [7] H. Kudo, M. Kurosawa, H. Naramoto, M. Sataka, S. Ishii, K. Sasa, S. Tomita, J. Phys.: Condens. Matter 34 (2022) 435902.
- [8] IBANDL (Ion Beam Analysis Nuclear Data Library). https://www-nds.iaea.org/exfor/ibandl.htm
- [9] A. Galonsky, R. A. Douglas, W. Haeberli, M. T. McEllistrem, H. T. Richards, Phys. Rev. 98 (1955) 586.
- [10] R. Ishigami, Y. Ito, K. Yasuda, M. Sasase, S. Nishio, S. Hatori, J. Nucl. Sci. Technol. 41 (2004) 953.
- [11] L. Ros, P. Kristiansson, M. Borysiuk, N. Abdel, M. Elfman, E. J. C. Nilsson, J. Pallon, Nucl. Instrum. Meth. Phys. Res. B 348 (2015) 273.
- [12] J. F. Ziegler, J. P. Biersack, SRIM2013, The Stopping and Range of Ions in Matter http://www.srim.org/
- [13] M. Hacke, J. Meijer, A. Stephan, H. H. Bukow, M. Höfert, C. Rolfs, Z. Phys. A 346 (1995) 309.
- [14] A. Kinomura, S. Nakao, K. Suzuki, Y. Kuzuya, M. Nakajima, K. Yasuda, Nucl. Instrum. Meth. Phys. Res. B 502 (2021) 54.
- [15] F. Abel, V. Quillet, M. Schott, Nucl. Instrum. Meth. Phys. Res. B 266 (1995) 86.
- [16] J. C. De Wit, C. M. van der Straaten, W. G. Mook, Geostand Geoanal Res 4 (1980) 33. https://doi.org/10.1111/j.1751-908X.1980.tb00270.x
- [17] P. Mohr, Eur. Phys. J. A 51 (2015) 56. DOI 10.1140/epja/i2015-15056-5
- [18] M. Soltani-Farshi, J. D. Meyer, P. Misaelides, K. Bethge, Nucl. Instrum. Meth. Phys. Res. B 113 (1996) 399.
- [19] A. Yamazaki, K. Sasa, S. Tomita, S. Ishii, H. Naramoto, M. Sataka, H. Kudo, G. Itoh, M. Ohkubo, AIP Advances 9 (2019) 105111.