Origin of high-velocity ejecta and early red excess emission in the infant Type Ia supernova 2021aefx
Abstract
SN 2021aefx (catalog ) is a normal Type Ia Supernova (SN) with red excess emission over the first 2 days. We present detailed analysis of this SN using our high-cadence KMTNet multi-band photometry, spectroscopy, and publicly available data. We provide the first measurements of its epochs of explosion (MJD 59529.32 0.16) as well as “first light’ (MJD 59529.85 0.55) associated with the main ejecta distribution. This places our first detection of SN 2021aefx at 0.5 hours since “first light’, indicating the presence of additional power sources. Our peak-spectrum confirms its Type Ia sub-classification as intermediate between Core-Normal and Broad-Line, and we estimate the ejecta mass to be 1.34 . The pre-peak spectral evolution identifies fast-expanding material reaching 40,000 km s-1 (the fastest ever observed in Type Ia SNe) and at least two distinct homologously-expanding ejecta components: (1) a normal-velocity (12,400 km s-1) component consistent with the typical photospheric evolution of Chandrasekhar-mass ejecta; and (2) a high-velocity (23,500 km s-1) component visible during the first 3.6 days post-explosion, which locates the component within the outer 16% of the ejecta mass. Asymmetric, subsonic explosion processes producing a non-spherical photosphere provide an explanation for the simultaneous presence of the two components, as well as the red excess emission via a slight enrichment in the outer 0.5% of the ejecta mass. Our spectrum from 300 days post-peak advances the constraint against non-degenerate companions and further supports a near-Chandrasekhar-mass explosion origin. Off-center ignited delayed-detonations of Chandrasekhar-mass white dwarfs may be responsible for the observed features of SN 2021aefx in some normal Type Ia SNe.
1 Introduction
Type Ia supernovae (SNe) are thought to be from white dwarf (WD) stars that explode as a result of mass transfer in binary systems. They are the main producers of iron-peak elements in the Universe (Matteucci, 2012) and a crucial tool for measuring cosmological distances, leading to the discovery of the accelerated cosmological expansion and dark energy (Riess et al., 1998; Perlmutter et al., 1999). Despite the extensive effort to understand their origins, the details of the Type Ia SNe explosion process remain poorly understood (Maoz et al., 2014), especially for the majority class of “normal” Type Ia SNe comprising 70% of the entire Type Ia SN population (Blondin et al., 2012) that is most widely used for cosmological distance measurements (Wang et al., 2009; Zhang et al., 2021). This includes the nature of the companion star (Whelan & Iben, 1973; Iben & Tutukov, 1984; Aznar-Siguán et al., 2015), the mass transfer process (Guillochon et al., 2010; Pakmor et al., 2012; Kushnir et al., 2013), the method of core carbon ignition (Hoeflich et al., 1995; Polin et al., 2019; Townsley et al., 2019; Shen et al., 2021), non-spherical symmetry (Maeda et al., 2010b; Boos et al., 2021), and the distribution of in the outer layers (Piro & Nakar, 2014; Magee et al., 2020; Ni et al., 2022), just to name a few. Furthermore, how these properties and processes relate to the differences between the two main subtypes of normal Type Ia SNe (Parrent et al., 2014)–“Core-Normal/Normal-Velocity” (CN/NV) and “Broad-Line/High-Velocity” (BL/HV)–and the explosion mass of the WD progenitor–Chandrasekhar-mass ( 1.4 Mazzali et al., 2007) or sub/super-Chandrasekhar-mass (Scalzo et al., 2019; Brown et al., 2014)–cast another challenge in our understanding of Type Ia SN origins.
Of particular interest are the origins of excess emission and high-velocity silicon and calcium lines seen in the early phases, and their relation to the Type Ia SN explosion mechanisms and progenitor systems. Excess emission has been identified within 5 days post-explosion in a few normal events (Marion et al., 2016; Hosseinzadeh et al., 2017; Jiang et al., 2018, 2021; Sai et al., 2022; Deckers et al., 2022; Dimitriadis et al., 2019, 2023), and high-velocity Si II and Ca II features, which are faster than the normal photospheric velocities by 7,000 km s-1 (Wang et al., 2003; Gerardy et al., 2004; Quimby et al., 2006; Marion et al., 2013; Silverman et al., 2015), have been observed in a number of normal events before -band maximum. In the case of the earliest Type Ia SN detected to date, SN 2018aoz, infant-phase excess emission during 1–12 hours since first light showed suppressed -band flux attributed to line-blanket absorption by surface iron-peak elements (Ni et al., 2022, 2023).
SN 2021aefx, which we study in detail in this paper based on new high-cadence, multi-band photometry, new spectra from critical epochs, as well as the data from previous studies, provides a rare opportunity for answering some of these questions, being a normal Type Ia SN with a prominent early excess emission in the first 2 days, possible high-velocity Si lines in the excess emission phase, but uncertain classification between the CN/NV and BL/HV subtypes (Ashall et al., 2022; Hosseinzadeh et al., 2022). Radio observations from 2–8 days and a late-phase (118 days since peak) spectrum rule out wind from a symbiotic binary progenitor and disfavours the presence of swept-up H, He, and O from the companion (Hosseinzadeh et al., 2022), while nebular-phase (255 and 323 days post-peak) spectra from the James Webb Space Telescope reveal offset ( 1000 km s-1) core velocities and unambiguous strong detections of stable lines, indicating an off-center ignited explosion (Kwok et al., 2023) of a massive WD ( 1.2 ; DerKacy et al., 2023).
Although these previous observations have provided important constraints on the origin and evolution of SN 2021aefx, some of the key parameters–such as the exact explosion epoch, reliable subtype classification at -band maximum, ejecta mass, and the nebular-phase ( 200 days since peak) constraint on swept-up H and He–remain to be estimated. The nature of its early optical excess emission and the presence of high-velocity Si also require further examination. In this paper, we provide estimations of these key parameters and conduct detailed investigations into the early excess emission and velocity evolution of SN 2021aefx. We describe our observations and data analysis in Section 2. Section 3 shows the characterization of the photospheric-phase evolution of the SN, including measurements of the epochs of first light and explosion and establishment of the presence of high-velocity Si lines before -band maximum, followed by Section 4 showing the peak-spectrum classification of SN 2021aefx and estimation of its ejecta mass using pseudo-bolometric luminosity. In Section 5, we investigate the nature of the observed early excess emission by modelling the predicted emission from heating processes and companion/CSM-ejecta interactions. In Section 6, we examine possible origins for the observed high-velocity Si lines, including ejecta with two distinct components (“split-velocity ejecta”), ejecta affected by a reverse-shock interaction, as well as ejecta with a local opacity enhancement, and find that the former is the most likely origin. In Section 7, based on our spectrum from the nebular phase, we diagnose the strength of Ca II emission to be incompatible with sub-Chandrasekhar-mass explosions and provide advanced upper limits on the presence of H, He, and O from the companion/CSM. Finally, we discuss the origin of the early excess emission and high-velocity lines observed in SN 2021aefx and their implications for the explosion mechanisms and progenitor systems of Type Ia SNe in Section 8.
2 Observations and Data Analysis
The discovery of SN 2021aefx was made by the Distance Less than 40 Mpc Survey (DLT40; Hosseinzadeh et al., 2022) at an unfiltered brightness of 17.24 mag at 12h14m Universal Time (UT) on November 11, 2021 (MJD 59529.343). A subsequent spectrum obtained by Southern African Large Telescope (SALT; Brown et al., 2013) at MJD 59529.872 was H-poor with broad Si II absorption features (Bostroem et al., 2021), identifying the source to be a Type Ia SN.
2.1 Photometry
We have conducted high-cadence, multi-color () monitoring observations of the field containing the spiral galaxy NGC 1566 using Korea Microlensing Telescope Network (KMTNet; Kim et al., 2016) as part of the KMTNet Supernova Program (Moon et al., 2016) optimized for detecting early SNe and transients (e.g., Afsariardchi et al., 2019; Moon et al., 2021; Lee et al., 2022; Ni et al., 2022, 2023). The KMTNet is composed of three 1.6-m telescopes all equipped with a wide-field CCD camera with 4 square degree field-of-view in Chile, South Africa, and Australia, providing 24-hour continuous sky coverage. Between November 1, 2021 and February 25, 2022, we obtained 1200 total images of the field with 60 s exposure time for individual frames reaching an average 3- detection limit of 21.3 mag. On average, one set of -band images were obtained every 7 hours. Compared to previously reported photometric observations of SN 2021aefx, our cadence is 3.4 and 1.7 higher than the multi-band cadence of Las Cumbres Observatory (LCO) and the All-Sky Automated Survey for Supernovae (ASAS-SN), respectively, and each of our images reach a 2 mag deeper detection limit than unfiltered DLT40 photometry (Hosseinzadeh et al., 2022; Ashall et al., 2022).
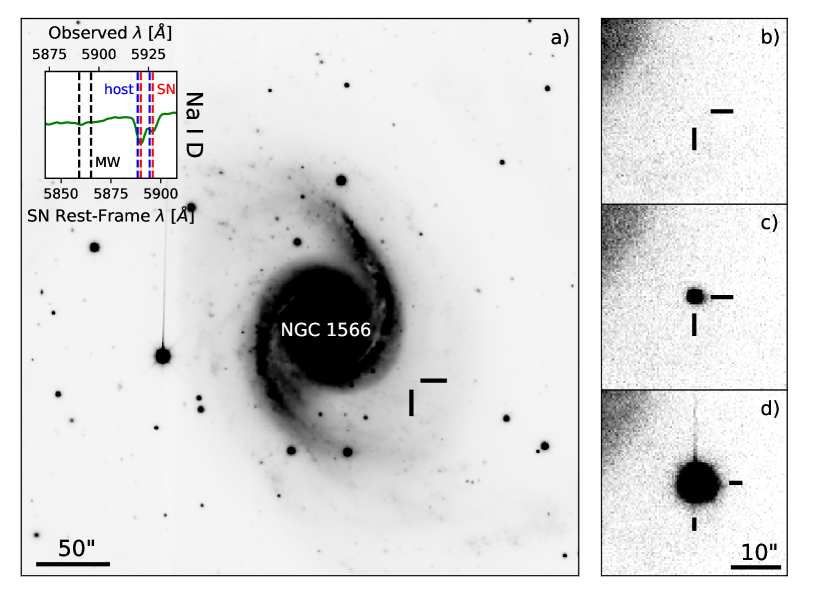
The first KSP detection of SN 2021aefx with signal-to-noise (S/N) 3 was made at 19h51m UT on November 11, 2021 (= MJD 59529.82709) in a -band image, followed by - and -band detections 2 and 4 minutes later, respectively. The initial -band***Note that the -band observations are calibrated to the Vega system, while the -band observations are calibrated to the AB system. We, therefore, use “” to refer to the KMTNet filter system, while we use “” to refer to their corresponding photometric magnitudes. apparent brightness of the source was 16.68 0.02, 16.51 0.02, and 16.84 0.02 mag, respectively. The source was not detected in any bands observed by the KSP during the last two epochs prior to this. At 0.98 days prior (= MJD 59528.85) to our first detection, we measured 3- detection limits of 16.88 mag in band and 18.20 mag in band, and at 1.99 days prior (= MJD 59527.84), we measured -band limits of 21.82, 21.46, and 21.59 mag, respectively. These substantially tighten the constraints on the last non-detection of the source compared to previous observations: 19.35 mag (unfiltered) at MJD 59524.33 and 17.70 mag (-band) at MJD 59527.36 from the DLT40 and ASA-SN Surveys (Valenti et al., 2021; Ashall et al., 2022), respectively. The source remained detected until February 25, 2022, after which it was too close to the Sun for continuous monitoring. The source attained peak apparent brightnesses of 11.98 in band, 11.90 in band, and 12.66 mag in band, on MJD 59546.94, 59549.33, and 59544.69, respectively. The average J2000 coordinate of the source is (, ) = (), consistent with the coordinates reported on the Transient Name Server†††https://www.wis-tns.org/object/2021aefx/. Figure 1 presents KMTNet images of the field where the measured position of the source is indicated with crosshairs. In the figure, panel (a) is an -band stacked image composed of images obtained before the SN explosion. Panels (b), (c), and (d) are the -band images from two days prior to first detection, first detection, and the maximum brightness, respectively.
Point-spread function (PSF) photometry of SN 2021aefx was performed using the SuperNova Analysis Package (SNAP)‡‡‡https://github.com/niyuanqi/SNAP, a custom python-based pipeline for supernova photometry and analysis. A local PSF was obtained by fitting a Moffat function (Moffat, 1969; Trujillo et al., 2001) to nearby reference stars and simultaneously fitting sky background emission with a first-order polynomial. We fit the flux of SN 2021aefx using this PSF, and the detection S/N of the source reported in this paper is equal to the best-fit flux divided by its 1- uncertainty. Photometric calibration was performed against more than 10 reference stars within 15′ distance from the source in the AAVSO Photometric All-Sky Survey§§§https://www.aavso.org/apass database whose apparent magnitudes are in the range of 15–16 mag. The observations in the KMTNet filters were calibrated against reference stars in the nearest AAVSO filters (Johnson , and Sloan ; or ).
The KSP instrumental magnitudes for the AAVSO reference stars were transformed to standard magnitudes using the equations from Park et al. (2017). However, the spectra of SNe, particularly after the peak, are significantly different from the AAVSO standard stars used to derive the transformation equations. In order to account for this, we applied spectrophotometric (S)–corrections, which are magnitude corrections between instrument and standard filters derived by performing synthetic photometry on spectra obtained at the same epoch (Stritzinger et al., 2002). For this, we used the optical spectra compiled in Hosseinzadeh et al. (2022) covering the epochs from 20h55m UT on November 11, 2021 (MJD 59529.872; 1.1 hours since the first KSP detection) until 11h30m UT on February 20, 2022 (MJD 59630.480; 4.6 days before the last KSP detection). The calibrated and S-corrected photometry is presented in Table 1, and the early light curves are shown in Figure 2.
| Date [MJD] | Band | Magnitudea | 1- (detection) | 1- (total)b | S/N |
|---|---|---|---|---|---|
| 59529.82709 | 16.678 | 0.016 | 0.019 | 69.3 | |
| 59529.82859 | 16.506 | 0.014 | 0.017 | 79.3 | |
| 59529.83008 | 16.842 | 0.012 | 0.017 | 91.7 | |
| 59530.82063 | 16.261 | 0.018 | 0.021 | 61.4 | |
| 59530.82198 | 15.682 | 0.015 | 0.018 | 74.1 | |
| 59530.82333 | 16.191 | 0.011 | 0.017 | 95.6 | |
| 59530.86225 | 16.256 | 0.017 | 0.020 | 65.2 | |
| 59530.86361 | 15.644 | 0.014 | 0.018 | 76.0 | |
| 59530.86512 | 16.156 | 0.011 | 0.016 | 101.2 |
Note. — The entire observed magnitudes are available in the electronic edition.
| Date (UT) | Phasea | Telescope | Instrument | R | Wavelength [Å] |
|---|---|---|---|---|---|
| 2021 November 28.12 | 0.5 days | Gemini S | GMOS | 1690 | 4000–10000 |
| 2022 January 20.20 | 52.3 days | Gemini S | GMOS | 1690 | 4000–10000 |
| 2022 September 27.37 | 302.1 days | Gemini S | GMOS | 1690 | 4000–10000 |
2.2 Spectroscopy
We obtained spectra of SN 2021aefx from three different epochs, including peak and nebular phase, using the Gemini Multi-Object Spectrograph (GMOS; Hook et al., 2004) on the 8m Gemini-South telescope. The observations are summarized in Table 2. The spectra were reduced using the custom gmos suite of IRAF tasks. Bias and flat-field corrections were performed on the two-dimensional frames, one-dimensional spectra were extracted, and wavelength calibration was performed using calibration lamps taken immediately after target exposures. Flux calibration was performed using the IRAF tasks standard and calibrate using photometric standards observed in the same filters. In our analysis below we supplement this data with publicly available spectroscopy from Hosseinzadeh et al. (2022).
2.3 Host Galaxy, Distance and Extinction
The host galaxy of SN 2021aefx is the nearby spiral galaxy NGC 1566 (the “Spanish Dancer”; Skrutskie et al., 2003) centered at (, ) = (), 12 (= 6.0 kpc) northeast of the position of SN 2021aefx (see Fig 1). The host galaxy redshift of = 0.005017 0.000007 (Allison et al., 2014) and the corresponding Hubble flow distance modulus (DM) of 31.40 0.15 mag in the cosmology of Riess et al. (2016) with corrections for peculiar velocities due to the Virgo Supercluster, Great Attractor, and Shapley Supercluster (Mould et al., 2000), as well as the Tully & Fisher (1977) distance of DM = 31.28 0.23 mag to NGC 1566 have been used in previous studies of SN 2021aefx (Ashall et al., 2022; Hosseinzadeh et al., 2022; Kwok et al., 2023). We adopt DM = 31.16 0.08 mag from Type Ia SN template fitting (see Section 2.4), corresponding to the luminosity distance of 17.06 0.63 Mpc, which is consistent with both the Tully & Fisher (1977) and Hubble flow distances within their uncertainties, but slightly more accurate.
SN 2021aefx suffers from relatively little Galactic extinction since it is located near the Galactic south pole with = 0.0079 0.0002 mag in its direction according to the extinction model of Schlafly & Finkbeiner (2011, S&F 2011). This corresponds to Galactic extinction corrections of 0.033, 0.025, and 0.016 mag in the , , and bands, respectively, using an = 3.1 Fitzpatrick (1999) reddening law. The inset of Figure 1 (a) shows our near-peak Gemini spectrum zoomed into the vicinity of the Na I D absorption lines at 5890 and 5896 Å associated with dust extinction. The lines are absent in the frame of the Milky Way (black vertical dashed lines), confirming the low value of Galactic extinction towards the direction of the SN, while they are prominently detected near the expected redshift of the host galaxy ( = 0.005017; blue vertical dashed lines).
We measure the host galaxy extinction in the vicinity of SN 2021aefx by fitting the equivalent widths of the Na I D lines with a Voigt doublet profile, assuming a Milky-Way-like correlation between Na I D and dust extinction (Poznanski et al., 2012). The mean of the measurements gives = 0.124 0.033 mag, consistent with the reported value of host galaxy extinction from 16 days post-peak (0.097 mag Hosseinzadeh et al., 2022). The mean redshift of the fitted line minima is = 0.005284 0.000005, which implies a SN peculiar velocity of (80.0 3.6) km s-1 in the frame of the host galaxy. Hereafter, we adopt = 0.005284 for the SN redshift since it is measured from the source position and more accurate, and we adopt the reported host galaxy extinction of = 0.097 based on the high resolution (R 40000) spectrum of Hosseinzadeh et al. (2022) because it has much smaller uncertainties.
2.4 Template Fitting Distance and K-correction
The light curves of normal Type Ia SNe in the photospheric phase from 10 to 15 days since -band maximum form a one-parameter family of functions, often parameterized by the Phillips parameter, , defined as the post-peak decline in -band magnitude between 0 and 15 days (Phillips et al., 1999). To include peculiar Type Ia SNe such as the rapidly evolving 91bg-like subtype, the stretch parameter defined by 30 days, where is the time between -band peak to the maximum post-peak color (Burns et al., 2014), has been used as an alternative to . We measure the distance to SN 2021aefx by fitting its -band light curves by Hosseinzadeh et al. (2022) with a normal Type Ia SN template based on Hsiao et al. (2007) using SNooPy (Burns et al., 2011), where the fitted parameters are , time of -band maximum (), and DM. In the fitting process, we applied –corrections between the observer- and rest-frame filter response functions (see below) and Galactic extinction corrections. The best-fit is obtained with , DM, and of MJD 59547.2 0.3, 31.16 0.08 mag, and 1.05 0.03 respectively, providing a reduced (= normalized by the number of degrees of freedom; ) of 5.5.
| Parameter | Value |
|---|---|
| (, ) (J2000) | () |
| Redshift () | 0.005284 0.000005 |
| KSP first detection: UT & MJD | 1951 on November 11, 2021 & MJD 59529.82709 |
| Peak apparent magnitude | 11.98 (), 11.90 (), 12.66 () mag |
| Apparent peak epochs | MJD 59546.94 (), 59549.33 (), 59544.69 () |
| Distance Modulus (DM) | 31.16 0.08 mag |
| Peak absolute magnitude | –19.56 (), –19.54 (), –18.66 () mag |
| Post-peak decline rate () | 0.89 0.08 mag |
| Color stretch parameter () | 1.00 0.04 |
| Rest-frame peak epochs | MJD 59546.67 ()a, 59549.22 (), 59544.70 () |
| Epoch of first light () | MJD 59529.85 0.55 |
| Early light curve power-law index () | 2.15 0.26 (), 1.58 0.19 (), 1.65 0.19 () |
| Explosion epoch () | MJD 59529.32 0.16 |
| (Si II 6355 Å) | (12.44 0.02) 103 km s-1 |
| pEWpeak (Si II 6355 Å) | 100.3 1.0 Å |
| pEWpeak (Si II 5972 Å) | 12.7 0.5 Å |
| Peak bolometric luminosity () | (1.54 0.02) 1043 erg s-1 |
| Bolometric peak epoch | MJD 59545.86 0.21 days |
| Bolometric post-peak decline rate () | 0.75 0.04 mag |
| mass () | 0.631 0.009 |
| parameter | 11.80 0.31 days |
| Ejecta mass () | 1.34 0.07 |
| Ejecta kinetic energy () | (1.24 0.07) 1051 erg |
Note. — All time/date values except for are given in the observer frame.
We measure –corrections between the observer and rest-frame filter response functions for the KSP light curves of SN 2021aefx by performing a separate SNooPy fit, replacing the -band light curves with those from the KSP. In this fit, we fix the distance modulus to be be 31.16 mag, obtaining the best-fit template with and of MJD 59547.5 0.3 and 1.14 0.03 respectively, with = 7.71. We derive rest-frame magnitudes for SN 2021aefx by applying the –corrections from this best-fit template, DM = 31.16 mag, and Galactic extinction correction. Note that the –corrections are insubstantial ( 0.025 mag) given the relatively small redshift of the SN. With these rest-frame light curves, we used polynomial fitting to measure the peak absolute magnitudes of each -band light curve to be 19.56 0.02, 19.54 0.03, and 18.66 0.03 mag, respectively. The K-corrected -band light curves each attained their peaks at MJD 59546.67 0.67, 59549.22 0.68, and 59544.70 0.89 days (in the observer frame), respectively. We also measured the Phillips parameter and color stretch parameter to be = 0.89 0.08 mag and = 1.00 0.04, respectively. These parameters obtained from the KSP light curves are consistent with the range of what has been reported in other studies of SN 2021aefx (Ashall et al., 2022; Hosseinzadeh et al., 2022). The parameters of SN 2021aefx measured in this section and others are summarized in Table 3.
3 Early Evolution
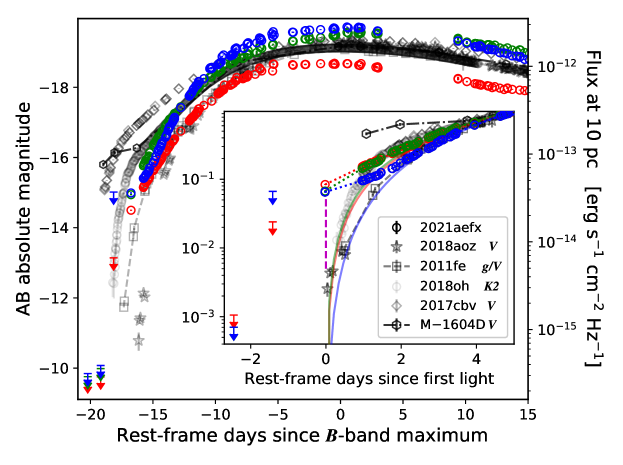
Here, we describe the early photometric and spectroscopic evolution of SN 2021aefx, beginning with a summary of the early light curve and color evolution of the SN in Figures 2 and 3. Figure 2 compares the early KSP light curves of SN 2021aefx in the rest frame with those of other Type Ia SNe in their nearest-to- bands. SN 2021aefx appears to have a higher peak luminosity and faster pre-peak rise compared to the other events. The “epoch of first light”, usually associated with the onset of the rising SN light curve, is estimated to be MJD 59529.85 0.55 days using power-law fitting (see Section 3.1 below). The inset shows the light curves of SN 2021aefx and the other SNe centered on their respective power-law fitted epochs of first light and normalized to their observed fluxes 5 days after. The blue, green, and red solid curves show the fitted power-laws to the -, -, and -band rising light curves of SN 2021aefx, respectively. SN 2021aefx shows an apparent excess emission to the power-law over the first 2 days that begins earlier than the epoch of first light. Thus, the onset of the excess emission apparently precedes that of the power-law rise, which is driven by the radioactive emission from the main distribution of centrally-concentrated in the ejecta (Piro & Nakar, 2013, 2014). Notably, the excess emission rises to a different flux level and on a different timescale than what is seen in the other events in the figure—SNe 2018aoz and 2018oh, and MUSSES1604D—that also show early excess emissions, making SN 2021aefx a unique Type Ia SNe.
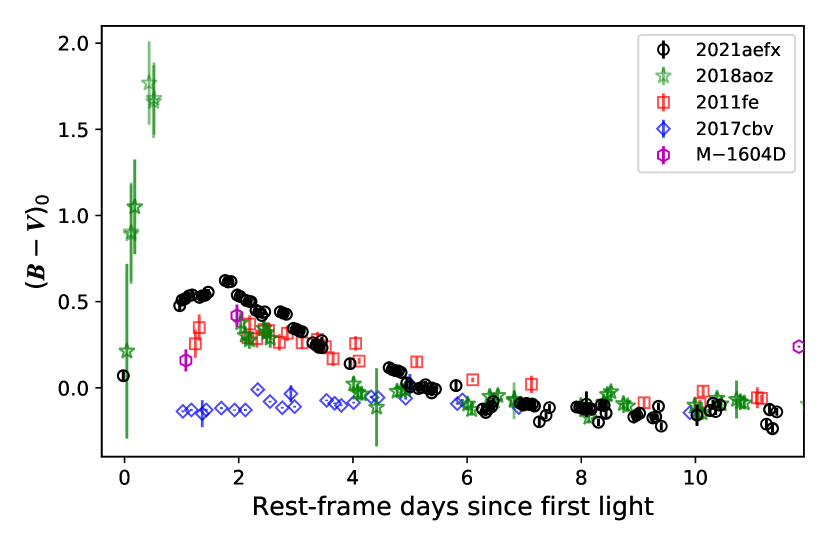
Figure 3 shows that the B V color evolution of SN 2021aefx undergoes a redward color evolution during the same period of 0–2 days where the early excess emission is observed. By fitting a polynomial, we find that the B V color of SN 2021aefx rises to a peak of 0.568 0.004 mag over the first 1.58 0.02 days. This is redder than any other Type Ia SN observed at these epochs other than SN 2018aoz. Compared with the two other events in the figure that also show an early redward B V color evolution, the color of SN 2021aefx peaks later and bluer than what is seen in SN 2018aoz, while it does earlier and redder than in MUSSES1604D.
3.1 Early Excess Emission and Epoch of First Light
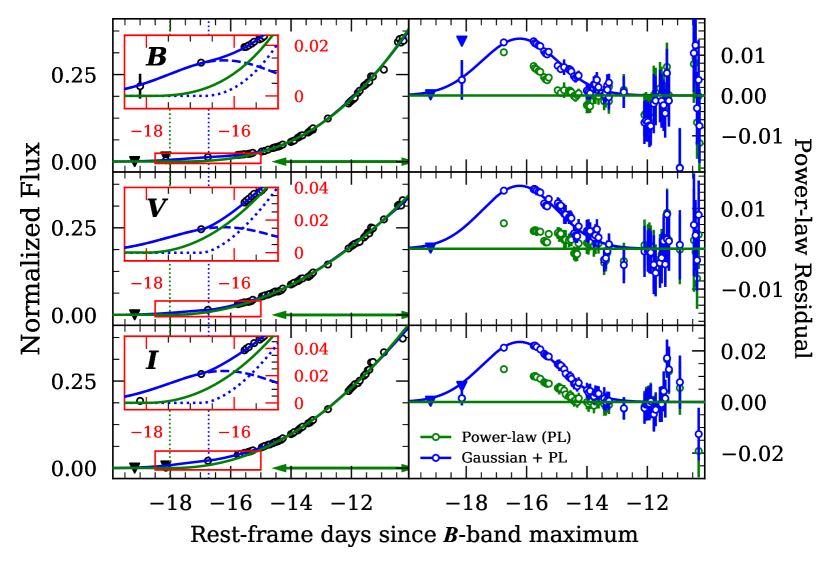
Type Ia SNe early light curves are mainly powered by a smooth, centrally-concentrated distribution with a power-law-like tail towards the ejecta surface. The light curve luminosity is expected to rise as , where depends on the steepness of the tail (Piro & Nakar, 2014). The observed early light curves of most Type Ia SNe have been found to be consistent with such a power-law rise up to 40% of maximum brightness (Olling et al., 2015), with a distribution of centered on 2 (Miller et al., 2020). Thus, the “epoch of first light” for Type Ia SNe is usually inferred by determining the onset of this power-law rise. However, as shown in Figure 2 (inset), the earliest emission of SN 2021aefx shows excess luminosity in all three bands over the first 2 days before power-law rise dominates. This is similar to the handful of Type Ia SNe that have been found with “early excess emission” (see Figure 2), including SN 2018aoz (Ni et al., 2023, 2022), SN 2018oh (Dimitriadis et al., 2019), SN 2017cbv (Hosseinzadeh et al., 2017), and MUSSES1604D (Jiang et al., 2017). To determine the onset of power-law dominated rise in SN 2021aefx, we applied a power-law fit to its rest-frame light curves over an extensive set of fit intervals of different lengths (e.g., see Olling et al., 2015; Dimitriadis et al., 2019), starting from as early as 20 days and ending at 10 days since -band maximum, during which the brightness is 40% of maximum brightness. The best-fit starting epoch is 14.5 days, after which the light curves are fit by the power-law, , with = 2.1 and = (2.75 0.07, 2.041 0.05, 2.12 0.05). The epoch of first light of this power-law is = 18.01 0.13 days (or MJD 59528.56 0.13). Figure 4 shows the normalized early light curves of SN 2021aefx compared to this fit (green solid curves; left panels), in which we can identify that the fit does not generalize well before 14.5 days where the residuals increase (right panels).
The discrepancy between the fitted power-law and observed light curves before 14.5 days in Figure 4 is due to the presence of the early excess emission during the period. In order to isolate the power-law and excess emission components of the rising light curves of SN 2021aefx at this phase, we fit the light curves between 20 and 10 days with a simple analytic model consisting of a power-law Gaussian in each band. The three -band light curves share the same Gaussian central epoch, , and width , but each Gaussian is scaled independently, while we use the same power-law above. The best-fit power-law Gaussian with = 2.4 (Figure 4, blue solid curves) is obtained with = 16.23 0.14 days (or MJD 59530.35 0.14), = 1.25 0.14 days, = 16.73 0.55 days (or MJD 59529.85 0.55), and = (2.15 0.26, 1.58 0.19, 1.65 0.19). As seen in Figure 4, this model fit provides excellent agreement to the observed light curves of SN 2021aefx, showing that the power-law from this model fit better represents the underlying rise of the SN. (Note that this power-law is what is shown as the colored solid curves in Figure 2).
The fit parameters of the power-law Gaussian model estimate the onset of the power-law rise (or “epoch of first light”) to be MJD 59529.85 0.55 indicating that our first detections of SN 2021aefx at MJD 59529.83 precede the epoch of first light by 0.5 hours (see Table 1). Note that this is the first reported detection of Type Ia SN emission prior to the onset of power-law rise from the main distribution of centrally-concentrated in the ejecta. The 16.73-day rise time of SN 2021aefx from first light to -band maximum in rest frame is relatively short within the observed rise time distribution of the normal Type Ia SN population (ranging in 15–22 days; Miller et al., 2020). The Gaussian-like excess emission component of the early light curve peaks between 0.75 and 1.75 days since first light (called “excess emission phase” hereafter). During this phase, the light curve of SN 2021aefx is dominated by the excess emission component, which emitted a total of 1.35 10-6 ergs cm2 into the bands along the line of sight (or 4.34 1046 ergs, assuming spherically symmetric emission). The nature of this excess emission is explored in Section 5 below. Following the excess emission phase, the power-law component dominates the light curve rise, with power-law indices consistent with what has been inferred from the light curves of other normal Type Ia SNe ( 1–3; Miller et al., 2020).
3.2 Evolution of Early Photospheric Velocities
The Doppler shifts of the Si II 6355 Å absorption feature (or “Si II velocity”; Parrent et al., 2014; Tanaka et al., 2008; Wang et al., 2009; Ni et al., 2022), which persists until 30 days after -band maximum, have been used for studying the velocity evolution of Type Ia SN ejecta in the photosphere. Some Type Ia SNe have shown deep and broad Si II features in the first few days post-explosion whose absorption profiles are best-fit with two velocity components (e.g., SNe 2009ig and 2012fr; Marion et al., 2013; Contreras et al., 2018), suggesting the presence of a short-lived “high-velocity feature” (HVF) in addition to the typical photospheric-velocity feature (PVF) that is seen in all Type Ia SNe.
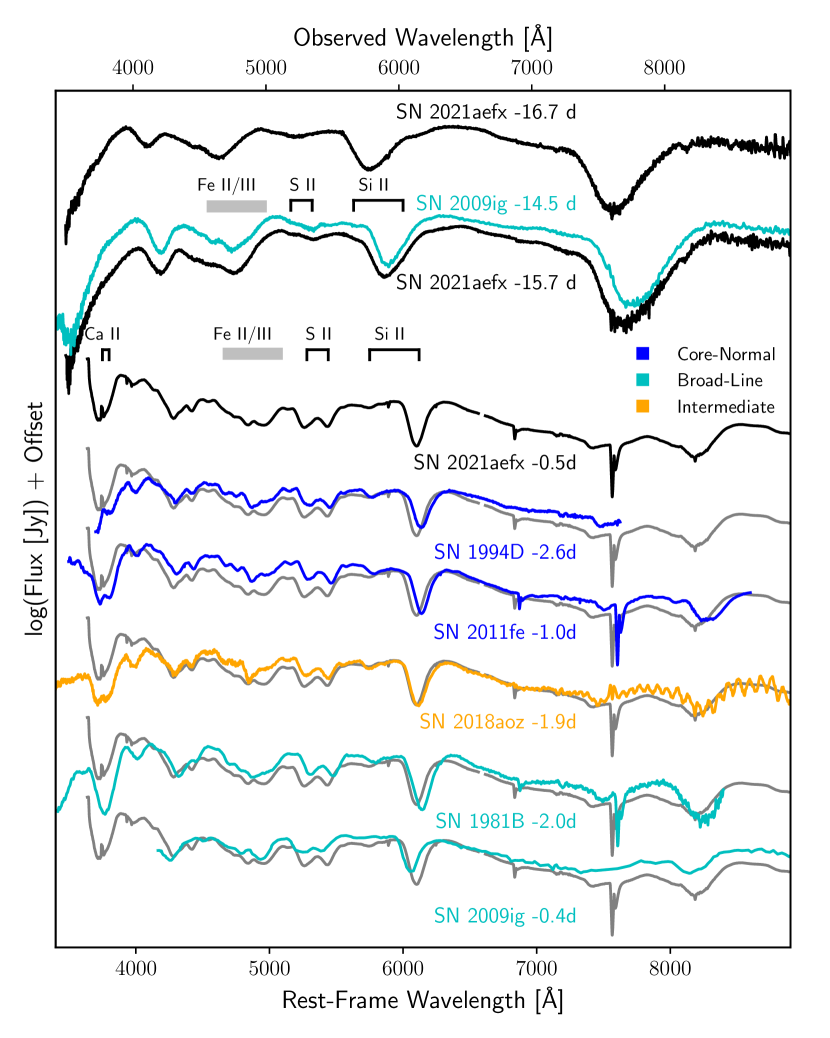
Figure 5 shows three spectra of SN 2021aefx—including two of the earliest obtained by SALT (Hosseinzadeh et al., 2022) and our spectrum from nearest the epoch of -band maximum—compared to those of other normal Type Ia SNe. Hosseinzadeh et al. (2022) reported that the earliest spectrum of SN 2021aefx from 16.8 days had an unusually deep and broad absorption feature around 570 nm in the rest frame, suggesting possible contributions from HVF and PVF features of Si II 6355 Å and/or blending with another Si II line at 5972 Å. By 15.8 days, the 570 nm feature of SN 2021aefx appears nearly identical to that of the BL/HV Type Ia SN 2009ig at a similar phase (15 days since -band maximum). SN 2009ig exhibits clear HVFs and PVFs of Si II 6355 Å (Marion et al., 2013), indicating that the shape of the 570 nm feature in SN 2021aefx may also be attributable to HVF and PVF components of the same line. At -band maximum, the SN shows relatively blended Fe II\scaleto1.4ex absorption features resembling BL SNe 1981B and 2009ig, while the Si II features match those of SN 2018aoz, which is an intermediate event between CN and BL (see Section 4.1 below for the precise subtype classification).
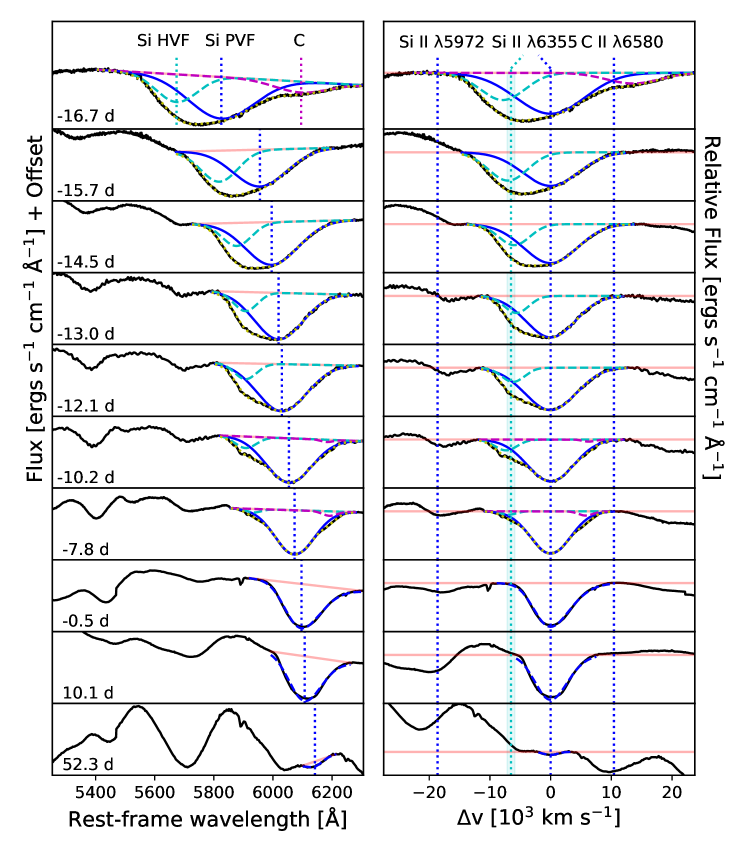
We fit the observed Si II 6355 Å feature in the spectra of SN 2021aefx with multiple Gaussian functions in order to characterize the velocity evolution of the HVF and PVF components, following the method in Silverman et al. (2015). First, the spectral continuum is measured by fitting the relatively broad local maxima on the red and blue edges of the feature with concave-downward quadratic functions, where the peaks of the quadratics representing the local maxima are considered to be the red and blue endpoints of the feature. The spectral continuum is adopted to be the line that connected the red and blue endpoints (see Figure 6, red shaded lines). When the quadratic peaks appear to measure the feature endpoints incorrectly by either being too far inside or outside of the feature, the endpoints are selected manually. Second, a sum of one, two, or three Gaussians is fitted to the residual of the spectrum after subtracting the spectral continuum. For one-Gaussian fitting, a skewed Gaussian profile is used in order to better approximate the expected shape (P cygni) of isolated SN absorption features, whereas a symmetric one is used for each component of multiple (2 or 3) Gaussian fitting in order to mitigate over-fitting. The mitigation of over-fitting is seen in the values of the fits (Table 4), where is similar between the one-component and multi-component fits. Finally, we obtain the velocities of each component by applying the relativistic Doppler effect formula to the fitted wavelengths of the Gaussian minima.
Figure 6 (left panels) shows the multi-Gaussian fits to the Si II 6355 Å feature for a sample of the spectra of SN 2021aefx. The bottom-most panel shows the last detection of the feature at 3- confidence, where is estimated by the rms noise of the residual after smoothing the spectrum using a second-order Savitsky-Golay filter with a width of 100 Å. (Note that the feature width is 100 Å in all epochs). For each fit, the subtracted continuum level (transparent red lines), as well as the PVF (blue solid curves) and HVF (cyan dashed curves) components of the fit are shown. For the fourteen earliest spectra 7.8 days, we find that a single Gaussian inadequately fits the shape of the feature while a multi-Gaussian fit results in a (2.5–12) improvement in . In particular, five of those early spectra require a third Gaussian component (magenta dashed curves) to accommodate the presence of an additional absorption feature at the red edge of the feature, resulting in (1.3–7.6) improvements in over the two-component fits. This third Gaussian component is usually attributed to C II 6580 Å in Type Ia SNe (e.g., see Silverman et al., 2015). Of the two remaining components, the one closer to the red edge of the feature is identifiable as the Si II PVF based on its velocity evolution (see Section 3.4 and Figure 7), associating the one closest to the blue edge of the feature to be the Si II HVF. The absence of other likely contributing lines in the vicinity (Section 3.3) and the resulting Si II velocities further support this association. Our measured Si II PVF and HVF velocities for SN 2021aefx have a mean separation of = (6500 600) km s-1, consistent with separations found in other normal Type Ia SNe with HVFs ( 6000 km s-1; Silverman et al., 2015). The PVF attains a velocity of (12,440 20) km s-1 at -band maximum, which is a typical normal Type Ia SN ejecta velocity (Section 4.1), while the HVF velocities exceed 20,000 km s-1 in all epochs.
For the sixteen near- and post-peak spectra following 7.8 days, we are unable to identify the HVF. Using two Gaussians in those epochs results in unreliable fits, with PVF and HVF separations ranging in (1100–3100) km s-1 and HVF velocities 15,000 km s-1 in all epochs. Note that these differ substantially from the PVF and HVF properties seen in prior epochs (see above), and that the fitting method of Silverman et al. (2015) is unreliable for distinguishing velocity components that are so closely separated. Thus, following 7.8 days, we adopt a single Gaussian which appears to adequately fit the feature and gives acceptable values, even for the spectrum from 10.1 days (second last row in the figure) which has the highest of 14.2 among the sixteen spectra. The measured PVF, HVF, and C II velocities for all of the spectra are presented in Table 4. Figure 7 shows the velocity evolution (see Section 3.4).
| Date (MJD) | Phasea | Telescope | Si | Si II PVF | Si II HVF | C II 6580 Å | Ca | LV Ca II | HV Ca II |
|---|---|---|---|---|---|---|---|---|---|
| 59529.86 | 16.71 | SALT | 2.1 | 26.04 0.29 | 33.86 0.11 | 22.90 0.24 | 1.6 | 31.97 0.21 | 40.77 0.10 |
| 59530.87 | 15.70 | SALT | 5.5 | 19.42 0.13 | 26.39 0.07 | 1.9 | 26.66 0.18 | 37.62 0.06 | |
| 59531.12 | 15.47 | SOAR | 2.3 | 18.86 0.25 | 25.63 0.12 | 1.8 | 25.56 0.29 | 36.76 0.09 | |
| 59531.70 | 14.89 | FTS | 2.4 | 17.67 0.15 | 23.83 0.08 | 1.3 | 23.79 0.34 | 35.39 0.17 | |
| 59532.07 | 14.52 | SALT | 5.9 | 17.43 0.06 | 23.40 0.03 | ||||
| 59532.84 | 13.75 | SALT | 5.2 | 16.74 0.06 | 22.47 0.03 | ||||
| 59533.63 | 12.98 | FTS | 2.4 | 16.28 0.07 | 21.88 0.04 | 1.4 | 22.53 0.16 | 32.37 0.06 | |
| 59533.86 | 12.74 | SALT | 3.8 | 16.08 0.05 | 21.98 0.03 | ||||
| 59534.50 | 12.11 | FTS | 3.1 | 15.72 0.05 | 21.88 0.04 | 1.4 | 22.93 0.32 | 31.09 0.11 | |
| 59535.07 | 11.53 | SALT | 7.5 | 15.35 0.02 | 21.73 0.03 | ||||
| 59536.45 | 10.17 | FTS | 1.5 | 14.53 0.02 | 21.86 0.05 | 18.68 0.13 | 1.3 | 13.37 0.14 | 26.00 0.06 |
| 59536.86 | 9.76 | SALT | 2.0 | 14.30 0.01 | 21.21 0.04 | 18.79 0.03 | |||
| 59538.07 | 8.55 | SALT | 1.5 | 13.85 0.01 | 20.64 0.03 | 18.46 0.03 | |||
| 59538.85 | 7.77 | SALT | 0.8 | 13.60 0.01 | 20.53 0.03 | 18.25 0.02 | |||
| 59546.12 | 0.54 | Gemini S | 7.0 | 12.44 0.02 | 8.0 | 11.95 0.04 | 19.31 0.09 | ||
| 59550.60 | 3.91 | FTS | 13.8 | 11.95 0.05 | 1.1 | 12.76 0.08 | |||
| 59556.81 | 10.09 | SALT | 14.2 | 11.92 0.09 | |||||
| 59558.48 | 11.75 | FTS | 10.7 | 11.73 0.08 | 1.1 | 11.51 0.05 | |||
| 59559.09 | 12.35 | SOAR | 9.3 | 11.81 0.07 | 40.9 | 11.67 0.03 | |||
| 59560.99 | 14.25 | SALT | 10.8 | 11.58 0.05 | |||||
| 59561.48 | 14.73 | FTS | 7.6 | 11.52 0.07 | 1.3 | 11.08 0.04 | |||
| 59564.50 | 17.73 | FTS | 7.6 | 11.18 0.07 | 1.2 | 10.98 0.05 | |||
| 59567.67 | 20.89 | FTS | 4.8 | 10.67 0.33 | 1.0 | 11.17 0.10 | |||
| 59568.01 | 21.23 | SALT | 5.5 | 10.81 0.14 | |||||
| 59572.54 | 25.74 | FTS | 0.5 | 10.69 0.06 | 2.1 | 10.68 0.06 | |||
| 59577.48 | 30.65 | FTS | 1.0 | 10.44 0.16 | 2.2 | 10.40 0.06 | |||
| 59582.54 | 35.68 | FTS | 1.1 | 10.66 0.38 | 3.9 | 10.75 0.06 | |||
| 59589.59 | 42.70 | FTS | 1.3 | 10.44 0.36 | 1.9 | 10.56 0.06 | |||
| 59594.59 | 47.67 | FTS | 1.0 | 10.17 0.86 | 1.4 | 10.35 0.09 | |||
| 59599.20 | 52.29 | Gemini S | 1.9 | 10.22 0.67 | 59.1 | 10.38 0.04 |
Note. — Two of these spectra are from Gemini S (see Table 2), while the remainder are publicly available spectra from SALT, SOAR, and FTS (Hosseinzadeh et al., 2022). Columns 4–7 provide the best-fit and measured velocities of the PVF, HVF, and C II 6580 Å components of the Si II 6355 Å feature, respectively, from multi-Gaussian fitting as detailed in Section 3.2, while columns 8–10 provide those from fitting the Ca II NIR triplet with “Low-Velocity” (LV) and “High-Velocity” (HV) components (Appendix A). All velocities are presented in 103 km s-1.
3.3 Existence of a Distinct High-Velocity Photosphere
We determine that the observed HVF of Si II 6355 Å feature in SN 2021aefx is from a high-velocity secondary Si II photosphere (called “HVF photosphere” hereafter)—distinct from the primary photosphere of the SN ejecta—as follows. First, the observed HVF is unlikely to be produced by any other line than Si II 6355 Å. The right panels of Figure 6 show the same spectra as the ones in the left panels after subtracting the spectral continuum and shifting the wavelength axes to velocities in the rest frame of the SN photosphere. This rest frame is typically adopted to be that of the Si II 6355 Å PVF (blue solid curves) minimum (Tanaka et al., 2008; Piro & Nakar, 2014), represented by the middle vertical blue line at 0 km s-1 in the figure. The observed Si II HVF (cyan dashed curves) minima occupy a narrow range of velocities to the left of the PVFs. The vertical cyan dotted line with a shaded region represents the measured mean separation and 1- range of the observed HVFs from the PVFs ( = 6500 600 km s-1; Section 3.2). The vertical blue dotted lines flanking the HVFs and PVFs on the left and right sides represent the expected locations of the nearest other lines, Si II 5972 Å and C II 6580 Å, respectively, in the photosphere (i.e., at PVF velocity) that can contribute to the observed Si II 6355 Å feature. As seen in the figure, in order for those lines to be responsible for the observed HVF, Si II and C II would need to be expanding 12,000 km s-1 slower and 17,000 km s-1 faster than the photosphere, respectively, making it much more likely for the HVF to be a 6,500 km s-1 faster component of Si II 6355 Å.
Second, we identify a component of the Ca II NIR triplet that traces the velocity evolution of the Si II HVF in the early phase ( 12 days since -band maximum; see Appendix A and LV Ca II in Table 4). This supports that the early HVF-velocity components of both lines originate from a common HVF photosphere that is distinct from the primary SN photosphere responsible for their PVF-velocity components, and the Si II PVF and HVF velocities are used as proxies for the velocities of their respective photospheres hereafter. We discuss the origin of the HVF photosphere in Section 6.
3.4 Si II Velocity Evolution and Epoch of Explosion
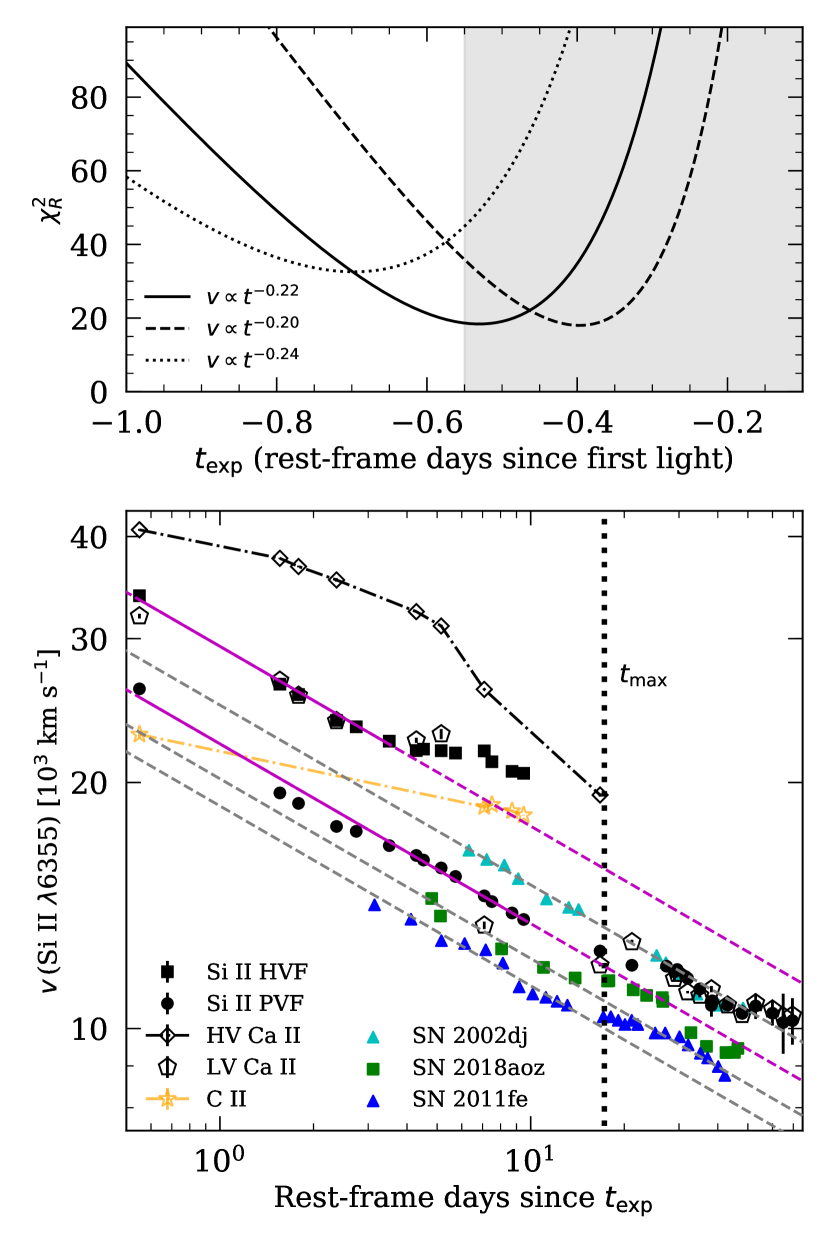
We measure the explosion epoch of SN 2021aefx by fitting the Si II HVF and PVF velocity evolution with power-law models of the form , where is the Si II velocity and is time (days) since the epoch of explosion. Such a power-law model with index = 0.22 is theoretically expected for a homologously expanding Type Ia SN with polytropic (n = 3) ejecta structure (Piro & Nakar, 2013), and has been found to be a good fit to the pre-peak evolution in other Type Ia SNe (Piro & Nakar, 2014; Ni et al., 2022). As seen in Figure 7 (bottom panel), the HVF (black filled squares) and PVF (black filled circles) follow = 0.22 power-law declines (magenta dashed lines) in the earliest phase, consistent with them both initially originating from photospheres of homologously expanding polytropic material in the SN ejecta. However, both features eventually plateau, the HVF after 3.6 days and the PVF after -band maximum, indicating that the expansion of SN 2021aefx has revealed the bulk of this polytropically-distributed material by those phases. In particular, since the PVF originates from the primary SN ejecta that is co-distributed with centrally-concentrated responsible for the Type Ia SN optical emission near peak, the onset of the PVF plateau is understood to coincide with -band maximum.
Figure 7 (top panel) shows the distribution (black solid curve) obtained by fitting only the HVF and PVF velocity measurements from before their respective plateau times, which results in the best-fit of 0.53 0.04 days since first light (or MJD 59529.32 0.04 days). This time difference between the epochs of explosion and first light in Type Ia SNe has been referred to as the “dark phase”, and our measurement is similar to those of normal Type Ia SNe 2011fe ( 0.5 days; Piro & Nakar, 2014) and 2018aoz ( 0.4 days; Ni et al., 2022). The bottom panel shows that the power-law (magenta solid lines) adequately fits the HVF and PVF declines with a best-fit HVF/PVF velocity ratio of 1.32 and = 18. Following Piro & Nakar (2014), we estimate the systematic error associated with the assumed by adopting nearby values of 0.20 and 0.24, resulting in variations of 0.15 days in the inferred (see Figure 7, top panel). The quality of the fit does not change significantly when is decreased to 0.20, although increases to 33 when is increased to 0.24. We adopt the conservative uncertainty of 0.16 days for the explosion epoch of MJD 59529.32 (Table 3), summing the uncertainties from fitting the = 0.22 power-law and varying the power-law index independently.
3.5 Summary of Important Epochs for Early Evolution
We summarize the important epochs of the early evolution of SN 2021aefx from our analyses above as follows.
-
1.
The power-law rise of SN 2021aefx began at the epoch of MJD 59529.85 0.55. Often referred to as the “epoch of first light”, this epoch is associated with the onset of emission from the main distribution of centrally-concentrated in the ejecta.
-
2.
There is evidence for excess emission which begins prior to the epoch of first light. The bulk of this emission peaks in the “excess emission phase” prior to 1.75 days since first light in rest frame, during which the SN undergoes redward B V color evolution.
-
3.
By fitting the early velocity evolution of SN 2021aefx, we estimate an explosion epoch of MJD 59529.32 0.04 days. This is 0.5 days prior to the onset of the power-law rise in rest frame and 1.0 days prior to the peak of the early excess emission.
-
4.
The spectra of SN 2021aefx show both HVFs and PVFs of Si II 6355 Å until 7.8 days since -band maximum in rest frame (= 8.9 days since first light), and PVFs alone until 52.3 days. C II is seen in a few epochs prior to the disappearance of the HVFs.
-
5.
The HVF and PVF velocities of SN 2021aefx both follow the power-law decline expected from homologous expansion of polytropic (n=3) Type Ia SN ejecta for 3.6 days post-explosion, after which the HVF velocity plateaus. The PVF velocity plateaus near -band maximum, as expected for Type Ia SNe.
4 Supernova Classification and Explosion Parameters
4.1 Spectroscopic Classification
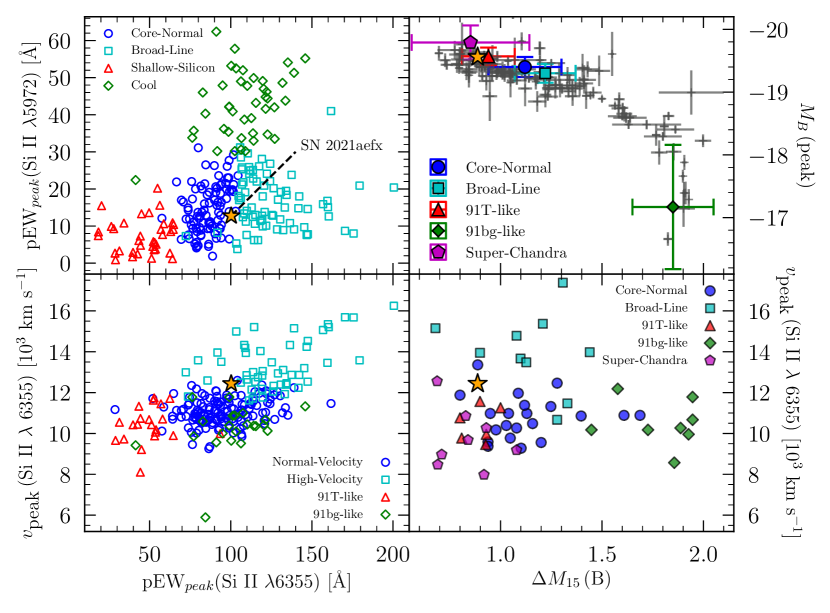
Type Ia SNe are typically classified using their spectra near the epoch of -band maximum light based on the percent equivalent widths of their Si II 6355 Å and 5972 Å absorption features (“pEWpeak”; Branch et al., 2006) and Si II velocity (; Wang et al., 2009). Using our spectrum of SN 2021aefx obtained from 0.5 days since the epoch of -band maximum, we measure pEWpeak (Si II 6355 Å) and pEWpeak (Si II 5972 Å) of 100.3 1.0 and 12.7 0.5 Å, respectively, using the method of Branch et al. (2006), as well as (Si II 6355 Å) = (12.44 0.02) 103 km s-1 (see Table 4). Figure 8 (left panels) compares these peak parameters to those of a sample of Type Ia SNe from the CN/NV (blue circles) and BL/HV (cyan squares) normal subtypes as well as the 91T-like (“or Shallow Silicon”; red triangles) and 91bg-like (or “Cool”; green diamonds) peculiar subtypes. SN 2021aefx appears to be on the boundary between the CN/NV and BL/HV events, while it is clearly inconsistent with the peculiar events. Thus, we classify SN 2021aefx as a normal Type Ia SN that is intermediate between the CN/NV and BL/HV subtypes, confirming the classifications based on spectra from pre-peak (8 days; Ashall et al., 2022) and post-peak (4 days; Hosseinzadeh et al., 2022) epochs.
The light curves of SN 2021aefx appear to be relatively slow-declining and over-luminous among Type Ia SNe with normal spectroscopic classification. Figure 8 (right panels) compares the -band peak absolute magnitude, , and (Si II 6355 Å) of SN 2021aefx with those of other Type Ia SNe from the CN, BL, 91T-like, and 91bg-like subtypes, as well as the extremely luminous and slow-declining Type Ia SNe with super-Chandrasekhar ejecta masses (or “super-Chandra” events). As seen in the figure, the light curve parameters of SN 2021aefx are near the slow and luminous boundary of normal events, consistent with 91T-like and super-Chandra events. However, we note that possibility of SN 2021aefx being from a super-Chandrasekhar-mass explosion is less likely based on its bolometric luminosity and UV light curves as detailed in Section 4.2 below.
4.2 Bolometric Light Curve and SN Explosion Parameters
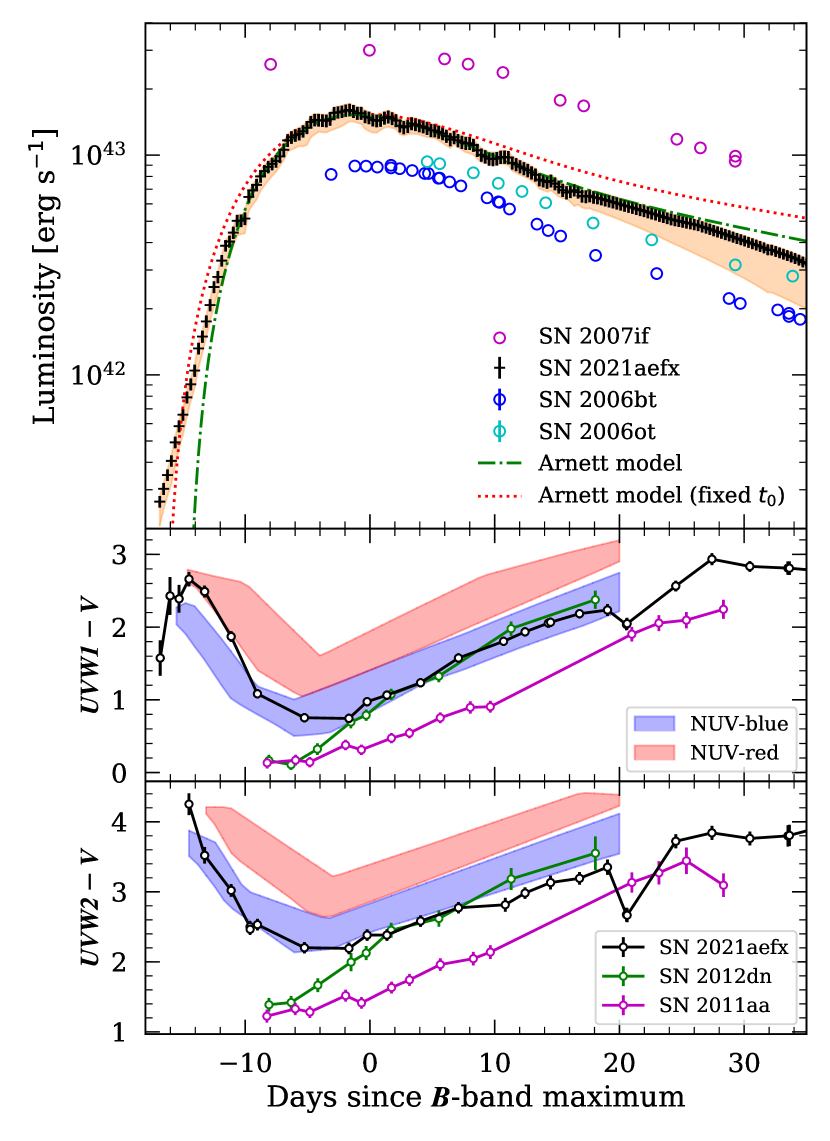
During the photospheric phase within the first 30 days after the explosion, the majority of Type Ia SN emission is expected to fall within the ultraviolet–optical–infrared (UVOIR) waverange (Contardo et al., 2000). Figure 9 (top panel) presents the bolometric light curve of SN 2021aefx obtained by integrating the spectral energy distribution (SED) constructed from the KSP -band light curves and Swift UV light curves (Hosseinzadeh et al., 2022) over the UVOIR waverange from to band (2246 to 23763 Å). The waverange is completed where observations are lacking by extrapolating the best-fit SNooPy template ( = 1.05; see Section 2.4) following the method of Ni et al. (2022), which accounts for 20% of the total bolometric luminosity within the photospheric phase.
We compare the bolometric light curve of SN 2021aefx to the -powered SN light curve model of Arnett (1982) in order to estimate the mass, ejecta mass, and ejecta kinetic energy of the explosion. In the case where the distribution of is strongly peaked toward the center of the ejected mass and the ejecta opacity is constant, the model predicts the radioactively powered luminosity of a Type Ia SN during the photospheric phase as a self-similar solution with the luminosity axis scaled by the mass () and the time axis scaled by the geometric mean of the diffusion and expansion timescales (; Ni et al., 2022, 2023):
| (1) |
(Note that the opacity of Type Ia SNe in the photospheric phase is expected to be nearly constant 0.1 cm2 g-1; Pinto & Eastman, 2000). We fit the model for two cases: (1) the onset of the model is set to be equal to the epoch of first light (Section 3.1); and (2) the onset is allowed to vary.
In case (1), the model (Figure 9, red dotted curve) is matched to the peak bolometric luminosity and the rise time between the epochs of first light and bolometric peak, which we measure to be 1.535 0.020 1043 ergs s-1 and 0.80 0.21 days since -band maximum, respectively, in SN 2021aefx. However, as seen in Figure 9, the model fails to represent the observed bolometric light curve near peak, with slower pre-peak rise and post-peak decline compared to the observations. The inferred explosion parameters of = 0.73 0.01 and = 14.47 0.23 days are also unreasonable. Adopting a characteristic ejecta velocity of = (12.44 0.02) 103 km s-1 (= peak Si II velocity; Table 4), and for uniformly expanding spherical ejecta, this would imply an ejecta mass of = 2.01 0.06 , which far exceeds the Chandrasekhar mass and is extremely large even for to super-Chandra events with inferred masses ranging in 1.6–2.1 (Scalzo et al., 2019).
In case (2), the model (Figure 9, green dot-dashed curve) is fitted to the near-peak bolometric light curve from 10 days to 10 days since the bolometric peak, setting the onset of the model as a fit parameter that represents the onset of the central -powered light curve. The best-fit ( = 0.2) model with = 0.631 0.009 , = 11.80 0.31 days, and = 14.91 0.17 days since -band maximum in rest-frame provides an excellent comparison to the observed bolometric light curve near the peak, though it underpredicts the observed luminosity in earlier epochs. The underprediction by the best-fit model is similar to what is seen in SN 2018aoz and KSP-OT-201509b (Ni et al., 2022; Moon et al., 2021), and likely to be caused by a shallower distribution and/or related to the presence of excess emission, which provides additional heating at early times.
Adopting = 11.80 0.31 days for SN 2021aefx and the approximate opacity of = 0.1 cm2 g-1 expected for Type Ia SNe dominated by line transitions in the photospheric phase, we find that the bolometric light curve is consistent with a near-Chandrasekhar-mass ( = 1.34 0.07 ) explosion with kinetic energy of = (1.24 0.06) 1051 ergs. The inferred ejecta mass is equal to the Chandrasekhar mass (1.38 ; Mazzali et al., 2007) when a slightly smaller opacity of 0.097 cm2 g-1 is used. By extending the calculation to include opacities in the range of 0.08–0.10 cm2 g-1 that have been used in modelling the bolometric luminosity of Type Ia SNe (Arnett, 1982; Piro & Nakar, 2014; Li et al., 2019; Moon et al., 2021; Ni et al., 2022), we obtain ejecta masses of SN 2021aefx in the range of 1.3–1.7 , which also includes super-Chandrasekhar ejecta masses.
In order to examine the possibility of SN 2021aefx being from a super-Chandrasekhar-mass explosion, we examine its parameter, bolometric light curve shape, and UV-Optical color evolution. Firstly, the events with moderately super-Chandrasekhar ejecta masses ( 1.5–1.7 ) have ranging in 1.1–1.3, while the of 1.00 for SN 2021aefx is lower than all of the super-Chandra events in the study of Type Ia SN bolometric light curves by Scalzo et al. (2019). Secondly, the top panel of Figure 9 compares the bolometric light curve evolution of SN 2021aefx to those of three other super-Chandra events (SNe 2007if, 2006bt, and 2006ot; Scalzo et al., 2019). The luminosity of SN 2021aefx is apparently within the range of luminosities seen in the super-Chandra events. The decline rates of the bolometric light curves in the figure also appear to be similar. We measure the decline in luminosity after 15 days since peak to be = 0.75 0.04 mag for SN 2021aefx, consistent with normal and mildly super-Chandrasekhar inferred ejecta masses ( 1.2–1.7 ) in other Type Ia SNe (Scalzo et al., 2019). Finally, the UV-Optical colors of SN 2021aefx are compared in the middle () and bottom () panels to those of super-Chandra events (SNe 2012dn and 2011aa; Brown et al., 2014), as well as the expectations for normal Type Ia SNe from the NUV-red and NUV-blue groups (Milne et al., 2013). The pre-peak color evolution of SN 2021aefx clearly diverges from the super-Chandra events, though the color evolution is extremely blue even among the NUV-blue group in some phases. Overall, SN 2021aefx is more consistent with being a normal Type Ia SN with relatively blue UV-Optical color and slow bolometric decline rate than with being a super-Chandra event.
5 Early Excess Emission Models
We examine the origin of the early excess emission in SN 2021aefx using models combining two luminosity components, following the methods described in Ni et al. (2023): (1) a power-law for the underlying SN emission from the centrally-concentrated main distribution of in the ejecta; and (2) excess emission. The former is modelled as as in Section 3.1. For the latter, we model three conceivable mechanisms in early Type Ia SNe that can produce excess emission: (1) radioactive heating by near the ejecta surface, (2) ejecta-companion interaction, and (3) ejecta-CSM interaction. The onset of each model is adopted to be the epoch of explosion, = MJD 59529.32 (Section 3.4). We briefly describe each model below.
For the model, we use the analytic form described in Ni et al. (2023, Equation 4) for a spherical shell of at the ejecta surface as well as the following equation describing the fractional mass of outer ejecta () that is visible via photon diffusion at any given time
| (2) |
adopting = 11.80 days from bolometric light curve fitting (Section 4.2). This model has free parameters of , , and , representing the total mass of in the shell, the rest-frame epoch when reaches the inner radius of the shell, and a parameter related to the optical depth where the radioactive emission is thermalized, respectively.
For the case of ejecta-companion interaction, we use the model of (Kasen, 2010, K10 hereafter), adopting the electron scattering opacity of = 0.2 cm2 g-1 for H-poor Type Ia SN ejecta and explosion parameters from Section 4.2 ( = 1.34 , = 1.24 ). The model is parameterized by the binary separation distance () and observer viewing angle () as described in Olling et al. (2015).
For ejecta-CSM interaction, we use the model of (Piro, 2015) for ejecta interaction with a uniform, spherical distribution of CSM, adopting the same opacity and explosion parameters as for the ejecta-companion interaction model above. The model has free parameters of and for the mass and radius of the CSM, respectively.
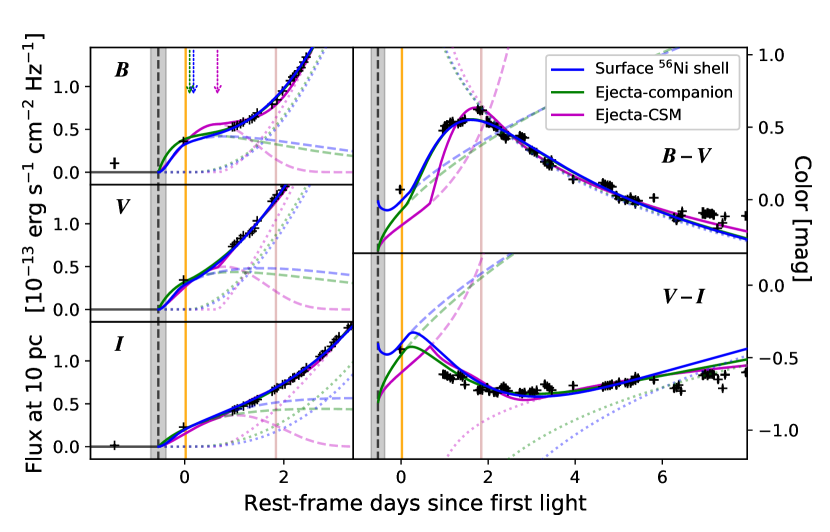
The power-law excess emission models are fitted to the early -band light curves of SN 2021aefx before 10 days since -band maximum, or 40% of maximum brightness where the power-law rise is applicable in Type Ia SNe (see Section 3.1). Figure 10 compares the best-fits obtained using the surface heating (blue solid curves), ejecta-companion interaction (green solid curves), and ejecta-CSM interaction (magenta solid curves) models. As seem in the figure, all three models appear to be capable of providing excess emission with a similar timescale and luminosity as what is observed in SN 2021aefx. However, we favour surface heating for the origin of the excess emission based on the parameters of the fits as detailed below.
5.1 Results and Interpretation of Modelling
For the case of the surface heating, we obtained the best-fit with = 6.5 and parameters = 0.52 days since explosion in rest frame, = 6.9 10-3 , = 1.58, = 0.71 rest-frame days since explosion, and = (2.23, 1.68, 2.39). The model parameters correspond to a 6.9 10-3 shell of excess in the outer 0.53% of the ejecta mass (Equation 2) along the line of sight. This is consistent with the amount of that can be expected in double-detonations (Polin et al., 2019) or off-center ignited delayed-detonations (Maeda et al., 2010a; Seitenzahl et al., 2013). The presence of this slight surface enrichment may also be compatible with likely explanations for other observed features in SN 2021aefx, including UV suppression (see Sections 5.2) and HVFs (see Sections 5.2).
For the case of ejecta-companion interaction, we obtained the best-fit with = 3.4, = 4.7 1011 cm, 0°, = 0.631 rest-frame days since explosion, and = (2.23, 1.67, 2.17). Note that the power-law components of both the best-fit surface shell and ejecta-companion interaction models infer dark phases of 0.6–0.7 days between the epochs of explosion and power-law onset—consistent with what has been found in other Type Ia SNe ( 0.4–1.6 Piro & Nakar, 2014; Ni et al., 2022)—as well as indices that are near the Type Ia SN population average ( 2.0; Miller et al., 2020). The binary separation distance of the K10 model fit corresponds to the expected Roche separation of a 2 main sequence subgiant. Due to the assumption of local thermodynamic equilibrium (LTE) between the shock-heated ejecta and its radiated emission in the K10 model and the 0° viewing angle, both of which tend to over-estimate the luminosity of the ejecta-companion interaction emission (Kutsuna & Shigeyama, 2015; Olling et al., 2015), the required companion may be even larger (e.g., see §4 discussion in Ni et al., 2023). However, the presence of a large non-degenerate companions is disfavoured by nebular-phase spectroscopy of SN 2021aefx showing an absence of emission from swept-up H-rich companion material (see Section 7).
For the case of ejecta-CSM interaction, the best-fit is obtained with = 15.4, = 0.024 , = 3.7 1011 cm, = 1.19 rest-frame days since explosion, and = (1.67, 1.22, 1.42). This mechanism is disfavoured for three reasons. First, the fit is worse than the surface shell and ejecta-companion interaction models because the predicted emission cools (i.e., evolves redward) slower immediately post-explosion, which is less compatible with the observations. Second, the power-law parameters obtained using ejecta-CSM interaction are also less consistent with the values obtained using the two other models as well as those of the Type Ia SN population (see above). Third, the ejecta shock interaction is expected to produce narrow recombination lines from flash-ionized CSM, such as observed in CSM-interaction flash-spectroscopy of core-collapse SNe (e.g., Yaron et al., 2017). However, no emission lines are seen in the earliest spectra of SN 2021aefx that were taken during the excess emission phase (see Figure 5).
5.2 Excess Emission and UV Suppression
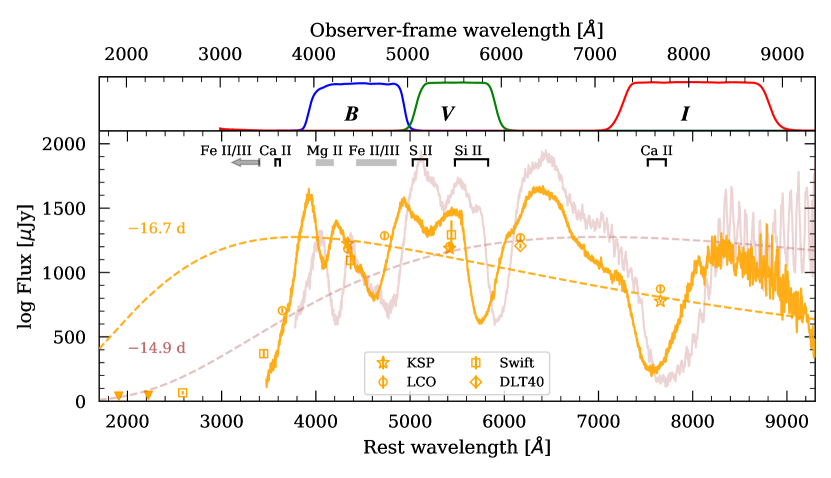
Figure 11 shows the evolution of the SED of SN 2021aefx from near the peak of the early excess emission (16.2 days; Section 3.1) to the reddest early B V color (15.2 days; Section 3). For the former, we compare the photometric SED of the KSP, LCO, Swift, and DLT40 observations from 16.7 days and the spectrum (orange) from the same epoch normalized to the KSP photometric wavebands with the 13380 K blackbody predicted by the best-fit surface shell model from the same phase post-explosion (0.6 days; orange dashed curve). Note that ejecta-companion interaction predicts a very similar SED evolution. For the latter, we compare the spectrum (orange) from the nearest epoch of 14.9 days to the same model from the corresponding phase (7260 K at 2.4 days post-explosion; brown dashed curve), where both are normalized to the KSP -band observations. While the observed optical continuum emission is consistent with the modelled blackbody evolution, the UV emission appears to be suppressed in the earliest phase. As seen in the figure, any pure blackbody SED that does not include UV emission would be unreasonably cold for the SED at 16.7 days in the optical bands—i.e., even colder than 7000 K (brown dashed curve). Thus, the suppression is likely due to line absorption rather than a cold continuum temperature.
The suppression of UV emission in SN 2021aefx in this phases resembles the drop-off of the photometric SED of SN 2018aoz 5000 Å at 0.9 days post-explosion (Ni et al., 2022), which has been attributed to the absorption features of Fe II\scaleto1.4ex in bluer wavelengths. The sharp drop-off of the photometric SED of SN 2021aefx 3800 Å at a similar post-explosion phase (0.6 days) coincides with the expected wavelengths of Ca II and Fe II\scaleto1.4ex absorption features, indicating that those elements are likely responsible for the suppression. The required 0.6-day phase of UV suppression by the Fe-line photosphere and Equation 2 indicates that these elements are present within some outer fraction of the ejecta mass along the line of sight 0.69%, consistent with the location of that can explain the early excess emission (outer 0.53%; Section 5). Thus, an enrichment of radioactive Fe-peak elements in the outer 0.5% of the ejecta along the line of sight may explain both the excess emission and UV suppression of SN 2021aefx in the early phase, calling for future exploration by radiative transfer simulations.
6 Origin of High-Velocity Features
Several possibilities have been considered for the origin of HVFs in Type Ia SNe, including plumes of high-velocity ejecta from a deflagration-detonation transition, detonation of surface helium, enhanced populations of atomic states in the high-velocity outer ejecta, and interaction with low-mass CSM. These origins usually invoke three main mechanisms (e.g., see Mulligan & Wheeler, 2018) involving (1) two distinct distributions of matter, one at the normal SN ejecta velocity and another at a higher velocity, which we call “split-velocity” ejecta; (2) a shock interaction that sends a reverse shock into the ejecta; and/or (3) a line opacity enhancement in the high-velocity outer layers of the ejecta.
We explore the origin of the observed Si II HVF in SN 2021aefx by modelling the evolution of the photosphere as follows. First, we show that two ejecta mass components with similar density distributions expanding homologously since the epoch of explosion can explain the HVF and PVF velocity evolution—i.e., the PVF comes from the primary component of the ejecta mass while the HVF comes from a low-mass secondary component moving at a higher velocity (Section 6.1). Secondly, we find that a change in the ejecta density structure caused by a shock interaction with material in the vicinity of the progenitor system is not capable of explaining the HVF presence (Section 6.2). Finally, we examine line opacity changes that can be expected from enhanced fraction or shock interactions in the outer ejecta, finding that these are less capable of explaining the observed characteristics of the HVF velocity evolution (Section 6.3). Overall, a two-component, split-velocity ejecta appears to be the most likely origin of the observed HVFs in SN 2021aefx.
6.1 Homologous Expansion of Split-Velocity Ejecta
First, the evolution of the PVF is often modelled using the following simple model for SNe. The ejecta density profile follows a broken power-law with a shallow-declining inner region and a steep-declining outer region (Kasen, 2010). The two profiles join at the transition velocity , where is a numerical constant. Under homologous expansion, the outer density profile is
| (3) |
where is the normalization factor. The numerical constants and follow from requiring the density profile to be continuous at the transition velocity and the density profile to integrate to the specified mass and kinetic energy of the SN. Adopting typical values of and for Type Ia SNe based on the simulations of Kasen & Woosley (2009) yields the values of the constants to be and . If = (10 )/(3 ) is the characteristic velocity as defined in Section 4.2—identified to be (Si II 6355 Å) = 12,440 km s-1 (Table 3)—then the transition velocity is = 0.93 11,520 km s-1.
The photosphere radius is the location where optical depth . The nearly constant opacity of cm2 g-1 is expected for -dominated Type Ia SN ejecta (Pinto & Eastman, 2000). Integrating the outer density profile above (Equation 3), we obtain
| (4) | ||||
| (5) |
Under homologous expansion, the ejecta velocity at the photosphere is , which gives the photospheric velocity evolution of the SN ejecta as follows
| (6) | ||||
| (7) |
These can be written in terms of the characteristic ejecta velocity and the geometric mean of the diffusion and expansion timescales = 11.80 days (Table 3).
| (8) |
| (9) |
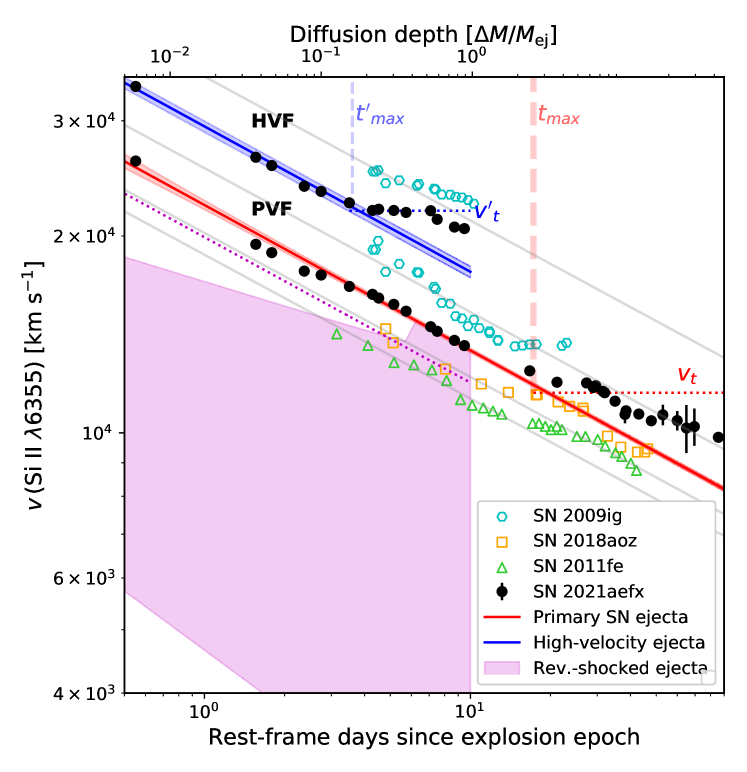
Figure 12 compares the HVF and PVF velocity evolution of SN 2021aefx to the photospheric velocity evolution of other Type Ia SNe and the predicted photospheric velocity evolution using Equation 7 (red curve). The red shaded region represents the 1- uncertainty associated with and . The prediction closely matches the observed PVF velocity of SN 2021aefx prior to approximately the epoch of -band maximum (), when the photosphere reaches the transition velocity. The slow-declining density distribution of the inner ejecta below the transition velocity causes the PVF velocity to plateau after , where the observed velocity of the plateau appears to be similar to . The top axis of Figure 12 estimates the mass coordinate ( from the ejecta surface) of the diffusion depth, which applies during early times before the transition velocity is reached. (Note that the diffusion depth reaches the transition velocity sometime prior to due to it being deeper than the photosphere).
We observe that the HVF velocity evolution exhibits key points of similarity with that of the PVF. The HVF follows the same evolution as the PVF in the early phase, but at a 1.32 higher velocity, and it plateaus to a velocity of 21,860 20 km s-1 after 3.6 days post-explosion. This suggests that the distributions of material responsible for the PVF and HVF may be self-similar. Relative to the bulk of the SN ejecta, the HVF velocity begins to plateau when the diffusion depth is at 0.16, indicating that the material responsible for producing the HVF is within the outer 16% of the ejecta mass along the line of sight. We fit Equation 7 to the HVF velocity evolution until 3.6, adopting the characteristic velocity of 23,500 km s-1 for the HVF material and assuming the same constant opacity of 0.1 cm2 g-1. Figure 12 shows that the best-fit (blue line) with = 3.2 0.3 days provides a good fit to the observed HVF velocity evolution. Using Equation 1 and , we estimate the mass of the HVF material to be = 0.19 0.04 (or 14 3% of , consistent with the above estimate of the diffusion depth coordinate at ). If this HVF material is also responsible for producing the observed early excess emission in SN 2021aefx, then the overall fraction of the HVF material would only be 4%.
The existence of a transition velocity at 21,860 20 km s-1 in the ejecta mass distribution to explain the HVF plateau timing is also evidenced by the evolution of the “low-velociy” (LV) Ca II NIR triplet (Appendix A). Since the LV Ca II NIR triplet traces the early Si II HVF, the two features are expected to be from the same HVF photosphere. During 5–7 days post-explosion (between 12 and 10 days since -band maximum; Figure 14), which is during the HVF plateau, the observed Ca II NIR triplet begins to show a component that traces the velocity of the Si II PVF for the first time. This suggests that the HVF photosphere obscures underlying Ca II until the photosphere reaches the transition velocity and the entire distribution of material responsible for the HVF photosphere has become optically thin.
In summary, the HVF in SN 2021aefx is consistent with what can be produced by material that has a similar density distribution as the primary component of the SN ejecta, embedded as a distinct fast-expanding structure in the outer layers of the ejecta and expanding homologously post-explosion with the rest of the ejecta. In this scenario, the HVF is attributed to the photosphere of this fast-expanding structure. It is conceivable that slightly -enriched, fast-expanding structures in the outer ejecta can be produced by explosion mechanisms such as double-detonations (e.g., Boos et al., 2021) or off-center ignited delayed-detonations (e.g., Maeda et al., 2010a; Seitenzahl et al., 2013). However, the former tends to produce smooth shells of stratified material due to the supersonic nature of the double-detonation process, which would result in a relatively simple photosphere geometry. The simultaneous appearance of the HVF with the PVF originating from lower-velocity underlying ejecta indicates that the HVF material is non-spherically symmetric and clumpy, consistent with polarization studies showing significant polarizations in observed HVFs ( 0.7%; Wang et al., 2003). This is much more congruous with sub-sonic explosion processes in off-center ignited delayed-detonations that can embed clumps of -enriched, high-velocity material in the outer ejecta along the line of sight which are frozen in by the subsequent detonation, resulting in a complex photosphere evolution post-explosion. Considering the near-Chandrasekhar ejecta mass of SN 2021aefx inferred by this study ( 1.34 ; Section 4.2) and others ( 1.2 ; DerKacy et al., 2023), off-center ignited delayed-detonation appears to be the more likely origin of the observed HVFs and explosion mechanism in this SN overall.
6.2 Reverse-Shocked Photosphere Evolution
We examine whether the Si II HVF can originate from a shock interaction of SN 2021aefx with stationary material in the progenitor system, which sends a reverse shock into the ejecta that increases the density of material in the high-velocity outer regions. Although this process can affect the photosphere, it does not easily explain the observed properties of the HVF. The reverse shock creates a pile-up of higher density and lower velocity material in the ejecta following the shock front, whose size in 1-D is usually a few percent of the radius of the shock front (Chevalier, 1982). If the Si II line opacity is unaffected by the reverse shock, then the Si II optical depth of a fluid element at radial position is unaffected by the density pile-up. (Note that the forward shock pile-up, being not part of the SN ejecta, does not contain Si, and thus, it does not contribute to the Si II optical depth). An optically thick reverse shock results in the Si II photosphere closely following the shock front, at a compressed radius and reduced velocity. For Type Ia SN ejecta with an outer density profile described by (Kasen & Woosley, 2009) interacting with CSM that can be expected to be found in Type Ia SN progenitor systems, with density described by for as large as 3 (Piro & Morozova, 2016), the shock front radius and velocity evolve as and , respectively. The evolution of the reverse-shocked photosphere continues until the pile-up becomes optically thin, after which the photosphere evolution passes back into the unshocked ejecta. This only occurs for the case of s 1, since the photosphere of free-expanding unshocked ejecta evolves as (see Section 6.1).
The pink shaded region in Figure 12 shows the predicted range of photospheric velocity evolution for SN 2021aefx after the ejecta has undergone a reverse-shock, obtained by solving the fluid equations of Chevalier (1982) for a radiation-dominated gas ( = 4/3) with an appropriate change in the boundary conditions. The shaded region is bounded by two cases of circumstellar material with radial distributions characterized by = 2 (top) and = 0 (bottom), and normalized to = 10-4 3/(4) 10-8 g cm-3 at (Section 5). Note that in the former case ( 1), the reverse-shocked region eventually becomes optically thin when the photosphere velocity matches the velocity at the inner boundary of the reverse-shocked region (magenta dotted line), and the velocity evolution matches the red line (unshocked ejecta) thereafter. It is possible to achieve the same velocity evolution as the observed HVF using an = 1 CSM distribution, but the reverse-shocked photosphere would still be located at a lower velocity than what is predicted by the homologous expansion of unshocked ejecta (red line). Thus, the pile-up of reverse-shocked ejecta alone is unable to explain the observed Si II HVF evolution.
6.3 Enhancement of Si II opacity in the outer ejecta
Next, we consider whether an enhancement of the Si II 6355 Å line opacity in some region of the high-velocity outer ejecta along the line of sight can explain the HVF. Under homologous expansion, this case is accommodated by the following modification to Equation 9, where is the enhancement relative to the typical photospheric opacity.
| (10) |
The observed HVF/PVF velocity ratio of 1.32 before the HVF plateau is replicated by adopting 12 in the outer ejecta, resulting in identical HVF evolution as what is predicted by the split-velocity model (Section 6.1). Two mechanisms come to mind that can produce a change in the Si line opacity. First, excess in the outer 0.5% of the ejecta can enhance the ionization and excitation level populations of Si. Second, UV and X-ray photons produced by shock interaction could also alter the level populations.
These two mechanisms both have difficulties in explaining the observed HVF evolution. For the former, it is difficult to imagine that the level populations maintained by a clump of decaying can produce an opacity enhancement that remains constant during the early ( 3.6 days) HVF evolution throughout some specific region of the high-velocity ejecta layers if the region itself is not kinematically distinct from the rest of the ejecta (i.e., resembling split-velocity ejecta). For the latter, while simulations of CSM-ejecta interaction that account for changes in the level population can produce somewhat realistic Type Ia SN HVFs in the regime of optically thin reverse shocks (Mulligan & Wheeler, 2018), this typically results in line evolution that differs substantially from the expectation for homologously expanding ejecta with constant ionization and excitation states (i.e., constant opacity). Both cases do not readily explain the timing and velocity of the observed HVF plateau.
7 Nebular-Phase Constraints on the Progenitor System and CSM
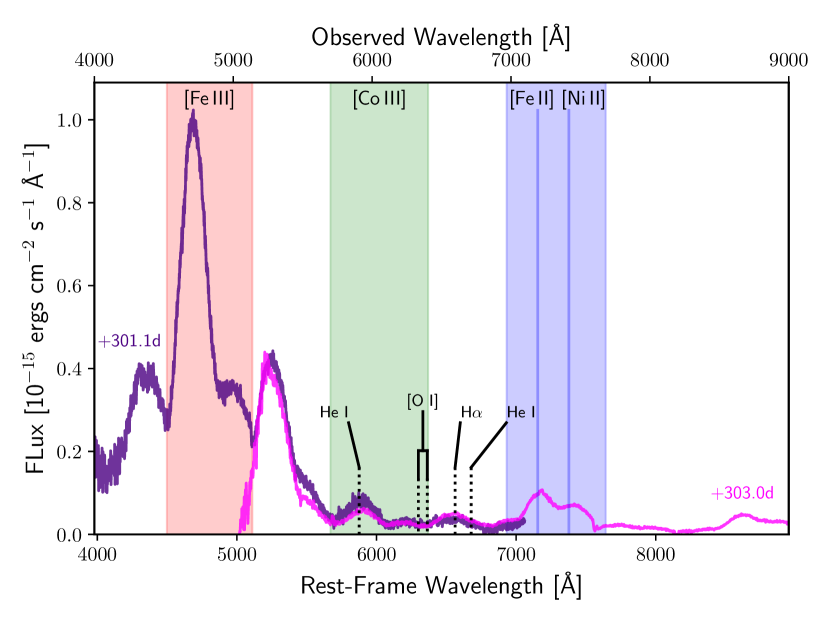
Figure 13 presents the nebular-phase spectrum of SN 2021aefx from 300 days since -band maximum obtained using GMOS through the B600 (indigo) and R400 (magenta) filters. The B600 and R400 spectra were scaled by matching their flux to the observed - and -band photometry from the same epochs, respectively (Table 1). The spectrum shows strong emission features of Fe III 4658 Å and Co III 5888 Å, with fluxes of (32.38 0.04) and (2.48 0.01) 10-14 ergs s-1 cm-2, respectively, typically associated with radioactive decay in Type Ia SNe (Kuchner et al., 1994). The noise in the spectrum is estimated by smoothing each spectrum with a second-order Savitsky–Golay filter with a width of 180 Å, which is 1/4 of the feature widths in order to estimate the uncertainties. There is also a double-peaked emission feature near 7290 Å. Sub-Chandrasekhar-mass explosion models often predict a strong emission line near 7290 Å due to increased Ca production in the core. However, the shape of the feature indicates that it is likely dominated by the Fe II 7155 Å and Ni II 7378 Å emission lines rather than the [Ca II] 7291, 7323 Å doublet, since [Ca II] would not be resolved as a doublet at typical Type Ia SN velocities (Polin et al., 2021). The total flux of the feature, (4.20 0.01) 10-14 ergs s-1 cm-2, is also relatively low compared to that of Fe III with a ratio of only 0.130, whereas sub-Chandrasekhar-mass explosion models predict higher ratios of 0.3 (Polin et al., 2021), further disfavouring a sub-Chandrasekhar-mass explosion. Asymmetric Chandrasekhar-mass explosion mechanisms, on the other hand, predict Fe II and Ni II emission features whose Doppler shifts depend on the motion of the ejecta core with respect to the rest frame of the SN (Maeda et al., 2010a, b; Li et al., 2021). We observe a redshift in both the Fe II and Ni II features, with velocities of 1020 and 1310 km s-1, respectively, indicative of an asymmetric explosion where the ejecta core is receding from the observer, consistent with what was found in JWST observations (Kwok et al., 2023).
In Type Ia SNe, narrow H, He I 5875 Å, He I 6678 Å, [O I] 6300 Å, and [O I] 6364 Å lines may be produced by low-velocity material swept-up from the companion (e.g., Kollmeier et al., 2019) or CSM, including disrupted companion material following a violent merger (Kromer et al., 2013; Mazzali et al., 2022; Tucker et al., 2022). By injecting synthetic emission lines of H and He with a FWHM = 1000 km s-1 and modelling Doppler shifts from the rest wavelength of up to 1000 km s-1 into the observed nebular spectra following the methods of Sand et al. (2018, 2019), we find 3 flux upper limits of (1.7, 4.2, and 2.6) 10-16 ergs s-1 cm-2 for H, He I 5875 Å, and He I 6678 Å, respectively. We do the same for [O I] 6300 Å and [O I] 6364 Å, but using FWHM = 2000 km s-1 and up to 2000 km s-1 Doppler shifts that can be expected for [O I] (Taubenberger et al., 2013), obtaining 3 flux upper limits of (3.5 and 4.2) 10-16 ergs s-1 cm-2, respectively. We use the models of Botyánszki et al. (2018) and Dessart et al. (2020) to obtain the masses of H and He allowed by these upper limits, adopting the luminosity distance from template fitting (Section 2.4). Using the former, we allow only 6.3 10-4 of H based on H, and (6.7 and 5.4) 10-3 of He based on He I 5875 Å, and He I 6678 Å, respectively. Using the latter, we allow 2.4 10-3 of H. The mass of H allowed by both Botyánszki et al. (2018) and Dessart et al. (2020) models is far below what is expected for masses of stripped H-rich material from main sequence and giant companions ( 0.1; e.g., Botyánszki et al., 2018), while the He constraints based on Botyánszki et al. (2018) would even disfavour a naked He-star companion. These constraints are more stringent than those derived from the earlier-phase spectrum of SN 2021aefx (Hosseinzadeh et al., 2022), confirming that a single-degenerate progenitor is disfavoured.
8 Summary and Conclusion
The observations of SN 2021aefx from the early (0–2 day since first light) to the nebular phase ( 200 days since -band maximum) constitute one of the most extensive datasets on a Type Ia SN, shedding light on the explosion processes and progenitor system of a normal Type Ia SN with unique early light curve and spectroscopic properties. Here, we summarize our main results and conclusions:
-
•
Our spectrum of SN 2021aefx from the epoch of -band maximum confirms its intermediate classification between the Core-Normal and Broad-Line subtypes of normal Type Ia SNe, though its near-peak light curves are slow-declining and luminous for this classification, resembling 91T-like peculiar events.
-
•
The bolometric light curve and UV-Optical color curves in the photospheric phase ( 30 days) indicate a near-Chandrasekhar ejecta mass ( 1.34 ).
-
•
Sub-Chandrasekhar-mass explosions are further disfavoured by the absence of Ca II emission and the presence of stable Fe II and Ni II emission in the nebular phase spectrum. We observe 1000 km s-1 redshifts in both of the Fe II and Ni II lines which confirms the slight asymmetry of the explosion core.
-
•
The early -band light curves up to 40% of maximum brightness (0–6.7 days since first light) consist of an excess emission embedded in an underlying power-law that rises over the period. The power-law rise, associated with the main central distribution of in the ejecta, is found to begin at MJD 59529.85 0.55 (= “first light”) 0.5 hours after our first detections of the excess emission, indicating the presence of additional power sources. The excess emission initially peaks in the -band and evolves redward thereafter, dominating the SN light curve over the “excess emission phase” of 1.75 days, during which it contributes 4.3 1046 ergs of total energy into the bands (or 1.4 10-6 ergs cm-2 along the line of sight).
-
•
The spectra of SN 2021aefx show broad Si II 6355 Å absorption features prior to 7.8 days since -band maximum (8.9 days since first light) that separate into two distinct Gaussian components: (1) a “photosheric-velocity feature” (PVF) associated with the expansion of normal Type Ia SN ejecta moving at 12,400 km s-1; and (2) a “high-velocity feature” (HVF) showing a (6500 600) km s-1 higher velocity at every epoch. Both HVF and PVF components follow a power-law predicted by a homologously expanding polytrope (n = 3), pointing to an explosion epoch at MJD 59529.32 (or 7:41 on November 10, 2021).
-
•
The HVF and PVF features of Si II map to corresponding velocity components identified in the Ca II NIR triplet that trace the HVF and PVF at early (12 days since -band maximum) and late (10 days) times, respectively. In addition, a component of the Ca II NIR triplet is identified showing velocities as high as (40,770 100) km s-1 in the earliest spectrum from 16.7 days days, which is the fastest-expanding ejecta material ever observed in a Type Ia SN.
-
•
The evolution of the excess emission in optical bands can be fitted by three physical models predicting excess thermal emission in early Type Ia SNe: (1) a 0.007 shell of in the outer 0.5% of the ejecta mass; (2) ejecta interaction with a 2 main sequence subgiant; and (3) ejecta interaction with 0.02 of CSM in a radius of 4 1011 cm.
-
•
Pure thermal emission is unable to fit the UV SED of SN 2021aefx near the peak of the excess emission for any reasonable temperature, requiring line-blanket absorption in the vicinity of 3800 Å by Fe and/or Ca located somewhere near the ejecta surface, above the outer 0.7% of the ejecta mass. The possibility of fitting both the observed excess emission and UV suppression in SN 2021aefx with a slight enrichment of radioactive Fe-peak elements in the outer 0.5% of the ejecta along the line of sight warrants future study with 1-D radiative transfer simulations.
-
•
Our search for H, He, and O emission in the nebular-phase spectrum confirms there is no evidence for stripped H- or He-rich materials from the companion, nor O-rich CSM from a violent merger. This mainly indicates that a H-poor companion is more likely for the progenitor system, disfavouring the 2 subgiant as the source of the early excess emission.
-
•
Ejecta-CSM interaction is disfavoured for the origin of the observed early excess emission by the absence of expected narrow emission lines in spectra obtained during the excess emission phase, and also provides a worse fit compared to the fits obtained with the other two models for the early excess emission.
-
•
The HVF velocity evolution is best-explained by a distinct component of high-velocity ( 23,500 km s-1) material embedded in the outer 16% of the ejecta mass along the line of sight. While decay or ejecta-CSM shock interaction may enhance the Si opacity in the outer ejecta and produce HVFs, these processes are not likely to produce the constant and uniform 14 opacity increase required to explain the early HVF evolution, nor can they readily explain the timing and velocity of the HVF plateau.
-
•
We detect weak contribution from C II 6580 Å to the Si II 6355 Å feature at a few epochs prior to the disappearance of HVFs at 7.8 days, suggesting that the high-velocity material may be partially burnt.
-
•
An off-center ignited delayed-detonation can conceivably create a distinct high-velocity, partially-burned plume—containing C, Si, Ca and a slight enrichment of radioactive Fe-peak elements—along the line of sight via subsonic deflagration, which is then frozen into homologous expansion by the detonation. Future modelling is needed to confirm if such an explosion can explain the observed early excess emission, UV suppression, and HVF evolution of SN 2021aefx.
-
•
Double-detonations may also create a -enriched, high-velocity shell in the outer ejecta. However, this mechanism is less compatible with the near-Chandrasekhar-mass ejecta and complex photosphere geometry required to explain the simultaneous presence of HVFs and PVFs in the early spectra.
Only a handful of Type Ia SNe have sufficiently early (= 0–2 days) multi-band/spectroscopic observations that probe the presence of excess emission, UV suppression, and HVF features at the phases seen in SN 2021aefx. The ones that have been seen so far, including normal Type Ia SNe 2018aoz (Ni et al., 2022), 2017cbv (Hosseinzadeh et al., 2017), 2012fr (Contreras et al., 2018), 2011fe (Pereira et al., 2013), and 2009ig (Marion et al., 2013), reveal a surprising variety of features in those epochs, reflecting inhomogeneities in their origin processes. Our analyses of SN 2021aefx highlight how different observations, including high-cadence multi-band photometry and multi-epoch spectroscopy can be used narrow down the origin of these early features. Our results indicate that asymmetric and subsonic explosion processes play an important role in the explosions of normal Type Ia SNe from Chandrasekhar-mass WDs, of which SN 2021aefx is perhaps one of the best candidates to date.
Acknowledgments
This research has made use of the KMTNet system operated by the Korea Astronomy and Space Science Institute (KASI) and the data were obtained at three host sites of CTIO in Chile, SAAO in South Africa, and SSO in Australia. Data transfer from the host site to KASI was supported by the Korea Research Environment Open NETwork (KREONET). This research was supported by KASI under the R&D program (Project No. 2023-1-868-03) supervised by the Ministry of Science and ICT. This research is also based on observations obtained at the international Gemini-S Observatory, a program of NSF’s NOIRLab, which is managed by the Association of Universities for Research in Astronomy (AURA) under a cooperative agreement with the National Science Foundation on behalf of the Gemini Observatory partnership: the National Science Foundation (United States), National Research Council (Canada), Agencia Nacional de Investigación y Desarrollo (Chile), Ministerio de Ciencia, Tecnología e Innovación (Argentina), Ministério da Ciência, Tecnologia, Inovações e Comunicações (Brazil), and Korea Astronomy and Space Science Institute (Republic of Korea). The Gemini-S observations were obtained under the Canadian Gemini Office (PID: GS-2021B-Q-114 and GS-2022A-Q-115) of the National Research Council and acquired through the Gemini Observatory Archive at NSF’s NOIRLab. D.-S.M. and M.R.D. are supported by Discovery Grants from the Natural Sciences and Engineering Research Council of Canada. D.-S.M. was supported in part by a Leading Edge Fund from the Canadian Foundation for Innovation (project No. 30951). M.R.D. was supported in part by the Canada Research Chairs Program, the Canadian Institute for Advanced Research (CIFAR), and the Dunlap Institute at the University of Toronto.
Appendix A Identification of Ca II NIR Triplet High-Velocity Components
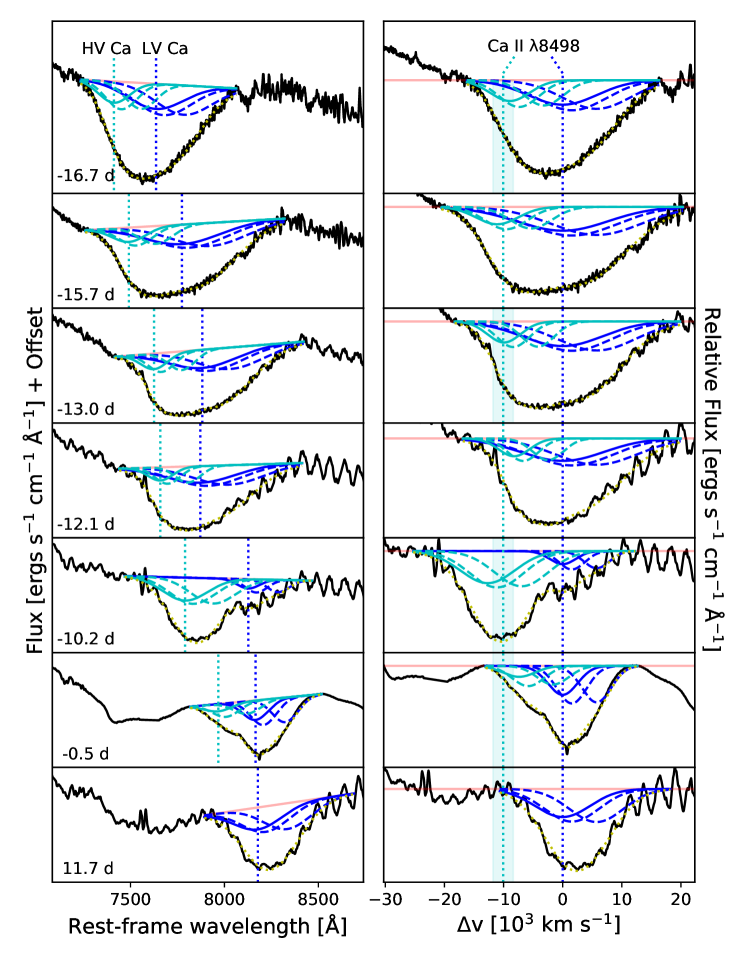
We apply multi-component Gaussian fitting to the Ca II NIR triplet that is often used in Type Ia SNe to search for HVFs. We use the method described in Section 3.2 to fit either one or two velocity components to the feature. However, since the Ca II NIR triplet consists of three lines (8498, 8542 and 8662 Å) a triplet of symmetric Gaussians is used to fit each velocity component. We use three fit parameters for each triplet of Gaussians based on Silverman et al. (2015): (1) the central wavelength of the first Gaussian, representing that of the Ca II 8498 Å minimum; (2) the scale height of the first Gaussian, representing the strength of Ca II 8498 Å; and (3) the width shared across all three Gaussians. We fix the positions of the other two lines (8542 and 8662 Å) according to the redshift of Ca II 8498 Å, and scale them according to their relative strengths using their -weights¶¶¶http://www.nist.gov/pml/data/asd.cfm in the optically-thin regime. Similar fitting of the Ca II NIR triplet in SN 2012fr has shown that the choice of optically-thin regime does not substantially affect the measurements, though the fit can be slightly better the optically-thick case for early Type Ia SNe (Childress et al., 2013). For noise estimation, we apply the second-order Savitsky-Golay filter with an increased width of 200 Å for the FTS spectra (Table 4) due to increased noise towards the red edge of the wavelength range accommodated by the increased width of the Ca II NIR triplet feature ( 500 Å in all epochs).
Figure 14 (left panels) shows the multi-Gaussian best-fits (yellow dotted curves) to the Ca II NIR triplet for a sample of the spectra of SN 2021aefx. We find that a single component is inadequate for the eight spectra from 0.5 days, while excellent fits are obtained using two components with in the range of 1.3–8.0. We call the components closer to the red and blue edges of the feature as “Low-Velocity” (LV) and “High-Velocity” (HV) Ca II, respectively. The blue and cyan curves show the fitted triplets for LV and HV Ca II, respectively, where the solid curves represent the Ca II 8498 Å line and the dashed curves do 8542 and 8662 Å.
For the twelve spectra after -band maximum we obtain good fits with a single velocity component ( in the range of 1.0–3.9) except for two spectra with particularly high S/N = 74 and 46 from 12.4 and 52.3 days, respectively. For those two spectra, we can obtain a slightly improved by fitting two velocity components. However, the resulting LV Ca II velocities are 6500 km s-1 in both epochs—far below expectations for Type Ia SN photospheric velocities—while the one-component fits result in velocities that closely trace the Si II PVF velocity evolution in all epochs (see Figure 7). Thus, we adopt the one-component fit for all twelve spectra. The measured LV and HV Ca II velocities are presented in Table 4 and shown in Figure 7 (bottom panel; pentagons and diamonds, respectively).
We identify three critical phase changes in the evolution of the Ca II NIR triplet velocity of SN 2021aefx as follows:
-
1.
The velocity evolution of LV Ca II initially traces that of the Si II HVF closely until 3.6 rest-frame days post-explosion and also the HVF plateau until 5 days. HV Ca II is extremely fast, averaging (10.1 1.7) km s-1 faster than that of the LV Ca II.
-
2.
Sparse observations from 5 days onward, until near the end of the HVF plateau, appear to show the velocity of LV Ca II dropping to the level of the Si II PVF while HV Ca II drops to near that of the Si II HVF.
-
3.
After -band maximum, the velocity evolution of LV Ca II continues to closely trace that of the Si II PVF, while HV Ca II can no longer be identified.
The close correlation between the velocity evolution of some components of the Ca II NIR triplet and those of the Si II PVF and HVF suggests the co-distribution of Ca II with PVF- and HVF-velocity Si II in the split-velocity ejecta, following two photospheres (Section 6). However, the nature of the HV Ca II component during the first evolutionary phase remains unclear, warranting future investigation. The observed HV Ca II velocity of (40,770 100) km s-1 in the earliest spectrum of SN 2021aefx from 16.7 rest-frame days since -band maximum (or 0.6 days post-explosion) is the highest expansion velocity ever observed in a Type Ia SN (Silverman et al., 2015) as well as extreme for any type of SN, surpassed only by SNe associated with gamma ray bursts (Izzo et al., 2019). We note that the observed ratio of 1.4 between the velocities of HV and LV Ca II in the first evolutionary phase appears to be similar to the ratio of 1.32 between the Si II HVF and PVF velocities (Section 3.4). If the HV and PV components of Ca II are analogous to the HVF and PVF components of Si II, then fast-expanding material within the outer few % of the line of sight ejecta mass could be one possible origin for the early HV Ca II feature.
References
- Afsariardchi et al. (2019) Afsariardchi, N., Moon, D.-S., Drout, M. R., et al. 2019, ApJ, 881, 22, doi: 10.3847/1538-4357/ab2be6
- Allison et al. (2014) Allison, J. R., Sadler, E. M., & Meekin, A. M. 2014, MNRAS, 440, 696, doi: 10.1093/mnras/stu289
- Arnett (1982) Arnett, W. D. 1982, ApJ, 253, 785, doi: 10.1086/159681
- Ashall et al. (2022) Ashall, C., Lu, J., Shappee, B. J., et al. 2022, ApJ, 932, L2, doi: 10.3847/2041-8213/ac7235
- Aznar-Siguán et al. (2015) Aznar-Siguán, G., García-Berro, E., Lorén-Aguilar, P., Soker, N., & Kashi, A. 2015, MNRAS, 450, 2948, doi: 10.1093/mnras/stv824
- Blondin et al. (2012) Blondin, S., Matheson, T., Kirshner, R. P., et al. 2012, AJ, 143, 126, doi: 10.1088/0004-6256/143/5/126
- Boos et al. (2021) Boos, S. J., Townsley, D. M., Shen, K. J., Caldwell, S., & Miles, B. J. 2021, ApJ, 919, 126, doi: 10.3847/1538-4357/ac07a2
- Bostroem et al. (2021) Bostroem, K. A., Jha, S. W., Randriamampandry, S., et al. 2021, Transient Name Server Classification Report, 2021-3888, 1
- Botyánszki et al. (2018) Botyánszki, J., Kasen, D., & Plewa, T. 2018, ApJ, 852, L6, doi: 10.3847/2041-8213/aaa07b
- Branch et al. (1983) Branch, D., Lacy, C. H., McCall, M. L., et al. 1983, ApJ, 270, 123, doi: 10.1086/161103
- Branch et al. (2006) Branch, D., Dang, L. C., Hall, N., et al. 2006, PASA, 118, 560, doi: 10.1086/502778
- Brown et al. (2014) Brown, P. J., Kuin, P., Scalzo, R., et al. 2014, ApJ, 787, 29, doi: 10.1088/0004-637X/787/1/29
- Brown et al. (2013) Brown, T. M., Baliber, N., Bianco, F. B., et al. 2013, PASA, 125, 1031, doi: 10.1086/673168
- Burns et al. (2011) Burns, C. R., Stritzinger, M., Phillips, M. M., et al. 2011, AJ, 141, 19, doi: 10.1088/0004-6256/141/1/19
- Burns et al. (2014) —. 2014, ApJ, 789, 32, doi: 10.1088/0004-637X/789/1/32
- Burns et al. (2018) Burns, C. R., Parent, E., Phillips, M. M., et al. 2018, ApJ, 869, 56, doi: 10.3847/1538-4357/aae51c
- Chevalier (1982) Chevalier, R. A. 1982, ApJ, 258, 790, doi: 10.1086/160126
- Childress et al. (2013) Childress, M. J., Scalzo, R. A., Sim, S. A., et al. 2013, ApJ, 770, 29, doi: 10.1088/0004-637X/770/1/29
- Contardo et al. (2000) Contardo, G., Leibundgut, B., & Vacca, W. D. 2000, A&A, 359, 876. https://arxiv.org/abs/astro-ph/0005507
- Contreras et al. (2018) Contreras, C., Phillips, M. M., Burns, C. R., et al. 2018, ApJ, 859, 24, doi: 10.3847/1538-4357/aabaf8
- Deckers et al. (2022) Deckers, M., Maguire, K., Magee, M. R., et al. 2022, MNRAS, 512, 1317, doi: 10.1093/mnras/stac558
- DerKacy et al. (2023) DerKacy, J. M., Ashall, C., Hoeflich, P., et al. 2023, ApJ, 945, L2, doi: 10.3847/2041-8213/acb8a8
- Dessart et al. (2020) Dessart, L., Leonard, D. C., & Prieto, J. L. 2020, A&A, 638, A80, doi: 10.1051/0004-6361/202037854
- Dimitriadis et al. (2019) Dimitriadis, G., Foley, R. J., Rest, A., et al. 2019, ApJ, 870, L1, doi: 10.3847/2041-8213/aaedb0
- Dimitriadis et al. (2023) Dimitriadis, G., Maguire, K., Karambelkar, V. R., et al. 2023, MNRAS, doi: 10.1093/mnras/stad536
- Fitzpatrick (1999) Fitzpatrick, E. L. 1999, PASP, 111, 63, doi: 10.1086/316293
- Foley et al. (2012) Foley, R. J., Challis, P. J., Filippenko, A. V., et al. 2012, ApJ, 744, 38, doi: 10.1088/0004-637X/744/1/38
- Gerardy et al. (2004) Gerardy, C. L., Höflich, P., Fesen, R. A., et al. 2004, ApJ, 607, 391, doi: 10.1086/383488
- Guillochon et al. (2010) Guillochon, J., Dan, M., Ramirez-Ruiz, E., & Rosswog, S. 2010, ApJ, 709, L64, doi: 10.1088/2041-8205/709/1/L64
- Guillochon et al. (2017) Guillochon, J., Parrent, J., Kelley, L. Z., & Margutti, R. 2017, ApJ, 835, 64, doi: 10.3847/1538-4357/835/1/64
- Hoeflich et al. (1995) Hoeflich, P., Khokhlov, A. M., & Wheeler, J. C. 1995, ApJ, 444, 831, doi: 10.1086/175656
- Hook et al. (2004) Hook, I. M., Jørgensen, I., Allington-Smith, J. R., et al. 2004, PASP, 116, 425, doi: 10.1086/383624
- Hosseinzadeh et al. (2017) Hosseinzadeh, G., Sand, D. J., Valenti, S., et al. 2017, ApJ, 845, L11, doi: 10.3847/2041-8213/aa8402
- Hosseinzadeh et al. (2022) Hosseinzadeh, G., Sand, D. J., Lundqvist, P., et al. 2022, ApJ, 933, L45, doi: 10.3847/2041-8213/ac7cef
- Hsiao et al. (2007) Hsiao, E. Y., Conley, A., Howell, D. A., et al. 2007, ApJ, 663, 1187, doi: 10.1086/518232
- Iben & Tutukov (1984) Iben, I., J., & Tutukov, A. V. 1984, ApJS, 54, 335, doi: 10.1086/190932
- Izzo et al. (2019) Izzo, L., de Ugarte Postigo, A., Maeda, K., et al. 2019, Nature, 565, 324, doi: 10.1038/s41586-018-0826-3
- Jiang et al. (2018) Jiang, J.-a., Doi, M., Maeda, K., & Shigeyama, T. 2018, ApJ, 865, 149, doi: 10.3847/1538-4357/aadb9a
- Jiang et al. (2017) Jiang, J.-A., Doi, M., Maeda, K., et al. 2017, Nature, 550, 80, doi: 10.1038/nature23908
- Jiang et al. (2021) Jiang, J.-a., Maeda, K., Kawabata, M., et al. 2021, ApJ, 923, L8, doi: 10.3847/2041-8213/ac375f
- Kasen (2010) Kasen, D. 2010, ApJ, 708, 1025, doi: 10.1088/0004-637X/708/2/1025
- Kasen & Woosley (2009) Kasen, D., & Woosley, S. E. 2009, ApJ, 703, 2205, doi: 10.1088/0004-637X/703/2/2205
- Kim et al. (2016) Kim, S.-L., Lee, C.-U., Park, B.-G., et al. 2016, Journal of the Korean Astronomical Society, 49, 37, doi: 10.5303/JKAS.2016.49.1.037
- Kollmeier et al. (2019) Kollmeier, J. A., Chen, P., Dong, S., et al. 2019, MNRAS, 486, 3041, doi: 10.1093/mnras/stz953
- Kromer et al. (2013) Kromer, M., Pakmor, R., Taubenberger, S., et al. 2013, ApJ, 778, L18, doi: 10.1088/2041-8205/778/1/L18
- Kuchner et al. (1994) Kuchner, M. J., Kirshner, R. P., Pinto, P. A., & Leibundgut, B. 1994, ApJ, 426, L89, doi: 10.1086/187347
- Kushnir et al. (2013) Kushnir, D., Katz, B., Dong, S., Livne, E., & Fernández, R. 2013, ApJ, 778, L37, doi: 10.1088/2041-8205/778/2/L37
- Kutsuna & Shigeyama (2015) Kutsuna, M., & Shigeyama, T. 2015, PASJ, 67, 54, doi: 10.1093/pasj/psv028
- Kwok et al. (2023) Kwok, L. A., Jha, S. W., Temim, T., et al. 2023, ApJ, 944, L3, doi: 10.3847/2041-8213/acb4ec
- Lee et al. (2022) Lee, Y., Kim, S. C., Moon, D.-S., et al. 2022, ApJ, 925, L22, doi: 10.3847/2041-8213/ac4c41
- Li et al. (2019) Li, W., Wang, X., Vinkó, J., et al. 2019, ApJ, 870, 12, doi: 10.3847/1538-4357/aaec74
- Li et al. (2021) Li, W., Wang, X., Bulla, M., et al. 2021, ApJ, 906, 99, doi: 10.3847/1538-4357/abc9b5
- Maeda et al. (2010a) Maeda, K., Röpke, F. K., Fink, M., et al. 2010a, ApJ, 712, 624, doi: 10.1088/0004-637X/712/1/624
- Maeda et al. (2010b) Maeda, K., Benetti, S., Stritzinger, M., et al. 2010b, Nature, 466, 82, doi: 10.1038/nature09122
- Magee & Maguire (2020) Magee, M. R., & Maguire, K. 2020, A&A, 642, A189, doi: 10.1051/0004-6361/202037870
- Magee et al. (2020) Magee, M. R., Maguire, K., Kotak, R., et al. 2020, A&A, 634, A37, doi: 10.1051/0004-6361/201936684
- Maoz et al. (2014) Maoz, D., Mannucci, F., & Nelemans, G. 2014, ARA&A, 52, 107, doi: 10.1146/annurev-astro-082812-141031
- Marion et al. (2013) Marion, G. H., Vinko, J., Wheeler, J. C., et al. 2013, ApJ, 777, 40, doi: 10.1088/0004-637X/777/1/40
- Marion et al. (2016) Marion, G. H., Brown, P. J., Vinkó, J., et al. 2016, ApJ, 820, 92, doi: 10.3847/0004-637X/820/2/92
- Matteucci (2012) Matteucci, F. 2012, Chemical Evolution of Galaxies, doi: 10.1007/978-3-642-22491-1
- Mazzali et al. (2022) Mazzali, P. A., Benetti, S., Stritzinger, M., & Ashall, C. 2022, MNRAS, 511, 5560, doi: 10.1093/mnras/stac409
- Mazzali et al. (2007) Mazzali, P. A., Röpke, F. K., Benetti, S., & Hillebrandt, W. 2007, Science, 315, 825, doi: 10.1126/science.1136259
- Meikle et al. (1996) Meikle, W. P. S., Cumming, R. J., Geballe, T. R., et al. 1996, MNRAS, 281, 263, doi: 10.1093/mnras/281.1.263
- Miller et al. (2020) Miller, A. A., Yao, Y., Bulla, M., et al. 2020, ApJ, 902, 47, doi: 10.3847/1538-4357/abb13b
- Milne et al. (2013) Milne, P. A., Brown, P. J., Roming, P. W. A., Bufano, F., & Gehrels, N. 2013, ApJ, 779, 23, doi: 10.1088/0004-637X/779/1/23
- Moffat (1969) Moffat, A. F. J. 1969, A&A, 3, 455
- Moon et al. (2016) Moon, D.-S., Kim, S. C., Lee, J.-J., et al. 2016, in Society of Photo-Optical Instrumentation Engineers (SPIE) Conference Series, Vol. 9906, Ground-based and Airborne Telescopes VI, 99064I, doi: 10.1117/12.2233921
- Moon et al. (2021) Moon, D.-S., Ni, Y. Q., Drout, M. R., et al. 2021, ApJ, 910, 151, doi: 10.3847/1538-4357/abe466
- Mould et al. (2000) Mould, J. R., Huchra, J. P., Freedman, W. L., et al. 2000, ApJ, 529, 786, doi: 10.1086/308304
- Mulligan & Wheeler (2018) Mulligan, B. W., & Wheeler, J. C. 2018, MNRAS, 476, 1299, doi: 10.1093/mnras/sty027
- Ni et al. (2022) Ni, Y. Q., Moon, D.-S., Drout, M. R., et al. 2022, Nature Astronomy, 6, 568, doi: 10.1038/s41550-022-01603-4
- Ni et al. (2023) —. 2023, ApJ, 946, 7, doi: 10.3847/1538-4357/aca9be
- Olling et al. (2015) Olling, R. P., Mushotzky, R., Shaya, E. J., et al. 2015, Nature, 521, 332, doi: 10.1038/nature14455
- Pakmor et al. (2012) Pakmor, R., Kromer, M., Taubenberger, S., et al. 2012, ApJ, 747, L10, doi: 10.1088/2041-8205/747/1/L10
- Park et al. (2017) Park, H. S., Moon, D.-S., Zaritsky, D., et al. 2017, ApJ, 848, 19, doi: 10.3847/1538-4357/aa88ab
- Parrent et al. (2014) Parrent, J., Friesen, B., & Parthasarathy, M. 2014, Ap&SS, 351, 1, doi: 10.1007/s10509-014-1830-1
- Parrent et al. (2012) Parrent, J. T., Howell, D. A., Friesen, B., et al. 2012, ApJ, 752, L26, doi: 10.1088/2041-8205/752/2/L26
- Pereira et al. (2013) Pereira, R., Thomas, R. C., Aldering, G., et al. 2013, A&A, 554, A27, doi: 10.1051/0004-6361/201221008
- Perlmutter et al. (1999) Perlmutter, S., Aldering, G., Goldhaber, G., et al. 1999, ApJ, 517, 565, doi: 10.1086/307221
- Phillips et al. (1999) Phillips, M. M., Lira, P., Suntzeff, N. B., et al. 1999, AJ, 118, 1766, doi: 10.1086/301032
- Pinto & Eastman (2000) Pinto, P. A., & Eastman, R. G. 2000, ApJ, 530, 757, doi: 10.1086/308380
- Piro (2015) Piro, A. L. 2015, ApJ, 808, L51, doi: 10.1088/2041-8205/808/2/L51
- Piro & Morozova (2016) Piro, A. L., & Morozova, V. S. 2016, ApJ, 826, 96, doi: 10.3847/0004-637X/826/1/96
- Piro & Nakar (2013) Piro, A. L., & Nakar, E. 2013, ApJ, 769, 67, doi: 10.1088/0004-637X/769/1/67
- Piro & Nakar (2014) —. 2014, ApJ, 784, 85, doi: 10.1088/0004-637X/784/1/85
- Polin et al. (2019) Polin, A., Nugent, P., & Kasen, D. 2019, ApJ, 873, 84, doi: 10.3847/1538-4357/aafb6a
- Polin et al. (2021) —. 2021, ApJ, 906, 65, doi: 10.3847/1538-4357/abcccc
- Poznanski et al. (2012) Poznanski, D., Prochaska, J. X., & Bloom, J. S. 2012, MNRAS, 426, 1465, doi: 10.1111/j.1365-2966.2012.21796.x
- Quimby et al. (2006) Quimby, R., Höflich, P., Kannappan, S. J., et al. 2006, ApJ, 636, 400, doi: 10.1086/498014
- Riess et al. (1998) Riess, A. G., Filippenko, A. V., Challis, P., et al. 1998, AJ, 116, 1009, doi: 10.1086/300499
- Riess et al. (2016) Riess, A. G., Macri, L. M., Hoffmann, S. L., et al. 2016, ApJ, 826, 56, doi: 10.3847/0004-637X/826/1/56
- Sai et al. (2022) Sai, H., Wang, X., Elias-Rosa, N., et al. 2022, MNRAS, 514, 3541, doi: 10.1093/mnras/stac1525
- Sand et al. (2018) Sand, D. J., Graham, M. L., Botyánszki, J., et al. 2018, ApJ, 863, 24, doi: 10.3847/1538-4357/aacde8
- Sand et al. (2019) Sand, D. J., Amaro, R. C., Moe, M., et al. 2019, ApJ, 877, L4, doi: 10.3847/2041-8213/ab1eaf
- Scalzo et al. (2019) Scalzo, R. A., Parent, E., Burns, C., et al. 2019, MNRAS, 483, 628, doi: 10.1093/mnras/sty3178
- Schlafly & Finkbeiner (2011) Schlafly, E. F., & Finkbeiner, D. P. 2011, ApJ, 737, 103, doi: 10.1088/0004-637X/737/2/103
- Seitenzahl et al. (2013) Seitenzahl, I. R., Ciaraldi-Schoolmann, F., Röpke, F. K., et al. 2013, MNRAS, 429, 1156, doi: 10.1093/mnras/sts402
- Shen et al. (2021) Shen, K. J., Blondin, S., Kasen, D., et al. 2021, ApJ, 909, L18, doi: 10.3847/2041-8213/abe69b
- Silverman et al. (2015) Silverman, J. M., Vinkó, J., Marion, G. H., et al. 2015, MNRAS, 451, 1973, doi: 10.1093/mnras/stv1011
- Skrutskie et al. (2003) Skrutskie, M. F., Cutri, R. M., Stiening, R., et al. 2003, VizieR Online Data Catalog, VII/233
- Stritzinger et al. (2002) Stritzinger, M., Hamuy, M., Suntzeff, N. B., et al. 2002, AJ, 124, 2100, doi: 10.1086/342544
- Stritzinger et al. (2018) Stritzinger, M. D., Shappee, B. J., Piro, A. L., et al. 2018, ApJ, 864, L35, doi: 10.3847/2041-8213/aadd46
- Tanaka et al. (2008) Tanaka, M., Mazzali, P. A., Benetti, S., et al. 2008, ApJ, 677, 448, doi: 10.1086/528703
- Taubenberger et al. (2013) Taubenberger, S., Kromer, M., Pakmor, R., et al. 2013, ApJ, 775, L43, doi: 10.1088/2041-8205/775/2/L43
- Townsley et al. (2019) Townsley, D. M., Miles, B. J., Shen, K. J., & Kasen, D. 2019, ApJ, 878, L38, doi: 10.3847/2041-8213/ab27cd
- Trujillo et al. (2001) Trujillo, I., Aguerri, J. A. L., Cepa, J., & Gutiérrez, C. M. 2001, MNRAS, 328, 977, doi: 10.1046/j.1365-8711.2001.04937.x
- Tucker et al. (2022) Tucker, M. A., Ashall, C., Shappee, B. J., et al. 2022, ApJ, 926, L25, doi: 10.3847/2041-8213/ac4fbd
- Tully & Fisher (1977) Tully, R. B., & Fisher, J. R. 1977, A&A, 54, 661
- Valenti et al. (2021) Valenti, S., Sand, D. J., Wyatt, S., et al. 2021, Transient Name Server Discovery Report, 2021-3864, 1
- Wang et al. (2003) Wang, L., Baade, D., Höflich, P., et al. 2003, ApJ, 591, 1110, doi: 10.1086/375444
- Wang et al. (2009) Wang, X., Filippenko, A. V., Ganeshalingam, M., et al. 2009, ApJ, 699, L139, doi: 10.1088/0004-637X/699/2/L139
- Whelan & Iben (1973) Whelan, J., & Iben, Icko, J. 1973, ApJ, 186, 1007, doi: 10.1086/152565
- Yaron et al. (2017) Yaron, O., Perley, D. A., Gal-Yam, A., et al. 2017, Nature Physics, 13, 510, doi: 10.1038/nphys4025
- Zhang et al. (2021) Zhang, K. D., Murakami, Y. S., Stahl, B. E., Patra, K. C., & Filippenko, A. V. 2021, MNRAS, 503, L33, doi: 10.1093/mnrasl/slab020