InsightPilot: An LLM-Empowered Automated Data Exploration System
Abstract
Exploring data is crucial in data analysis, as it helps users understand and interpret the data more effectively. However, performing effective data exploration requires in-depth knowledge of the dataset, the user intent and expertise in data analysis techniques. Not being familiar with either can create obstacles that make the process time-consuming and overwhelming.
To address this issue, we introduce InsightPilot, an LLM (Large Language Model)-based, automated data exploration system designed to simplify the data exploration process. InsightPilot features a set of carefully designed analysis actions that streamline the data exploration process. Given a natural language question, InsightPilot collaborates with the LLM to issue a sequence of analysis actions, explore the data and generate insights. We demonstrate the effectiveness of InsightPilot in a user study and a case study, showing how it can help users gain valuable insights from their datasets.
1 Introduction
Exploratory data analysis (EDA) is a demanding task that extracts meaningful insights from data Komorowski et al. (2016); Jebb et al. (2017); Devore (2007). Data exploration is a critical step in data analysis. In general, it involves a series of data analysis operations, such as filtering, sorting, and grouping, to discover patterns in data. Usually, the process is iterative and interactive, and the user needs to manually explore the data back-and-forth to gain insights. This process is often time-consuming and requires considerable domain knowledge and expertise. Below, we present an example to illustrate a data exploration process.
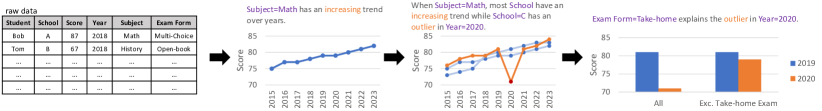
Example. Using a student performance dataset from multiple schools (Figure 1), an education analyst, Alice, conducts EDA to comprehend trends in math performance. After considerable manual data filtering and sorting, Alice captures an upward trend by plotting math scores over time. Alice then puts in more effort into manual data filtering for comparing student performance across schools A, B, and C. Finally, she observes that both schools A and B illustrate an increasing trend while school C has an outlier in 2020. Alice is curious and decides to investigate the outlier. She spends even more time exploring the data back-and-forth, filtering and grouping by various variables until she finally finds that when excluding “take-home” exams, the outlier for school C in 2020 is no longer present. Alice notes this finding and concludes that the outlier is caused by a policy change of the exam form in school C in 2020.
Alice’s manual data sifting for insights is effort-intensive and time-consuming, highlighting the need for an efficient automated data exploration system to simplify the process.
Existing Solutions. To date, a number of data exploration systems have been proposed in the data management and data mining community Bar El et al. (2020); Chanson et al. (2022); Personnaz et al. (2021); Cao et al. (2023). In general, these systems leverage a heuristic score function to identify the “best” data exploration sequence (a series of data analysis operations). While these systems show potential, they exhibit key limitations. ➊ User Intent Ignorance: Existing tools are designed for general exploration and often fail to incorporate user intent. For instance, an analyst may be interested in understanding the economics-related factors but receive insights about demographics. ➋ Dataset Characteristic Ignorance: They overlook dataset characteristics, often providing irrelevant insights. For instance, in a flight delay dataset, a correlation between flight delays and weather might yield insights but irrelevant factors like time and weather does not make sense in the context. They fall short in delivering a direct answers to the user question.
Recently, large language models (LLM) have shown promising potential in understanding user intent and generating actions to achieve user-specified goals Yao et al. (2022). In this regard, we anticipate that LLM can be leveraged to drive the data exploration process. However, there are several challenges that impede the adoption. ➌ Hallucination: Due to the infamous hallucination issue Ji et al. (2023), LLMs often generate unreliable contents and are thus not mature for production use. ➍ Overwhelming Context Window: A dataset may contain millions of cells, which is overwhelming for LLMs to process.
Our Solution. To address these challenges, we propose InsightPilot, a system that automates data exploration using LLMs. This system facilitates exploration through the synergy of an LLM and an insight engine, which integrates three production-quality insight discovery tools: QuickInsight Ding et al. (2019), MetaInsight Ma et al. (2021), and XInsight Ma et al. (2023) (detailed in Sec. 5.1). These tools offers a unified insight representation, enabling the LLM to engage coherently. The insight engine provides the LLM with accurate and reliable insights, avoiding hallucination. Furthermore, the insight engine presents a concise abstraction of the dataset to alleviate the overwhelming context window issue. In InsightPilot, users input high-level queries, like “show me the interesting trend in mathematics scores for students”. Then, the InsightPilot employ an LLM to interact with the insight engine using a set of carefully designed analysis actions to streamline common data exploration tasks. These actions serve as a coherent transition to chain up insights and generate a data exploration sequence to answer the user’s question. Finally, InsightPilot summarizes the results using natural language together with charts that are understandable to non-technical users.
Contributions. In summary, we make the following contributions: We propose InsightPilot, an automated system for data exploration that employs LLMs to drive the exploration process. InsightPilot streamlines the exploration process by interacting with an insight engine using a set of carefully designed analysis actions. We conduct a user study and a case study to demonstrate the effectiveness of InsightPilot in real-world scenarios.
2 Related Work
Text-to-SQL. To date, text-to-SQL is the most popular approach to enabling natural language interface to database. It translates users’ utterances into SQL queries for relational databases and has been studied by both database and NLP communities for several decades Yu et al. (2018); Kim et al. (2020); Ma and Wang (2022). Recent studies have shown that with LLM, text-to-SQL can now be augmented to support non-SQL enquiries such as entity extraction Cheng et al. (2023). However, in EDA, users’ intents are often more complex than simple SQL queries. EDA generally involves more complicated user intents and goes beyond the expressiveness of basic SQL queries. We take a step further by using an LLM and analysis actions in InsightPilot, to produce natural and coherent data exploration sequences that accurately address users’ questions. This innovation provides an important complement to the existing text-to-SQL approach.
Analytics Model in OLAP. Traditionally, users interact with OLAP (online analytical processing) systems with a set of pre-defined operators (e.g., drill-down and roll-up) Vassiliadis and Sellis (1999). Recently, there is a surge of interest in developing analytics models with higher-level abstraction and automation to facilitate complex OLAP needs Vassiliadis et al. (2019). In InsightPilot, we use “analysis actions” to describe such high-level abstractions.
3 Preliminaries
In this section, we introduce the preliminaries of exploratory data analysis.
Data Model. Let represents multi-dimensional data comprising attributes, where each attribute is either a dimension or a measure. A dimension is a categorical attribute that can be used to group data. A measure is a numerical attribute that can be used to perform aggregation operations. In InsightPilot, filter is the basic unit of data operations. Given a multi-dimensional data and a dimension , a filter (e.g., “Subject=Math”) implies an equality assertion to such that the value of will equal . A subspace is a conjunction of filters on disjoint dimensions (e.g., “Subject = Math AND Year = 2019”). A breakdown dimension is the dimension where the group-by operation is performed. Given a measure , users may perform aggregation operations (such as SUM and AVG in SQL) over some records for .
Analysis Entity (AE). An AE is defined as a 3-tuple , where is a measure with an aggregation function agg applied, is a subspace, and is a breakdown dimension. It can be interpreted as an equivalent SQL query that performs aggregation operations over a set of records for the measure in a subspace , grouped by the breakdown dimension . For instance, the AE is equivalent to the SQL query SELECT AVG(Score) FROM Table WHERE Subject = Math GROUP BY Year.
Data Insight. A basic data insight is represented as a 3-tuple . Here, AE denotes an analysis entity, Type specifies the insight’s kind (e.g., trend, outlier), and Property encapsulates additional outputs from insight mining algorithms, like extreme points for a unimodality pattern. We categorize insights into basic insights, directly derived from data (e.g., trend insights), and compound insights, which build upon other insights. A meta-insight, for instance, summarizes several similar insights (e.g., sales trends across various cities). Both insight categories can be expressed as the 3-tuple format. Throughout this paper, "insight" pertains to both types. We have crafted templates to articulate these insights in user-friendly language, accompanied by visualizations.
4 Problem Definition
In this section, we define the problem of generating a sequence of data insights to address users’ analysis intents.
Analysis Actions. An analysis action is defined as a transition from one data insight to several other data insights (which may also be no insight or solely one insight). In our context, an action represents a reasonable data analysis operation with the existing knowledge (e.g., user question, dataset, and explored insights). This is defined as a function , where denotes the set of all possible data insights. In addition, we define two special analysis actions, namely, and . that takes a dataset as input and provides a set of initial insights and that backtracks to the last state and returns the insights generated by the preceding analysis action.
Data Exploration Sequence. A data exploration sequence is defined as a series of data insights interconnected by analysis actions. It is represented as , where is a data insight picked from the output of the preceding analysis action , is an analysis action, and symbolizes the termination. Each analysis action takes the preceding data insight as input and produces multiple insights to be picked for the next analysis action.
Generating Final Answer. Given a user question and the data exploration sequence , we define the problem of generating a final answer as a function , where is the final answer to the user question and is the top-k of all data insights generated in the data exploration sequence (including unpicked insights). The final answer can be obtained by any document QA techniques over .
Application Scope. In InsightPilot, we focus on the class of data analysis tasks are expressed as fuzzy and high-level tasks. These are tasks where the user’s intent is not explicitly clear or the analysis objective is often complex, requiring multiple steps to fully address. For example, a fuzzy high-level task could be “Analyze sales performance over the past year.” The exact steps required to answer this question are not specified, and a variety of different analysis actions and insights may be required to provide a comprehensive answer. Note that while we focus on this specific class of questions, the unique feature of InsightPilot can be integrated with other systems (e.g., text-to-SQL) and support diverse data analysis scenarios.
5 InsightPilot Design
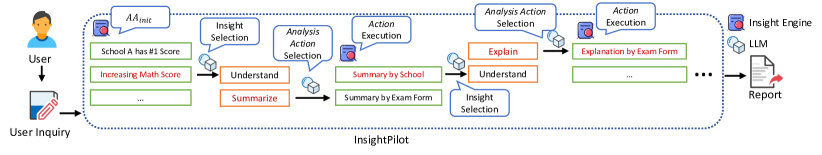
Figure 2 depicts the overview of InsightPilot. Overall, InsightPilot constitutes a pipeline of three components: (1) a user interface that enables users to issue inquiries in natural language, and also depicts analysis results in texts and charts; (2) a LLM that drives the exploration process by selecting appropriate insights and analysis intents based on the context (e.g., user question, dataset domain knowledge, and current exploration state); (3) an insight engine that executes analysis action, generates insights, and presents results in natural language.
Working Example. In Figure 2, InsightPilot is illustrated using the example from Figure 1. A user poses a query: “show me any interesting trend in mathematics scores for students”. The insight engine then generates initial insights with . One such insight might be “School A has the Rank#1 average score.” Based on the user’s question, the LLM identifies the most pertinent insight, such as “the mathematics scores of students have been increasing over time”, using predefined prompts (refer Sec. 5.2). After choosing the insight, we prepare potential analysis actions and the LLM selects an appropriate one, in this case, compare (details in Sec. 5.1). Executing this action, the insight engine summarizes the math scores trend across schools. It observes: “most schools show rising math scores, except for an outlier in 2020 for school C.” To delve deeper, the LLM continues to select insights and actions, eventually querying the engine to “explain the 2020 outlier for school C”.
Interactions continue until the LLM completes its exploration (i.e., choose as the next action) or hits the token size limit. Once done, insights are translated to natural language for the prompt. Given the typically large number of insights, insight ranking becomes crucial. The insight engine then presents the top- insights, which the LLM condenses into a coherent report. This report and the top- insights (in the form of charts) are then displayed to the user via the interface.
5.1 Analysis Action
Every time the LLM selects an insight and an analysis action, the insight engine will execute the action and generate new insights. Currently, we have prepared four analysis actions for the LLM to select: understand, summarize, compare, and explain. These actions are in accordance with three insight discovery solutions, namely QuickInsight Ding et al. (2019) for understand, MetaInsight Ma et al. (2021) for summarize and compare, and XInsight Ma et al. (2023) for explain. We now elaborate on the design of these analysis actions.
➀ Understand. This action is designed to help users understand the high-level patterns in the data. In particular, it attempts to enumerate all possible AEs (see definition in Sec. 3) under the AE of input insight, applies the insight mining algorithm (e.g., trend detection) on each AE to identify basic insight and transforms them into human-understandable natural language.
➁ Summarize. This action aims to view an input insight from various angles. Starting with a basic insight (like a trend), it employs a specific insight mining algorithm on the AEs of the input to verify the presence of the primary insight type and property (e.g., an increasing trend) across each AE. If consistent across all AEs, the output is “the basic insight type and property are universal among AEs”. If not, it’s “the basic insight type and property are present in some AEs”. Using the example insight of an “increasing math score trend”, the outcome could be “most schools show rising math scores, barring school C” or “in most subjects, scores have risen over time”. These compound insights can be further explored by subsequent analysis actions.
➂ Compare. This action shares a similar design with summarize. It is designed to compare the input insight from different neighbors. In particular, it starts with a basic insight (e.g., a trend) and then applies the particular insight mining algorithm on the neighboring AEs. Given an input insight “the increasing trend of the mathematics scores in school A”, it will generate a comparison of the trend regarding different schools, e.g., “the mathematics scores of students in school A and B have been increasing over time, except school C.” This comparison is also represented by a compound insight.
➃ Explain. This action is designed to explain the insight that reveals a difference or an outlier in the data. It supports both basic insights (e.g., a outlier insight or a change point insight) and compound insights (e.g., a summary insight with an exceptional case). Given the input insight with difference or outlier, it will identify a subspace that is responsible for the outcome using causal inference and then constitute a new compound insight to encode the cause. For example, given “the outlier of the mathematics scores in 2020 for school C”, it will identify explanations such as “the difference on the mathematics scores of students in school C between 2019 and 2020 is caused by Exam Form=Take-home. When excluding Exam Form=Take-home, 2020 is no longer an outlier.”
5.2 Prompt Engineering
To deliver a self-contained presentation, we describe the design of our prompt engineering techniques. In general, any agent-based prompt template (e.g., ReACT Yao et al. (2022)) can be used to instantiate InsightPilot. We prepare separate prompt templates for different stages of InsightPilot for selecting insights and analysis actions, and for finalizing the answer. Routine instructions are used in the prompt to improve the usefulness, clarity, and coherence of the LLM outputs.
5.3 Insight Ranking
Consider the final answer generation phase detailed in Sec. 4. The insight engine often yields an overwhelming number of insights, sometimes reaching hundreds within a single exploration sequence. Given the LLM’s capacity, it is infeasible to process all these insights. Thus, we prioritize by extracting the top- insights. Notably, the value of surpasses the count of selected insights in the exploration sequence (), ensuring the chosen insights are encompassed within the top-. Next, we present three schemes to rank top- insights.
Redundant Insight Elimination. Trivial insights can be eliminated if they are entailed by a more informative insight. For example, if three insight #1: “School=A has the highest mathematics score,” #2: “School=A has the highest score in 2022,” and #3 “School=A has the highest mathematics score in 2022” are generated, we can exclude the third insight since it trivially derives from the first two. Enlightened by this observation, we propose to eliminate insights that are entailed by other insights. In particular, such elimination is achieved by identifying insights by looping through every possible pair of insights and checking if there exists a dominator to make one of them trivial.

Semantic Similarity-based Elimination. To further decrease the number of insights for the LLM to handle, we employ semantic similarity. We identify the top- () insights most relevant to the user’s question using an embedding model that transforms text inputs into vector representations. By calculating the cosine similarity between each insight’s vector and the user’s question, we rank the insights, selecting the top- most relevant ones. This method not only reduces the LLM’s processing load, but it also ensures the retained insights align closely with the user’s question.
Diversity-aware Reranking. After applying the above two strategies, we obtain the top- insights. Then, we seek to re-rank them according to their diversity to provide the top- insight. In the context of recommending a set of insights, the goal is to select insights with high individual scores and low redundancy. This can be thought of as maximizing the total usefulness of the selected insights. To achieve this, we leverage the second-order approximated ranking algorithm as explained in Ma et al. (2021) to determine the order.
6 Evaluation
Implementation. We implement our tool based on the codebases of QuickInsight, MetaInsight, and XInsight, adding an additional 1.8K lines of C# code and 1.5K lines of JavaScript code. We use “gpt-3.5-turbo” as our language model and “text-embedding-ada-002” is used to generate embeddings. Both models are provided by OpenAI.
| InsightPilot | Code Interpreter | Pandas Agent | |
|---|---|---|---|
| Relevance | 4.500.76 | 4.080.86 | 1.921.00 |
| Completeness | 4.670.55 | 3.541.00 | 1.120.33 |
| Understandability | 4.460.64 | 4.250.83 | 1.620.90 |
User Study.
We conduct a user study to simulate the real-world application of InsightPilot, highlighting its unique advantages over existing solutions like OpenAI Code Interpreter OpenAI (2023) and Langchain Pandas Agent Langchain (2023), both being state-of-the-art in their domains. We explored but excluded text-to-SQL models like Flan-T5 Chung et al. (2022) and Anthropic Claude Anthropic (2023), due to their inability to provide direct answers or load the datasets. Four independent data science participants are recruited for the study. They are given two datasets and asked to raise three questions each within the InsightPilot application scope, resulting in 24 groups of comparisons (4 participants 2 datasets 3 questions). They score the systems on Relevance, Completeness and Understandability (scale of 1 to 5).
Results are reported in Table 1. InsightPilot consistently outperforms the others in all three metrics, showcasing its capability in offering relevant, complete and understandable responses. Specifically, InsightPilot is notably better than the Code Interpreter and Pandas Agent in completeness (p-value 0.05). Upon examining the competitors’ responses, we found they often provide an ad-hoc answer to a specific region of the dataset. For example, when inquiring about differences in car sales between Mazda and Toyota, competitors reveal only the overall difference, whereas InsightPilot further analyzes various breakdowns, identifying that “Toyota’s Corolla model accounts for a larger percentage of sales compared to Mazda’s models.”
Case Study. We demonstrate InsightPilot’s use in Figure 3, showcasing a portion of its output (due to space limit). The user is using a car sales dataset and enquiries “I want to know the overall trend of Toyota.” InsightPilot first identifies that “Toyota has a decreasing trend on its sales over the years” and then dives into two representative models of Toyota, namely “Toyota Corolla” and “Toyota Camry.” It identifies that “Corolla” and “Camry” constitute two top-selling models of Toyota and the sales of “Camry” has a strong correlation with the overall Sales of Toyota. Therefore, InsightPilot concludes that the Camry is the key driver of Toyota’s sales. Afterwards, InsightPilot further compares Toyota with Honda and identifies that they are the top-two brands for subcompact cars while Toyota leading the way. Besides, InsightPilot also looks into the sales of Toyota in different years and obtains other interesting insights.
7 Discussion
Action-wise Performance. The efficacy of InsightPilot, an automated data analytics tool, hinges on the comprehensive design of each action and its accurate execution. While we introduce four actions rooted in common data analysis techniques, it is vital to note that InsightPilot’s innovation is not tied to specific action designs. Instead, its uniqueness lies in leveraging LLM for data exploration.
Comprehensive Assessment. To validate InsightPilot’s effectiveness, it is essential to evaluate it across diverse real-life datasets and dimensions, such as keyword preservation. Nonetheless, InsightPilot often produces open-ended responses, making manual evaluation crucial for assessing answer quality. These hurdles make it challenging to efficiently evaluate InsightPilot’s performance in a comprehensive manner. An LLM-based evaluation framework could potentially streamline this process Wang et al. (2023); Li et al. (2023).
8 Conclusion
In this paper, we introduce InsightPilot, an LLM-empowered automated data exploration system. By seamlessly integrating LLM with state-of-the-art insight engines, InsightPilot streamlines data analysis into a coherent exploration sequence. Effective for real-world datasets, it allows users to derive insights via natural language inquiries. InsightPilot equips even non-technical individuals to benefit from data analysis, bolstering efficiency and data-driven decision-making.
Acknowledgement
Rui Ding and Shuai Wang are the corresponding authors.
References
- Anthropic (2023) Anthropic. 2023. Anthropic claude chat. https://claude.ai/chat/.
- Bar El et al. (2020) Ori Bar El, Tova Milo, and Amit Somech. 2020. Automatically generating data exploration sessions using deep reinforcement learning. In Proceedings of the 2020 ACM SIGMOD International Conference on Management of Data, pages 1527–1537.
- Cao et al. (2023) Yukun Cao, Xike Xie, and Kexin Huang. 2023. Learn to explore: on bootstrapping interactive data exploration with meta-learning. In 2023 IEEE 39th International Conference on Data Engineering (ICDE), pages 1720–1733. IEEE.
- Chanson et al. (2022) Alexandre Chanson, Nicolas Labroche, Patrick Marcel, Stefano Rizzi, and Vincent t’Kindt. 2022. Automatic generation of comparison notebooks for interactive data exploration. In EDBT, pages 2–274.
- Cheng et al. (2023) Zhoujun Cheng, Tianbao Xie, Peng Shi, Chengzu Li, Rahul Nadkarni, Yushi Hu, Caiming Xiong, Dragomir Radev, Mari Ostendorf, Luke Zettlemoyer, et al. 2023. Binding language models in symbolic languages. International Conference on Learning Representations.
- Chung et al. (2022) Hyung Won Chung, Le Hou, Shayne Longpre, Barret Zoph, Yi Tay, William Fedus, Eric Li, Xuezhi Wang, Mostafa Dehghani, Siddhartha Brahma, et al. 2022. Scaling instruction-finetuned language models. arXiv preprint arXiv:2210.11416.
- Devore (2007) Jay Devore. 2007. Making sense of data: A practical guide to exploratory data analysis and data mining.
- Ding et al. (2019) Rui Ding, Shi Han, Yong Xu, Haidong Zhang, and Dongmei Zhang. 2019. Quickinsights: Quick and automatic discovery of insights from multi-dimensional data. In ACM SIGMOD International Conference on Management of Data.
- Jebb et al. (2017) Andrew T Jebb, Scott Parrigon, and Sang Eun Woo. 2017. Exploratory data analysis as a foundation of inductive research. Human Resource Management Review, 27(2):265–276.
- Ji et al. (2023) Ziwei Ji, Nayeon Lee, Rita Frieske, Tiezheng Yu, Dan Su, Yan Xu, Etsuko Ishii, Ye Jin Bang, Andrea Madotto, and Pascale Fung. 2023. Survey of hallucination in natural language generation. ACM Computing Surveys, 55(12):1–38.
- Kim et al. (2020) Hyeonji Kim, Byeong-Hoon So, Wook-Shin Han, and Hongrae Lee. 2020. Natural language to sql: Where are we today? VLDB.
- Komorowski et al. (2016) Matthieu Komorowski, Dominic C. Marshall, Justin D. Salciccioli, and Yves Crutain. 2016. Exploratory Data Analysis, pages 185–203. Springer International Publishing, Cham.
- Langchain (2023) Langchain. 2023. Langchain pandas dataframe agent. https://python.langchain.com/docs/integrations/toolkits/pandas.
- Li et al. (2023) Zongjie Li, Chaozheng Wang, Pingchuan Ma, Daoyuan Wu, Tianxiang Li, Shuai Wang, Cuiyun Gao, and Yang Liu. 2023. Split and merge: Aligning position biases in large language model based evaluators. arXiv preprint arXiv:2310.01432.
- Ma et al. (2021) Pingchuan Ma, Rui Ding, Shi Han, and Dongmei Zhang. 2021. Metainsight: Automatic discovery of structured knowledge for exploratory data analysis. In ACM SIGMOD International Conference on Management of Data.
- Ma et al. (2023) Pingchuan Ma, Rui Ding, Shuai Wang, Shi Han, and Dongmei Zhang. 2023. Xinsight: explainable data analysis through the lens of causality. In ACM SIGMOD International Conference on Management of Data.
- Ma and Wang (2022) Pingchuan Ma and Shuai Wang. 2022. Mt-teql: Evaluating and augmenting neural nlidb on real-world linguistic and schema variations. VLDB.
- OpenAI (2023) OpenAI. 2023. Openai code interpreter. https://chat.openai.com/?model=gpt-4-code-interpreter.
- Personnaz et al. (2021) Aurélien Personnaz, Sihem Amer-Yahia, Laure Berti-Equille, Maximilian Fabricius, and Srividya Subramanian. 2021. Balancing familiarity and curiosity in data exploration with deep reinforcement learning. In Fourth Workshop in Exploiting AI Techniques for Data Management, pages 16–23.
- Vassiliadis et al. (2019) Panos Vassiliadis, Patrick Marcel, and Stefano Rizzi. 2019. Beyond roll-up’s and drill-down’s: An intentional analytics model to reinvent olap. Information Systems, 85:68–91.
- Vassiliadis and Sellis (1999) Panos Vassiliadis and Timos Sellis. 1999. A survey of logical models for olap databases. ACM Sigmod Record, 28(4):64–69.
- Wang et al. (2023) Peiyi Wang, Lei Li, Liang Chen, Dawei Zhu, Binghuai Lin, Yunbo Cao, Qi Liu, Tianyu Liu, and Zhifang Sui. 2023. Large language models are not fair evaluators. arXiv preprint arXiv:2305.17926.
- Yao et al. (2022) Shunyu Yao, Jeffrey Zhao, Dian Yu, Nan Du, Izhak Shafran, Karthik Narasimhan, and Yuan Cao. 2022. React: Synergizing reasoning and acting in language models. arXiv preprint arXiv:2210.03629.
- Yu et al. (2018) Tao Yu, Rui Zhang, Kai Yang, Michihiro Yasunaga, Dongxu Wang, Zifan Li, James Ma, Irene Li, Qingning Yao, Shanelle Roman, et al. 2018. Spider: A large-scale human-labeled dataset for complex and cross-domain semantic parsing and text-to-sql task. In Proceedings of the 2018 Conference on Empirical Methods in Natural Language Processing, pages 3911–3921.