Peak Effect, Melting, and Transport in Skyrmion Crystals
Abstract
We numerically examine the transport of skyrmions driven over weak random quenched disorder using a modified Thiele approach that includes the thermal softening of skyrmion pairwise interactions introduced by Wang et al., Phys. Rev. Appl. 18, 044024 (2022). The depinning transition is elastic at low temperatures but becomes plastic with a reduced threshold at higher temperatures due to the competition between thermal creep and thermal softening, indicating a temperature-induced order to disorder transition into a glass state. The resulting non-monotonic critical depinning forces and crossing of the velocity-force curves are similar to what is observed in the peak effect for type-II superconducting vortex lattices, where the softening of vortex-vortex interactions with temperature leads to an order-disorder transition. For low skyrmion densities the peak effect is absent since the system is always in a disordered state. We map the dynamical phase transition as a function of temperature, density, drive, and materials parameters, and show that the signatures are similar to those of the superconducting peak effect. Our results are consistent with recent experiments.
I Introduction
Skyrmions are particle-like magnetic textures that can form in chiral magnets Mühlbauer et al. (2009); Yu et al. (2010); Nagaosa and Tokura (2013); Everschor-Sitte et al. (2018). They have been attracting growing attention as an increasing number of materials are being found that support skyrmions, and a variety of possible applications have been proposed for using skyrmions for memory and novel computing Fert et al. (2017); Wang et al. (2022a). Skyrmions have many similarities to vortices in type-II superconductors Blatter et al. (1994), including the fact that they have repulsive pairwise interactions Lin et al. (2013); Brearton et al. (2020), form triangular lattices Mühlbauer et al. (2009); Yu et al. (2010); Nagaosa and Tokura (2013), can be set into motion with an applied current Nagaosa and Tokura (2013); Everschor-Sitte et al. (2018); Schulz et al. (2012); Yu et al. (2012); Iwasaki et al. (2013), and can interact with and be pinned by quenched disorder so that there is a critical driving force required to set them in motion Schulz et al. (2012); Iwasaki et al. (2013); Reichhardt et al. (2015); Woo et al. (2016); Legrand et al. (2017); Reichhardt et al. (2022); Gruber et al. (2022). In many skyrmion systems, thermal fluctuations are also relevant, and skyrmions have been shown to exhibit diffusion Zázvorka et al. (2019); Zhao et al. (2020), creep behavior Lin et al. (2013); Reichhardt et al. (2022); Reichhardt and Reichhardt (2018); Luo et al. (2020); Litzius et al. (2020), skyrmion lattice melting Huang et al. (2020); Baláž et al. (2021), and skyrmion glass phases Hoshino and Nagaosa (2018). An important difference between skyrmions and superconducting vortices is that the skyrmions have a strong gyrotropic component to their dynamics due to the Magnus force, which causes the skyrmions to move at an angle with respect to an applied driving force Nagaosa and Tokura (2013); Everschor-Sitte et al. (2018); Lin et al. (2013); Iwasaki et al. (2013); Reichhardt et al. (2015); Legrand et al. (2017); Reichhardt et al. (2022); Litzius et al. (2020); Jiang et al. (2017); Litzius et al. (2017); Juge et al. (2019). This gyrotropic term also strongly affects how skyrmions interact with pinning Reichhardt et al. (2015); Legrand et al. (2017); Reichhardt et al. (2022).
One of the most interesting effects observed for superconducting vortex systems is the peak effect, in which the critical depinning force is nonmonotonic and passes through a peak with increasing magnetic field DeSorbo (1964); Pippard (1969); Wördenweber et al. (1986); Bhattacharya and Higgins (1993); Kwok et al. (1994); Banerjee et al. (2000). Here, the depinning threshold initially decreases with increasing field as the vortex density increases since the vortex lattice is becoming stiffer; however, just below the upper magnetic field above which superconductivity is destroyed, the depinning threshold shows a rapid increase followed by a downward plunge, leading to a peak in the depinning force DeSorbo (1964); Pippard (1969); Wördenweber et al. (1986); Bhattacharya and Higgins (1993). It was argued that the pairwise vortex-vortex interactions are modified and reduced at high fields, leading to a softening of the vortex lattice and a reduction of its shear lattice Pippard (1969). A softer lattice can more readily adapt to a random pinning landscape and is better pinned than a stiff lattice. The velocity-force curves also change shape across the peak effect Bhattacharya and Higgins (1993), producing a crossing of the curves in which the depinning threshold is lowest above the peak effect but the flow velocity is lowest below the peak effect Higgins and Bhattacharya (1996). The vortex peak effect also occurs for fixed vortex density as function of increasing temperature Kwok et al. (1994); Paltiel et al. (2000); Ling et al. (2001); Troyanovski et al. (2002); Mohan et al. (2007); Toft-Petersen et al. (2018). Again this is counterintuitive since in general for a particle-based system coupled to quenched disorder, an increase in thermal fluctuations should cause the particles to jump more readily out of the wells, resulting in a monotonic decrease of the critical depinning force with increasing temperature Fisher (1998); Reichhardt and Reichhardt (2017). In the vortex case, the vortex-vortex interactions are also modified by the temperature, leading to a softening of the vortex lattice with increasing temperature.
It has been argued that the superconducting peak effect is produced by a transition from an ordered lattice to a disordered phase that occurs when the vortex lattice becomes soft enough for topological defects to proliferate due to the pinning, strongly reducing or breaking down the elasticity of the lattice Bhattacharya and Higgins (1993). In this sense, the peak effect can also be viewed as a melting transition in the presence of quenched disorder Kwok et al. (1994); Banerjee et al. (2000). Neutron scattering Ling et al. (2001); Gammel et al. (1998) and imaging experiments Troyanovski et al. (2002); Ganguli et al. (2015) have shown transitions from an ordered vortex state below the peak effect to disordered structures at and above the peak effect. In the thermal peak effect, as is further increased above the peak, decreases again due to increasing thermal hopping in the disordered state. The thermal peak effect can be regarded as resulting from a competition between the reduction of the depinning threshold by increasing temperature and the reduction of the pairwise vortex-vortex interactions that tends to increase the depinning force. The sudden increase in the critical force then corresponds to a transition from ordered elastic depinning to disordered plastic depinning. Such a change from elastic to plastic depinning will also alter the shape of the velocity-force curves, which have the form with in the elastic depinning regime and in the plastic depinning regime Reichhardt and Reichhardt (2017).
Noise fluctuations can also be used to probe the peak effect. An ordered lattice moves with low noise, but near the peak effect the vortex lattice breaks apart and depins plastically, producing large large noise, while above the peak the flow becomes more fluid-like and the noise is low again Marley et al. (1995). Since the peak effect separates two different phases, various memory and metastable effects occur when there is a coexistence of the ordered and disordered phases Paltiel et al. (2000); Henderson et al. (1996); Banerjee et al. (1999). Another observation is that the peak effect does not occur in strongly pinned samples where the vortices are always in a disordered state Banerjee et al. (2000). In general, for systems with weaker pinning the peak effect occurs at higher temperatures, indicating that as the pinning strength decreases, the lattice must be softer in order to permit the order to disorder transition to occur Banerjee et al. (2000). There can also be a jump up in the critical depinning force at low fields as the vortex density is decreased, which occurs when the vortices become so far apart that the vortex lattice shear modulus drops to a low value and the system becomes disordered Ghosh et al. (1996). Simulations with modifications to the vortex-vortex interactions have produced a peak in the depinning force Tang et al. (1996).
An open question is whether a skyrmion lattice can also show a peak effect phenomenon similar to that found in the superconducting system, and whether there would be similar changes in the transport properties across the order to disorder transition. Recently Wang et al. Wang et al. (2022b) numerically studied the interactions between two skyrmions as a function of temperature and found that the interactions decrease approximately exponentially with increasing temperature. They proposed that the functional form ), where is a material parameter, could be used to introduce temperature dependence of the interaction into a particle-based model of skyrmions. An interaction of this type suggests that if a skyrmion lattice is in the presence of pinning, under increasing temperature the interactions sharply decrease and the lattice softens, making it possible for a transition to occur from an ordered to a disordered lattice.
Interestingly, in the literature Schulz et al. (2012) it was found that the depinning threshold for skyrmions in MnSi increases with temperature, consistent with the idea that the skyrmion lattice has softened and become better pinned. Luo et al. Luo et al. (2020) used ultrasound spectroscopy to examine a skyrmion lattice in MnSi and measure the depinning force. They found a regime where the critical depinning current decreases with increasing followed by an upturn for further increases in that is correlated with a softening of the skyrmion lattice. This was interpreted as evidence for a skyrmion peak effect similar to that found in the superconducting vortex systems.
In this work we consider a particle based model for skyrmions interacting with pinning where we add thermal fluctuations and modify the skyrmion pairwise interactions according to the exponential decrease with proposed by Wang et al. Wang et al. (2022b). We focus on parameters where the skyrmions form a lattice that depins elastically at . As the temperature increases, we find that the depinning threshold initially decreases due to increased creep; however, when the pairwise interactions become weak enough, the skyrmion lattice disorders and there is a pronounced increase in the depinning threshold. As the temperature is further increased, the depinning threshold decreases again due to increased thermal hopping and eventually goes to zero when the skyrmions form a liquid. The result is the appearance of a peak effect in the depinning force similar to that found for superconducting vortices. At low skyrmion densities or in regimes where the skyrmions are always disordered even for , there is no peak effect. We also find that the velocity-force curves change concavity across the peak effect, resulting in a crossing of the curves. Above the peak effect temperature where the depinning threshold is low, the velocity in the flow regime is lower than that found for the same drive in the lower temperature elastic system. We also show that the skyrmion Hall angle is nonmonotonic and changes across the peak effect regime. Under an increasing external drive at temperatures above but below the melting temperature , the system can undergo dynamical reordering similar to that found for superconducting vortices Bhattacharya and Higgins (1993). The drive at which reordering occurs diverges as is approached, in agreement with the predictions of Koshelev and Vinokur for driven superconducting vortices Koshelev and Vinokur (1994). We construct a dynamic phase diagram and show that it is similar to the diagram observed for superconducting vortices Bhattacharya and Higgins (1993); Hellerqvist et al. (1996), with pinned lattice, pinned glass, plastic flow, and moving crystal regimes. For constant drive well above the depinning threshold, we find that as the temperature increases, the velocity and skyrmion Hall angle both drop across the elastic to plastic phase transition, but increase at higher temperature and saturate above to the values expected for a pin-free system. Our results could be tested with transport, imaging, neutron scattering and noise measurements in skyrmion samples that show a lattice regime.
II Simulation
We work with a particle based model for skyrmions employing a modified Thiele equation approach that has been used in previous studies of skyrmion ordering, depinning, transport, and thermal effects Lin et al. (2013); Reichhardt et al. (2015, 2022); Reichhardt and Reichhardt (2018); Brown et al. (2019); Stidham and Pleimling (2020); Zhou et al. (2021). We consider a two-dimensional (2D) system of size with periodic boundary conditions in the and directions containing skyrmions and pinning sites. The equation of motion for a single skyrmion is
| (1) |
The skyrmion velocity is and is the damping term that aligns the skyrmion velocity in the direction of drive. There is also a gyrotropic or Magnus force component, with coefficient , that generates a velocity perpendicular to the net forces acting on the skyrmion. The repulsive skyrmion-skyrmion interaction force is , where is the distance between skyrmions and and . The coefficient is material dependent. The first order Bessel function form of the interaction was obtained from a fit to a continuum model Lin et al. (2013), and it decreases exponentially at longer range. Imaging studies have found similar skyrmion interactions that decay exponentially at longer range Ge et al. (2023). The pinning force arises from non-overlapping attractive parabolic wells of maximum range and maximum strength , where is the distance between skyrmion and pin and . This is the same form of substrate used in previous particle-based models to study skyrmion depinning Reichhardt et al. (2015, 2022). The driving force is produced by an applied spin-polarized current. The thermal term is modeled by Langevin kicks with the properties and .
In the absence of interactions with other skyrmions or pinning sites, a skyrmion moves at an intrinsic Hall angle of with respect to the applied driving force. In the overdamped case, . We take , and throughout this work we fix and , giving an intrinsic skyrmion Hall angle of that is well within the range of experimental values. We measure the average skyrmion velocity both parallel, , and perpendicular, , to the applied drive, where each quantity is averaged over simulation time steps. From these measurements we obtain the observed skyrmion Hall angle , which is affected by interactions with the pinning landscape, as shown in both simulation and experiment, and generally increases with increasing drive before saturating to the clean value at high drives well above depinning Reichhardt et al. (2015, 2022); Jiang et al. (2017); Litzius et al. (2017); Juge et al. (2019).
Wang et al. Wang et al. (2022b) proposed that the strength of the pairwise skyrmion-skyrmion interactions decreases exponentially with temperature according to the approximate form , where is a material parameter. Here we consider the interaction of two thermal effects. As the temperature increases, the magnitude of the thermal fluctuations also increases, which increases the diffusion of the skyrmions. At the same time, the skyrmion-skyrmion interaction coefficient varies as , causing the skyrmion lattice to soften with increasing temperature. We focus on a system of size with , , a skyrmion density of , , a pinning density of , , , and , but in later sections of the paper we also consider different skyrmion densities and vary over the range to .
III Results
We first consider the effects on the depinning behavior of independently varying the thermal fluctuations and the skyrmion-skyrmion interactions. We focus on a system with skyrmion density , , and . For these parameters, at zero temperature the skyrmions form a triangular lattice that depins elastically without the generation of topological defects.
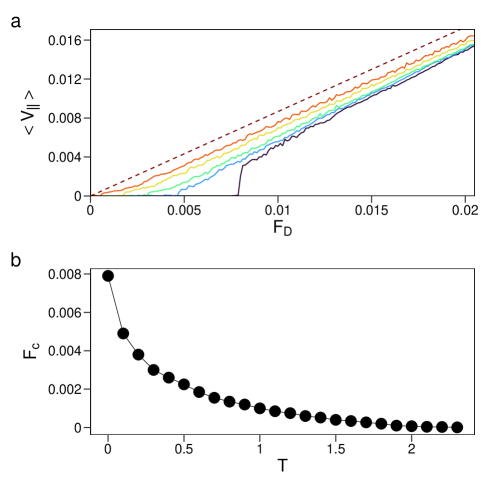
In Fig. 1(a) we plot the velocity-force curves versus for temperatures of , 0.1, 0.2, 0.6, and . Here the skyrmion-skyrmion interaction is not modified as increases; only the magnitude of the thermal fluctuations increases. The dashed line shows the expected response in a pin-free sample with . We find that the depinning threshold decreases monotonically with increasing , and above depinning, for a fixed value of also decreases monotonically. Figure 1(b) shows that the critical depinning force decreases with increasing and drops to zero for , well below the thermally induced melting temperature of . The critical force obtained from the perpendicular velocity (not shown) exhibits similar behavior, and the drive dependent skyrmion Hall angle saturates at higher drives as discussed in previous work Reichhardt and Reichhardt (2018).
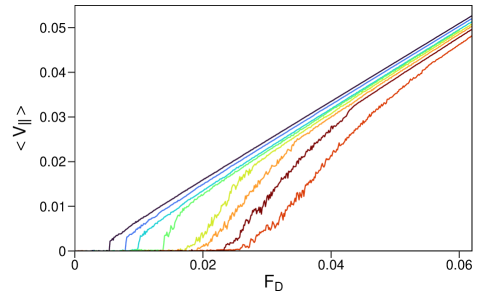
Next we introduce thermal modification of the skyrmion-skyrmion interactions but eliminate the thermal fluctuations so that the Langevin kicks have a temperature of . In Fig. 2 we show some representative velocity-force curves for decreasing values of , 3.0, 1.75, 1.5, 1.25, 1.0, 0.75, and . The depinning force increases monotonically with decreasing due to the softening of the skyrmion-skyrmion interactions. For , 3.0, 1.75, and 1.5, the depinning transition is elastic and the skyrmions maintain the same neighbors as they depin, while for , 1.0, 0.75, and 0.5, the depinning is plastic and the skyrmion lattice breaks apart into river-like regions of flow. We also find that the shape of the velocity-force curves changes across the transition from elastic to plastic depinning.
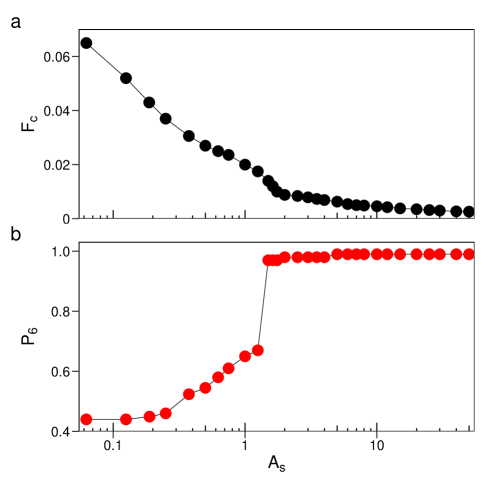
In Fig. 3(a) we plot versus for the samples from Fig. 2, while Fig. 3(b) shows the corresponding fraction of sixfold-coordinated skyrmions versus . Here , where is the coordination number of skyrmion obtained from a Voronoi construction. For , , the depinning is elastic, and decreases slowly with increasing . For , drops with decreasing as the system becomes disordered, and there is a relatively rapid increase in since the disordered skyrmion lattice is better pinned. As decreases further, continues to increase, and the maximum critical force of occurs when (not shown). The onset of plastic depinning with decreasing can be viewed as representing the first part of the peak effect in which the topologically disordered lattice softens and can be better pinned than a clean elastic lattice. As decreases further, however, continues to grow, and at , , so there is no peak in at nonzero values of .
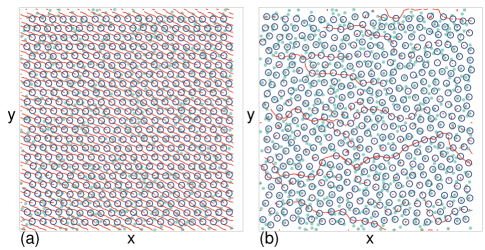
In Fig. 4(a) we illustrate the pinning site locations and skyrmion positions and trajectories for the system in Fig. 3 at just above depinning, where the skyrmions form a lattice that moves as a rigid object. It is also clear that the motion occurs at an angle to the applied drive that is associated with the skyrmion Hall angle. Figure 4(b) shows the same system at where the skyrmions are disordered and only some of the skyrmions are moving while the rest of the skyrmions remain pinned. These results show that in the absence of thermal fluctuations, softening the skyrmion lattice increases the depinning threshold, with a rapid increase in the critical force at the order to disorder transition. This suggests that if thermal fluctuations are combined with a weakening of the skyrmion-skyrmion interaction as temperature increases, the two effects will compete, resulting in the emergence of a peak effect in the depinning threshold.
IV Thermal modification of the Skyrmion-Skyrmion Interaction
We next consider the case where thermal fluctuations are increased at the same time that the skyrmion-skyrmion interaction is adjusted for temperature using the exponential dependence proposed by Wang et al. Wang et al. (2022b), . We fix and set , so that at the system forms a triangular solid that depins elastically, as shown in Fig. 3. For these parameters, in a pin-free system with , a melting transition occurs at via the proliferation of topological defects.
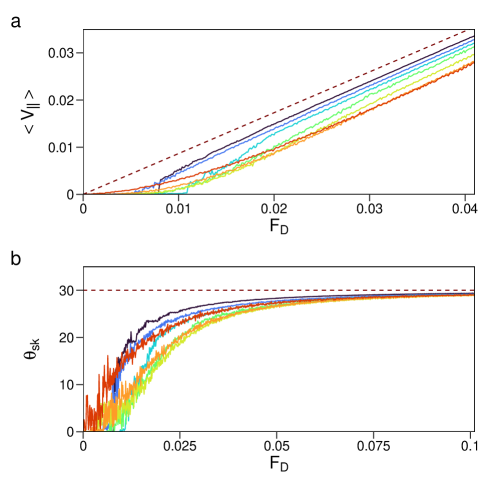
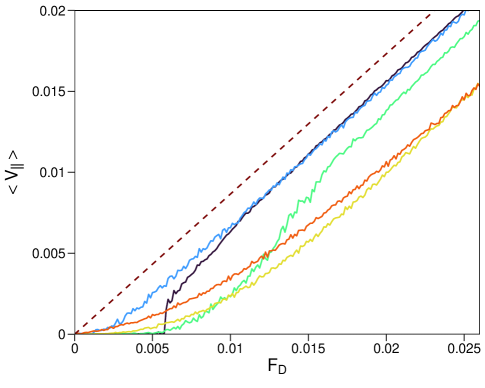
In Fig. 5(a) we plot versus for , 0.26, 0.4346, 0.6086, 0.869, 1.3043, and 1.739, while Fig. 5(b) shows the corresponding skyrmion Hall angle versus . The system depins elastically for and , and in this regime the depinning force decreases with increasing . The shape of the velocity-force curve changes for and the depinning threshold increases since the depinning transition becomes plastic. For even higher , there is an increasing amount of creep in which the velocity becomes finite at lower . A crossing of the velocity-force curves occurs in Fig. 5 since the velocities at higher are lower for higher values of compared to , even though the depinning threshold for is lower than that found for . In the elastic depinning regime for , becomes finite just above depinning, and it initially has a low value but increases rapidly with increasing . The steps that appear in the velocity at depinning when are caused by an alignment of the angle of skyrmion motion with the symmetry direction of the triangular pinning lattice, an effect that was predicted to lead to steps in the velocity-force curves Le Doussal and Giamarchi (1998). This directional locking was studied previously for skyrmions Reichhardt and Reichhardt (2019). In the plastic depinning regime, the skyrmion Hall angle is generally lower. The fluctuations of are largest just above depinning since the angle is calculated from a ratio of two velocities. Figure 5(b) indicates that the skyrmion Hall angle is also non-monotonic as a function of temperature. The lowest value of appears for , and there is a crossing of the skyrmion Hall angle curves that is similar to the crossing of the velocity-force curves. The behavior of the skyrmion Hall angle through the peak effect region is discussed in greater detail in Section V.
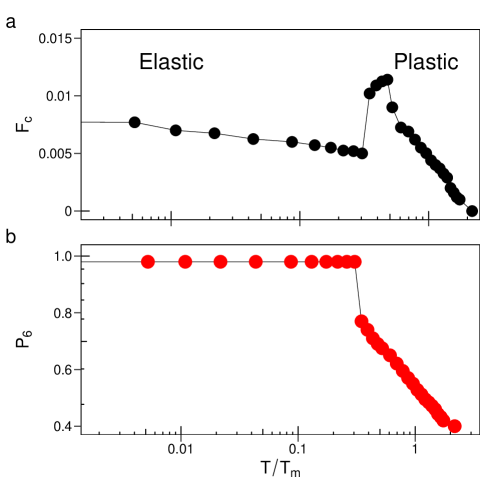
From the velocity-force curves, we obtain the depinning force , defined as the value of at which we first observe . In Fig. 6 we plot and at depinning versus , where is the temperature at which the system melts. Here, initially drops with increasing while remains close to one, indicating that elastic depinning is occurring. For temperatures above , there is a proliferation of topological defects and first increases with temperature before decreasing due to enhanced thermal hopping.
The overall behavior of shown in Fig. 6 is very similar to that found for the thermal peak effect in type-II superconductors, where there is a jump up in the critical depinning force at the elastic to plastic or order to disorder transition, coinciding with a change in the shape of the velocity-force curves that causes a crossing of the curves Kwok et al. (1994); Higgins and Bhattacharya (1996); Paltiel et al. (2000); Ling et al. (2001); Troyanovski et al. (2002); Mohan et al. (2007); Toft-Petersen et al. (2018); Tang et al. (1996) Figure 6 also illustrates that the disordering transition occurs at , similar to the peak effect in superconductors where the combination of thermal fluctuations and pinning cause the vortex lattice to disorder at temperatures below the clean melting temperature. In general, for the superconducting system, as increases, the temperature at which the peak effect occurs is reduced.
V Dynamic Ordering
In superconducting vortex systems, Wigner crystals, and skyrmions, it was shown that when the system is in a plastic depinning regime, as the drive increases the effect of the pinning on the moving particles is reduced and the system can dynamically order into a moving crystal or moving smectic with few topological defects at high drives Bhattacharya and Higgins (1993); Reichhardt and Reichhardt (2017); Reichhardt et al. (2022); Reichhardt and Reichhardt (2019); Yaron et al. (1995); Balents et al. (1998); Pardo et al. (1998); Olson et al. (1998); Reichhardt et al. (2001). In Ref. Bhattacharya and Higgins (1993), Higgins and Bhattacharya construct a dynamic phase diagram across the peak effect showing a transition in the flow above depinning from elastic to disordered, where in the disordered regime above the peak effect, for higher drives the flow becomes ordered again. Koshelev and Vinokur Koshelev and Vinokur (1994) then performed simulations of the plastic depinning of vortices, and found that at higher drives when the vortices are moving sufficiently rapidly over the pinning, the vortex lattice can dynamically reform. The drive at which this dynamical ordering occurs diverges near the melting temperature of the pin-free system.
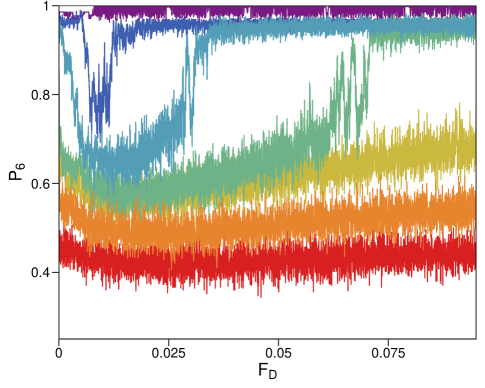
We next study whether dynamical reordering also occurs across the skyrmion peak effect with characteristics that are similar to what is found for the dynamical ordering across the peak effect in the superconducting case Bhattacharya and Higgins (1993); Koshelev and Vinokur (1994). In Fig. 7 we plot versus for the system in Figs. 5 and 6 at , 0.348, 0.608 0.869, 1.087, 1.304, and . At , the system is always in an ordered state and at all drives, while for , 0.608, and 0.869, the system is disordered at depinning but at high drive undergoes a dynamical reordering transition in which increases to a value close to . The drive at which the dynamical ordering occurs increases with increasing , and for , the system remains disordered for all values of .
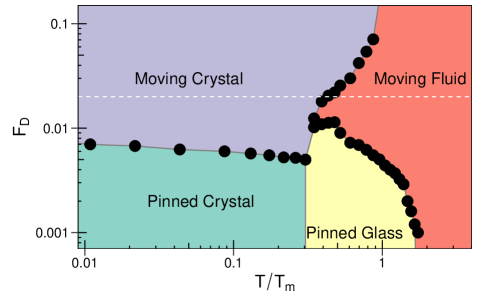
From the features of the and curves, we construct a dynamical phase diagram as a function of versus , as shown in Fig. 8. There is a pinned skyrmion crystal that depins elastically to a moving crystal as well as a pinned glass that depins plastically to a moving fluid state. Above the peak effect regime, there is a transition from a moving fluid into a moving crystal with increasing drive, and the value of at which this dynamic reordering occurs diverges as is approached. For sufficiently high temperatures, the pinned phase is lost and the system is permanently in the moving fluid state. The overall shape of the phase diagram is very similar to that of the superconducting peak effect dynamical phase diagram obtained experimentally by Higgins and Bhattacharya Bhattacharya and Higgins (1993), while the divergence in the reordering driving force upon approaching agrees with the simulation results of Koshelev and Vinokur Koshelev and Vinokur (1994). We note that there could be additional phases beyond those shown in Fig. 8. For example, the moving crystal could also contain regions of a moving smectic phase, and it could be possible to draw a distinction between a moving glass and a moving liquid.
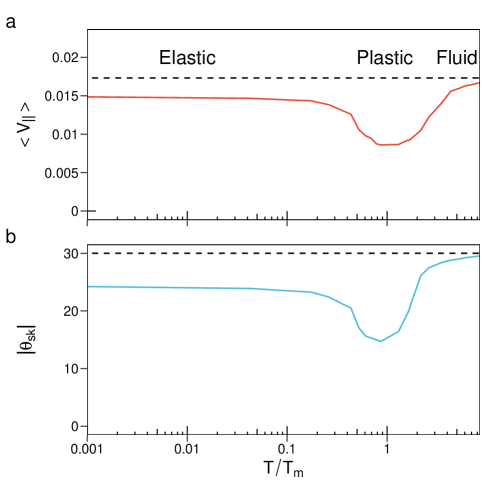
In the superconducting system, consequences of the peak effect appear even for drives well above depinning. For example, it is possible to apply a constant current with while increasing the temperature, as indicated by the horizontal dashed line at in Fig. 8. Here, the velocity parallel to the drive exhibits a drop at the temperature corresponding to the elastic to plastic transition, as shown in Fig. 9(a) where there is a minimum in close to . A similar dip appears in the perpendicular velocity and the absolute velocity. As shown in Fig. 9(b), there is a corresponding drop in the magnitude of the skyrmion Hall angle. For higher , approaches the clean limit value expected in a sample with . The magnitude of the drop in diminishes with increasing .
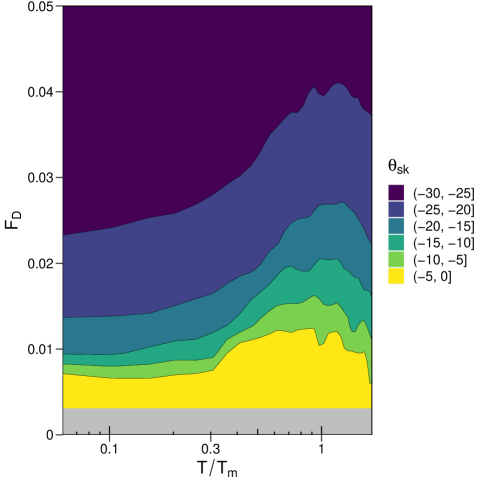
In Fig. 10 we show a heat map of the skyrmion Hall angle as a function of versus . For a fixed value of , increases as the temperature passes through the transition from elastic to plastic behavior. The skyrmion Hall angle always increases with increasing , and there is also an increase in with increasing temperature for the highest values of .
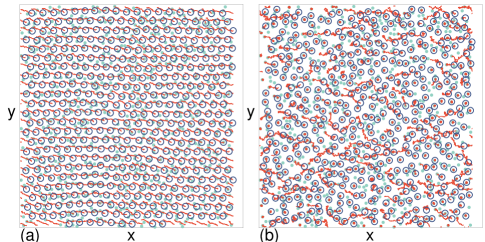
In Fig. 11(a) we plot the skyrmion locations and trajectories along with the pinning site locations for the system in Fig. 9 at and in the elastic regime. The skyrmions exhibit some random motion due to the thermal fluctuations, but form a triangular lattice that moves as a rigid body at an angle to the applied drive. At , Fig. 11(b) indicates that the same system is disordered and contains regions of flowing skyrmions coexisting with pinned regions. Due to the significant amount of thermal hopping, finite skyrmion velocities extend down to much lower values of compared to the sample. At low drives in the elastic depinning regime, the creep motion must occur in a correlated fashion since plastic distortions of the skyrmion lattice are suppressed. As a result, for and , all of the skyrmions move at the same velocity, while for the same drive at , due to the thermally induced breakdown of the lattice structure, some skyrmions remain temporarily pinned while other skyrmions are moving, giving a reduced average velocity. This is what produces the crossing of the velocity-force curves. At even higher temperatures, the hopping becomes so rapid that the average velocity in the liquid phase at is higher than the average velocity in the elastic regime, as was shown in Fig. 9.
VI Skyrmion Density and Materials Parameters
Since the peak effect is correlated with an order to disorder transition, the next question is whether the peak effect can still occur if the system is always disordered. In the case of a single skyrmion, there should not be a peak effect since collective effects are absent and there can be no disorder to order transition. This suggests that in samples with finite pinning strength, for low skyrmion densities when the skyrmions are sufficiently far apart that skyrmion-skyrmion interactions become unimportant, the skyrmion lattice will always be disordered and the peak effect should be absent. In Fig. 12 we plot the critical depinning force versus for skyrmion densities of , 0.3, 0.4, 0.5, and . Up until this point we have focused on samples with . For , the skyrmions form a crystal and undergo elastic depinning over an extended range of temperatures, with a peak effect appearing at the order to disorder transition temperature. For , the skyrmions are sufficiently far apart that they are disordered even at . In this case, the overall value of is much higher, and there is no peak effect. For , as the skyrmion density increases, the peak effect shifts to higher temperatures and the overall effectiveness of the pinning is reduced. This is consistent with observations in superconductors where for cleaner samples the overall pinning of the vortices is reduced and the peak effect occurs at high temperatures, while for samples with strong pinning, the peak effect is lost.
As the skyrmion density increases, there is a more pronounced difference in the shape of the velocity-force curves on either side of the peak effect, as shown in Fig. 13 where we plot versus for a sample with at , , , , and . The disordering transition in this case occurs at , and the depinning threshold reaches its highest value at this temperature. For higher temperatures, the depinning threshold drops and the velocity-force curves change shape, resulting in a clear crossing of the curves.
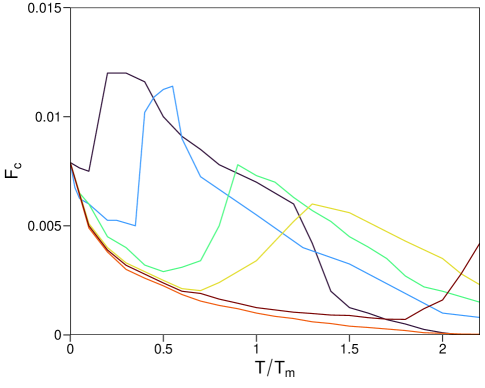
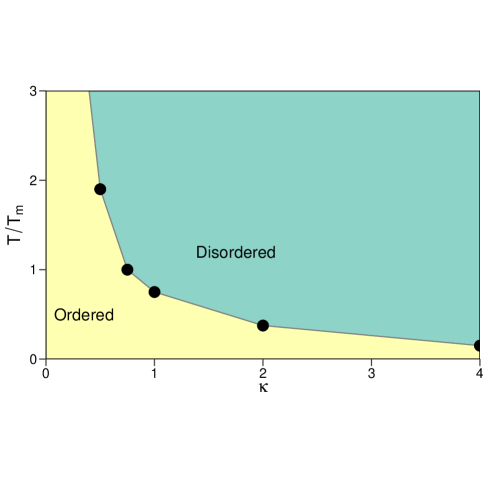
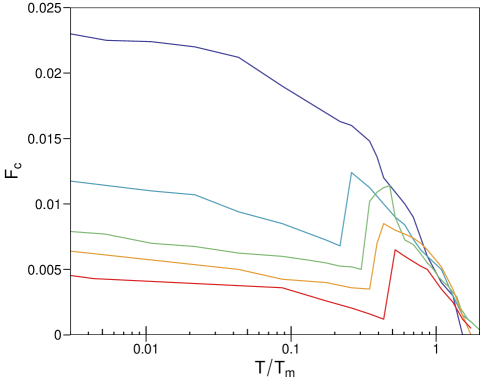
Since the temperature dependence of the skyrmion-skyrmion pairwise interaction is given by in the model of Wang et al. Wang et al. (2022b), we next consider how the peak effect varies for changing . In Fig. 14 we plot versus for the sample from Fig. 9 at , 2, 1, 0.75, 0.5, and . For , the peak effect appears at low temperatures. The system was discussed above, and for , 0.75, and , the peak effect occurs at higher temperatures while the decrease in with increasing becomes more pronounced as gets smaller. For , there is no peak effect and drops all the way to zero before the system can disorder. In this case, by the time the temperature is high enough to melt the skyrmion lattice, the individual skyrmions are easily able to thermally hop out of the pinning wells. This result indicates that for large the system may disorder rapidly with increasing or always remain disordered, while in samples with small , the peak effect will occur at higher temperatures closer to the bulk melting transition. In Fig. 15 we highlight a dynamic phase diagram as a function of versus showing the order to disorder transition. The transition point should also depend on the strength of the pinning and the skyrmion density.
VII Discussion
An open question is whether a skyrmion peak effect could also occur as function of applied magnetic field. If the strength of the skyrmion-skyrmion interaction diminishes with increasing field, it could be possible that an order to disorder transition accompanied by a peak effect could occur for increasing magnetic field. In superconducting vortex systems, the number of vortices increases monotonically with magnetic field, so the elastic modulus of the vortex lattice rises with increasing magnetic field, but near the upper critical field , the vortex-vortex interaction strength is reduced when the penetration depth diverges. For skyrmions, the magnetic field dependence is more complex, since not only is the number of skyrmions not a monotonic function of applied magnetic field, but also the size of the skyrmions can change with magnetic field. In principle, a peak effect will occur whenever the skyrmions form an elastic lattice that can transition into a disordered state as a function of applied magnetic field or temperature. There is already some evidence that a skyrmion lattice can thermally melt Baláž et al. (2021), so it would be interesting to study the transport in these systems while some feature such as skyrmion density or pinning strength is tuned.
In this work, we considered 2D systems; however, many skyrmion systems contain three-dimensional (3D) line-like objects, and a peak effect is known to occur in superconducting vortex systems where the vortices take the form of 3D lines. As long as the strength of the pairwise skyrmion interactions decreases with increasing temperature, there should be a peak effect in a 3D skyrmion system if pinning is present. In fact, it could possible that the order-disorder transition at the peak effect is second order in 2D systems and first order in 3D systems. If a skyrmion peak effect can occur in 3D samples, it could have a variety of interesting properties such as metastable dynamics. These could appear when the system is prepared in a disordered state under conditions where the steady state is ordered, or vice versa. Metastable behaviors have been observed in superconducting vortices near the peak effect regime Henderson et al. (1996); Li et al. (2006). We used a particle-based model to explore the skyrmion peak effect; however, it would be interesting to further probe the behavior with a continuum-based model, provided that the system is sufficiently large to exhibit a clear elastic to plastic transition. The continuum model could could capture additional effects such as shape distortions of the skyrmions across the peak effect. We also assumed a constant Magnus force; however, if the skyrmions change in size across the peak effect, the Magnus force could be altered.
VIII Summary
We have numerically investigated a thermal skyrmion peak effect for a skyrmion lattice driven over quenched disorder. As the thermal fluctuations increase, the effectiveness of the pinning is reduced due to thermal hopping, but the strength of the skyrmion-skyrmion interactions is exponentially reduced as proposed by Wang et al. Wang et al. (2022b). The skyrmion peak effect is similar to the peak effect associated with an order to disorder or elastic to plastic transition in superconducting vortex systems. When the pinning is weak, the skyrmions form a lattice that depins elastically at . As the temperature increases, the depinning threshold decreases, but when the skyrmion-skyrmion interactions become soft enough, there is an order to disorder transition to a skyrmion glass phase accompanied by a large increase in the depinning threshold. As the temperature is further increased, thermal hopping reduces the depinning threshold again, resulting in the appearance of a peak in the depinning force. The peak effect occurs for temperatures below the melting temperature of the skyrmion lattice in the absence of quenched disorder. Across the peak effect, we find a change in the shape of the velocity-force curves and a crossing of the curves similar to what is found for the superconducting peak effect. For a constant drive, even above the depinning threshold the velocity and skyrmion Hall angle both show a drop across the peak effect. We construct a dynamical phase diagram and find that there can be a dynamical reordering transition for increasing drive above the peak effect temperature but below the clean melting temperature. We map the different phases and the nonmonotonic behavior of the skyrmion Hall angle through the peak effect. We show that the peak effect should be robust whenever a skyrmion lattice can form with skyrmion-skyrmion interactions that are modified by temperature. Our results are also consistent with several experimental studies that have shown an increase in the critical current for skyrmion lattices with increasing temperature.
Acknowledgements.
We gratefully acknowledge the support of the U.S. Department of Energy through the LANL/LDRD program for this work. This work was supported by the US Department of Energy through the Los Alamos National Laboratory. Los Alamos National Laboratory is operated by Triad National Security, LLC, for the National Nuclear Security Administration of the U. S. Department of Energy (Contract No. 892333218NCA000001).References
- Mühlbauer et al. (2009) S. Mühlbauer, B. Binz, F. Jonietz, C. Pfleiderer, A. Rosch, A. Neubauer, R. Georgii, and P. Böni, Science 323, 915 (2009).
- Yu et al. (2010) X. Z. Yu, Y. Onose, N. Kanazawa, J. H. Park, J. H. Han, Y. Matsui, N. Nagaosa, and Y. Tokura, Nature (London) 465, 901 (2010).
- Nagaosa and Tokura (2013) N. Nagaosa and Y. Tokura, Nature Nanotechnol. 8, 899 (2013).
- Everschor-Sitte et al. (2018) K. Everschor-Sitte, J. Masell, R. M. Reeve, and M. Klaüi, J. Appl. Phys. 124, 240901 (2018).
- Fert et al. (2017) A. Fert, N. Reyren, and V. Cros, Nature Rev. Mater. 2, 17031 (2017).
- Wang et al. (2022a) K. Wang, V. Bheemarasetty, J. Duan, S. Zhou, and G. Xiao, J. Mag. Mag. Mater. 563, 169905 (2022a).
- Blatter et al. (1994) G. Blatter, M. V. Feigel’man, V. B. Geshkenbein, A. I. Larkin, and V. M. Vinokur, Rev. Mod. Phys. 66, 1125 (1994).
- Lin et al. (2013) S.-Z. Lin, C. Reichhardt, C. D. Batista, and A. Saxena, Phys. Rev. B 87, 214419 (2013).
- Brearton et al. (2020) R. Brearton, G. van der Laan, and T. Hesjedal, Phys. Rev. B 101, 134422 (2020).
- Schulz et al. (2012) T. Schulz, R. Ritz, A. Bauer, M. Halder, M. Wagner, C. Franz, C. Pfleiderer, K. Everschor, M. Garst, and A. Rosch, Nature Phys. 8, 301 (2012).
- Yu et al. (2012) X. Z. Yu, N. Kanazawa, W. Z. Zhang, T. Nagai, T. Hara, K. Kimoto, Y. Matsui, Y. Onose, and Y. Tokura, Nature Commun. 3, 988 (2012).
- Iwasaki et al. (2013) J. Iwasaki, M. Mochizuki, and N. Nagaosa, Nature Commun. 4, 1463 (2013).
- Reichhardt et al. (2015) C. Reichhardt, D. Ray, and C. J. O. Reichhardt, Phys. Rev. Lett. 114, 217202 (2015).
- Woo et al. (2016) S. Woo, K. Litzius, B. Krüger, M.-Y. Im, L. Caretta, K. Richter, M. Mann, A. Krone, R. M. Reeve, M. Weigand, et al., Nature Mater. 15, 501 (2016).
- Legrand et al. (2017) W. Legrand, D. Maccariello, N. Reyren, K. Garcia, C. Moutafis, C. Moreau-Luchaire, S. Coffin, K. Bouzehouane, V. Cros, and A. Fert, Nano Lett. 17, 2703 (2017).
- Reichhardt et al. (2022) C. Reichhardt, C. J. O. Reichhardt, and M. Milosevic, Rev. Mod. Phys. 94, 035005 (2022).
- Gruber et al. (2022) R. Gruber, J. Zázvorka, M. A. Brems, D. R. Rodrigues, T. Dohi, N. Kerber, B. Seng, M. Vafaee, K. Everschor-Sitte, P. Virnau, et al., Nature Commun. 13, 3144 (2022).
- Zázvorka et al. (2019) J. Zázvorka, F. Jakobs, D. Heinze, N. Keil, S. Kromin, S. Jaiswal, K. Litzius, G. Jakob, P. Virnau, D. Pinna, et al., Nature Nanotechnol. 14, 658 (2019).
- Zhao et al. (2020) L. Zhao, Z. Wang, X. Zhang, X. Liang, J. Xia, K. Wu, H.-A. Zhou, Y. Dong, G. Yu, K. L. Wang, et al., Phys. Rev. Lett. 125, 027206 (2020).
- Reichhardt and Reichhardt (2018) C. Reichhardt and C. J. O. Reichhardt, J. Phys.: Condens. Matter 31, 07LT01 (2018).
- Luo et al. (2020) Y. Luo, S.-Z. Lin, M. Leroux, N. Wakeham, D. M. Fobes, E. D. Bauer, J. B. Betts, J. D. Thompson, A. Migliori, M. Janoschek, et al., Commun. Mater. 1, 83 (2020).
- Litzius et al. (2020) K. Litzius, J. Leliaert, P. Bassirian, D. Rodrigues, S. Kromin, I. Lemesh, J. Zázvorka, K.-J. Lee, J. Mulkers, N. Kerber, et al., Nature Electron. 3, 30 (2020).
- Huang et al. (2020) P. Huang, T. Schonenberger, M. Cantoni, L. Heinen, A. Magrez, A. Rosch, F. Carbone, and H. M. Rønnow, Nature Nanotechnol. 15, 761 (2020).
- Baláž et al. (2021) P. Baláž, M. Paściak, and J. Hlinka, Phys. Rev. B 103, 174411 (2021).
- Hoshino and Nagaosa (2018) S. Hoshino and N. Nagaosa, Phys. Rev. B 97, 024413 (2018).
- Jiang et al. (2017) W. Jiang, X. Zhang, G. Yu, W. Zhang, X. Wang, M. B. Jungfleisch, J. E. Pearson, X. Cheng, O. Heinonen, K. L. Wang, et al., Nature Phys. 13, 162 (2017).
- Litzius et al. (2017) K. Litzius, I. Lemesh, B. Krüger, P. Bassirian, L. Caretta, K. Richter, F. Büttner, K. Sato, O. A. Tretiakov, J. Förster, et al., Nature Phys. 13, 170 (2017).
- Juge et al. (2019) R. Juge, S.-G. Je, D. d. S. Chaves, L. D. Buda-Prejbeanu, J. Peña Garcia, J. Nath, I. M. Miron, K. G. Rana, L. Aballe, M. Foerster, et al., Phys. Rev. Applied 12, 044007 (2019).
- DeSorbo (1964) W. DeSorbo, Rev. Mod. Phys. 36, 90 (1964).
- Pippard (1969) A. B. Pippard, Phil. Mag. 19, 217 (1969).
- Wördenweber et al. (1986) R. Wördenweber, P. H. Kes, and C. C. Tsuei, Phys. Rev. B 33, 3172 (1986).
- Bhattacharya and Higgins (1993) S. Bhattacharya and M. J. Higgins, Phys. Rev. Lett. 70, 2617 (1993).
- Kwok et al. (1994) W. K. Kwok, J. A. Fendrich, C. J. van der Beek, and G. W. Crabtree, Phys. Rev. Lett. 73, 2614 (1994).
- Banerjee et al. (2000) S. S. Banerjee, S. Ramakrishnan, A. K. Grover, G. Ravikumar, P. K. Mishra, V. C. Sahni, C. V. Tomy, G. Balakrishnan, D. M. Paul, P. L. Gammel, et al., Phys. Rev. B 62, 11838 (2000).
- Higgins and Bhattacharya (1996) M. J. Higgins and S. Bhattacharya, Physica C 257, 232 (1996).
- Paltiel et al. (2000) Y. Paltiel, E. Zeldov, Y. N. Myasoedov, H. Shtrikman, S. Bhattacharya, M. J. Higgins, Z. L. Xiao, E. Y. Andrei, P. L. Gammel, and D. J. Bishop, Nature (London) 403, 398 (2000).
- Ling et al. (2001) X. S. Ling, S. R. Park, B. A. McClain, S. M. Choi, D. C. Dender, and J. W. Lynn, Phys. Rev. Lett. 86, 712 (2001).
- Troyanovski et al. (2002) A. M. Troyanovski, M. van Hecke, N. Saha, J. Aarts, and P. H. Kes, Phys. Rev. Lett. 89, 147006 (2002).
- Mohan et al. (2007) S. Mohan, J. Sinha, S. S. Banerjee, and Y. Myasoedov, Phys. Rev. Lett. 98, 027003 (2007).
- Toft-Petersen et al. (2018) R. Toft-Petersen, A. B. Abrahamsen, S. Balog, L. Porcar, and M. Laver, Nature Commun. 9, 901 (2018).
- Fisher (1998) D. S. Fisher, Phys. Rep. 301, 113 (1998).
- Reichhardt and Reichhardt (2017) C. Reichhardt and C. J. O. Reichhardt, Rep. Prog. Phys. 80, 026501 (2017).
- Gammel et al. (1998) P. L. Gammel, U. Yaron, A. P. Ramirez, D. J. Bishop, A. M. Chang, R. Ruel, L. N. Pfeiffer, E. Bucher, G. D’Anna, D. A. Huse, et al., Phys. Rev. Lett. 80, 833 (1998).
- Ganguli et al. (2015) S. C. Ganguli, H. Singh, G. Saraswat, R. Ganguly, V. Bagwe, P. Shirage, A. Thamizhavel, and P. Raychaudhuri, Sci. Rep. 5, 10613 (2015).
- Marley et al. (1995) A. C. Marley, M. J. Higgins, and S. Bhattacharya, Phys. Rev. Lett. 74, 3029 (1995).
- Henderson et al. (1996) W. Henderson, E. Y. Andrei, M. J. Higgins, and S. Bhattacharya, Phys. Rev. Lett. 77, 2077 (1996).
- Banerjee et al. (1999) S. S. Banerjee, N. G. Patil, S. Ramakrishnan, A. K. Grover, S. Bhattacharya, P. K. Mishra, G. Ravikumar, T. V. Chandrasekhar Rao, V. C. Sahni, M. J. Higgins, et al., Phys. Rev. B 59, 6043 (1999).
- Ghosh et al. (1996) K. Ghosh, S. Ramakrishnan, A. K. Grover, G. I. Menon, G. Chandra, T. V. Chandrasekhar Rao, G. Ravikumar, P. K. Mishra, V. C. Sahni, C. V. Tomy, et al., Phys. Rev. Lett. 76, 4600 (1996).
- Tang et al. (1996) C. Tang, X. S. Ling, S. Bhattacharya, and P. M. Chaikin, Europhys. Lett. 35, 597 (1996).
- Wang et al. (2022b) Y. Wang, J. Wang, T. Kitamura, H. Hirakata, and T. Shimada, Phys. Rev. Appl. 18, 044024 (2022b).
- Koshelev and Vinokur (1994) A. E. Koshelev and V. M. Vinokur, Phys. Rev. Lett. 73, 3580 (1994).
- Hellerqvist et al. (1996) M. C. Hellerqvist, D. Ephron, W. R. White, M. R. Beasley, and A. Kapitulnik, Phys. Rev. Lett. 76, 4022 (1996).
- Brown et al. (2019) B. L. Brown, U. C. Täuber, and M. Pleimling, Phys. Rev. B 100, 024410 (2019).
- Stidham and Pleimling (2020) J. Stidham and M. Pleimling, Phys. Rev. B 102, 144434 (2020).
- Zhou et al. (2021) Y. Zhou, R. Mansell, T. Ala-Nissila, and S. van Dijken, Phys. Rev. B 104, 144417 (2021).
- Ge et al. (2023) Y. Ge, J. Rothörl, M. A. Brems, N. Kerber, R. Gruber, T. Dohi, M. Kläui, and P. Virnau, Commun. Phys. 6, 30 (2023).
- Le Doussal and Giamarchi (1998) P. Le Doussal and T. Giamarchi, Phys. Rev. B 57, 11356 (1998).
- Reichhardt and Reichhardt (2019) C. Reichhardt and C. J. O. Reichhardt, Phys. Rev. B 99, 104418 (2019).
- Yaron et al. (1995) U. Yaron, P. L. Gammel, D. A. Huse, R. N. Kleiman, C. S. Oglesby, E. Bucher, B. Batlogg, D. J. Bishop, K. Mortensen, and K. N. Clausen, Nature (London) 376, 753 (1995).
- Balents et al. (1998) L. Balents, M. C. Marchetti, and L. Radzihovsky, Phys. Rev. B 57, 7705 (1998).
- Pardo et al. (1998) F. Pardo, F. de la Cruz, P. L. Gammel, E. Bucher, and D. J. Bishop, Nature 396, 348 (1998).
- Olson et al. (1998) C. J. Olson, C. Reichhardt, and F. Nori, Phys. Rev. Lett. 81, 3757 (1998).
- Reichhardt et al. (2001) C. Reichhardt, C. J. Olson, N. Grønbech-Jensen, and F. Nori, Phys. Rev. Lett. 86, 4354 (2001).
- Li et al. (2006) G. Li, E. Y. Andrei, Z. L. Xiao, P. Shuk, and M. Greenblatt, Phys. Rev. Lett. 96, 017009 (2006).