Spectroscopy of QUBRICS quasar candidates: 1672 new redshifts and a Golden Sample for the Sandage Test of the Redshift Drift
Abstract
The QUBRICS (QUasars as BRIght beacons for Cosmology in the Southern hemisphere) survey aims at constructing a sample of the brightest quasars with , observable with facilities in the Southern Hemisphere. QUBRICS makes use of the available optical and IR wide-field surveys in the South and of Machine Learning techniques to produce thousands of bright quasar candidates of which only a few hundred have been confirmed with follow-up spectroscopy. Taking advantage of the recent Gaia Data Release 3, which contains 220 million low-resolution spectra, and of a newly developed spectral energy distribution fitting technique, designed to combine the photometric information with the Gaia spectroscopy, it has been possible to measure 1672 new secure redshifts of QUBRICS candidates, with a typical uncertainty of . This significant progress of QUBRICS brings it closer to (one of) its primary goals: providing a sample of bright quasars at redshift to perform the Sandage test of the cosmological redshift drift. A Golden Sample of seven quasars is presented that makes it possible to carry out this experiment in about 1500 hours of observation in 25 years, using the ANDES spectrograph at the 39m ELT, a significant improvement with respect to previous estimates.
keywords:
– methods: data analysis – methods: statistical – surveys – astronomical databases: miscellaneous – quasars: general1 Introduction
Quasars(QSOs), as the brightest non-transient sources, can be observed at very high redshifts and shed light on fundamental topics such as the formation and evolution of galactic structures and massive black holes, the Big Bang nucleosynthesis, Cosmology, reionizations, and the variation of the fundamental constants. As cosmic lighthouses, they provide a unique view of the Universe through the observation of absorption features, and the brightest QSOs are coveted as precious tools of investigation.
The QUBRICS (QUasars as BRIght beacons for Cosmology in the Southern hemisphere) survey (Calderone et al., 2019) has been conceived with the aim of making up for the scarcity of bright QSOs in the Southern Hemisphere, which is due to the historical paucity of all-sky surveys in the South, and has produced several hundreds new spectroscopically confirmed bright QSOs. Various methods for the selection of QSOs have been used: in Calderone et al. (2019, hereafter Paper I) candidates have been selected using a canonical correlation analysis (CCA, Anderson, 2003), in Guarneri et al. (2021, hereafter Paper III) the Probabilistic Random Forest (PRF, Reis et al., 2019) has been adopted, with modifications introduced to properly treat upper limits and missing data. In Guarneri et al. (2022, Paper VI) the PRF selection has been further improved, in particular adding synthetic data to the training sets. Calderone et al., (in preparation, Paper VII) have developed a method that takes advantage of the extreme gradient boosting technique (Chen & Guestrin, 2016, XGB) to significantly improve the recall 111Recall is defined as the fraction of relevant instances that are retrieved by the selection algorthm. of the selection algorithms even in the presence of severely imbalanced datasets, with the aim of completing the QUBRICS survey up to .
While refining the methods of selection, a continuous effort has been dedicated in QUBRICS to the follow-up spectroscopy (Boutsia et al., 2020, hereafter Paper II), testing the selection procedures and leading to statistically well-defined subsamples that allowed us to address the topics of the QSO luminosity function (LF) and cosmic re-ionization(s) (Boutsia et al. (2021), hereafter Paper IV; Grazian et al. (2022), Paper V; and Fontanot et al. (2023), Paper IX). Rare objects, such as extreme broad absorption line QSOs (BALs), discovered in the course of QUBRICS, have been described in Cupani et al. (2022, Paper VIII). One of the main goals of QUBRICS is to provide a sample of bright targets for the Sandage test of the cosmological redshift drift (Sandage, 1962). The redshift drift () is a small, dynamical change in the redshift of objects following the Hubble flow. Measuring it provides a direct, real-time and model-independent mapping of the expansion rate of the universe. It is fundamentally different from other cosmological probes: instead of mapping our (present-day) past light cone, it directly compares different past light cones. Being independent of any assumptions on gravity, geometry or clustering, it directly tests the pillars of the CDM paradigm. Recent theoretical studies have uncovered unique synergies with other cosmological probes, in particular for the characterization of the physical properties of dark energy (Martins et al., 2016; Alves et al., 2019; Esteves et al., 2021). This measurement is a flagship objective of the Extremely Large Telescope (ELT) (Liske et al., 2008), specifically observing the Lyman forest of QSOs with its high-resolution spectrograph, ANDES (Marconi et al., 2022). The effect is tiny, expected to be of order yr-1 at the redshifts of interest, and to carry out the measurement a high signal to noise ratio (SNR) is a necessary condition, implying, even with bright QSOs and large telescopes, a huge investment of observing time. Having the brightest possible cosmic beacons is a key ingredient to make it possible to perform a measurement which is presently at the edge of feasibility. Since the observability of the Lyman forest with ground-based spectrographs requires a substantial redshift, the QUBRICS has been focused on QSOs at .
A strategic feature of QUBRICS is the continuous updating, after each observation cycle, of the training set, paying attention to identify and correct the non-insignificant fraction of erroneous spectroscopic identifications found in the literature, which may affect the training of machine learning (ML) techniques. This allows us to improve the success rate and the completeness, while keeping the list of candidates manageable.
In June 2022, the list of candidates derived from Papers III, VI and VII still lacking a spectroscopic confirmation included 5,469 targets. On June 13, 2022 the Gaia Data Release 3 (DR3) was published, providing, among a wealth of data, low-resolution spectra for about 220 million objects, selected to have a reasonable number of Gaia observations and to be sufficiently bright to ensure good SNR (De Angeli et al., 2022). In this paper we make use of the DR3 spectra and of the QUBRICS photometric database (Sect. 3.1), combined with a spectral energy distribution (SED) fitting technique, to obtain secure spectroscopic identifications and redshifts of a significant fraction of the 5,469 candidates of the QUBRICS survey.
Unless stated otherwise, magnitudes are given in the AB magnitude system; uncertainties represent 68% confidence intervals. We adopt a flat CDM cosmology, with , and , in agreement with the Planck Collaboration et al. (2020).
2 Matching the QUBRICS database to the Gaia DR3 low-resolution spectra.
The QUBRICS database is made of a collection of spectroscopic and photometric data from the literature, and all spectroscopic follow-ups carried out in the framework of the QUBRICS survey. The photometric database includes optical and infrared data from several public catalogs:
-
1.
, , , , , magnitudes from the SkyMapper DR1 survey (Wolf et al., 2018)
-
2.
, , magnitudes from the Gaia eDR3 catalogue (Gaia Collaboration et al., 2021);
-
3.
, , from 2MASS (Skrutskie et al., 2006);
-
4.
W1, W2, W3, W4 from the AllWise survey (Wright et al., 2010);
-
5.
, , , , magnitudes from the PanSTARRS1 DR2 survey (Chambers et al., 2016);
-
6.
, , , , magnitudes from the DES survey (Sevilla-Noarbe et al., 2021);
From these datasets we extract convenient subsets on which the selection is performed, and we refer to them as Main Samples (MS). MS are created based on magnitude and data-quality cuts, and positional match distance. For instance, the MS used in Calderone et al. (2019) includes sources with i) a magnitude measurement in six bands (SkyMapper i, z, WISE W1, W2, W3 and Gaia G); ii) a magnitude limited between ; iii) in the AllWise bands; iv) matching distance between Gaia and SkyMapper, and AllWise and SkyMapper lower than 0.5”.
The Gaia catalogue additionally provides parallax and proper-motion measurements. This information is used to identify stars, which are assumed to be objects with parallax and proper motion significantly different from zero ().
Spectroscopic redshifts and classifications are collected from several catalogues and added to the database:
-
•
the Sloan Digital Sky Survey (SDSS) DR16q (Lyke et al., 2020);
- •
-
•
the 2dF (Colless et al., 2001);
-
•
the 6dF (Jones et al., 2009);
-
•
Onken et al. (2021);
-
•
Schindler et al. (2019a);
-
•
Schindler et al. (2019b);
-
•
Wolf et al. (2020);
-
•
Yang et al. (2016).
Finally, QUBRICS identifications are added to the database after every observing run. Combining the contribution of all these catalogues provides us, as of the end of June 2022, 821,992 objects with a secure redshift estimate and classification (Tab. 1).
These identifications are used to train the selection algorithms (CCA, PRF, XGB), which are then applied on unclassified sources to find QSO candidates. Combining the lists produced by the three algorithms leaves 5,469 candidates still lacking a spectroscopic confirmation. These candidates are scattered over a large area of the sky and observing all of them is a daunting task.
The publication of Gaia low-resolution spectra gave us the chance to significantly speed up this process. We cross-matched the candidates list to the Gaia DR3 source table, using a 0.75” matching radius: 2,635 of the 5,469 candidates turned out to have a low-resolution spectrum available from the Gaia archive.
The Gaia spectra have been processed using Gaiaxpy222https://gaia-dpci.github.io/GaiaXPy-website/, 10.5281/zenodo.6637762: each spectrum was calibrated and sampled on a wavelength grid using the calibrate routine; we chose a fixed step of 20 Å and discarded the regions with wavelength < 3900 and > 9600 Å , as these are typically very noisy.
The goal of the next Section is to use these data to obtain a secure redshift for a large fraction of the 2,635 QUBRICS candidates with a Gaia spectrum.
| Object | Number of | Observed by |
| type | redshifts | QUBRICS |
| QSO (Type 1) | 781298 | 856 |
| QSO (Type 2) | 6074 | — |
| BLLac | 809 | — |
| Galaxy | 33614 | 23 |
| Star | 31 | 31 |
3 Obtaining secure spectroscopic identifications
Having a set of 2,635 objects confidently classified as QSOs (Guarneri et al., 2021, 2022), we derive, for each of them, the redshift , comparing a robust model of the SED to their spectro + photometric data in the following way (described in detail in Sect. 3.1 and 3.2.):
-
1.
for each object an approximate redshift estimate is obtained by -fitting a QSO SED to the photometric information available in QUBRICS complemented with the Gaia low-resolution spectroscopy;
-
2.
the redshift estimate is refined by processing the GAIA DR3 low-resolution spectrum with the MARZ package (Hinton et al., 2016), which uses a cross-correlation algorithm to match the spectrum to a set of templates (in our case a QSO template).
Consequently, three different types of redshift are used in this paper:
3.1 SED fitting to estimate the redshift of a QSO
For each object we compare the observed spectro+photometric data with synthetic SEDs of QSOs.
We use the same photometric catalogues listed in Sect. 2. In addition, when available, optical data from the SDSS DR16q survey (Lyke et al., 2020), , , magnitudes from the VHS survey (McMahon et al., 2021) and magnitude from the GALEX survey (Morrissey et al., 2007) are included. Finally, we add Gaia low-resolution spectra, rebinned with a step of 20 Å in wavelength.
The SED of quasars is parametrized in the following way:
-
1.
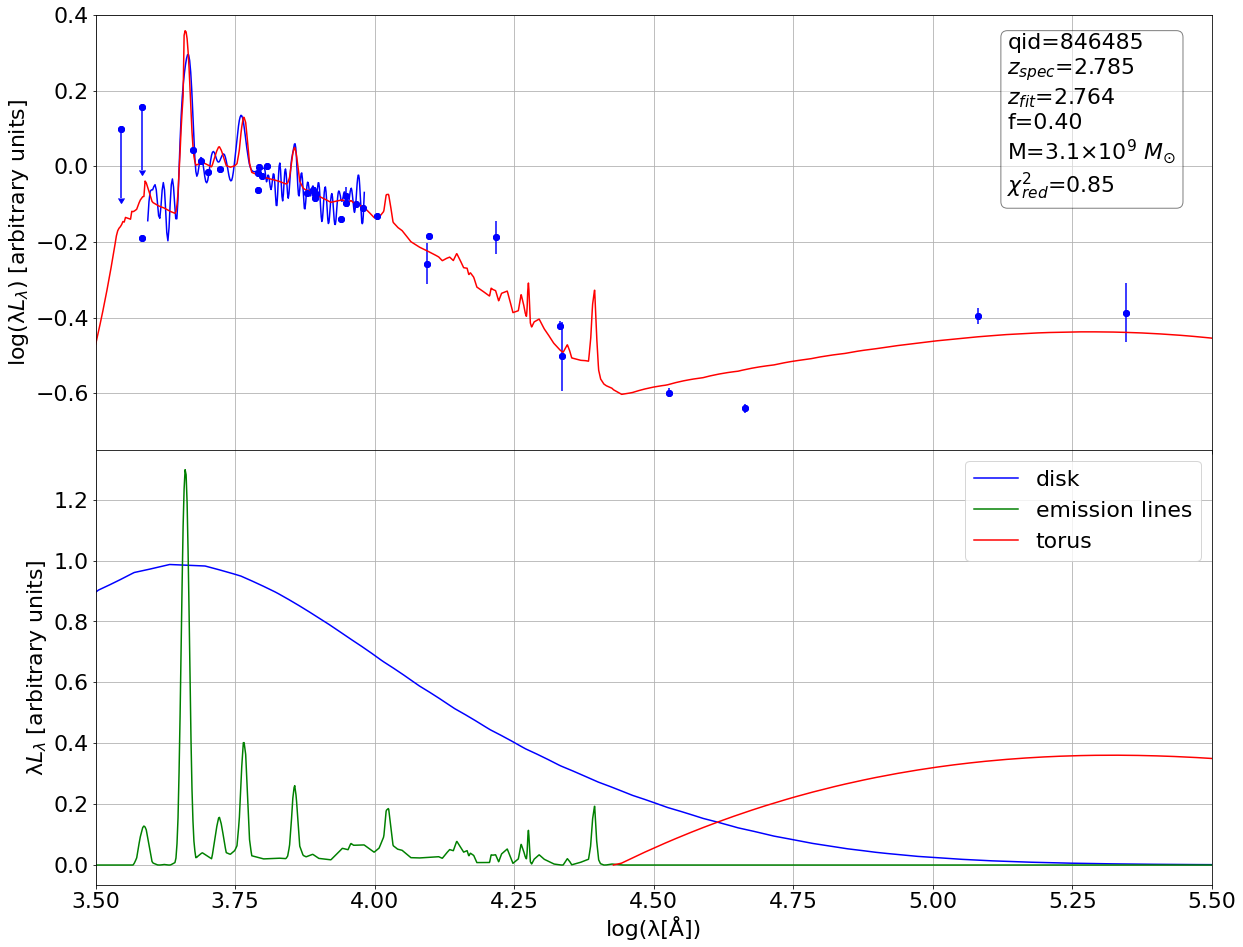
a "blue bump" component, ), representing the accretion disk (Sun & Malkan, 1989; Laor & Netzer, 1989), modeled with the PYAGN package (Kubota & Done, 2018). The shape of this spectral component depends on the mass of the supermassive black hole (SMBH) and on its accretion rate : in particular, a larger tends to move the blue bump to longer wavelengths, while a higher shifts it to shorter wavelengths;
- 2.
-
3.
a component representing the emission features, , obtained with the QSFit package (Calderone et al., 2017) using the line fluxes and equivalent widths from Vanden Berk et al. (2001) to normalize the intensity of each emission line with respect to the other lines and to the blue bump component. It should be noted that in this way the EW of the emission lines is fixed to the Vanden Berk et al. (2001) template. For QSOs with more exotic spectra (e.g. BALs) the procedure might result less reliable. This is further discussed in Sect. 3.2.
Different SEDs can be generated by choosing a different SMBH mass (), accretion rate () and fractional contribution () of the "IR bump" with respect to the "blue bump" and emission features components, according to the following formula:
| (1) |
Finally, according to the given redshift, the mean absorption of the intergalactic medium (IGM) is applied shortward of 1210 Å (Inoue et al., 2014), and the SED is shifted to the observer’s frame.
, and , dimensionally, are all fluxes. The resulting SED is renormalized and compared -wise with the available spectro+photometric data. In this way a is obtained as a function of the parameters , , and . An example of a fit of a synthetic SED to the spectro+photometric data of a redshift QSO is shown in Fig. 1.
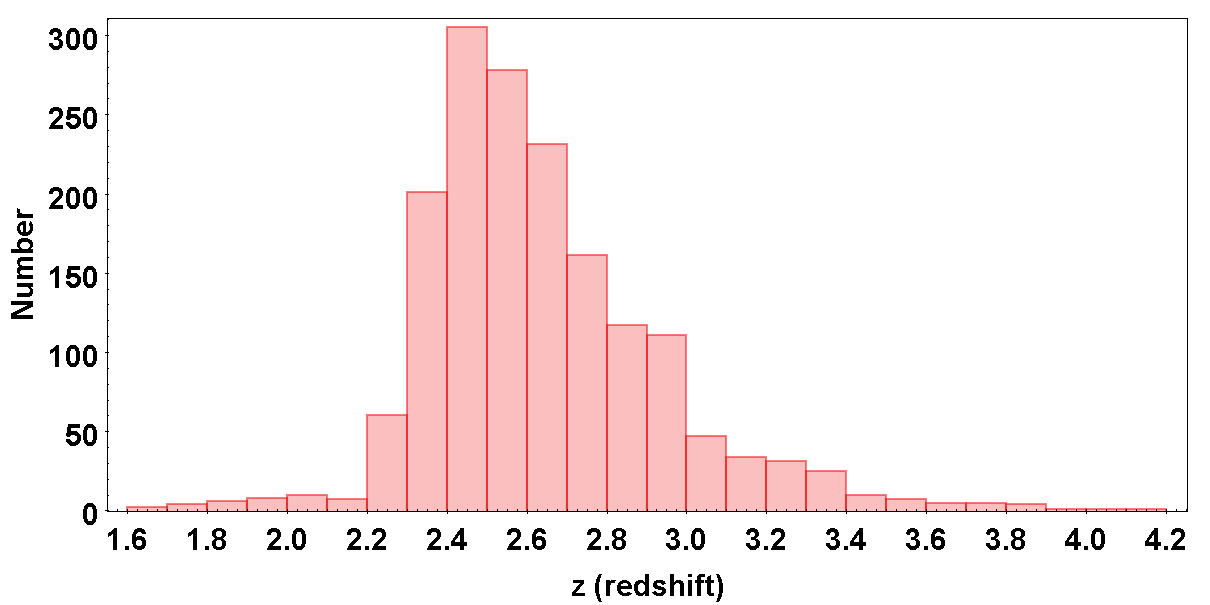

To increase the robustness of the fitting procedure we explored whether the number of fitting parameters in Eq. 1 could be reduced. Since the QUBRICS survey is focused on finding QSOs at , we have extracted from the QUBRICS database the 938 spectroscopically confirmed QSOs with and a Gaia low-resolution spectrum. We fitted their spectro+photometric data fixing the redshift at the spectroscopic value and letting the parameters , and vary. Most QSO SEDs are fitted with an (and a non-negligible degeneracy exists between and ). Therefore, we decided to fix (i.e. Eddington accretion) in the following analysis and fit for each object three parameters: , and the redshift .
It should be noted that in the present context the aim of the spectro+photometric data-fitting is to provide a robust estimation of the redshift for sources classified as QSOs by our ML techniques. The focus is not on measuring other properties as the SMBH mass or accretion rate. The present parameterization of the QSO SED is also different with respect to Guarneri et al. (2022) and has been chosen because it produces better and more physically motivated results.
3.2 Refining the redshift estimate by cross-correlation with the MARZ package
The redshift estimate derived from the SED fitting described in Sect. 3.1 is finally passed to the MARZ package (Hinton et al., 2016), that matches the Gaia low-resolution spectrum of the object with the MARZ QSO template (see Hinton et al. (2016) for the details of the MARZ matching technique) and produces our final estimate for the redshift, . A quality operator (QOP, Hinton et al. (2016)) is also assigned to each spectrum in a human-supervised way. The QOP scale varies from a value of 1 for inconclusive spectra to 4 for "great" spectra, with an absolutely certain redshift.
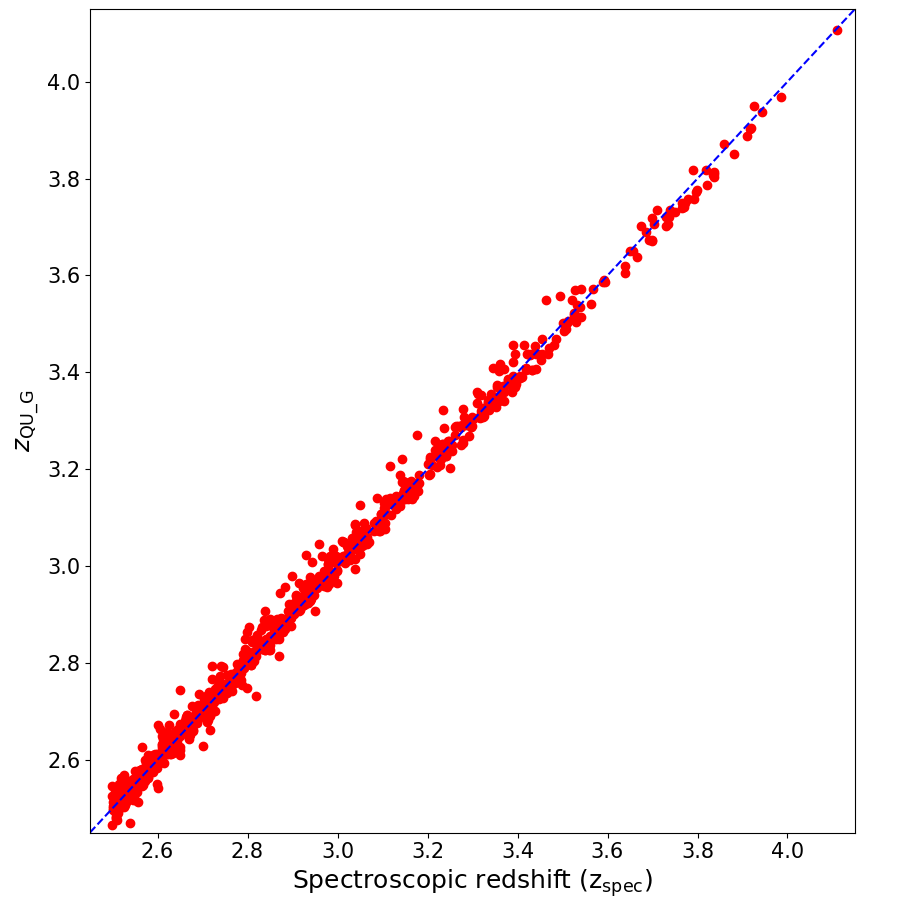
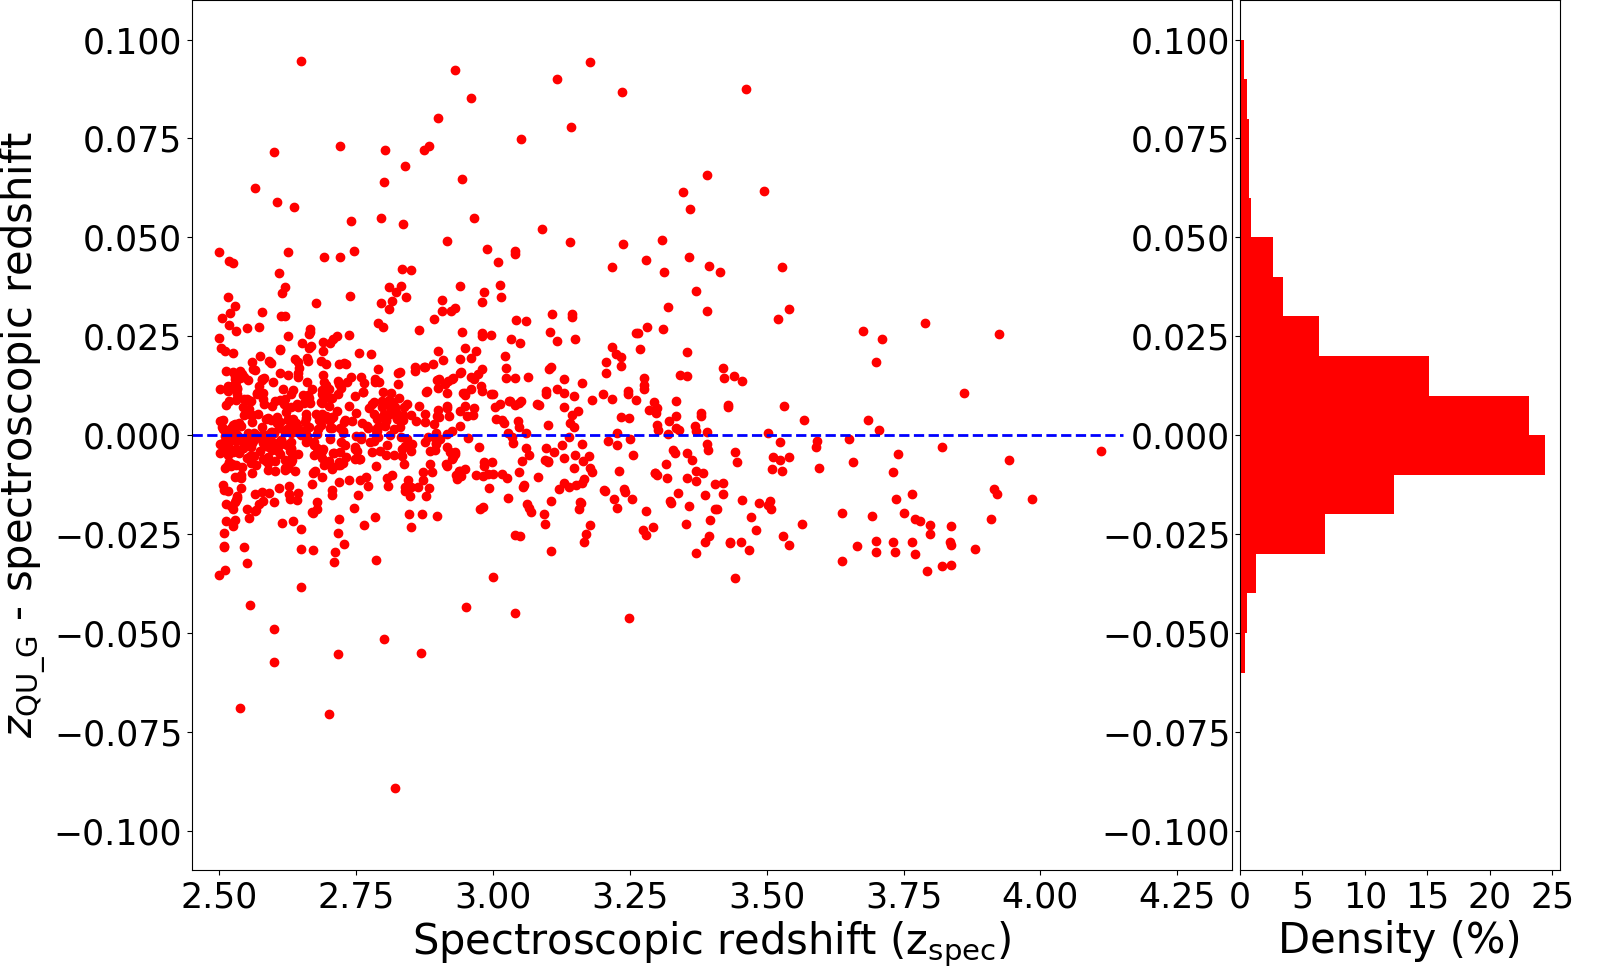
Fig.2 shows the comparison between the spectroscopic redshifts, , present in the QUBRICS database and the , as well as their difference, , as a function of the spectroscopic redshift. The distribution is characterized by a median and a standard deviation . The combination of the photometric and spectrophotometric data and of the fitting and template matching techniques turns out to be effective in avoiding the misidentification of spectral features, while providing relatively precise redshifts. In particular, potential errors due to QSOs with exotic spectra are checked and corrected/eliminated with the cross-correlation MARZ procedure and the reliability, tested on the sample of 938 QSOs with known (including a significant fraction of BALs), turns out to be reassuring (Fig. 2).

4 Applying the redshift measurement to QUBRICS candidates
The procedure described in Sect. 3 has been applied to 2,635 quasar candidates produced in Papers III, VI and VII of the QUBRICS survey with a Gaia low-resolution spectrum. The properties of these 2,635 QSO candidates are not significantly different, either in photometric coverage or in magnitude/photometric uncertainty, from the 938 spectroscopically confirmed QSOs in the QUBRICS database with , described in Sect. 3. Therefore, we expect to obtain the same reliability (a test on a limited number of 25 candidates is carried out in Sect. 5).
For 1672 objects the procedure produces a redshift estimate of sufficient quality (QOP) to be considered secure. They are listed in Tab. LABEL:tab:NewSpec. For 963 objects the absence of spectral features with sufficient SNR prevented the determination of a redshift with the requested confidence.
5 Testing the new redshift measurements with follow-up spectroscopy
After June 2022, 25 candidates contained in Tab. LABEL:tab:NewSpec (typically chosen on the basis of sky accessibility) have been observed with follow-up spectroscopy at the Telescopio Nazionale Galileo (TNG, La Palma), Las Campanas Observatory and ESO-NTT using the DOLORES, LDSS-3 (Clay Telescope) and EFOSC-2 spectrographs, respectively.
Tab.2 summarises the observing setups and significant information about each observing run. Figure 4 shows three spectra representative of the three telescopes.
For the 13 candidates observed with the DOLORES instrument, mounted on the Telescopio Nazionale Galileo, exposures have been taken during the AOT45 period, in August 2022, under a proposal with PI F. Guarneri. The LR-B grism (covering a wavelength range between 3600–8000 Å at a resolution ) with a 1" slit aperture was used with an exposure time between 300 and 600 s.
For the 9 targets observed with LDSS-3 at the Clay Telescope, in July and August 2022, observations were obtained on several nights with varied conditions (e.g., bright time, variable weather conditions). The VPH-all grism with the 1" central slit and no blocking filter was employed, covering a wavelength range between 4000–10000 Å with a low resolution of R800. Exposure times ranging between 800–1800 s were used, depending on the candidate magnitude and seeing conditions.

Finally, 3 candidates were observed in November 2022, as a part of an observing program at the ESO NTT (PI. F. Guarneri, proposal 110.23WP.001), employing the EFOSC-2 instrument and Grism #13 (wavelength range Å and resolution ), with typical exposure times ranging between 500 and 1200 s.
Data obtained with the DOLORES, LDSS-3 and EFOSC-2 instruments were reduced with a custom pipeline based on MIDAS scripts (Banse et al., 1988). Each spectrum has been processed to subtract the bias and normalised by the flat; wavelength calibration is achieved using helium, neon and argon lamps, finding a rms of Å. Observing conditions have not always been photometric.
All the 25 objects turned out to be QSOs and Fig. 5 shows the good agreement of the spectroscopic redshifts with the redshifts obtained with the procedure described in Sect. 3: the distribution is characterized by a median and a standard deviation , thus confirming the Sect. 3.2 estimates.
| # of objects | Instrument | Telescope | Grism | Slit | Resolution |
|---|---|---|---|---|---|
| 13 | DOLORES | TNG | LR-B | 1" | 600 |
| 9 | LDSS-3 | Clay | VPH-all | 1" | 800 |
| 3 | EFOSC-2 | NTT | Grism#13 | 1.5" | 1000 |
6 Discussion
The tests described in Sect. 3.2 and the spectroscopic follow-up observations described in Sect. 5 demonstrate that the procedure described in the present paper produces secure redshifts from the Gaia low-resolution spectra, with an uncertainty of .
Thus, we can confidently add 1672 new spectroscopic redshifts to the QUBRICS database, reducing to 3797 the number of remaining candidates still to be observed. The large majority (80%) of the 3797 remaining candidates have magnitudes fainter than and expected redshift below . We will continue to follow them up with spectroscopic observations, prioritizing the construction of complete samples at relatively bright magnitudes ( and , 500 candidates) and at higher redshift ( and , 180 candidates).
A comparison of the redshifts determined in the present work with the redshifts estimated from Gaia (Gaia Collaboration et al., 2021) shows a generally good correspondence: out of the 1672 redshift determinations of the present work, 1668 also have a redshift estimated by the Gaia collaboration (Gaia Collaboration et al., 2021) and in 1663 cases the agreement is within a with a . However, in 5 cases a catastrophic disagreement occurs. They are shown in Fig. 6. We do not have follow-up spectroscopy for these objects, so only the Gaia low-resolution spectra are shown. It is remarkable that the 5 objects are relatively bright, , and according to our analysis, based on the typical EW of the emission lines and the continuum slope, in these 5 cases the Gaia pipeline misclassifies some emission line, most notably the Lyman- or C iv lines as a C iii1909, as shown in Fig. 6.
Fig. 7 shows the new diagram with the known quasars at in the Southern hemisphere vs. their magnitude. The contribution of the QUBRICS survey, especially at the brighter magnitudes, is apparent.

6.1 The Sandage Test of the redshift drift
In Paper II we showed that, thanks to the new bright QSO identifications at high redshift, the total time required to carry out the Sandage Test of the cosmologic redshift drift (Sandage, 1962) could be reduced to less than 2500 hours of observations with an ANDES-like (Marconi et al., 2022) spectrograph at the ELT. In particular we envisaged the use of the fiber-fed VIS-BLUE (UBV) and VISRED (RIZ) modules of ANDES to obtain in natural seeing conditions high-resolution (), high-fidelity spectra of 30 targets, with a temporal separation of 25 years. We are now in the position to update these estimates by defining a new "Golden Sample": two main refinements are the inclusion of new bright QSOs discovered with QUBRICS and a realistic observing strategy (Dong et al., 2022) with a reduced number of targets, but still sufficient to have at least one suitable QSO available for observations from the ELT site at any time of the year.
In the following we adopt the same assumptions as in Paper II (updated from Liske et al. (2008)), namely the uncertainty in the radial velocity measurement, :
| (2) |
where the symbol ‘S/N’ refers to the total S/N per Å pixel per object accumulated over all observations, is the number of QSOs in the sample, is the redshift of the QSO, the exponent is for and 0.9 above. The form factor is equal to if all the targets are observed twice, at the beginning and at the end of the experiment, and becomes larger if the measurements are distributed in time, reaching for a uniform distribution. The S/N per pixel for photon-noise limited observations can be written as:
| (3) |
where , and are the telescope diameter, total integration time and total efficiency, and are the zeropoint and apparent magnitude of the source in the -band, respectively, and s-1 m-2 m-1 is the AB zeropoint for an effective wavelength of Å (corresponding to the SDSS -band). The normalisation of the above equation assumes a pixel size of Å and a central obscuration of the telescope’s primary collecting area of per cent.
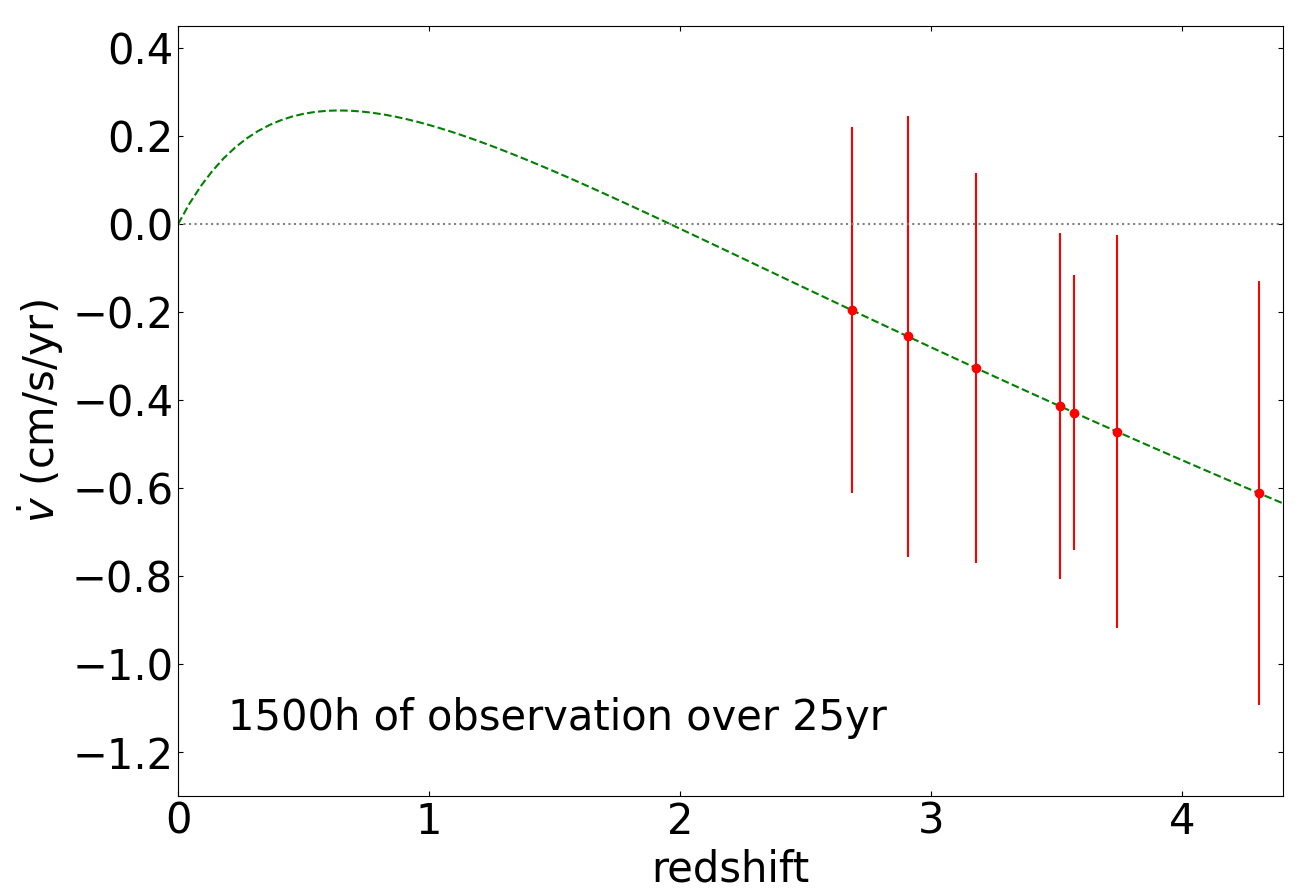
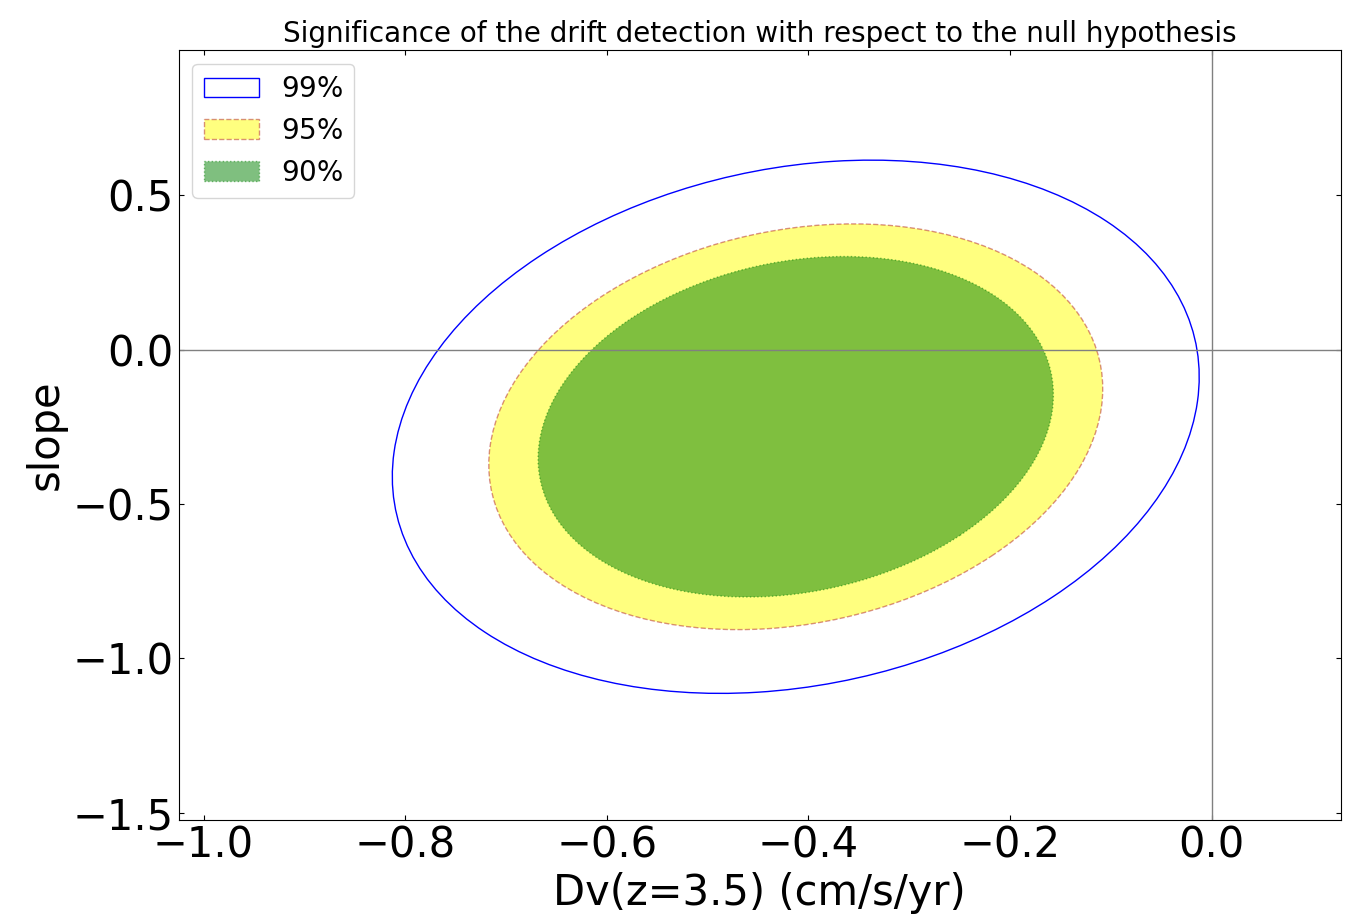
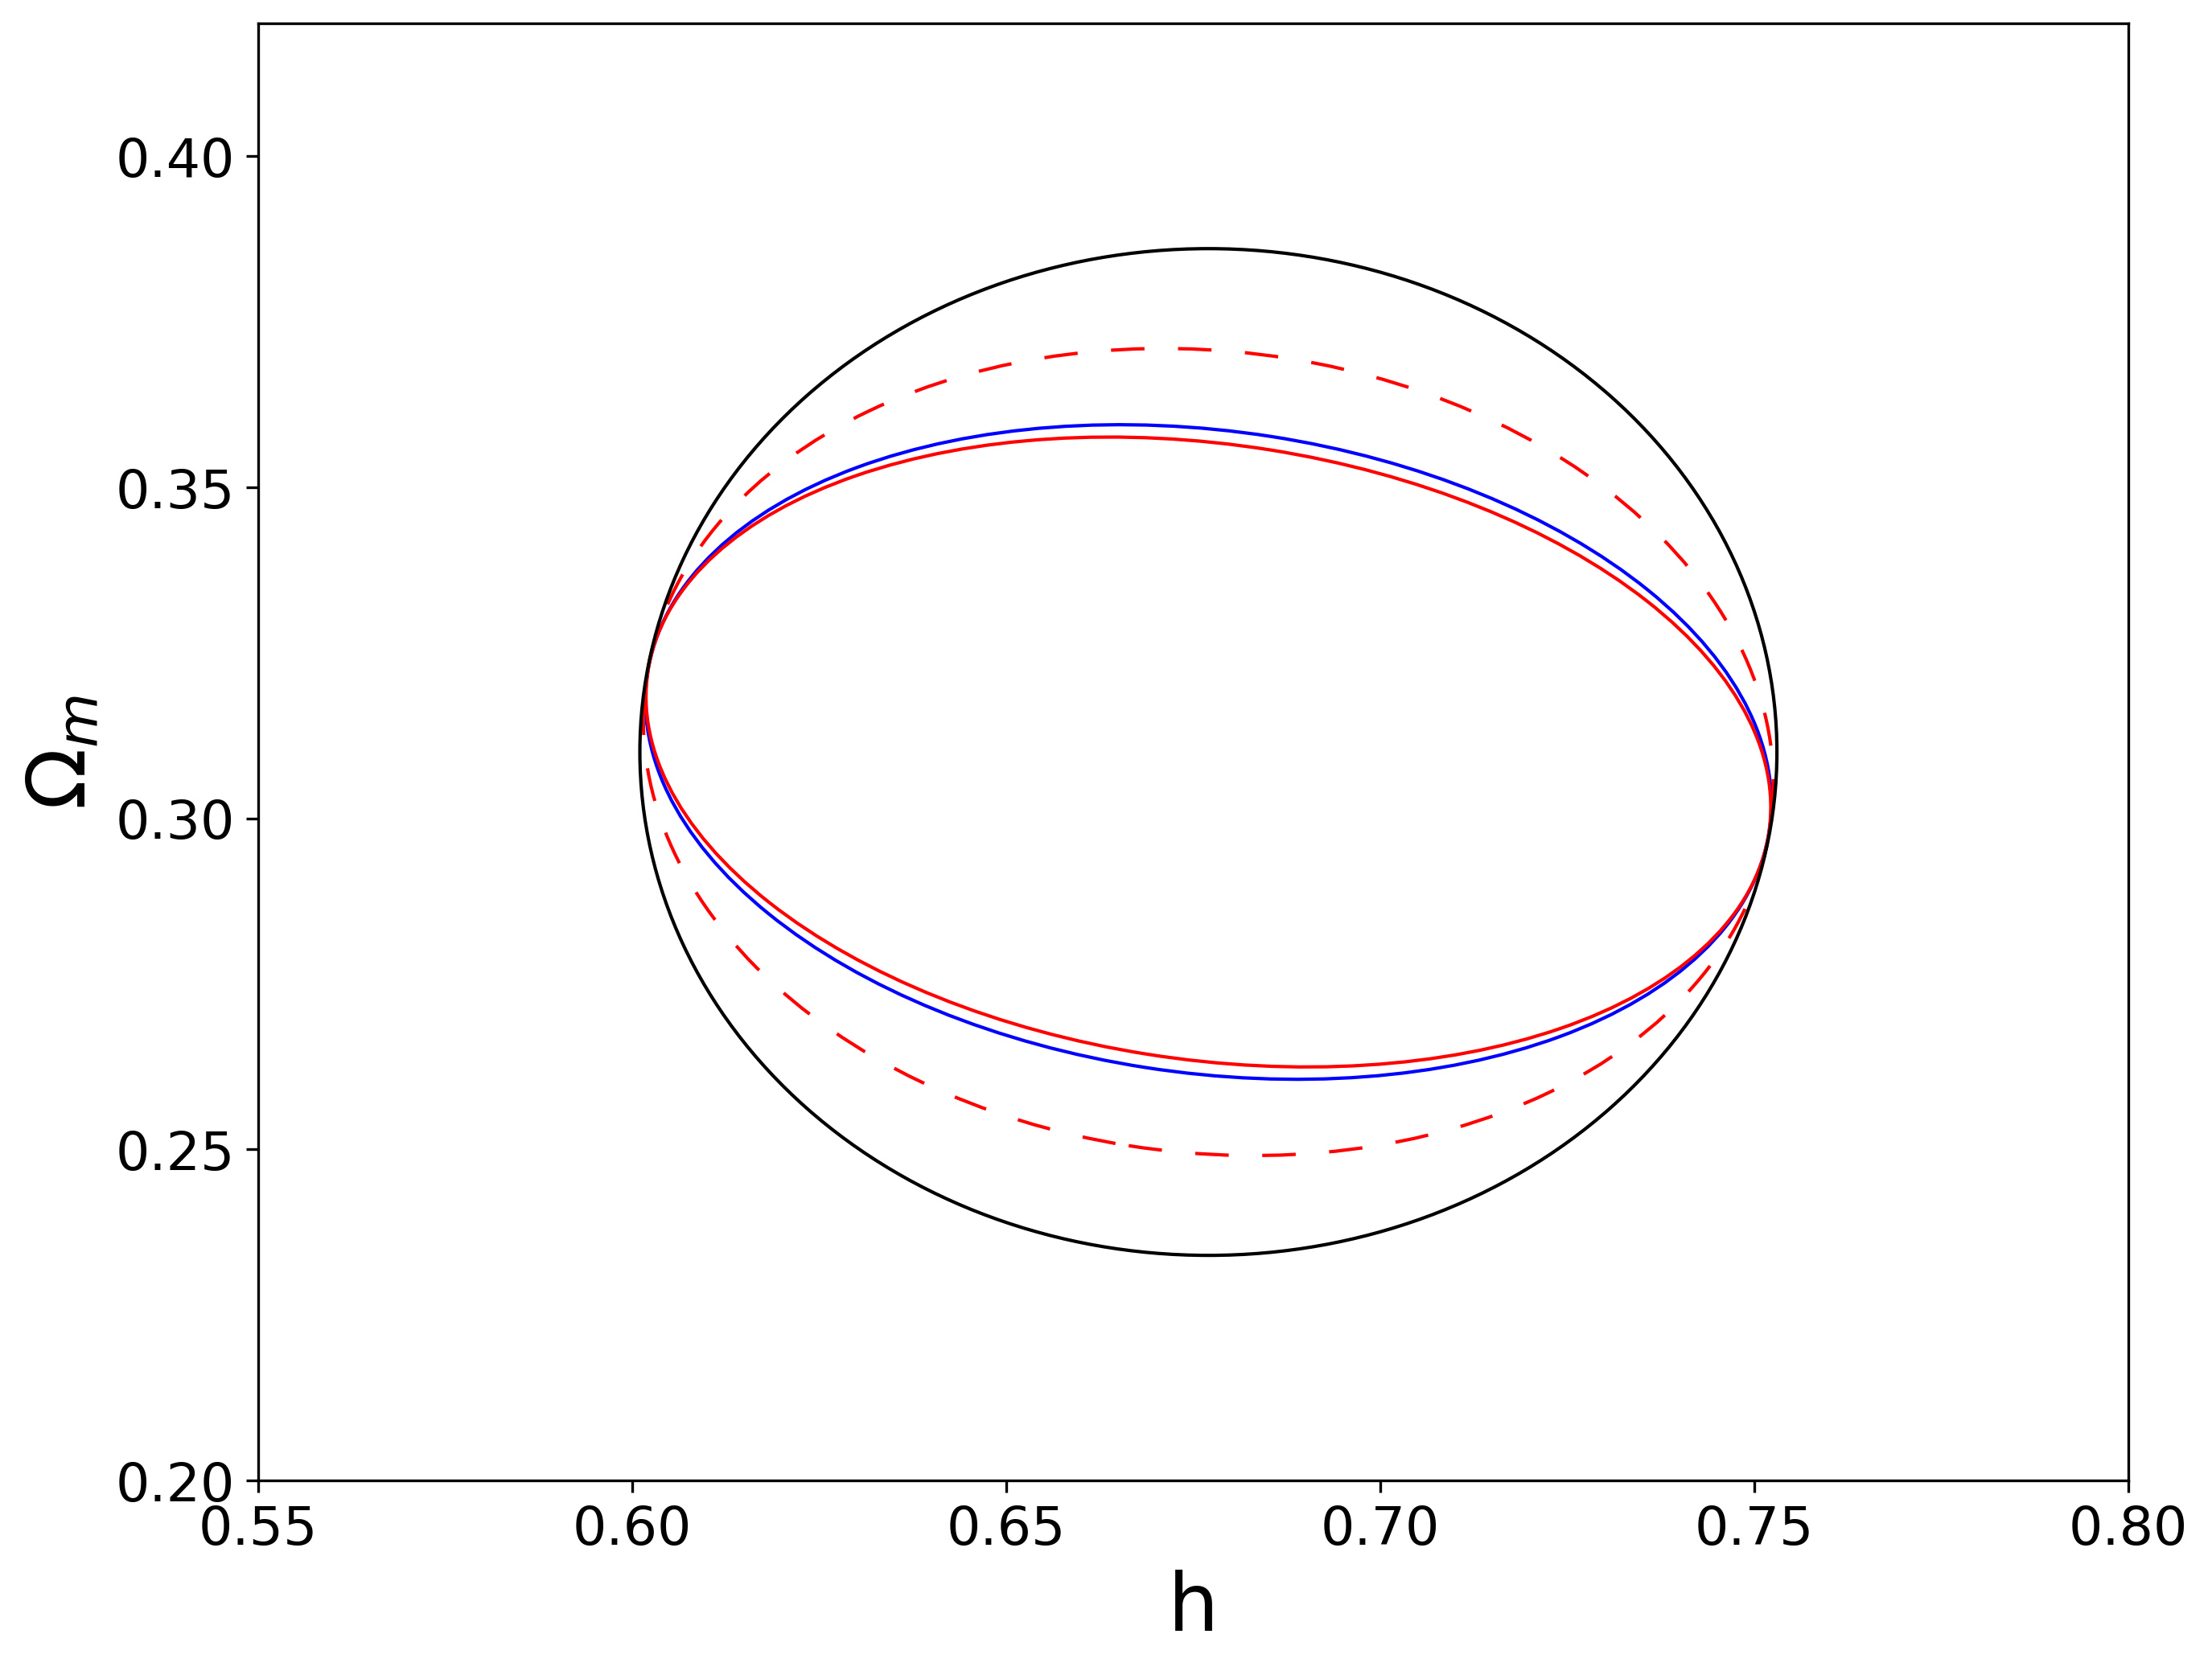

With respect to Paper II new brighter quasars (e.g. qid 1128023) have been found and we have reduced the Golden Sample to the seven brightest QSOs in the range . The seven QSOs cover a wide range of right ascension and this favors observability/scheduling. We are also assuming a fixed allocation of h of observation for each QSO (and not a variable amount of time required to reach a = 22.8 as in Paper II). In this way, assuming the most optimistic form factor (which holds if all the targets are observed twice, at the beginning and at the end of the experiment), for a total of 1500 hours of observations in 25 years, the redshift drift is expected to be detected with a confidence level of the order of 99% (as shown in Fig. 8). Besides, the combination of the measurement of the redshift drift with the QSOs Lyman Forest, at , will be plausibly complemented at with radio observations by the SKAO, CHIME and FAST (Moresco et al., 2022), providing an extended redshift leverage of the drift and significantly shortening the observing time required. The goal of the Sandage test is to provide a direct, real-time mapping of the expansion rate of the universe, independent of assumptions on gravity, geometry or clustering, so the precision of the determination of cosmological parameters is not its main focus. Nevertheless, recent theoretical studies (Martins et al., 2016; Alves et al., 2019; Esteves et al., 2021) have uncovered important synergies with other cosmological probes, including the characterization of the physical properties of dark energy. In this respect it is of interest to mention that, assuming a flat CDM cosmological model with the Planck Collaboration et al. (2020) best-fit cosmological parameters, and , and external priors for both of these parameters of and , a Fisher Matrix analysis leads to a one-sigma uncertainty for of 0.03 when the form factor is g=1 and of 0.04 with g=1.7, while the constraint recovers the prior. Fig. 9 compares these one-sigma constraints with the ones from the previous version of the Golden Sample in Paper II. A small gain in the matter density constraint, in spite of the 1000 h reduction of the observing time, is clearly visible (comparing for consistency the two g=1 cases).
The spectra of the seven QSOs in the Golden Sample have also been checked for the suitability of their absorption spectra for the redshift drift measurement (indeed, an eighth QSO has been excluded, due to the presence of BAL features) and are shown in Fig. 10.
The brightness of the QSOs of the Golden Sample makes the beginning of observations of this type conceivable in advance of the realization of the ELT, for example with the super-stable ESPRESSO spectrograph (Pepe et al., 2021) at the ESO VLT and a time investment of 3-4 nights per month. Indeed, a pilot program, 110.247Q.001 "An ESPRESSO Redshift Drift Experiment", started at ESO in 2022.
| qid | RA | DEC | redshift | in 214h | |||
|---|---|---|---|---|---|---|---|
| J2000 | J2000 | (mag) | (mag) | (mag) | () | ||
| 956603 | 00:41:31.44 | -49:36:11.7 | 16.675 | 16.568 | 16.6981 | 3.240 | 12.5 |
| 1128023 | 05:29:15.81 | -43:51:52.1 | 16.264 | 16.071 | 16.3452 | 3.960 | 7.8 |
| 1074326 | 05:48:03.20 | -48:48:13.1 | 17.215 | 16.886 | 17.2414 | 4.147 | 11.2 |
| 1368250 | 14:51:47.05 | -15:12:20.2 | 18.884 | 17.113 | 18.0754 | 4.760 | 12.1 |
| 860666 | 21:25:40.97 | -17:19:51.4 | 16.644 | 16.548 | 16.8730 | 3.897 | 9.8 |
| 552772 | 22:47:08.93 | -60:15:45.3 | 16.135 | 15.991 | 16.0895 | 2.999 | 10.4 |
| 27375882 | 22:54:51.33 | -05:29:24.0 | 16.641 | 16.635 | 16.7257 | 3.535 | 11.1 |
Acknowledgements
We thank an anonymous referee for comments that prompted a significant improvement of this paper. This work was financed by Portuguese funds through FCT - Fundaçao para a Ciência e a Tecnologia in the framework of the project 2022.04048.PTDC. CJM also acknowledges FCT and POCH/FSE (EC) support through Investigador FCT Contract 2021.01214.CEECIND/CP1658/CT0001. We thank Società Astronomica Italiana (SAIt), Ennio Poretti, Gloria Andreuzzi and Marco Pedani for the observation support at TNG. Part of the observations discussed in this work are based on observations made with the Italian Telescopio Nazionale Galileo (TNG) operated on the island of La Palma by the Fundacion Galileo Galilei of the INAF (Istituto Nazionale di Astrofisica) at the Spanish Observatorio del Roque de los Muchachos of the Instituto de Astrofisica de Canarias.
The national facility capability for SkyMapper has been funded through ARC LIEF grant LE130100104 from the Australian Research Council, awarded to the University of Sydney, the Australian National University, Swinburne University of Technology, the University of Queensland, the University of Western Australia, the University of Melbourne, Curtin University of Technology, Monash University and the Australian Astronomical Observatory. SkyMapper is owned and operated by the Australian National University’s Research School of Astronomy and Astrophysics. The survey data have been processed and provided by the SkyMapper Team at ANU. The SkyMapper node of the All-Sky Virtual Observatory (ASVO) is hosted at the National Computational Infrastructure (NCI). Development and support the SkyMapper node of the ASVO has been funded in part by Astronomy Australia Limited (AAL) and the Australian Government through the Commonwealth’s Education Investment Fund (EIF) and National Collaborative Research Infrastructure Strategy (NCRIS), particularly the National eResearch Collaboration Toolsand Resources (NeCTAR) and the Australian National Data Service Projects (ANDS).
This work has made use of data from the European Space Agency (ESA) mission Gaia (https://www.cosmos.esa.int/gaia), processed by the Gaia Data Processing and Analysis Consortium (DPAC, https://www.cosmos.esa.int/web/gaia/dpac/consortium). Funding for the DPAC has been provided by national institutions, in particular the institutions participating in the Gaia Multilateral Agreement. This job has made use of the Python package GaiaXPy, developed and maintained by members of the Gaia Data Processing and Analysis Consortium (DPAC), and in particular, Coordination Unit 5 (CU5), and the Data Processing Centre located at the Institute of Astronomy, Cambridge, UK (DPCI).
This publication makes use of data products from the Two Micron All Sky Survey, which is a joint project of the University of Massachusetts and the Infrared Processing and Analysis Center/California Institute of Technology, funded by the National Aeronautics and Space Administration and the National Science Foundation.
This publication makes use of data products from the Wide-field Infrared Survey Explorer, which is a joint project of the University of California, Los Angeles, and the Jet Propulsion Laboratory/California Institute of Technology, funded by the National Aeronautics and Space Administration.
This paper includes data gathered with the 6.5 meter Magellan Telescopes located at Las Campanas Observatory, Chile.
Data Availability
The data underlying this article will be shared on reasonable request to the corresponding author.
References
- Alves et al. (2019) Alves C. S., Leite A. C. O., Martins C. J. A. P., Matos J. G. B., Silva T. A., 2019, MNRAS, 488, 3607
- Anderson (2003) Anderson T. W., 2003, An Introduction to Multivariate Statistical Analysis, 3 edn. Wiley series in probability and mathematical statistics, Wiley, https://www.wiley.com/en-us/An+Introduction+to+Multivariate+Statistical+Analysis%2C+3rd+Edition-p-9780471360919
- Banse et al. (1988) Banse K., Ponz D., Ounnas C., Grosbol P., Warmels R., 1988, in Instrumentation for Ground-Based Optical Astronomy. p. 431
- Boutsia et al. (2020) Boutsia K., et al., 2020, ApJS, 250, 26
- Boutsia et al. (2021) Boutsia K., et al., 2021, ApJ, 912, 111
- Calderone et al. (2017) Calderone G., Nicastro L., Ghisellini G., Dotti M., Sbarrato T., Shankar F., Colpi M., 2017, MNRAS, 472, 4051
- Calderone et al. (2019) Calderone G., et al., 2019, ApJ, 887, 268
- Chambers et al. (2016) Chambers K. C., et al., 2016, arXiv e-prints, p. arXiv:1612.05560
- Chen & Guestrin (2016) Chen T., Guestrin C., 2016, in Proceedings of the 22nd ACM SIGKDD International Conference on Knowledge Discovery and Data Mining. KDD ’16. ACM, New York, NY, USA, pp 785–794, doi:10.1145/2939672.2939785, http://doi.acm.org/10.1145/2939672.2939785
- Colless et al. (2001) Colless M., et al., 2001, MNRAS, 328, 1039
- Cupani et al. (2022) Cupani G., et al., 2022, MNRAS, 510, 2509
- De Angeli et al. (2022) De Angeli F., et al., 2022, arXiv e-prints, p. arXiv:2206.06143
- Dong et al. (2022) Dong C., Gonzalez A., Eikenberry S., Jeram S., Likamonsavad M., Liske J., Stelter D., Townsend A., 2022, MNRAS, 514, 5493
- Esteves et al. (2021) Esteves J., Martins C. J. A. P., Pereira B. G., Alves C. S., 2021, MNRAS, 508, L53
- Flesch (2013) Flesch E., 2013, Publ. Astron. Soc. Australia, 30, e004
- Fontanot et al. (2023) Fontanot F., et al., 2023, MNRAS, 520, 740
- Gaia Collaboration et al. (2021) Gaia Collaboration et al., 2021, A&A, 649, A1
- Grazian et al. (2022) Grazian A., et al., 2022, ApJ, 924, 62
- Guarneri et al. (2021) Guarneri F., Calderone G., Cristiani S., Fontanot F., Boutsia K., Cupani G., Grazian A., D’Odorico V., 2021, MNRAS, 506, 2471
- Guarneri et al. (2022) Guarneri F., et al., 2022, MNRAS, 517, 2436
- Hinton et al. (2016) Hinton S. R., Davis T. M., Lidman C., Glazebrook K., Lewis G. F., 2016, Astronomy and Computing, 15, 61
- Inoue et al. (2014) Inoue A. K., Shimizu I., Iwata I., Tanaka M., 2014, MNRAS, 442, 1805
- Jones et al. (2009) Jones D. H., et al., 2009, MNRAS, 399, 683
- Kubota & Done (2018) Kubota A., Done C., 2018, MNRAS, 480, 1247
- Laor & Netzer (1989) Laor A., Netzer H., 1989, MNRAS, 238, 897
- Liske et al. (2008) Liske J., et al., 2008, MNRAS, 386, 1192
- Lyke et al. (2020) Lyke B. W., et al., 2020, ApJS, 250, 8
- Marconi et al. (2022) Marconi A., et al., 2022, in Evans C. J., Bryant J. J., Motohara K., eds, Society of Photo-Optical Instrumentation Engineers (SPIE) Conference Series Vol. 12184, Ground-based and Airborne Instrumentation for Astronomy IX. p. 1218424, doi:10.1117/12.2628689
- Martins et al. (2016) Martins C. J. A. P., Martinelli M., Calabrese E., Ramos M. P. L. P., 2016, Phys. Rev. D, 94, 043001
- McMahon et al. (2021) McMahon R. G., Banerji M., Gonzalez E., Koposov S. E., Bejar V. J., Lodieu N., Rebolo R., VHS Collaboration 2021, VizieR Online Data Catalog, p. II/367
- Mor et al. (2009) Mor R., Netzer H., Elitzur M., 2009, ApJ, 705, 298
- Moresco et al. (2022) Moresco M., et al., 2022, Living Reviews in Relativity, 25, 6
- Morrissey et al. (2007) Morrissey P., et al., 2007, ApJS, 173, 682
- Murphy et al. (2019) Murphy M. T., Kacprzak G. G., Savorgnan G. A. D., Carswell R. F., 2019, MNRAS, 482, 3458
- Onken et al. (2021) Onken C. A., Wolf C., Bian F., Fan X., Jeat Hon W., Raithel D., Tisserand P., Lai S., 2021, arXiv e-prints, p. arXiv:2105.12215
- Pepe et al. (2021) Pepe F., et al., 2021, A&A, 645, A96
- Pier & Krolik (1993) Pier E. A., Krolik J. H., 1993, ApJ, 418, 673
- Planck Collaboration et al. (2020) Planck Collaboration et al., 2020, A&A, 641, A6
- Prochaska (2017) Prochaska J. X., 2017, Astronomy and Computing, 19, 27
- Reis et al. (2019) Reis I., Baron D., Shahaf S., 2019, AJ, 157, 16
- Richards et al. (2006) Richards G. T., et al., 2006, ApJS, 166, 470
- Sandage (1962) Sandage A., 1962, ApJ, 136, 319
- Schindler et al. (2019a) Schindler J.-T., et al., 2019a, ApJS, 243, 5
- Schindler et al. (2019b) Schindler J.-T., et al., 2019b, ApJ, 871, 258
- Sevilla-Noarbe et al. (2021) Sevilla-Noarbe I., et al., 2021, ApJS, 254, 24
- Skrutskie et al. (2006) Skrutskie M. F., et al., 2006, AJ, 131, 1163
- Sun & Malkan (1989) Sun W.-H., Malkan M. A., 1989, ApJ, 346, 68
- Vanden Berk et al. (2001) Vanden Berk D. E., et al., 2001, AJ, 122, 549
- Véron-Cetty & Véron (2010) Véron-Cetty M. P., Véron P., 2010, A&A, 518, A10
- Wolf et al. (2018) Wolf C., et al., 2018, Publ. Astron. Soc. Australia, 35, e010
- Wolf et al. (2020) Wolf C., et al., 2020, MNRAS, 491, 1970
- Wright et al. (2010) Wright E. L., et al., 2010, AJ, 140, 1868
- Yang et al. (2016) Yang J., et al., 2016, ApJ, 829, 33
| qid | RA | DEC | zGaia | Class | zspec | Obs. date | Instrument | |
| J2000 | J2000 | |||||||
| 888971 | 00:01:23.91 | -58:57:22.2 | 17.982 | 3.255 | QSO | - | - | - |
| 889687 | 00:02:09.76 | -60:59:07.2 | 17.064 | 2.664 | QSO | - | - | - |
| 7896285 | 00:03:43.91 | -18:54:25.0 | 18.510 | 2.603 | QSO | - | - | - |
| 1039775 | 00:04:35.62 | -25:07:07.6 | 17.248 | 1.898 | QSO | - | - | - |
| 33517238 | 00:04:49.35 | -36:29:39.6 | 18.973 | 2.864 | QSO | - | - | - |
| 1169052 | 00:04:57.90 | -52:45:30.4 | 18.297 | 3.143 | QSO | - | - | - |
| 7930596 | 00:04:59.18 | -16:46:42.1 | 18.509 | 2.562 | QSO | - | - | - |
| 863587 | 00:05:02.01 | -59:25:13.1 | 17.858 | 2.421 | QSO | - | - | - |
| 1172305 | 00:05:29.01 | -46:55:21.7 | 18.405 | 2.579 | QSO | - | - | - |
| 1163878 | 00:06:28.87 | -48:31:32.0 | 18.369 | 3.602 | QSO | - | - | - |
| 33521462 | 00:07:05.63 | -47:26:29.5 | 18.998 | 2.560 | QSO | - | - | - |
| 33581625 | 00:07:19.11 | -34:51:31.3 | 18.941 | 2.403 | QSO | - | - | - |
| 7837051 | 00:08:55.29 | -23:17:02.6 | 18.513 | 3.434 | QSO | - | - | - |
| 33564048 | 00:09:19.75 | -31:10:26.4 | 18.696 | 2.753 | QSO | - | - | - |
| 1185342 | 00:09:46.32 | -21:24:34.1 | 18.510 | 2.778 | QSO | - | - | - |
| 33542027 | 00:11:15.89 | -47:24:41.9 | 18.833 | 2.462 | QSO | - | - | - |
| 888901 | 00:11:18.15 | -69:08:20.9 | 17.873 | 2.953 | QSO | - | - | - |
| 819906 | 00:12:59.29 | -12:42:29.4 | 17.938 | 2.736 | QSO | - | - | - |
| 1191530 | 00:13:29.11 | -36:00:50.4 | 18.589 | 2.414 | QSO | - | - | - |
| 33626537 | 00:14:24.74 | -63:31:29.4 | 18.877 | 2.606 | QSO | - | - | - |
| 33488458 | 00:16:10.44 | -38:47:11.7 | 18.726 | 2.958 | QSO | - | - | - |
| 8404090 | 00:17:08.70 | +14:17:43.5 | 17.723 | 2.824 | QSO | - | - | - |
| 33520136 | 00:17:29.41 | -60:32:45.7 | 18.703 | 2.658 | QSO | - | - | - |
| 33586920 | 00:17:42.84 | -37:14:12.5 | 18.384 | 2.493 | QSO | - | - | - |
| 1352951 | 00:18:29.95 | +03:19:03.3 | 16.595 | 2.777 | QSO | 2.786 | 2022-08-26 | DOLORES |
| … |