Subdiffusive Dynamics of Topological Vortex Strings of a Charge Density Wave
Nonequilibrium states of quantum materials can exhibit exotic properties and enable novel functionality and applications. These transient states are thought to be highly inhomogeneous, involving metastable, self-organized, topologically protected structures, which are inaccessible by most time-resolved measurements. Using ultrafast total x-ray scattering at a free electron laser and a sophisticated scaling analysis, we gain unique access to the dynamics on the relevant mesoscopic length scales. Our results show that ultrafast excitation of LaTe3 leads to formation of vortex strings of the charge density wave, which exhibit anomalous, subdiffusive dynamics. These findings provide rare insight into the nonequilibrium mesoscopic response in a quantum material and establish a general framework to investigate properties of topological defects, which can arrest equilibration and enhance competing orders.
Excitation of materials with ultrafast light pulses has led to the discovery of novel states of matter out of equilibrium and represents a promising avenue to control their functional properties[1]. Understanding and manipulating these emergent properties requires a deeper insight into how the photoinduced states evolve away from and towards equilibrium[2, 3]. In many photoexcited systems the evolution of these transient states is characterized by the formation of metastable, inhomogeneous regions and self-organization on mesoscopic length-scales [4, 5, 3, 6]. However, most ultrafast probes are only sensitive to the average structure and consequentially afford only limited insight into the transient emergent properties of the photoexcited materials [7]. Here we use the high wavevector and time resolution afforded by an x-ray free electron laser (XFEL), combined with a new scaling analysis, to gain unprecedented access to the dynamics on the relevant mesoscopic length-scales. We study the evolution of the prototypical incommensurate charge density wave (CDW) in LaTe3 using femtosecond x-ray scattering following excitation by an ultrafast laser pulse. Our findings reveal clear signatures of photoinduced vortex strings (dislocations of the CDW) allowing us to resolve their evolution. The scaling yields the symmetry of the order parameter, and the dynamics show anomalous subdiffusive behavior which is indicative of hidden microscopic conserved quantities[8]. These results represent a measurement of the nonequilibrium mesoscopic response in a quantum material and offer a glimpse into the evolution of topological defects that may arrest equilibration and enhance competing orders [4, 5, 9, 10, 11, 12, 6, 13].
In a material undergoing a symmetry breaking phase transition under nonequilibrium conditions, the low-symmetry phase develops independently in separate regions of space, leaving behind disconnected domains. This leads to the formation of topological defects (TDs) by the Kibble-Zurek mechanism [14, 15]. As the system evolves towards equilibrium, these defects annihilate and the independently ordered domains coalesce. Generally, this coarsening process obeys self-similar dynamic scaling[16, 17, 18, 19, 13], where the fluctuations are characterized by a single length scale, . Here corresponds to a mean domain size, or an average distance between TDs. Under such conditions, the structure factor , as measured by x-ray scattering, has the form:
| (1) |
where is a universal function, a proportionality constant and determines whether the coarsening is superdiffusive (), diffusive ( or subdiffusive (. The scaling of , as well as the value of the growth exponent, , are powerful indicators of the symmetry of the order parameter and reveal microscopic properties and conserved quantities[17, 20, 8, 21].
In spite of the long history of theoretical works [16, 22, 15], experimental evidence of TDs and their coarsening dynamics in quantum materials far from equilibrium remains elusive[23, 24, 19, 25]. How TDs affect transient photoinduced states is virtually unexplored due to the lack of appropriate probes at the relevant nanometer length- and picosecond time-scales. To a large extent, photoinduced states of materials are still interpreted in terms of time-dependent, homogeneous, order parameters, even though their recovery should behave more like a transient glass of TDs, greatly affecting their properties.
Here we study the photoinduced coarsening process in LaTe3, which is a member of the rare-earth tritellurides (RTe3, with R being a rare-earth element). Recently, this class of materials has attracted attention as a model system to investigate the dynamics of symmetry-breaking phase transitions [26, 23, 25, 5, 27, 28]. Below the transition temperature, which is estimated at K For LaTe3[29], these materials develop an incommensurate CDW with wavevector along the in-plane axis.
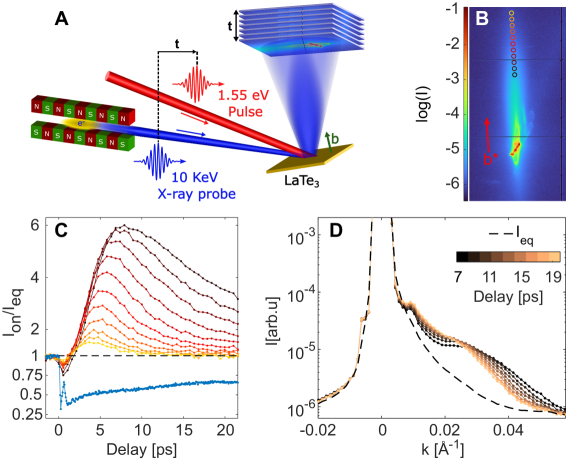
We probed the dynamics of the lattice component of the CDW in LaTe3 using 50 fs, 10keV hard x-ray pulses at the Bernina instrument [30] of the SwissFEL facility[31]. The dynamics were initiated by a 35 fs optical pump pulse as illustrated in Fig. 1A (see Materials and Methods for details). Figure 1B shows the detector image of the CDW Bragg peak, where , and are the respective standardized cell parameters and . The intensity is shown with logarithmic scale and integrated over pump-probe delays between and ps. The peak is elongated along the direction due to the shorter out-of-plane compared to the in-plane correlation lengths.
Fig. 1C shows the intensity normalized by the equilibrium value as a function of pump-probe delay, , at the representative regions along the direction marked in Fig. 1B. The intensity near the peak (blue line), which represents the long-range order of the CDW, decreases sharply after and remains depressed below the equilibrium level throughout our measurement. Generally, photoexcitation above the CDW bandgap induces a fast suppression of the long-range order, which subsequently recovers with an extremely long timescale depending on the strength of the excitation[24, 32, 19, 27]. In contrast, on the tail of the peak (black to yellow lines) the initial decrease in normalized intensity is followed by an increase well above equilibrium values over several picoseconds. This increase starts after ps, which is roughly the time it takes for the CDW electronic gap to restore according to time and angle resolved photo-electron spectroscopy measurements [25, 26]. The increase of diffuse intensity away from the CDW wavevector is a signature of growing inhomogeneity and spatial fluctuations of the CDW induced by photoexcitation. Its observation is enabled by the high brightness of the XFEL together with its exceptional temporal and wavevector resolution, which allow subtle details of the dynamics of the diffuse intensity on the tails of the peak to be captured.
In Fig. 1D we show the scattering intensity, , as a function of wavevector along , for , at representative delays after ps. Comparing these plots with the equilibrium intensity shown by the black dashed line, it is clear that the peak broadens initially (black dots) and gradually narrows back at later times (copper dots). The narrowing of the peak is the hallmark of coarsening of spatially inhomogeneous regions as the system recovers towards equilibrium.
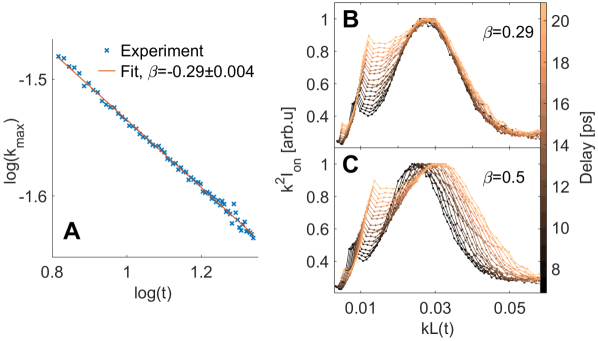
To extract the growth exponent of the coarsening process, in Eq. (1), it is convenient to define , which has the same scaling form as . The location of the maximum of satisfies independently of the function [33]. In Fig. 2A we show , extracted from the experiment, versus . The plot fits a straight line very well with a slope of . In Fig. 2B, we plot versus at various delays for . The maxima, as well as the whole region, collapse quite well for all presented delays. The deviation from scaling at low (long wavelengths) is expected, as other parameters such as the optical penetration depth set the dominant lengthscale[27]. This data collapse clearly shows that the system exhibits scaling with a coarsening length-scale of .
A growth exponent of is an intriguing result. Extensive theoretical studies[22, 17] concluded that, in systems with a non-conserved order parameter, the recovery of long range order at long times follows a diffusive process with . This has been confirmed experimentally in diverse systems from nematic liquid crystals[18] to CDWs[19]. In Fig. 2C we plot versus at various delays for . The data collapses visibly better for (Fig. 2B) than for (Fig. 2C), confirming that the system indeed behaves subdiffusively. Subdiffusive behavior suggests that the dynamics are constrained by additional conserved quantities. It has been established that for a system with a conserved order parameter [22]. While the CDW here is quite different from a conserved order parameter, the anomalous subdiffusive dynamics is a manifestation of restricted microscopic motion of the system.
Our following analysis shows clear evidence that the coarsening process is dominated by photoinduced vortex strings, which are dislocations of the CDW. The subdiffusive behavior is likely a signature of the restricted mobility of these dislocations. At large wavevectors, where interference between multiple TDs is negligible, the structure factor for a network of TDs has the asymptotic form of an isolated defect[34]:
| (2) |
where is the number of components of a vector order parameter, is the spatial dimension and is the density of TDs, which under reasonable conditions also exhibits power-law behavior, [16, 34]. For the incommensurate CDW considered here the expectation is that and , thus the stable TDs are vortex strings [16] with the asymptotic structure factor .
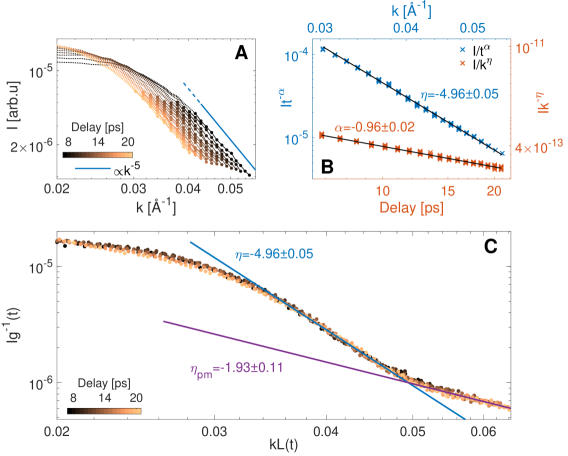
The unique properties of the XFEL enable us to measure the subtle intensity changes around the CDW peaks with high sensitivity and wavevector resolution and search for these power-law signatures of the TDs [Eq.(2)]. The black to yellow dotted lines in Fig. 3A show the scattering intensity for Å-1 at different times in a log-log plot and the blue line is a power-law. Clearly, at large , the traces for different times, as represented by the solid lines with markers, exhibit a similar behavior. To extract the scaling we take the 174 data points with markers in Fig. 3A and fit them to extracting and . The red and blue symbols in the log-log plot in Fig. 3B show the same data points collapsed in (, red symbols) and (, blue symbols), using the extracted exponents and respectively. This remarkable data collapse indicates that the asymptotic scattering is governed by Eq. (2) with . The fact that , provides decisive evidence that vortex strings dominate the scattering in the high tail following the ultrafast quench.
Having found a clear signature of vortex strings in the scattering, we now combine the scaling expression in Eq. (1) with the asymptotic scattering in Eq. (2) to scale the data. We find that, for the vortex string power-law region, [33]. We use the , and extracted from our data to determine and, together with , scale according to Eq. (1), as shown in Fig. 3C. This plot shows remarkable self-similarity for . The data scaling relies on the vortex string parameters, and , which were extracted independently of , yet these parameters collapse the data at low as well, beyond the power law region where . This relation between the TD scaling in and the global self-similar behavior in time, reveals the strong connection between the vortex strings and the subdiffusive coarsening process.
Figure 3C provides additional insight into the evolution of the nonequilibrium state. Our high resolution measurements clearly identify a crossover from (solid blue line) to (solid purple line) at large . This crossover means that at later times, as the TD density decreases, the scattering at high is no longer dominated by the TDs; instead, scattering comes primarily from phase-modes, which have the asymptotic form [22].
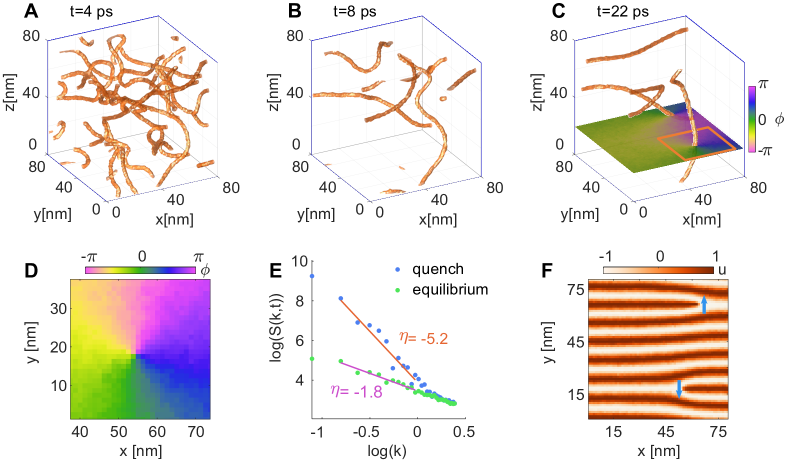
To visualize the vortex string dynamics we simulated the Ginzburg-Landau model [16] for a complex order parameter (), , in three spatial dimensions () (see Materials and Methods and movie S1). Figs. 4A-C show the surface following a sudden quench to the low symmetry potential energy, at representative delays of 4 ps, 8 ps and 22 ps respectively. The initial random configuration of the disordered state around quickly breaks down into strings whose density decreases with time[16]. Fig. 4D shows the phase of winding by around the string center on the plane indicated in Fig. 4C; this winding of the phase occurs along the entire string length and is a topological invariant. Therefore, vortex strings can only vanish by annihilating with other vortex strings with an opposite winding number, or by shrinking of closed loops [16]. The solid symbols in Fig. 4E show the simulated versus on a log-log plot and the solid lines are power-law fits. The blue symbols exhibit an asymptotic power-law with an exponent of , which agrees well with our experimental observations (Fig. 3). In contrast, the green symbols in Fig. 4E correspond to a thermal equilibrium starting from the ordered state, . In this case the system does not produce vortex strings and it exhibits a power-law with , close to the theoretical expected for phase modes. Furthermore, the blue symbols in Fig. 4E show a crossover between scattering dominated by vortex strings, , to scattering dominated by phase modes, . We observe a similar crossover experimentally in Fig. 3C.
In the present context, vortex strings correspond to dislocations of the CDW. Fig. 4F illustrates a CDW lattice distortion in the nm plane, taking the phase from Fig. 4C. The vortices with opposite winding numbers correspond to two dislocations with opposite Burgers vectors [35], indicated by blue arrows in Fig. 4F. While the simple Ginzburg-Landau theory correctly predicts the formation of vortex strings with [17, 16], it incorrectly predicts purely diffusive coarsening with [17, 16]. The observed subdiffusive dynamics requires a description beyond this phenomenological model, as it does not account for the anisotropic motion of the dislocations along and perpendicular to the Burgers vectors. Dislocations with restricted mobility are analogous to other systems with restricted motion, which exhibit subdiffusive thermalization and broken ergodicity due to additional conserved microscopic quantities[8, 21]. Clearly, our measurements and incisive analysis reveal subtle microscopic details that challenge the canonical framework used in the interpretation of many ultrafast condensed-matter experiments [23, 32, 5, 25].
Our results constitute a clear measurement of photoinduced topological defects of the prototypical CDW in LaTe3 on ultrafast time scales. We show that at early times the evolution of the highly nonequilibrium state is dominated by vortex strings. The observed subdiffusive dynamics is indicative of the strings’ restricted mobility, which crucially impacts the system’s thermalization and broken ergodicity. Our methods as well as the implications of our findings extend well beyond LaTe3, as formation of topological defects is expected to be ubiquitous in symmetry breaking phase transitions under nonequilibrium conditions [14, 15]. Thus, the high resolution XFEL measurements, combined with scaling and data collapse analysis, establish an incisive approach to probe the mesoscopic, out-of-equilibrium behavior of intertwined orders in quantum materials [3].
References
- [1] D. N. Basov, R. D. Averitt, D. Hsieh, Nature Materials 16, 1077 (2017).
- [2] Z. Sun, A. J. Millis, Phys. Rev. X 10, 021028 (2020).
- [3] J. Ravnik, et al., Nature Communications 12, 2323 (2021).
- [4] L. Stojchevska, et al., Science 344, 177 (2014).
- [5] A. Kogar, et al., Nature Physics 16, 159 (2020).
- [6] S. Wandel, et al., Science 376, 860 (2022).
- [7] S. Wall, et al., Science 362, 572 (2018).
- [8] M. Pretko, L. Radzihovsky, Phys. Rev. Lett. 120, 195301 (2018).
- [9] V. F. Mitrović, et al., Nature 413, 501 (2001).
- [10] A. Mesaros, et al., Science 333, 426 (2011).
- [11] Y. I. Joe, et al., Nature Physics 10, 421 (2014).
- [12] S. Yan, et al., Phys. Rev. Lett. 118, 106405 (2017).
- [13] M. Mitrano, et al., Science Advances 5, eaax3346 (2019).
- [14] T. W. B. Kibble, Journal of Physics A: Mathematical and General 9, 1387 (1976).
- [15] W. H. Zurek, Nature 317, 505 (1985).
- [16] M. Mondello, N. Goldenfeld, Phys. Rev. A 45, 657 (1992).
- [17] A. J. Bray, A. D. Rutenberg, Phys. Rev. E 49, R27 (1994).
- [18] A. P. Y. Wong, P. Wiltzius, R. G. Larson, B. Yurke, Phys. Rev. E 47, 2683 (1993).
- [19] S. Vogelgesang, et al., Nature Physics 14, 184 (2018).
- [20] P. C. Hohenberg, B. I. Halperin, Rev. Mod. Phys. 49, 435 (1977).
- [21] A. Gromov, A. Lucas, R. M. Nandkishore, Phys. Rev. Research 2, 033124 (2020).
- [22] G. F. Mazenko, M. Zannetti, Phys. Rev. B 32, 4565 (1985).
- [23] R. Yusupov, et al., Nature Physics 6, 681 (2010).
- [24] T. Mertelj, et al., Phys. Rev. Lett. 110, 156401 (2013).
- [25] A. Zong, et al., Nature Physics 15, 27 (2019).
- [26] F. Schmitt, et al., Science 321, 1649 (2008).
- [27] M. Trigo, et al., Phys. Rev. B 103, 054109 (2021).
- [28] Y. Wang, et al., Nature 606, 896 (2022).
- [29] B. F. Hu, B. Cheng, R. H. Yuan, T. Dong, N. L. Wang, Phys. Rev. B 90, 085105 (2014).
- [30] G. Ingold, et al., Journal of Synchrotron Radiation 26, 874 (2019).
- [31] E. Prat, et al., Nature Photonics 14, 748 (2020).
- [32] T. Huber, et al., Phys. Rev. Lett. 113, 026401 (2014).
- [33] See supplementary materials .
- [34] A. J. Bray, K. Humayun, Phys. Rev. E 47, R9 (1993).
- [35] F. Nabarro, Oxford University Press (1967).
- [36] N. Ru, I. R. Fisher, Phys. Rev. B 73, 033101 (2006).
- [37] N. Ru, et al., Phys. Rev. B 77, 035114 (2008).
Acknowledgments
We acknowledge the Paul Scherrer Institute, Villigen, Switzerland for provision of free-electron laser beamtime at the Bernina instrument of the SwissFEL ARAMIS branch. Funding: G.O., R.A.D, G.A.P.M., Y.H., V.K., D.A.R., and M.T. were supported by the US Department of Energy, Office of Science, Office of Basic Energy Sciences through the Division of Materials Sciences and Engineering under Contract No. DE-AC02-76SF00515. For crystal growth and characterization, A.G.S. and I.R.F. were supported by the Department of Energy, Office of Basic Energy Sciences, under contract DE-AC02-76SF00515. G.O. acknowledges support from the Koret Foundation. R.A.D. acknowledges support through the Bloch Postdoctoral Fellowship in Quantum Science and Engineering from the Stanford University Quantum Fundamentals, Architectures, and Machines initiative (Q-FARM), and the Marvin Chodorow Postdoctoral Fellowship from the Stanford University Department of Applied Physics. Author Contributions M.T. conceived the initial experiment and supervised the project; G.O., R.A.D, G.A.P.M, Y.H., V.K.,Q.L.N., S.T., R.M., H.L., M.S., Y.D., C.A., D.A.R. and M.T. performed the experiment; Sample synthesis and characterization was performed by A.G.S under the supervision of I.R.F.; G.O. analyzed the data; G.O. and M.T. performed the simulations; The manuscript was written by G.O. and M.T. with input from all authors.
Supplementary materials
Materials and Methods
Supplementary Text
Figs. S1 and S2
Movies S1
References 36 and 37