The Chemodynamical Nature of the Triangulum-Andromeda Overdensity
Abstract
We present a chemodynamical study of the Triangulum-Andromeda overdensity (TriAnd) employing a sample of 31 candidate stars observed with the GRACES high-resolution (=40,000) spectrograph at the Gemini North (8.1 m) telescope. TriAnd is a stellar substructure found toward the outer disk of the Milky Way, located at kpc from the Sun, toward Galactic latitude . Most stars in our sample have dynamical properties compatible with a disk stellar population. In addition, by applying an eccentricity cut, we are able to detect a stellar contamination that seems to be consistent with an accreted population. In chemical abundance space, the majority of our TriAnd candidates are similar to the outer thin-disk population, suggesting that the overdensity has an in situ origin. Finally, the found accreted halo interlopers spatially overlapping with TriAnd should explain the historical discussion of the overdensity’s nature due to its complex chemical patterns.
1 Introduction
The Milky Way (MW) is teeming with substructures such as stellar streams and overdensities whose origins are still under debate (Belokurov, 2013; Helmi, 2020). Among the various scenarios for the formation of our Galaxy (Eggen et al., 1962; Searle & Zinn, 1978; Tinsley, 1980), the bottom-up scenario is the most accepted one, taking into account the formation of these substructures. First suggested by Searle & Zinn (1978), it is supported by theoretical predictions from the Cold Dark Matter (CDM) cosmological paradigm (Spergel et al., 2007) and numerical simulations (Somerville & Davé, 2015).
In this hierarchical scenario, ancient mergers of dwarf galaxies with a still-young MW likely caused the formation of substructures from the tidal disruption of these satellites (Johnston, 1998; Bullock & Johnston, 2005; Johnston et al., 2008; Cooper et al., 2010; Helmi et al., 2011; Gómez et al., 2013). These events, however, did not only occur in ancient times; there are also ongoing accretions like the Sagittarius dwarf spheroidal (Ibata et al., 1994, 1995). Additionally, a profusion of other disrupted dwarf galaxies that populate the Galactic halo can be seen in the form of stellar streams (Helmi & White, 1999; Ivezić et al., 2000; Yanny et al., 2000; Belokurov et al., 2006, 2007a; Newberg et al., 2009; Grillmair, 2011; Bernard et al., 2016; Grillmair & Carlin, 2016; Malhan et al., 2018; Mateu et al., 2018; Shipp et al., 2018; Ibata et al., 2019, 2021; Li et al., 2022).
Stellar overdensities are among the different substructures permeating the Galactic halo, e.g. Virgo (Newberg et al., 2002; Jurić et al., 2008), Pisces (Sesar et al., 2007; Watkins et al., 2009), Eridanus-Phoenix (Li et al., 2016) and Hercules-Aquila (Belokurov et al., 2007b). Ancient mergers seem to be the main culprits for the formation of these substructures (Belokurov et al., 2019; Donlon et al., 2019; Chang et al., 2020; Balbinot & Helmi, 2021; Naidu et al., 2021; Chandra et al., 2022; Perottoni et al., 2022; Wang et al., 2022), but they can also be found close to the Galactic plane with a potentially different origin.
Historically, an in situ origin for the stellar overdensities close to the Galactic plane has been suggested (Rocha-Pinto et al., 2003; Momany et al., 2004, 2006; López-Corredoira et al., 2007; Gómez et al., 2013; Dierickx et al., 2014; Price-Whelan et al., 2015; Xu et al., 2015; Li et al., 2017, 2021; Deason et al., 2018; Sheffield et al., 2018; Youakim et al., 2020; Carballo-Bello et al., 2021; Ramos et al., 2021; Laporte et al., 2022). Those structures are proposed to be formed as a result of interactions of dwarf galaxies with the MW throughout its history, which can dynamically heat the disk (Yanny & Newberg, 2016; Figueras, 2017; Schönrich & Dehnen, 2018), supported by simulations (Laporte et al., 2018, 2019). Other authors, by comparing both the chemical and dynamical patterns from those stellar overdensities with satellite galaxies, conclude that their most probable origin is extragalactic (Martin et al., 2004; Bellazzini et al., 2006; Chou et al., 2011; Meisner et al., 2012; Deason et al., 2014; Morganson et al., 2016; Guglielmo et al., 2018).
One of the stellar overdensities close to the Galactic plane is the Triangulum-Andromeda overdensity (TriAnd), first identified by Rocha-Pinto et al. (2004) using a photometric selection of M-giant star candidates from the Two Micron All Sky Survey (2MASS; Skrutskie et al. 2006) between and as a clumpy cloudlike structure. Majewski et al. (2004) also observed TriAnd through a deep photometric survey of M31 fields. Both works estimated a distance of 16–25 kpc from the Sun.
Since its discovery, TriAnd has been studied with different techniques to better understand its characteristics and plausible origin. Martin et al. (2014), utilizing MegaCam photometric data (Martin et al., 2007) from the Pan-Andromeda Archaeological Survey (McConnachie et al., 2009), identified the main sequence of TriAnd stars and other structures also in the same region. Xu et al. (2015), with photometric data from the Sloan Digital Sky Survey (SDSS; Stoughton et al. 2002), argued that TriAnd is, apparently, a concentric structure located 21 kpc from the Galactic center. Perottoni et al. (2018), also with SDSS data, observed fluctuations in the structure’s density being limited at , in agreement with previous kinematical determinations (Sheffield et al., 2014).
Among the different techniques employed to better understand TriAnd’s features, spectroscopy has been the most prominent to settle the debate about the nature of the overdensity. In the first high-resolution (32,000 and 35,000) spectroscopic study of TriAnd, Chou et al. (2011) analyzed the spectra of six candidate stars selected from Rocha-Pinto et al. (2004). Their results indicated that TriAnd would have higher metallicity ( dex) than previously estimated ( dex) by Rocha-Pinto et al. (2004) using the Ca infrared triplet spectral indices from lower-resolution () spectra.
Recently, with high-resolution (=36,000 and 47,000) spectroscopy, Bergemann et al. (2018) derived abundance patterns for O, Na, Mg, Ti, Ba, and Eu considering TriAnd candidate star samples with mean dex. Their main result was that these stars have an in situ disk origin and suggested that the overdensity was formed by tidal interactions of the disk with passing or merging dwarf galaxies. Shortly after this, using data from the Apache Point Observatory Galactic Evolution Experiment (Majewski et al., 2017) Fourteenth Data Release (APOGEE DR14; Abolfathi et al. 2018), Hayes et al. (2018a) observed that the chemical patterns obtained from the TriAnd stars (Mg, (C+N), K, Ca, Mn, and Ni) appear to be consistent with a metal-poor extrapolation of the outer disk’s trend to a larger radius.
Sales Silva et al. (2019, 2020) obtained a sample of 13 TriAnd candidate stars and studied a larger set of elements, including (Mg, Ca, Si, and Ti), iron-peak (Fe, Ni, and Cr), odd- (Al and Na), and neutron-capture elements (Ba and Eu). The authors concluded that the overdensity structure is composed by stars with a unique chemical pattern not corresponding to stars present in either the local Galactic disk or dwarf spheroidal galaxies.
The complex chemical profile observed for the TriAnd stars, combined with the low number of candidates observed with high-resolution spectroscopy, and the scarcity of studies with field stars in the outer disk region are the most relevant limitations to establish the formation history of this overdensity. In this work, we intend to overcome these challenges with a chemodynamical investigation of a larger and updated sample of 31 TriAnd candidate stars, 13 of which are reanalyzed from the sample presented by Sales Silva et al. (2019, 2020), plus 18 new stars observed over the last 3 yr with the same instrumentation as the previous works.
This paper is outlined as follows. Section 2 describes the sample of TriAnd candidate stars studied in this work. Section 3 describes the methodologies and techniques employed to derive orbital and atmospheric parameters, radial velocities, and chemical abundances. The analyses and discussions of the dynamical and chemical properties of our TriAnd candidate stars are described in Section 4. Finally, Section 5 presents a summary with concluding remarks.
2 Data
2.1 Target Selection and Observations
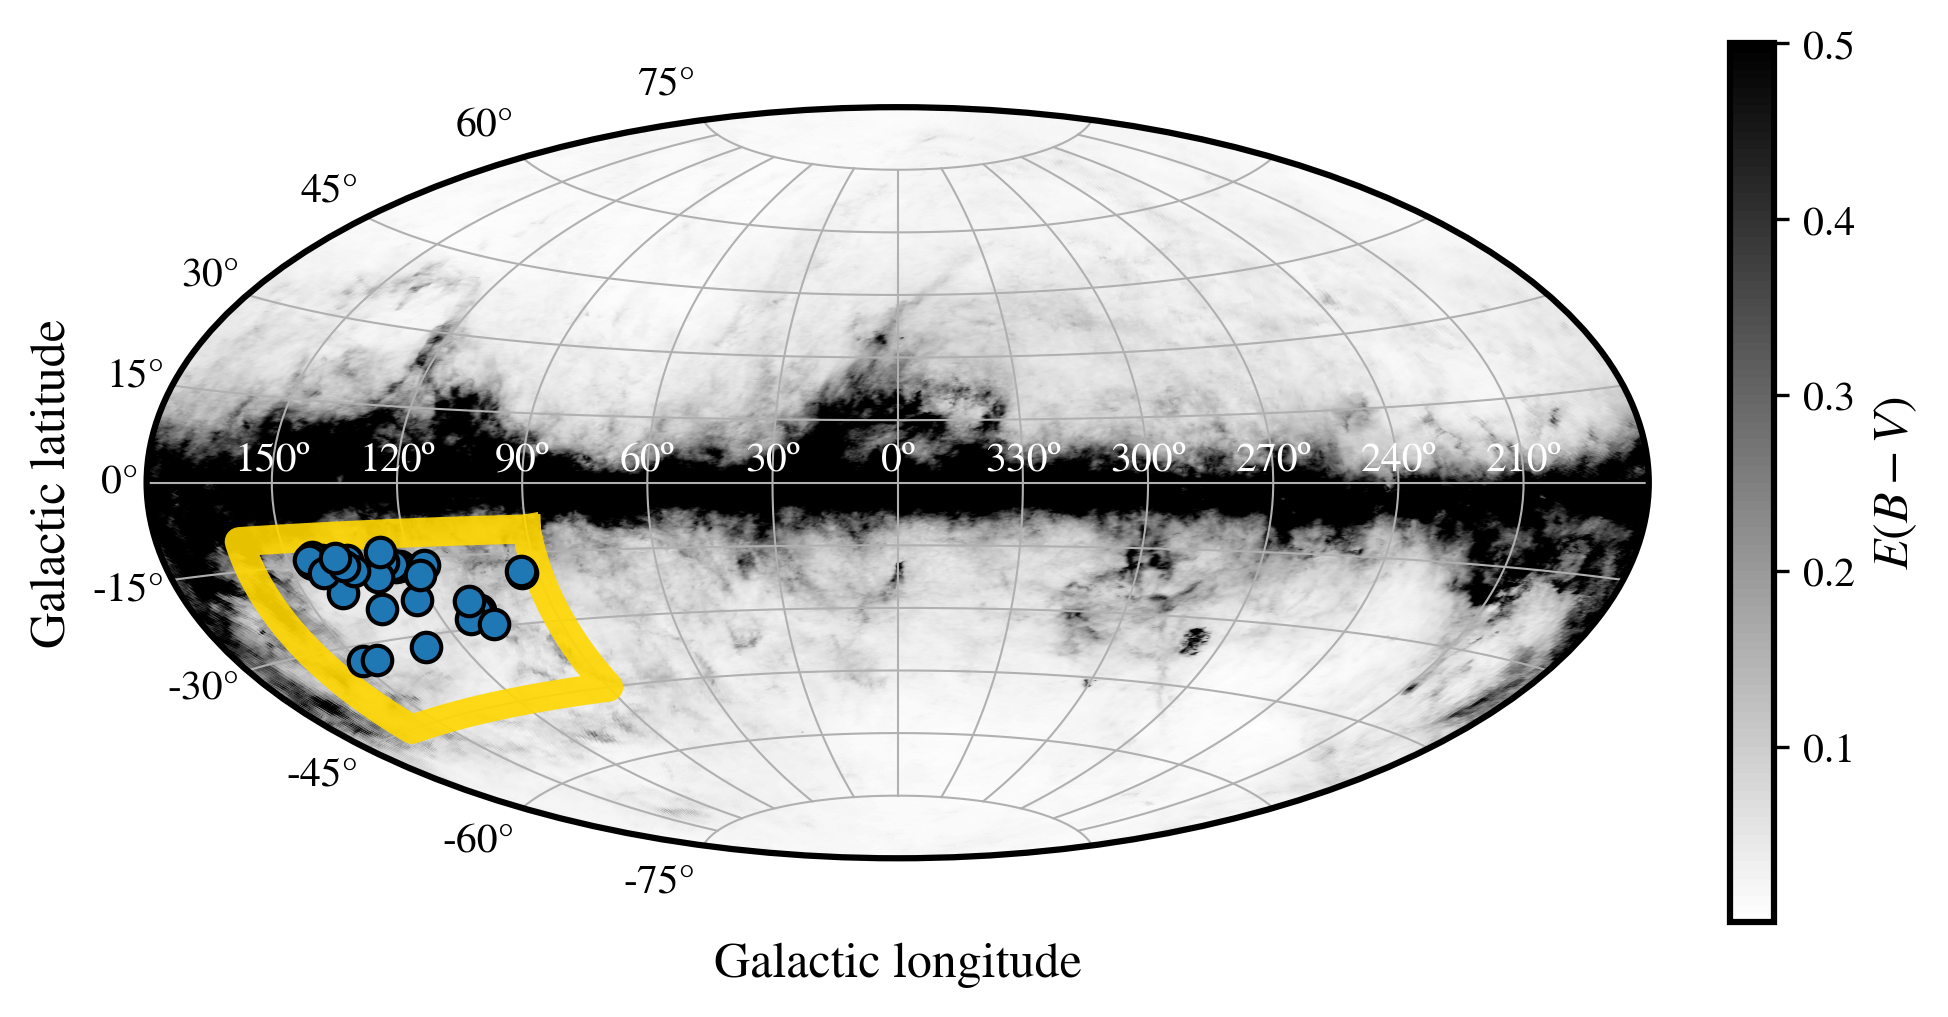
We selected an M-giant star sample using near-infrared photometric data from the 2MASS catalog (Cutri et al., 2003), which was dereddened using the extinction map from Schlegel et al. (1998b) and the extinction laws from Majewski et al. (2003). We adopted the same photometric selection criteria provided by Sales Silva et al. (2019), which efficiently separate M giants from contaminant disk M dwarf stars. This method was successfully used to select distant M giants that led to the discovery, for instance, of Sagittarius tidal tails (Majewski et al., 2003), the mapping of the Monoceros overdensity (Rocha-Pinto et al., 2003), and the discovery of TriAnd (Rocha-Pinto et al., 2004), as well as spectroscopic follow-up by Sheffield et al. (2014), Bergemann et al. (2018), Hayes et al. (2018a), and Sales Silva et al. (2019). The TriAnd candidates were further restricted to the region covering and , which is associated with TriAnd (Rocha-Pinto et al. 2004; Perottoni et al. 2019; Laporte et al. 2022).
As a second criterion, we used data from Gaia DR2 (Gaia Collaboration, 2018) to select reliable candidates of TriAnd in proper-motion space. As identified by Sales Silva et al. (2019), some sparse stars found in the TriAnd region with have characteristics similar to those from the halo population. In order to avoid contamination by halo interlopers in the region associated with the overdensity, we selected our targets inside an ellipsoid delimited by a range around the centroid = mas yr-1 that was estimated with the TriAnd samples of Chou et al. (2011), Sheffield et al. (2014) (which contains stars from Bergemann et al. 2018 and Hayes et al. 2018a samples), and the stars classified as TriAnd members from Sales Silva et al. (2019). In Figure 1, we present the sky projection in Galactic coordinates of TriAnd candidate stars within the region associated with the overdensity (Rocha-Pinto et al., 2004; Perottoni et al., 2019; Laporte et al., 2022).
Our sample consists of 13 TriAnd candidates presented in Sales Silva et al. (2019) and 18 new ones, totaling 31 stars. To ensure homogeneity in the observations, we used the same instruments as in Sales Silva et al. (2019). Namely, we observed the 18 TriAnd candidates with the Gemini Remote Access to CFHT ESPaDOnS Spectrograph (GRACES; Chene et al. 2014), which is connected to the 8.1 m Gemini North telescope on Maunakea in Hawai’i (USA).
All targets were observed in queue mode (GN-2019B-Q-211, GN-2020B-Q-112, GN-2020B-Q-211; PI: Perottoni) in two-fiber (objectsky) configuration with resolution (40,000) in the optical region (Å ). The typical signal-to-noise ratio is pixel-1 at 6000 Å. The individual values are listed in Table 1 with the respective target information and exposure time.
| 2MASS ID | R.A. (deg) | Decl. (deg) | (deg) | (deg) | (mag) | (mag) | (mag) | Exp. (s) | |
|---|---|---|---|---|---|---|---|---|---|
| 23495808+3445569 | 357.4920 | 34.7658 | 108.8627 | -26.4210 | 11.74 | 10.90 | 10.73 | 56.02 | 880 |
| 00534976+4626089 | 13.4573 | 46.4358 | 123.3615 | -16.4339 | 11.91 | 11.03 | 10.87 | 57.52 | 1250 |
| 00594094+4614332 | 14.9206 | 46.2426 | 124.4193 | -16.6054 | 12.20 | 11.38 | 11.18 | 61.95 | 1270 |
| … | … | … | … | … | … | … | … | … | … |
-
•
Only a portion of this table is shown here to demonstrate its form and content. A machine-readable version of the full table is available.
3 Methodology
3.1 Orbital Parameters
The spectrophotoastrometric heliocentric distances for our sample were estimated with the Bayesian isochrone-fitting code StarHorse (Queiroz et al., 2018, 2020) based on our derived atmospheric parameters. StarHorse did not present a solution for the distance estimation of two stars from our sample. These stars were removed from our analysis in Section 4.1.
We calculated the orbits of our star sample with the publicly available Python library AGAMA (Vasiliev, 2019) for 5 Gyr forward. The Galactic potential model employed is described in McMillan (2017). We adopted values for the solar Galactocentric distance (Bland-Hawthorn & Gerhard, 2016), the local circular velocity of km s-1(McMillan, 2017), and the solar motion with respect to the local standard of rest km s-1(Schönrich et al., 2010).
For each star, we performed 1000 Monte Carlo realizations of the orbit according to Gaussian distributions of its uncertainties in distance, proper motion, and radial velocity. The medians of the resulting distributions of the dynamical parameters of interest were taken as our nominal values with 16th and 84th percentiles as associated uncertainties.
3.2 Spectroscopic Analysis
3.2.1 Data reduction
All of the data were reduced with the OPERA pipeline (Martioli et al., 2012), which includes bias subtraction, flat-field correction, and wavelength calibration. The IRAF (Tody, 1986) package was employed for the spectral normalization. Radial velocities were obtained by cross-correlation against synthetic spectra from Munari et al. (2005) using IRAF’s fxcor task.
3.2.2 Atmospheric parameters
To calculate the atmospheric parameters and chemical abundances for our TriAnd candidate stars, we employed the spectrum synthesis code MOOG111http://www.as.utexas.edu/~chris/moog.html (Sneden, 1973; Sobeck et al., 2011) and the (qoyllur-quipu222https://github.com/astroChasqui/q2) Python package (Ramírez et al., 2014). The radial velocities and the results of the estimated atmospheric parameters can be found in Table 2.
| 2MASS ID | (K) | (K) | vt (km s-1) | (km s-1) | RV (km s-1) | (km s-1) | ||
|---|---|---|---|---|---|---|---|---|
| 23495808+3445569 | 3931 | 46 | 1.30 | 0.22 | 1.94 | 0.10 | -21.76 | 0.73 |
| 00534976+4626089 | 3891 | 73 | 1.08 | 0.19 | 1.77 | 0.11 | -211.68 | 0.62 |
| 00594094+4614332 | 4044 | 29 | 0.34 | 0.17 | 1.80 | 0.08 | -131.08 | 0.75 |
| … | … | … | … | … | … | … | … | … |
-
•
Only a portion of this table is shown here to demonstrate its form and content. A machine-readable version of the full table is available.
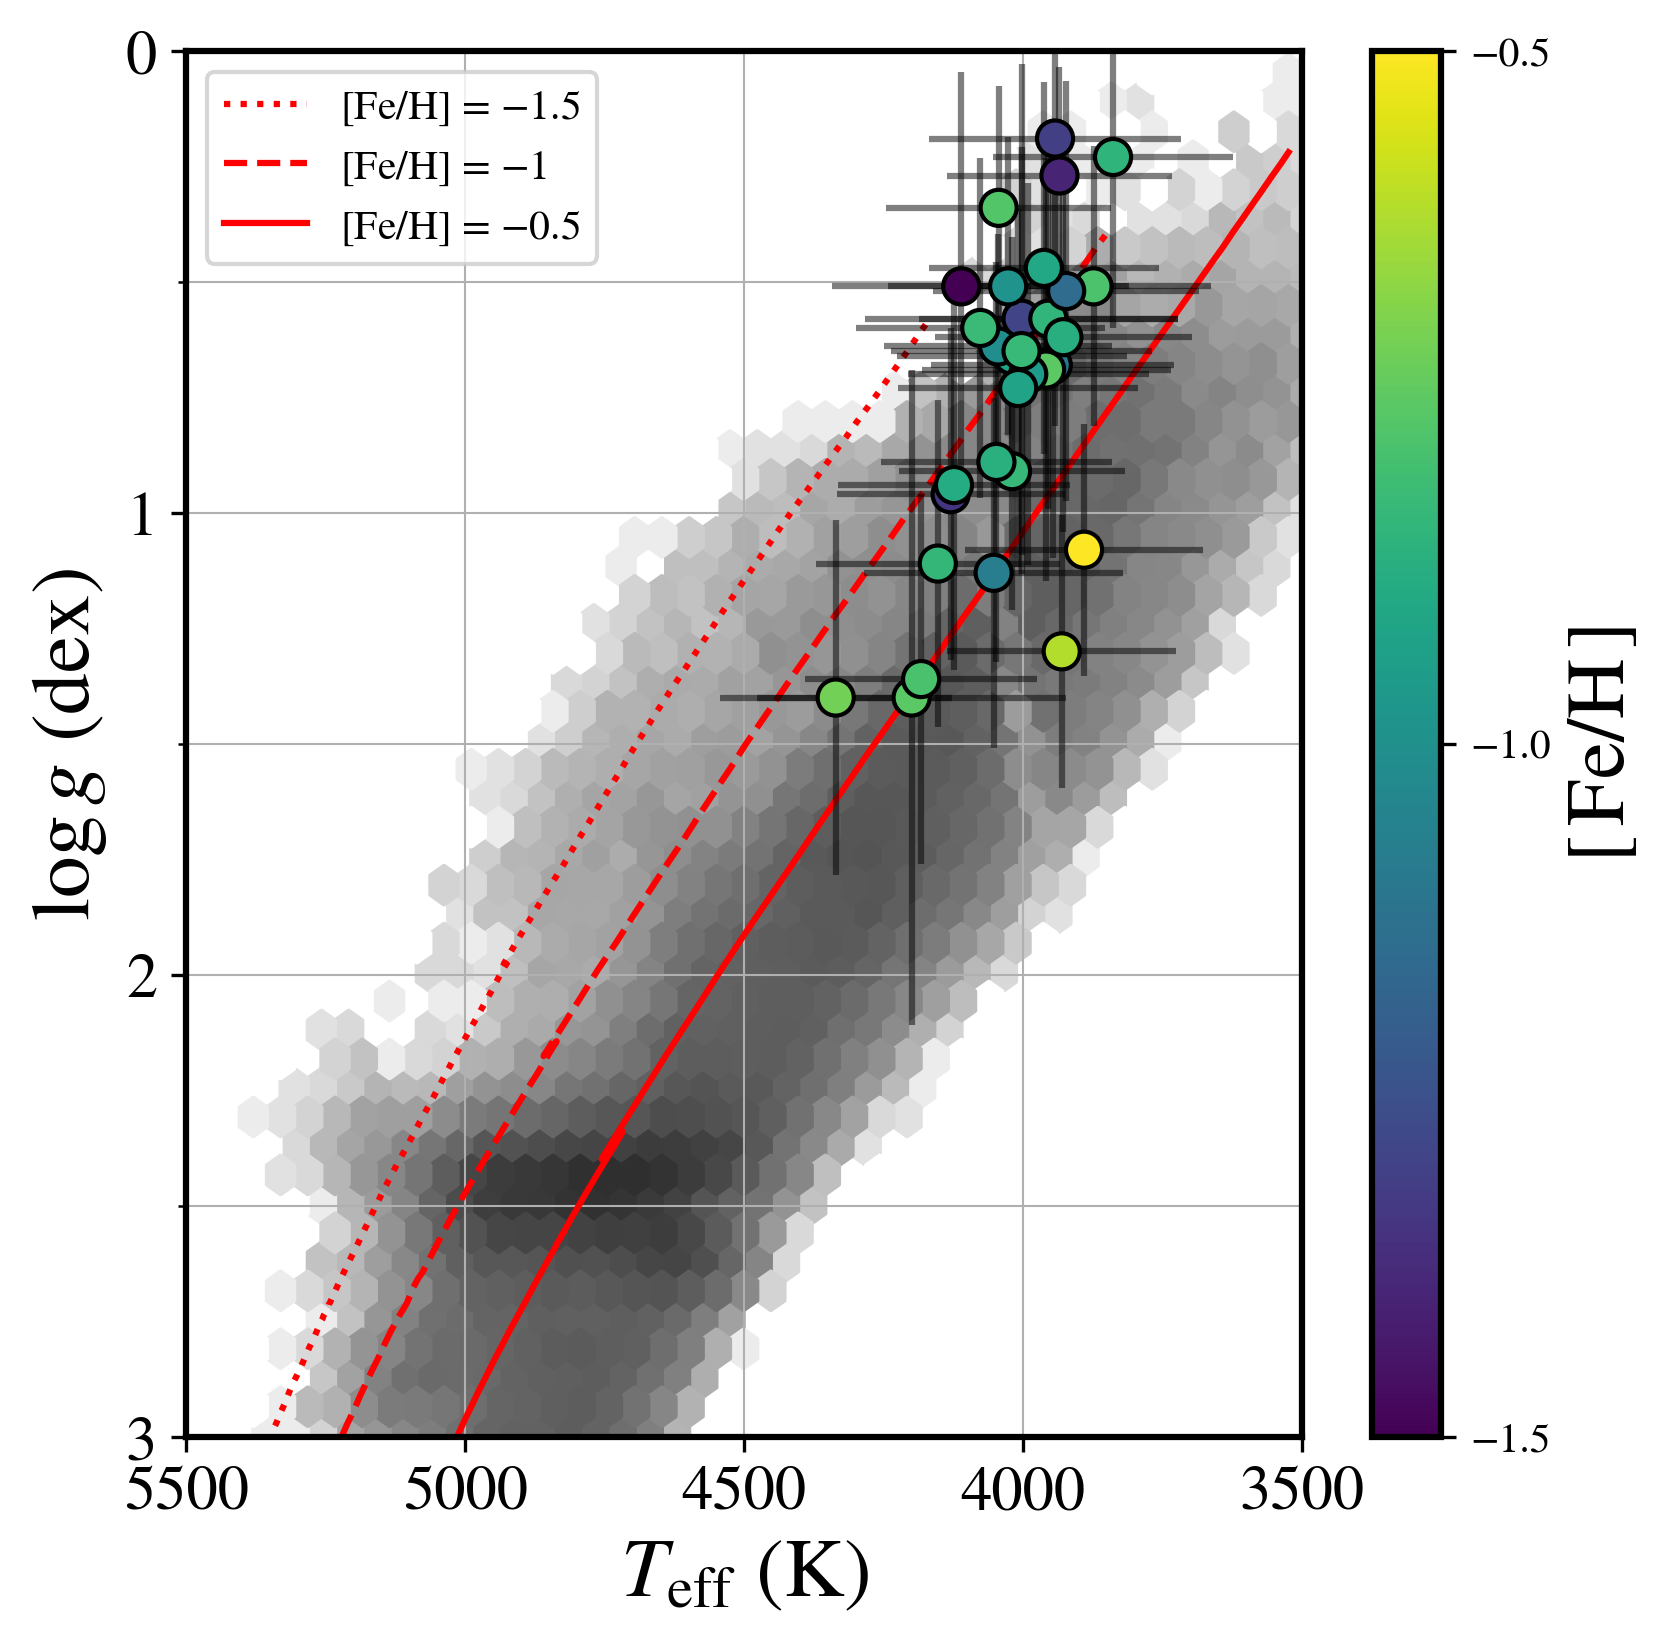
The atmospheric parameters, , , and , where is the microturbulent velocity, is the logarithm of the surface gravity, and is the effective temperature, along with the metallicity, were obtained from the equivalent widths of the Fe lines. The is calculated from the excitation equilibrium and from the ionization equilibrium between the Fe I and Fe II lines. The microturbulent velocity is obtained from the independence between the Fe I abundances and reduced equivalent width. Finally, [Fe/H] is derived from the ionization equilibrium obtained under the local thermodynamic equilibrium (LTE) atmosphere model.
In Figure 2, we show the respective and values for each star in our sample with overlaid isochrones from the Darthmouth Stellar Evolution Database (Dotter et al., 2008). Our obtained atmospheric parameters show that the criteria presented in Section 2 correctly selected M-giant stars. It is worth noting that one common obstacle when working with low- stars in spectroscopy, like M giants, is the presence of molecular bands that can affect the chemical abundance calculations. However, the M-giant stars in our sample are on the upper limit for M-type stars, almost on K-type classification, and the presence of molecular bands is not strong enough to affect the precision of our abundance analyses.
3.2.3 Chemical abundances
We determined the chemical abundances of 11 elements for our stars: Na, Mg, Al, Si, Ca, Ti, Cr, Fe, Ni, Ba, and Eu. We employed the line list presented in Sales Silva et al. (2019), with additional lines from the Southern Stellar Stream Spectroscopic Survey (Ji et al., 2020) and GALactic Archaeology with HERMES (GALAH; Buder et al. 2021) survey, due to the low number of nonblended absorption lines in Mg, Si, Ca, and Na. The line list with the respective measured equivalent widths can be found in Table 3.
| 2MASS ID | |||||||
|---|---|---|---|---|---|---|---|
| Wavelength (Å) | Element | EP (eV) | 23495808+3445569 | 00534976+4626089 | 00594094+4614332 | … | |
| 5682.63 | Na I | 2.1 | 127.2 | 149.1 | - | … | |
| 5688.2 | Na I | 2.1 | 133.5 | 149 | - | … | |
| 6154.22 | Na I | 2.1 | 54.6 | 91.4 | 71.1 | … | |
| … | … | … | … | … | … | … | … |
-
•
EP - excitation potential; - transition probability.
-
•
Only a portion of this table is shown here to demonstrate its form and content. A machine-readable version of the full table is available.
The equivalent widths of the absorption lines in the analyzed spectra were measured with IRAF’s splot task corresponding to each element measured star-by-star on a line-by-line basis. These equivalent widths were then utilized to derive the chemical abundances with MOOG wrapped by the code. As the resulting abundances are given in absolute values, we employed Grevesse et al. (2007) solar values to calculate the corresponding abundances in reference to the Sun. All of the calculations were done assuming LTE with ODFNEW (Castelli & Kurucz, 2003) atmosphere models.
Due to the hyperfine structure and contribution of different isotopes for the neutron-capture elements Ba (lines 5853, 6141, and 6496 Å) and Eu (line 6645 Å), we employed the spectral synthesis method for these elements instead, also with MOOG (Sneden et al., 2008). The results of the derived abundances can be found in Table 4.
| 2MASS ID | [Fe/H]LTE | [Fe/H]NLTE | [Na/H]LTE | [Mg/H]LTE | [Mg/H]NLTE | … | |||
|---|---|---|---|---|---|---|---|---|---|
| 23495808+3445569 | 0.08 | 0.08 | 0.06 | … | |||||
| 00534976+4626089 | 0.10 | 0.10 | 0.08 | … | |||||
| 00594094+4614332 | 0.05 | 0.04 | 0.09 | … | |||||
| … | … | … | … | … | … | … | … | … | … |
-
•
Only a portion of this table is shown here to demonstrate its form and content. A machine-readable version of the full table is available.
As discussed in Ramírez et al. (2014), the errors related to the stellar parameters calculated by the code consider the relationship between the parameters fulfilling the equilibrium conditions as described by Epstein et al. (2010) and Bensby et al. (2014). For , the formal error is computed by propagating the errors from the other atmospheric parameters by adding them in quadrature and including the standard error of the mean line-to-line [Fe/H] abundance. For the other chemical abundances, the errors are calculated taking into account both the estimated observed errors, given by the standard deviation from the mean abundance calculated for each set of measured lines, and the error introduced by each atmospheric parameter. The radial velocity errors employing IRAF’s fxcor task are computed based on the fitted peak height and the antisymmetric noise, as described in Tonry & Davis (1979).
The radial velocities and metallicity () calculated for our sample have a typical uncertainty of 0.91 km s-1and 0.11 dex, respectively. The total error budget for the atmospheric parameters was derived by adding in quadrature the statistical errors calculated by the code with adopted systematic errors of K and . The average uncertainty for each atmospheric parameter is as follows: , 216 K; , 0.39 dex; and , 0.19 km s-1.
The derived chemical abundances for our sample with the equivalent-width method have a typical uncertainty of 0.14 dex. The average uncertainty for each element is as follows: Na I, 0.16 dex; Mg I, 0.11 dex; Al I, 0.10 dex; Si I, 0.15 dex; Ca I, 0.17 dex; Ti I, 0.18 dex; Cr I, 0.17 dex; Ni I, 0.11 dex.
To account for possible departures from LTE for our derived abundances, we performed NLTE corrections for our sample using spectral models from https://nlte.mpia.de. Based on the studies from Mashonkina et al. (2007), Bergemann & Cescutti (2010), and Bergemann et al. (2012, 2013, 2017), we applied NLTE corrections for Fe, Mg, Ca, Cr, and Si, correcting our derived LTE abundances line by line. We explored NLTE corrections for Ti, but, as observed by Bergemann et al. (2018), NLTE models for Ti do not give consistent solutions with one-dimensional hydrostatic models (Bergemann, 2011). The average NLTE departure for each element is as follows: Mg I, dex; Si I, dex; Ca I, dex; Cr I, dex; Fe I, dex. The corresponding NLTE-corrected value of each element described can be found in Table 4.
4 Discussions
4.1 Orbital Parameters
The history of spectroscopic studies of TriAnd has been controversial since its discovery, with completely opposite results appearing in the literature; Chou et al. (2011) originally argued for an extragalactic origin for the overdensity, but Bergemann et al. (2018) and Hayes et al. (2018a) suggested an in situ nature. With the help of the Gaia mission (Gaia Collaboration et al., 2016), we can now complement the spectroscopic results with the kinematic/dynamical counterpart, allowing us to better understand the complexity of this overdensity.
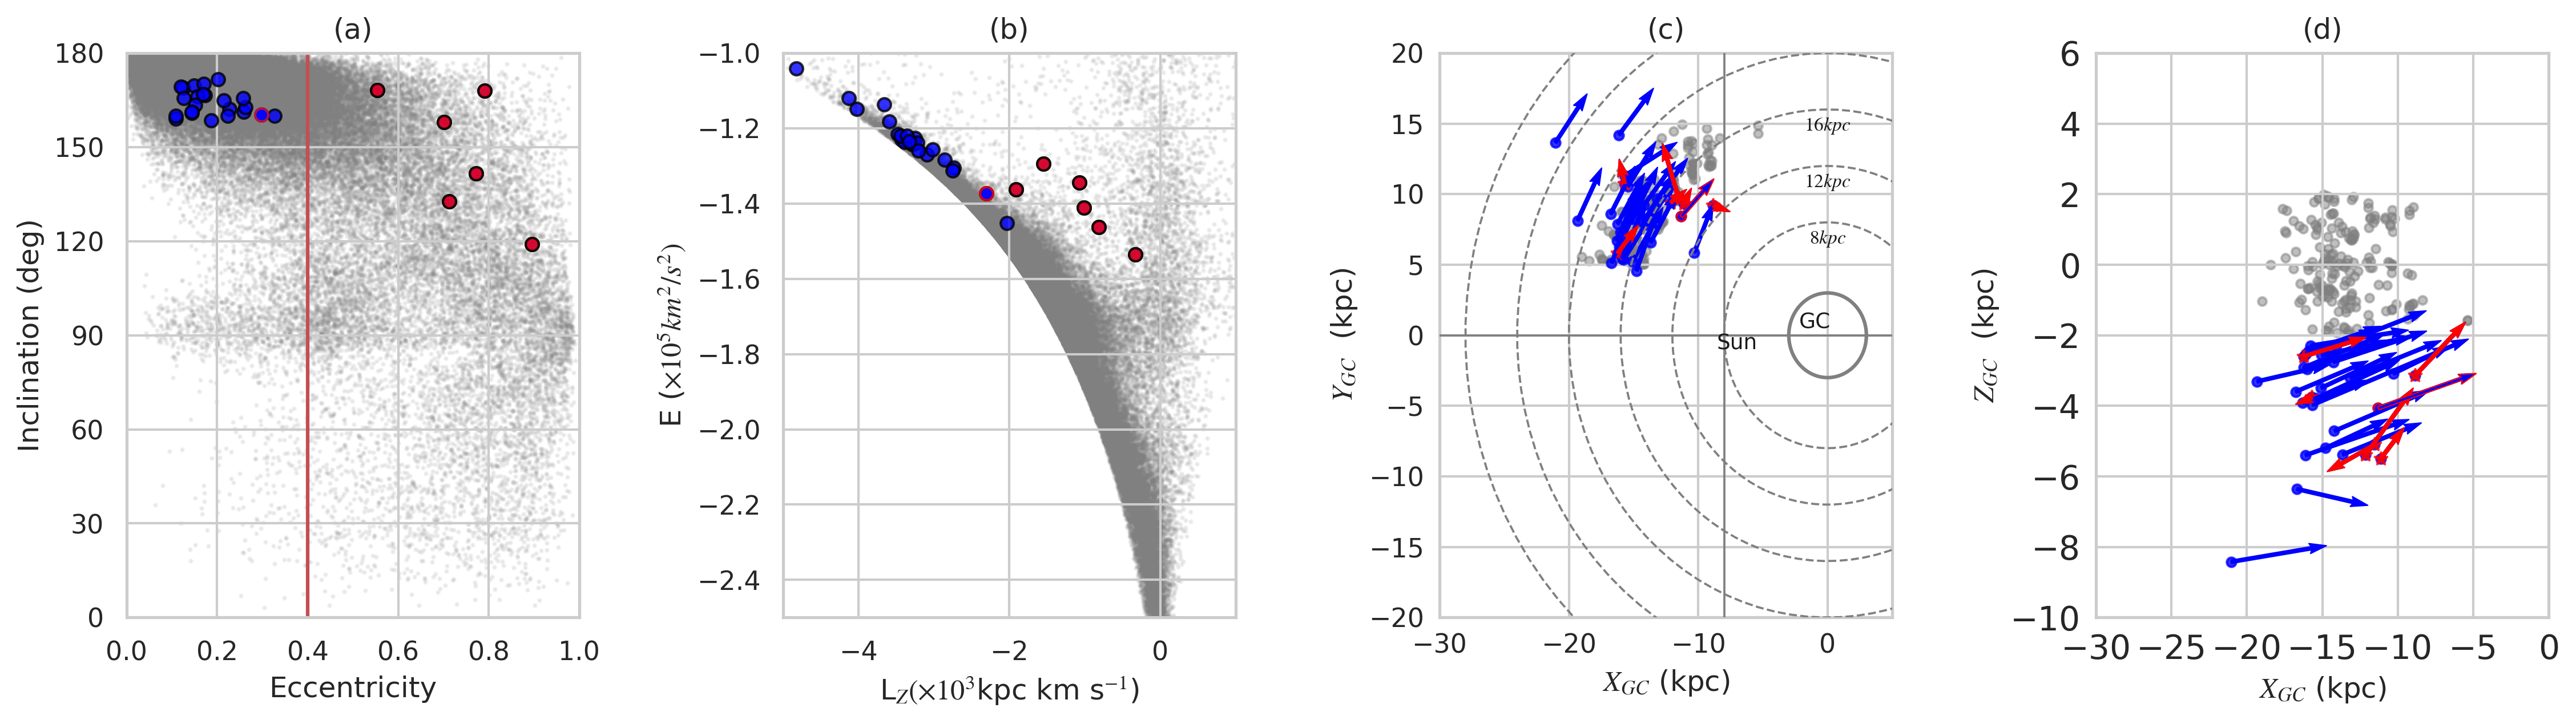
The orbital parameters of the stars studied in this work, as well as their spatial projections and velocity vectors, are shown in Figure 3. In panel (a), we present the orbital eccentricity vs. inclination333inclination = , where is the total angular momentum. We notice that most of our stars exhibit low eccentricity, which is characteristic of the Galactic disk(s) (Freeman & Bland-Hawthorn, 2002; van der Kruit & Freeman, 2011; Bland-Hawthorn & Gerhard, 2016). We classify those stars as representative of TriAnd, which will be represented in blue for the remainder of this paper. We also included, as gray circles, stars from the APOGEE DR17 database (Abdurro’uf et al., 2022) for comparison but cleaned of globular cluster and dwarf galaxy stars following Limberg et al. (2022).
A contamination of high-eccentricity stars in our sample was also detected. Stars on highly eccentric orbits are typically associated with either the in situ (Di Matteo et al., 2019; Gallart et al., 2019; Belokurov et al., 2020; Bonaca et al., 2020) or accreted (Koppelman et al., 2018; Mackereth et al., 2019; Naidu et al., 2020; Limberg et al., 2021a; Myeong et al., 2022) halo. As will be discussed in Section 4.3, these probable halo interlopers also have chemical abundance patterns typical of halo populations (Nissen & Schuster, 2010, 2011; Hayes et al., 2018b).
In order to select the above-described high-eccentricity contamination, we applied a cut in eccentricity to our sample (), represented in red throughout this work. This selection classified six stars from our sample (red circles) as possible contamination of ex situ stars at the same distance and location as TriAnd.
Figure 3(b), total orbital energy () versus the -component of the angular momentum (), often employed to characterize MW dynamical groups (e.g., Helmi & White 1999; Chiba & Beers 2000; Gómez et al. 2010; Helmi et al. 2018; Myeong et al. 2018), reinforces that part of those stars are possibly accreted because they have smaller compared to the TriAnd/disk ones (blue circles/gray dots) at the same , a typical characteristic of accreted populations (e.g., Naidu et al. 2020). On the other hand, TriAnd candidates present and overlapping with the region of the plot occupied by the outer disk, indicating a common in situ origin.
In Figure 3(c) and (d), we show the vs. and vs. projections, respectively. We observe that the velocity vectors from the majority of the sample, in blue, show a corotation with the Galactic disk. However, the red vectors, representing the accreted candidates in our sample, appear to be randomly distributed and do not follow the direction of the Galactic disk, as expected for ex situ populations. Our analysis indicates that the majority of the TriAnd members present in situ-like orbits, in agreement with other works from the literature (Bergemann et al., 2018; Hayes et al., 2018a).
4.2 Metallicity Distribution Function
In order to understand the metallicity distribution function (MDF) of the TriAnd population, we analyzed and compared the derived from this work with other recent spectroscopic analyses. The stars classified as TriAnd in our sample have a mean metallicity of dex, a similar value to that found by the Hayes et al. (2018a) and Sales Silva et al. (2019) samples but more metal-poor than the Bergemann et al. (2018) sample. The MDFs for different TriAnd samples are shown in Figure 4.
This mean metallicity value indicates that, on average, our TriAnd candidates are a more metal-poor stellar population than our selected APOGEE outer disk sample. We speculate that the TriAnd population was probably dynamically heated before enriching, maintaining a lower mean metallicity. In this scenario, the younger stellar populations were not dynamically heated enough to reach a similar to TriAnd, thus explaining the lower mean metallicity in comparison to the outer disk.
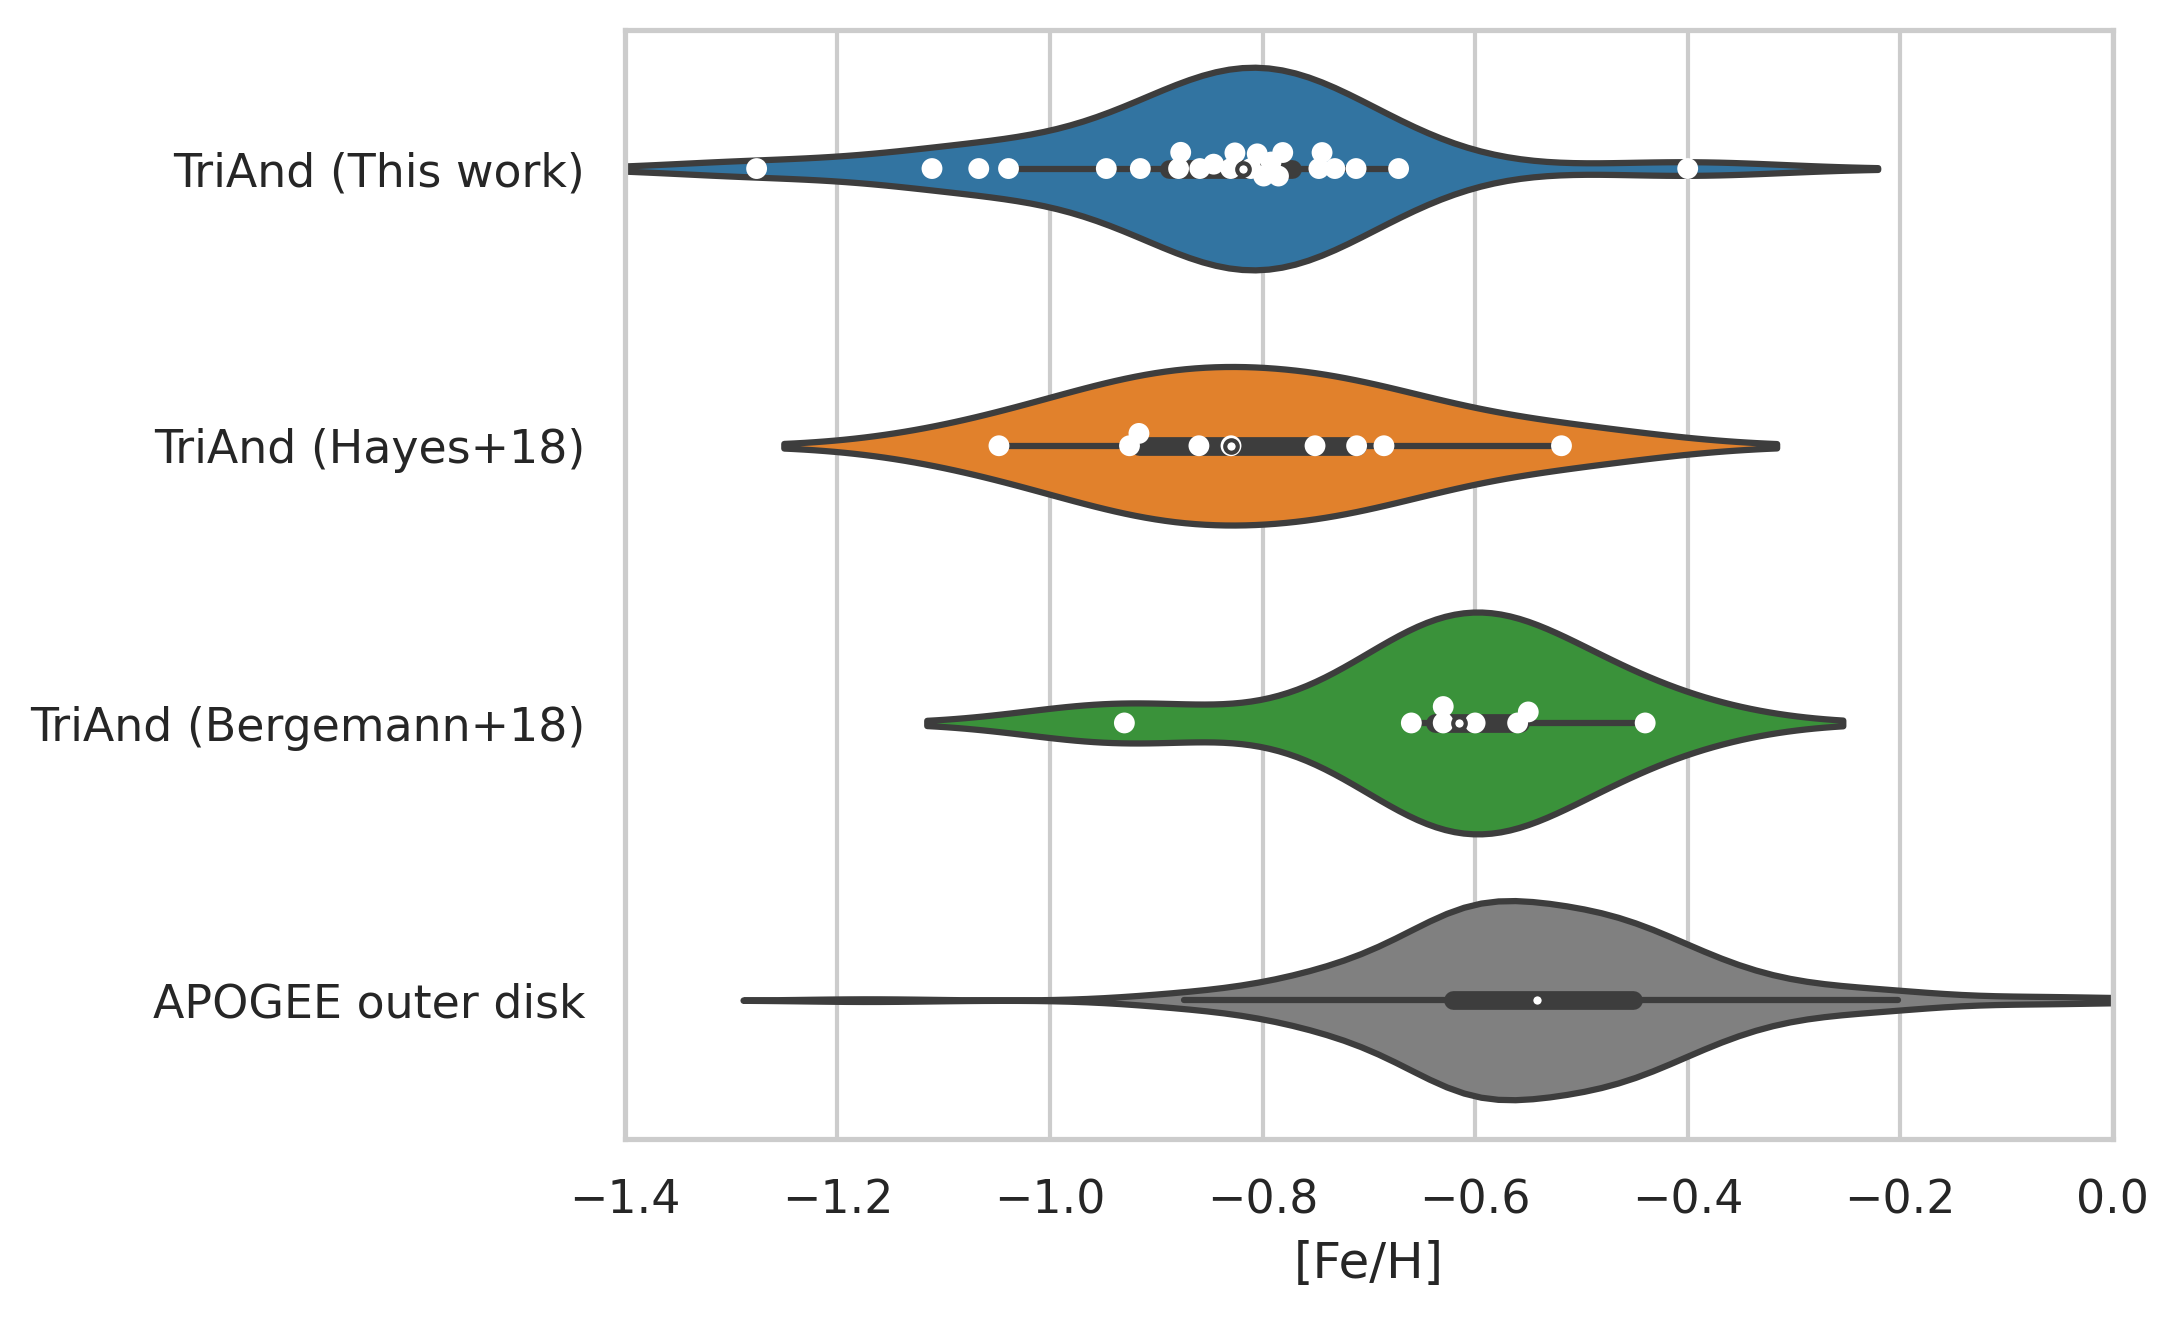
As we can see from Figure 4, the Bergemann et al. (2018) sample stands out with a higher mean metallicity population when compared to other derived TriAnd samples, with an offset of dex from our sample. We checked if this feature could be attributed to different sample distances, where stars with a lesser are expected to be more metal-rich. TriAnd candidates from our sample are distributed in the range kpc, whereas most of our stars are found in the range kpc. The Bergemann et al. (2018) sample is found at a similar distance ( kpc), excluding this alternative.
We suggest that one of the most plausible explanations for this difference in metallicity found in Bergemann et al. (2018) is the method employed by the authors to estimate the atmospheric parameters for their sample, where was estimated by combining the infrared flux method with photometric data from the AAVSO Photometric All-Sky Survey and 2MASS. The use of photometry combined with spectroscopy can lead to an overall higher derived value for when compared to a purely spectroscopic analysis. The use of NLTE models by Bergemann et al. (2018) is another possible explanation behind the differences, as both this work and Hayes et al. (2018a) employ LTE models.
4.3 Chemical abundances
As we can note from Section 4.1, the analysis of the orbital parameters of our TriAnd candidates indicates that they display characteristics of a mixture between in situ and accreted stars. With the benefit of chemical analysis, we expect that a more holistic chemodynamical approach can enlighten our understanding of the nature of TriAnd.
Throughout this section, APOGEE DR17 data are utilized for the comparison between our derived TriAnd abundances and MW’s accreted and in situ, in particular the outer disk, populations. To select outer disk stars, we employed the following criteria: , , and . These criteria are more conservative than those applied by Hayes et al. (2018a) for APOGEE DR14 (Abolfathi et al., 2018) and hence more representative of the outer disk population. To check if TriAnd shares a chemical composition with accreted objects, we use the chemodynamical criteria from Limberg et al. (2022), which were constructed for APOGEE-available abundances and designed to yield minimal contamination from in situ stars, to select Gaia-Sausage/Enceladus (GSE; Belokurov et al. 2018; Haywood et al. 2018, also Helmi et al. 2018) members.
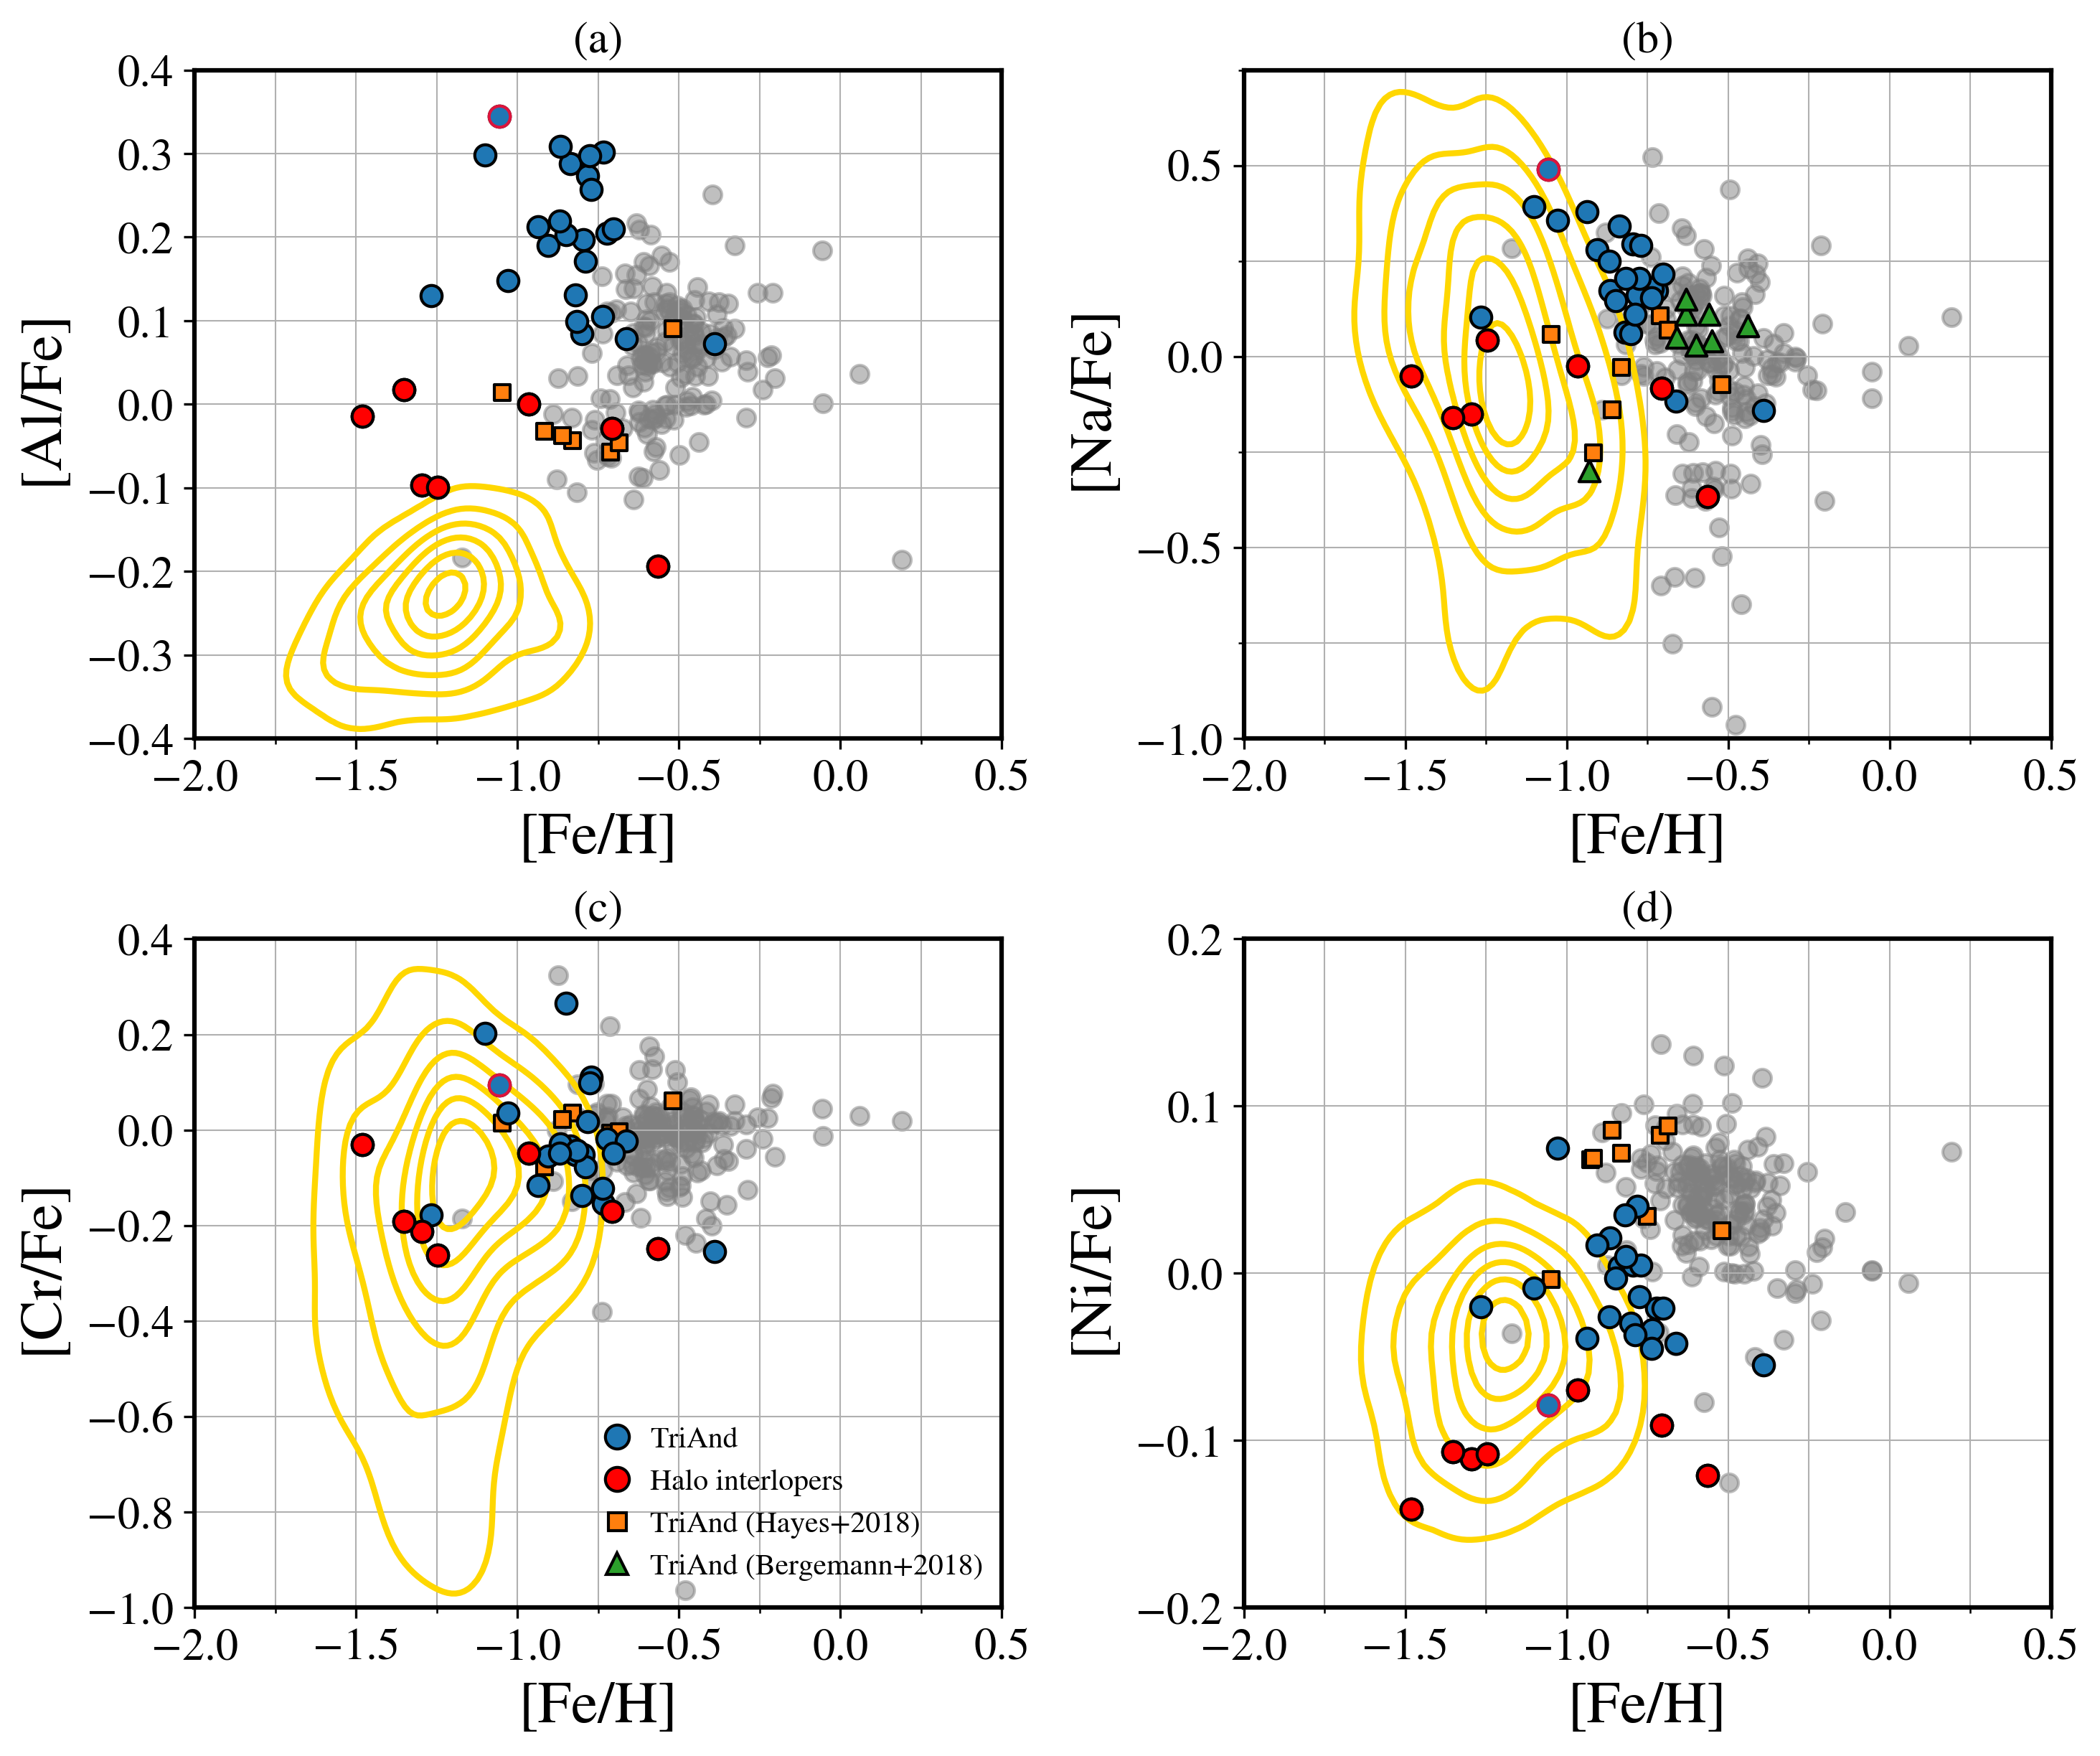
In Figures 5 and 6, we show the estimated abundances for (Mg, Si, Ca, and Ti), odd- (Al and Na), and iron-peak (Cr and Ni) elements for our TriAnd sample. For comparison, we also show the results from other TriAnd spectroscopic studies, namely, Bergemann et al. (2018) and Hayes et al. (2018a), as well as the aforementioned APOGEE outer disk sample. For consistency with APOGEE DR17, we choose to represent the NLTE-corrected values only for Mg and Ca abundances.
The abundances of Na, Al, Si, Ti, and Cr are not included in Hayes et al.’s (2018a) analysis. Since the authors used APOGEE data, we cross-matched their sample with APOGEE DR17 to obtain the missing chemical abundances and update the Mg, Ca, and Ni values. In addition, Bergemann et al. (2018) did not analyze the abundance of Al, Si, Ca, Cr, or Ni. Therefore, they are not included in our comparison. For our interpretations, we also consider the classification into either in situ or accreted origin from the eccentricity selection presented in Section 4.1 and verify if chemical abundances confirm (or reject) our initial conjecture that a mixture of populations can be found at TriAnd’s location.
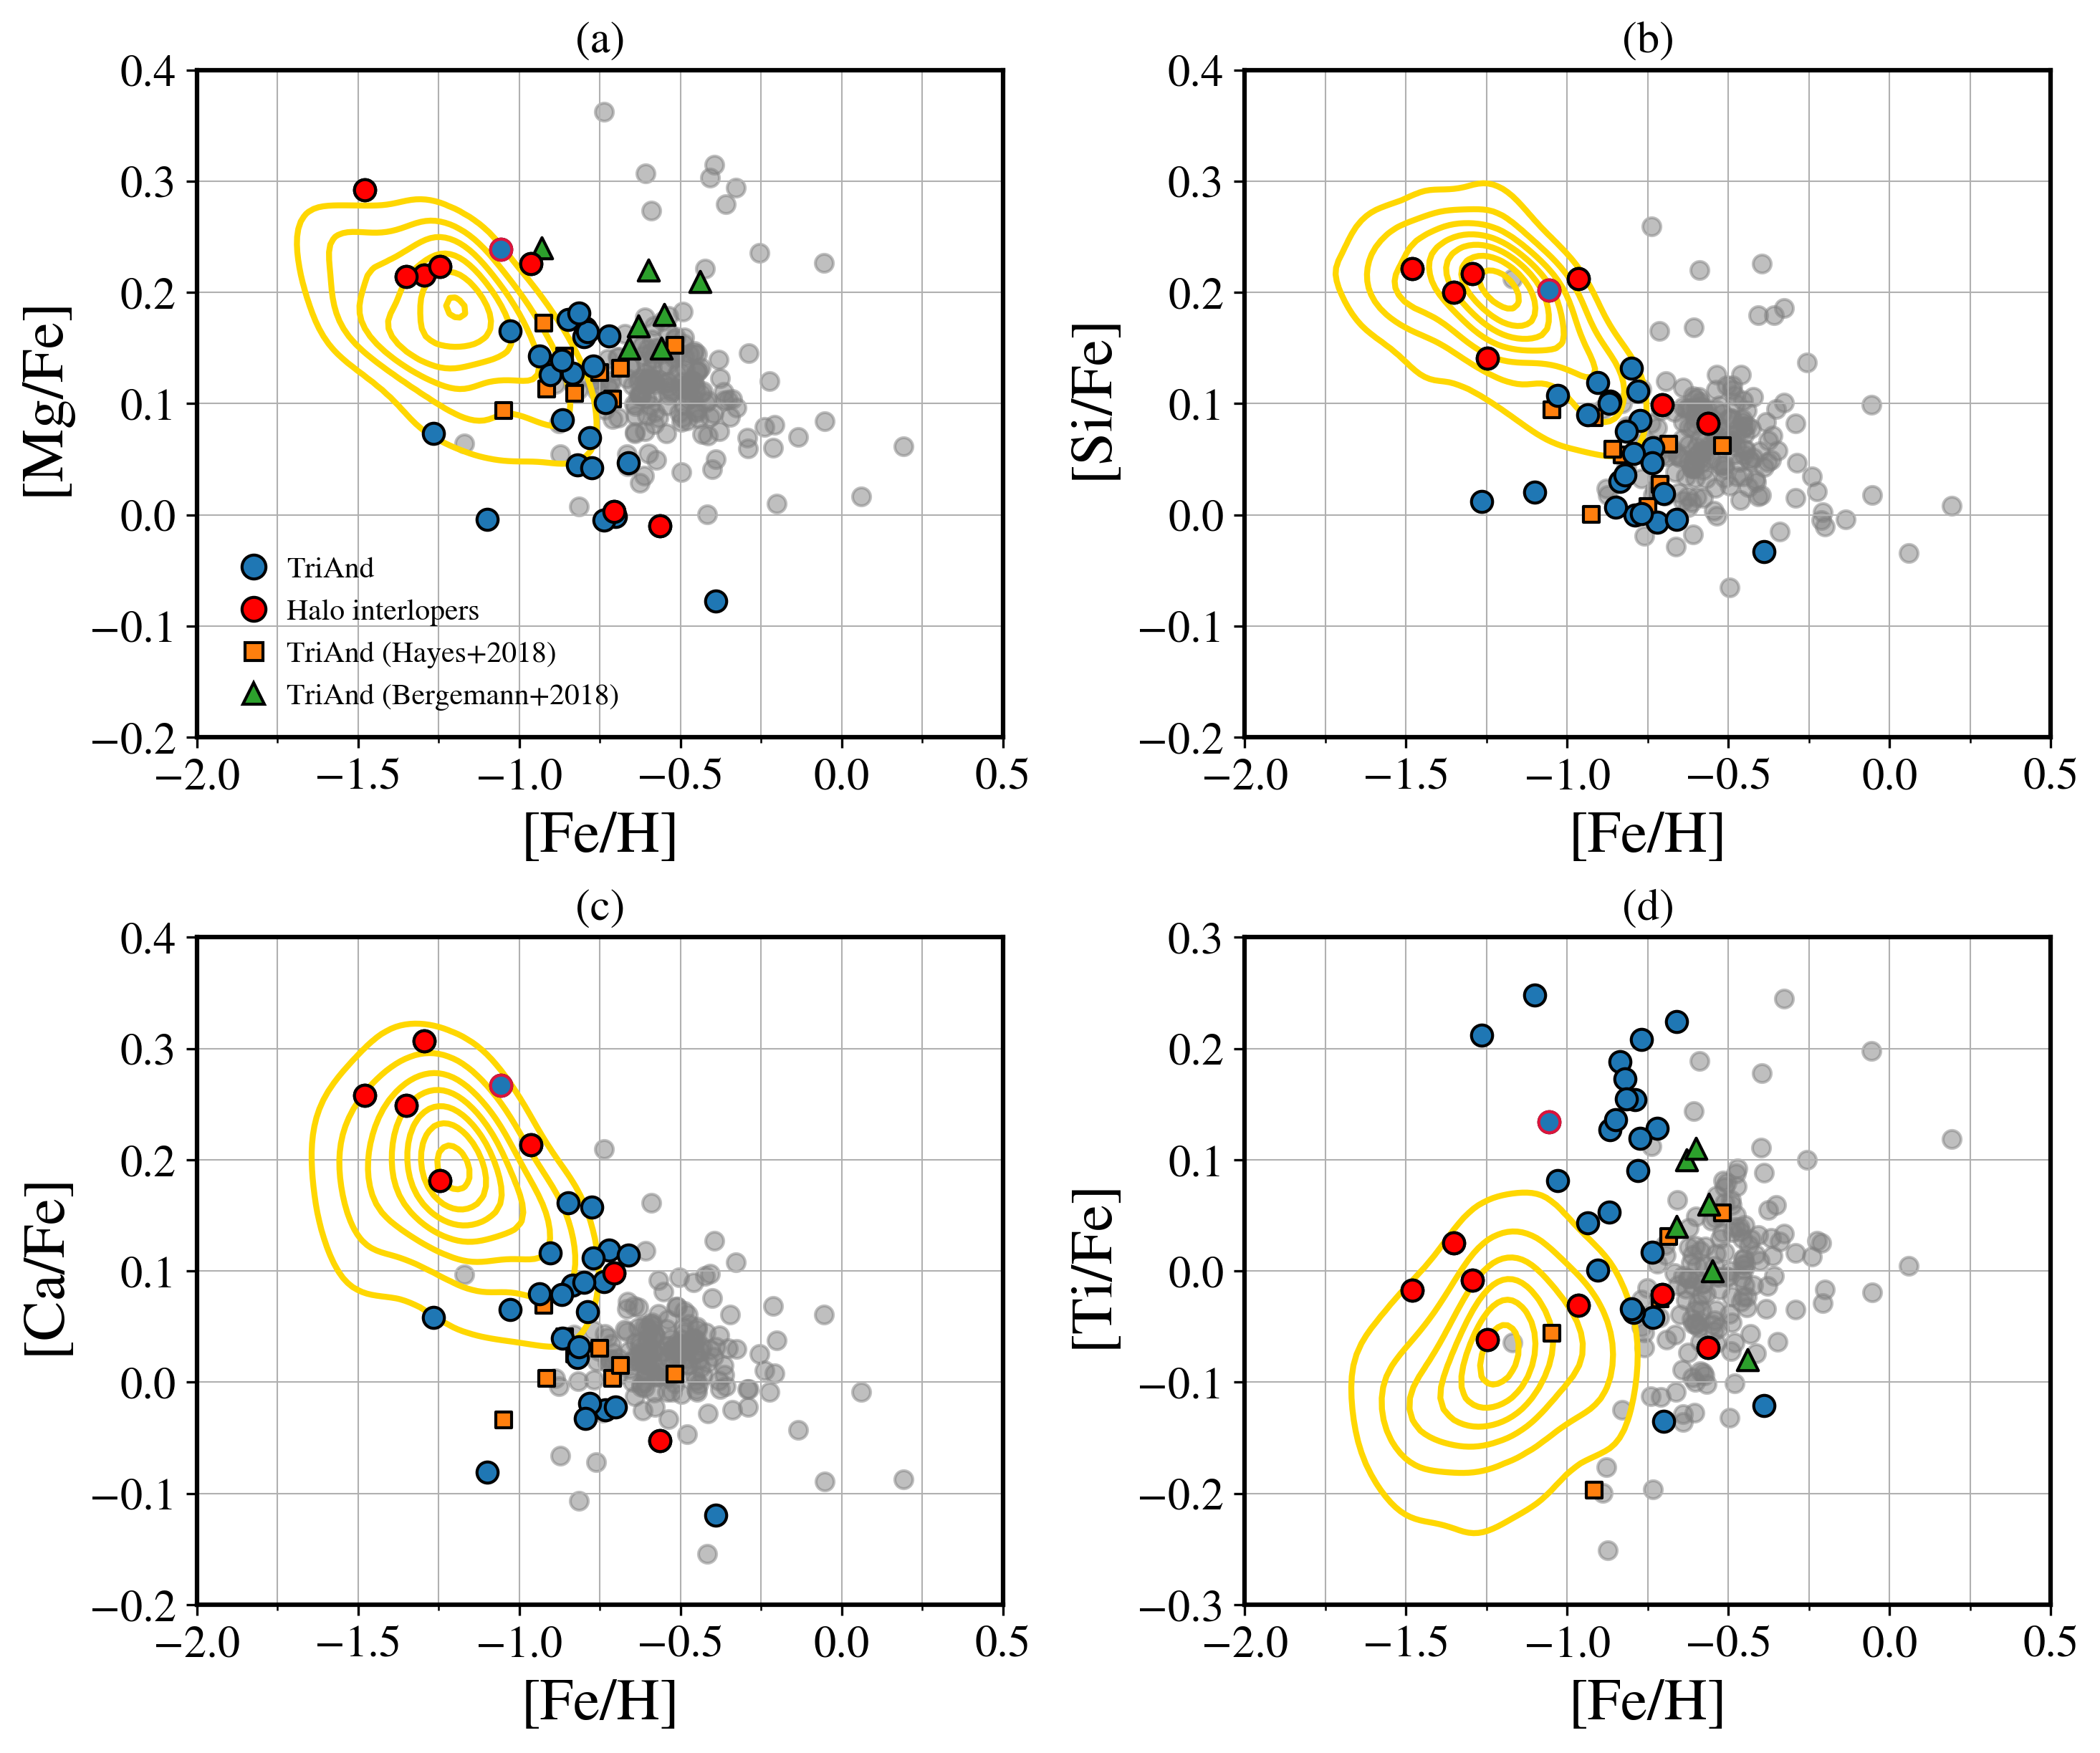
4.3.1 elements
The elements (Mg, Si, Ca, and Ti) are mainly formed in explosive events such as Type II supernovae (SNe II) in high-mass stars (Woosley & Weaver, 1995). These events occur on a shorter timescale (Myr) when compared to other enrichment sources such as Type Ia supernovae (SNe Ia; Gyr), formed by merging white dwarf binaries, which are the main source for the iron-peak elements (Cr, Ni, and Fe; Iwamoto et al. 1999). Therefore, the [/Fe] vs. [Fe/H] relation of a stellar population provides useful information about the relative contribution of SNe II and Ia to the interstellar medium where these stars were formed (Matteucci & Brocato, 1990).
In Figure 5, we can see that the stars kinematically classified as part of TriAnd follow a behavior expected for in situ stars. The [/Fe] ratio for this TriAnd population is similar to the APOGEE outer disk sample as well as the Bergemann et al. (2018) and Hayes et al. (2018a) TriAnd samples. This behavior can be better appreciated in the chemical abundances of Mg, Si, and Ca, even with an overall low metallicity that sometimes overlaps with the GSE footprint.
The stars classified as likely having an accreted origin fall on top of the contours associated with GSE, showing a higher [/Fe] ratio ( dex) when compared to the thin-disk population. If we look at our full sample, ignoring the eccentricity selection, a “knee” pattern can be identified in the relation between the [/Fe] ratio and [Fe/H], as suggested in the literature (Sales Silva et al., 2020).
One star, also studied by Chou et al. (2011), stands out in our sample. Represented by a blue circle outlined in red in Figures 3, 5, 6, and 7, this star is not marked as being accreted when taking into account the eccentricity selection method employed, while showing an accreted chemical pattern. As we can observe for this star in particular, these apparent ex situ chemical characteristics from the Chou et al. (2011) sample could have led the authors to suggest an accreted origin for TriAnd. Given that this star is located at = 14 kpc and based on its chemistry, we speculate that it belongs to the thick/splashed disk population.
4.3.2 Odd- and Iron-peak Elements
In Figure 6, we show the odd- (Al and Na) and iron-peak (Cr and Ni) elements. Odd-, as for the elements, are majorly synthesized by the evolution of massive stars but by different nucleosynthesis processes, often present in the red giant branch and asymptotic giant branch (AGB) phases of stellar evolution (Herwig, 2005; Ventura et al., 2011; Depalo & LUNA Collaboration, 2016). These different processes are reflected in the stellar population of the MW, where a clear difference between the abundances of odd- and elements can be observed (Zasowski et al., 2019).
In the top panels of Figure 6, we show the abundances for Al and Na. In the APOGEE field samples, we can observe the difference in the distribution of Al and Na in the stellar populations of the Galaxy. The chemical profiles of [Al/Fe] (top left) shows a clear distinction between the APOGEE outer disk sample (gray) and the isodensity contours associated with GSE (yellow), while the [Na/Fe] chemical profiles show a higher dispersion with substantial overlap between both field populations.
The distinction mentioned between the APOGEE field samples (outer disk vs. GSE) can be observed for our TriAnd candidates in the [Al/Fe] ratio. Although an apparent offset between our derived abundances and the APOGEE ones is present, it is possible to observe a clear difference in the [Al/Fe] vs. [Fe/H] relation between the stars with in situ characteristics and the high-eccentricity (likely accreted) ones. This offset has already been mentioned in the literature (e.g., Griffith et al. 2019) when comparing chemical abundance data for the odd- elements in the APOGEE database with the GALAH database.
The [Na/Fe] presented in Figure 6 for the TriAnd stars presents a dispersion ( dex) very similar to the chemical profiles observed by Bergemann et al. (2018), reinforcing the in situ characteristics of the TriAnd population. On the other hand, the suggested accreted stars from our sample occupy the same region as the contours associated with GSE and present a higher overall dispersion in [Na/Fe] and metallicity than the TriAnd stars.
As already mentioned, SNe Ia formed by low-mass stars are the main sources of interstellar medium enrichment for the iron-peak elements. The MW in situ populations are expected to present chemical characteristics linked to an extended star-formation history, where the interstellar medium enrichment lasts for long time periods (1 Gyr; Matteucci & Francois 1989). Galaxies with extended star formation histories have higher [Ni/Fe] and [Cr/Fe] abundances (Kirby et al., 2019; Larsen et al., 2022).
The chemical profiles from iron-peak elements of our sample can be observed in the bottom panels of Figure 6. The TriAnd stars follow the same profile as the outer disk population, showing a small dispersion, as can be seen in the APOGEE data (Hayes et al., 2018a).
The [Cr/Fe] (bottom left panel of Figure 6) shows only a minor overlap with stars from our TriAnd sample with the GSE contours, at the edge of the distribution. On the other hand, the accreted selection essentially overlaps the GSE position.
In the bottom right panel of Figure 6, the [Ni/Fe] presents a clear distinction between the APOGEE outer disk sample and the GSE contours, with no overlap between these samples. The TriAnd stars and stars with a suggested accreted origin in our sample also present very distinct characteristics. This behavior reinforces the scenario where the TriAnd region is formed by a majority of in situ stars and a small contribution of ex situ interlopers.
4.3.3 Neutron-capture elements
For elements heavier than Fe (atomic number ), nucleosynthesis typically takes place via neutron-capture processes. We can distinguish two major processes: the “slow” (-process) and “rapid” (-process) neutron-capture processes (see Sneden et al. 2008 for a review).
The traditional main -process produces elements from Sr () to Pb () majorly in the H-rich intershell of low-mass AGB stars (Busso et al., 1999; Herwig, 2005; Karakas & Lattanzio, 2014). For the occurrence of -process nucleosynthesis, highly energetic events are expected, such as binary compact mergers (Lattimer & Schramm, 1974; Rosswog et al., 1999; Wanajo et al., 2009; Drout et al., 2017; Thielemann et al., 2017, 2020; Cowan et al., 2021) and/or magnetorotational supernovae (Winteler et al., 2012; Mösta et al., 2014; Reichert et al., 2021), synthesizing heavy elements with two major peaks around Xe () and Pt ().
In Figure 7, the abundances of Ba and Eu are presented, elements representative of the - and -processes, respectively, within the metallicity range considered (). For comparison with our TriAnd sample, we obtained data from the Stellar Abundances for Galactic Archaeology (SAGA) database (Suda et al., 2008, 2017), shown as gray dots, since the APOGEE DR17 database does not contain Ba and Eu abundances. We could not apply the same outer disk selection as presented in Figures 5 and 6 as the stars from the SAGA database do not reach large . Therefore, we display all data for Ba and Eu for MW stars contained in this database, excluding upper limits. We also display isodensity contours representing the thin () and thick () disks (Li et al., 2018; Mackereth et al., 2019; Beraldo e Silva et al., 2021; Myeong et al., 2022; Queiroz et al., 2023) in purple and coral, respectively.
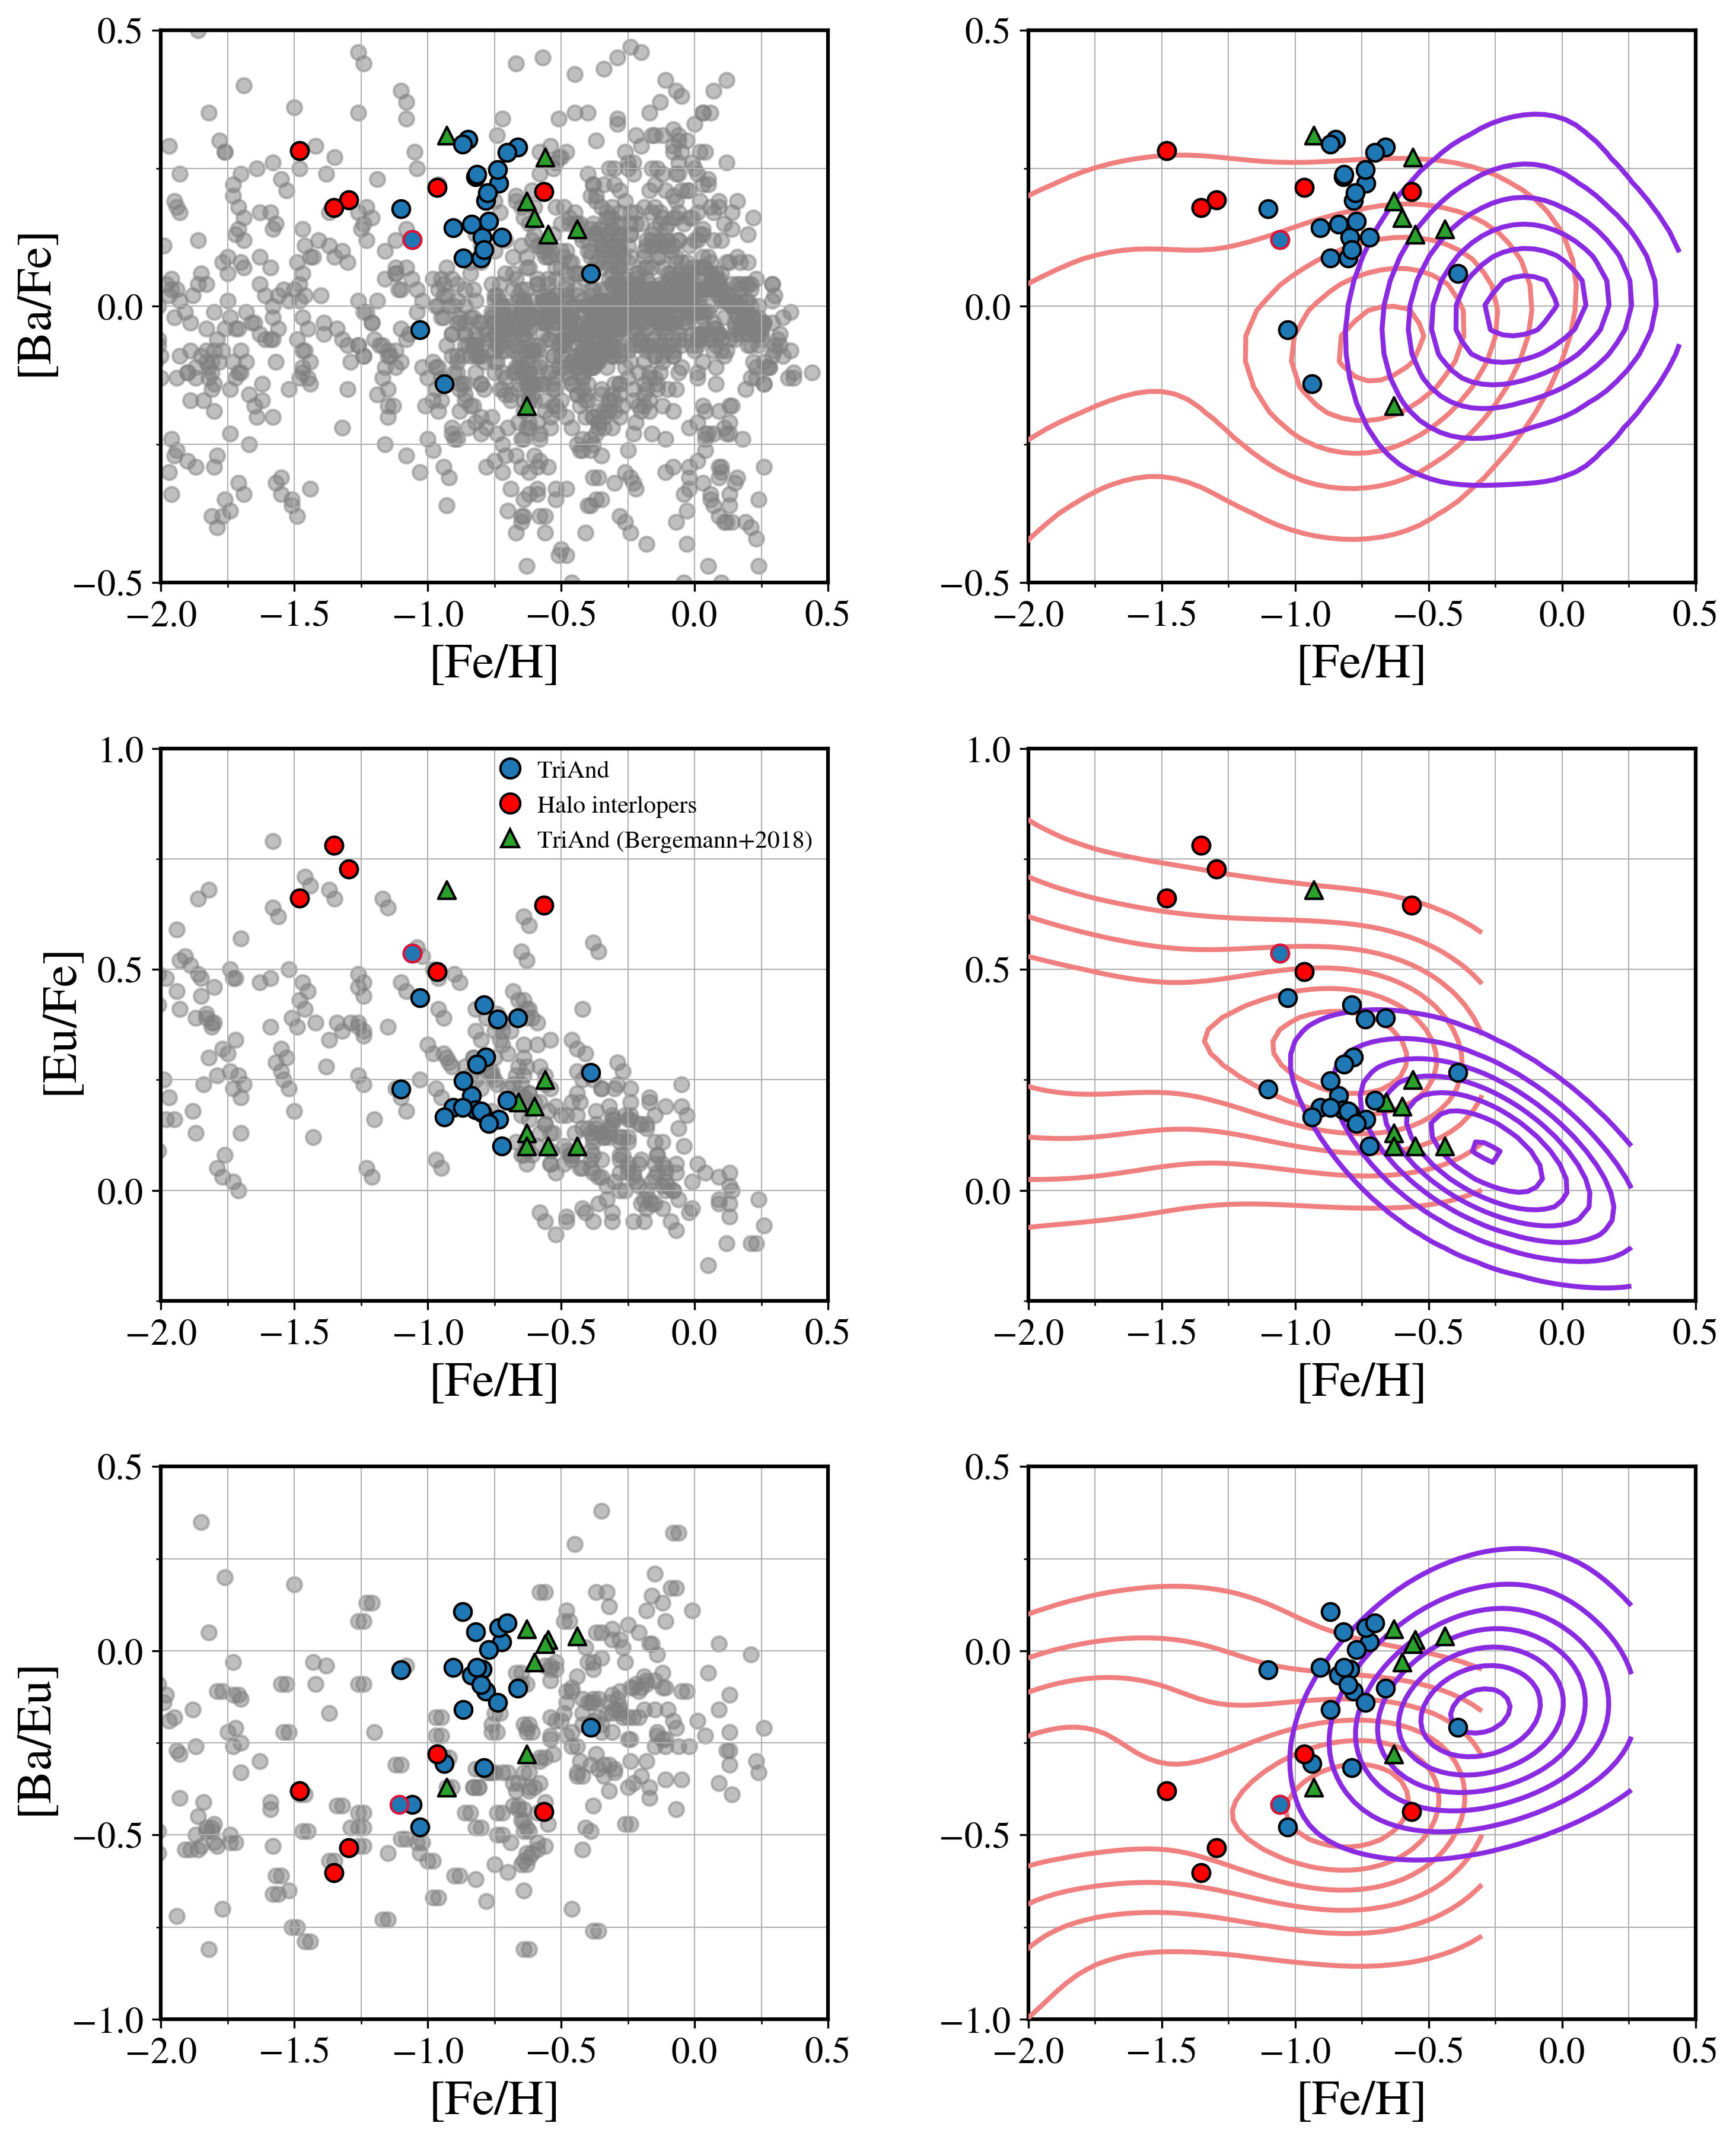
Ratcliffe & Ness (2023) analyzed the chemical trends of the MW disk in different Galactocentric distances. Their results for the neutron-capture elements presented the largest variation from all of the analyzed elements, showing that the evolution and enrichment sites of these heavy elements do not follow a simple trend along the disk. Indeed, in the top panels of Figure 7, it is shown that both the [Ba/Fe] from this work and the disk stars from the SAGA database present a high dispersion, making it difficult to distinguish between different stellar populations.
Even amidst a high dispersion, the majority of our calculated abundances can be found in the range 0.1 < [Ba/Fe] < 0.3. These high values of [Ba/Fe], when compared to the local disk stars from SAGA database in the same metallicity range, agree with the works from Bergemann et al. (2018) and Sales Silva et al. (2019) for their sample of TriAnd candidates. This scenario can probably be explained by the positive gradient from the ratio present in the Galactic disk. The TriAnd stellar population is located in a higher , presenting a higher ratio than stars in the local disk (see, e.g. Sales-Silva et al. 2022).
Contrary to the [Ba/Fe], the [Eu/Fe] ratio, presented in the middle panels of Figure 7, decreases with an increasing metallicity, as expected for -process elements that are linked to high-mass stars. From our calculated [Eu/Fe] abundances, we can observe that the majority of our sample is in good agreement with the disk stars from the SAGA database and Bergemann et al. (2018) sample, favoring an in situ origin.
Conversely, the high-eccentricity stars present chemical patterns similar to accreted populations, usually presenting an -process enrichment (). Interestingly, we also identified that the three most metal-poor stars in our sample () are possible -II stars (Beers & Christlieb, 2005), a class of highly -process enhanced stars that are thought to have originated in rare, neutron-rich sites, presenting low [Ba/Eu] () and high [Eu/Fe] () values (Holmbeck et al., 2020).
In the bottom panels of Figure 7 we can observe the [Ba/Eu] ratio; these abundances reflect the relative number of high- to low-mass stars enriching the interstellar medium where these stars were formed. Even with a high dispersion, we can observe that the majority of our true TriAnd stars present an overall higher [Ba/Eu] ratio, meaning a predominant enrichment from the -process over the -process. Alternatively, the stars with a possible ex situ origin show lower [Ba/Eu], whereas our most metal-poor stars with accreted characteristics present [Ba/Eu] expected for an ex situ population (Aguado et al., 2021a, b; Limberg et al., 2021b; Matsuno et al., 2021; Ji et al., 2022; Naidu et al., 2022).
5 Summary
Divergent suggestions about the nature of TriAnd haven been raised since its discovery. In this work, taking advantage of the largest homogeneous sample of TriAnd candidate stars analyzed with high-resolution spectra, we performed a chemodynamical investigation of an expanded sample of 31 TriAnd candidate stars in order to better understand the origin of its stellar population.
From the orbital parameter analysis of our TriAnd candidates, we observed that the majority of our sample falls within the range of the orbital parameters typical of stars from the Galactic disk. Moreover, through an eccentricity cut (), we identified that the subsample with higher eccentricity presents similar properties to MW accreted populations, such as GSE, indicating an accreted origin for these stars.
The abundance analysis identified that the majority of our TriAnd candidates present chemical patterns similar to the outer thin-disk population. Reassuringly, out of our TriAnd members, those chemically more akin to an in situ nature are specifically those on low-eccentricity orbits (). On the contrary, the high-eccentricity subsample exhibits an abundance profile similar to accreted MW populations, such as GSE.
Our chemodynamical study indicates an in situ origin for TriAnd, as the majority of the sample analyzed in this work presents properties, both dynamical and chemical, similar to the outer thin-disk population. We also attributed the suggested “knee” pattern in the relation between the [/Fe] ratio and [Fe/H] as a contamination of ex situ stars at the same distance and location of TriAnd in past literature samples. Finally, our analysis strongly suggests that the contradictory interpretations found in the literature about the origin of such an overdensity, including extragalactic (e.g., Chou et al. 2011; Deason et al. 2014), in situ (e.g., Bergemann et al. 2018; Hayes et al. 2018a), and “unique" (e.g., Sales Silva et al. 2019, 2020), were mainly due to the smaller number of stars available for analysis in previous works.
References
- Abdurro’uf et al. (2022) Abdurro’uf, Accetta, K., Aerts, C., et al. 2022, ApJS, 259, 35, doi: 10.3847/1538-4365/ac4414
- Abolfathi et al. (2018) Abolfathi, B., Aguado, D. S., Aguilar, G., et al. 2018, ApJS, 235, 42, doi: 10.3847/1538-4365/aa9e8a
- Aguado et al. (2021a) Aguado, D. S., Belokurov, V., Myeong, G. C., et al. 2021a, ApJ, 908, L8, doi: 10.3847/2041-8213/abdbb8
- Aguado et al. (2021b) Aguado, D. S., Myeong, G. C., Belokurov, V., et al. 2021b, MNRAS, 500, 889, doi: 10.1093/mnras/staa3250
- Balbinot & Helmi (2021) Balbinot, E., & Helmi, A. 2021, A&A, 654, A15, doi: 10.1051/0004-6361/20214101510.48550/arXiv.2104.09794
- Beers & Christlieb (2005) Beers, T. C., & Christlieb, N. 2005, ARA&A, 43, 531, doi: 10.1146/annurev.astro.42.053102.134057
- Bellazzini et al. (2006) Bellazzini, M., Ibata, R., Martin, N., et al. 2006, MNRAS, 366, 865, doi: 10.1111/j.1365-2966.2005.09973.x
- Belokurov (2013) Belokurov, V. 2013, New A Rev., 57, 100, doi: 10.1016/j.newar.2013.07.001
- Belokurov et al. (2019) Belokurov, V., Deason, A. J., Erkal, D., et al. 2019, MNRAS, 488, L47, doi: 10.1093/mnrasl/slz101
- Belokurov et al. (2018) Belokurov, V., Erkal, D., Evans, N. W., Koposov, S. E., & Deason, A. J. 2018, MNRAS, 478, 611, doi: 10.1093/mnras/sty982
- Belokurov et al. (2020) Belokurov, V., Sanders, J. L., Fattahi, A., et al. 2020, MNRAS, 494, 3880, doi: 10.1093/mnras/staa876
- Belokurov et al. (2006) Belokurov, V., Zucker, D. B., Evans, N. W., et al. 2006, ApJ, 642, L137, doi: 10.1086/504797
- Belokurov et al. (2007a) Belokurov, V., Evans, N. W., Irwin, M. J., et al. 2007a, ApJ, 658, 337, doi: 10.1086/511302
- Belokurov et al. (2007b) Belokurov, V., Evans, N. W., Bell, E. F., et al. 2007b, ApJ, 657, L89, doi: 10.1086/513144
- Bensby et al. (2014) Bensby, T., Feltzing, S., & Oey, M. S. 2014, A&A, 562, A71, doi: 10.1051/0004-6361/201322631
- Beraldo e Silva et al. (2021) Beraldo e Silva, L., Debattista, V. P., Nidever, D., Amarante, J. A. S., & Garver, B. 2021, MNRAS, 502, 260, doi: 10.1093/mnras/staa3966
- Bergemann (2011) Bergemann, M. 2011, MNRAS, 413, 2184, doi: 10.1111/j.1365-2966.2011.18295.x
- Bergemann & Cescutti (2010) Bergemann, M., & Cescutti, G. 2010, A&A, 522, A9, doi: 10.1051/0004-6361/201014250
- Bergemann et al. (2017) Bergemann, M., Collet, R., Amarsi, A. M., et al. 2017, ApJ, 847, 15, doi: 10.3847/1538-4357/aa88cb
- Bergemann et al. (2013) Bergemann, M., Kudritzki, R.-P., Würl, M., et al. 2013, ApJ, 764, 115, doi: 10.1088/0004-637X/764/2/115
- Bergemann et al. (2012) Bergemann, M., Lind, K., Collet, R., Magic, Z., & Asplund, M. 2012, MNRAS, 427, 27, doi: 10.1111/j.1365-2966.2012.21687.x
- Bergemann et al. (2018) Bergemann, M., Sesar, B., Cohen, J. G., et al. 2018, Nature, 555, 334, doi: 10.1038/nature25490
- Bernard et al. (2016) Bernard, E. J., Ferguson, A. M. N., Schlafly, E. F., et al. 2016, MNRAS, 463, 1759, doi: 10.1093/mnras/stw2134
- Bland-Hawthorn & Gerhard (2016) Bland-Hawthorn, J., & Gerhard, O. 2016, ARA&A, 54, 529, doi: 10.1146/annurev-astro-081915-023441
- Bonaca et al. (2020) Bonaca, A., Conroy, C., Cargile, P. A., et al. 2020, ApJ, 897, L18, doi: 10.3847/2041-8213/ab9caa
- Buder et al. (2021) Buder, S., Sharma, S., Kos, J., et al. 2021, MNRAS, 506, 150, doi: 10.1093/mnras/stab1242
- Bullock & Johnston (2005) Bullock, J. S., & Johnston, K. V. 2005, ApJ, 635, 931, doi: 10.1086/497422
- Busso et al. (1999) Busso, M., Gallino, R., & Wasserburg, G. J. 1999, ARA&A, 37, 239, doi: 10.1146/annurev.astro.37.1.239
- Carballo-Bello et al. (2021) Carballo-Bello, J. A., Martínez-Delgado, D., Corral-Santana, J. M., et al. 2021, MNRAS, 501, 1690, doi: 10.1093/mnras/staa2655
- Castelli & Kurucz (2003) Castelli, F., & Kurucz, R. L. 2003, in Modelling of Stellar Atmospheres, ed. N. Piskunov, W. W. Weiss, & D. F. Gray, Vol. 210, A20. https://arxiv.org/abs/astro-ph/0405087
- Chandra et al. (2022) Chandra, V., Naidu, R. P., Conroy, C., et al. 2022, arXiv e-prints, arXiv:2212.00806. https://arxiv.org/abs/2212.00806
- Chang et al. (2020) Chang, J., Yuan, Z., Xue, X.-X., et al. 2020, ApJ, 905, 100, doi: 10.3847/1538-4357/abc338
- Chene et al. (2014) Chene, A.-N., Padzer, J., Barrick, G., et al. 2014, in Society of Photo-Optical Instrumentation Engineers (SPIE) Conference Series, Vol. 9151, Advances in Optical and Mechanical Technologies for Telescopes and Instrumentation, ed. R. Navarro, C. R. Cunningham, & A. A. Barto, 915147, doi: 10.1117/12.2057417
- Chiba & Beers (2000) Chiba, M., & Beers, T. C. 2000, AJ, 119, 2843, doi: 10.1086/301409
- Chou et al. (2011) Chou, M.-Y., Majewski, S. R., Cunha, K., et al. 2011, ApJ, 731, L30, doi: 10.1088/2041-8205/731/2/L30
- Cooper et al. (2010) Cooper, M. C., Gallazzi, A., Newman, J. A., & Yan, R. 2010, MNRAS, 402, 1942, doi: 10.1111/j.1365-2966.2009.16020.x
- Cowan et al. (2021) Cowan, J. J., Sneden, C., Lawler, J. E., et al. 2021, Reviews of Modern Physics, 93, 015002, doi: 10.1103/RevModPhys.93.015002
- Cutri et al. (2003) Cutri, R. M., Skrutskie, M. F., van Dyk, S., et al. 2003, ycat, II, 246
- Deason et al. (2018) Deason, A. J., Belokurov, V., & Koposov, S. E. 2018, MNRAS, 473, 2428, doi: 10.1093/mnras/stx2528
- Deason et al. (2014) Deason, A. J., Belokurov, V., Hamren, K. M., et al. 2014, MNRAS, 444, 3975, doi: 10.1093/mnras/stu1764
- Depalo & LUNA Collaboration (2016) Depalo, R., & LUNA Collaboration. 2016, in JPhCS, Vol. 665, doi: 10.1088/1742-6596/665/1/012017
- Di Matteo et al. (2019) Di Matteo, P., Haywood, M., Lehnert, M. D., et al. 2019, A&A, 632, A4, doi: 10.1051/0004-6361/201834929
- Dierickx et al. (2014) Dierickx, M., Blecha, L., & Loeb, A. 2014, ApJ, 788, L38, doi: 10.1088/2041-8205/788/2/L38
- Donlon et al. (2019) Donlon, Thomas, I., Newberg, H. J., Weiss, J., Amy, P., & Thompson, J. 2019, ApJ, 886, 76, doi: 10.3847/1538-4357/ab4f72
- Dotter et al. (2008) Dotter, A., Chaboyer, B., Jevremović, D., et al. 2008, ApJS, 178, 89, doi: 10.1086/589654
- Drout et al. (2017) Drout, M. R., Piro, A. L., Shappee, B. J., et al. 2017, Science, 358, 1570, doi: 10.1126/science.aaq0049
- Eggen et al. (1962) Eggen, O. J., Lynden-Bell, D., & Sandage, A. R. 1962, ApJ, 136, 748, doi: 10.1086/147433
- Epstein et al. (2010) Epstein, C. R., Johnson, J. A., Dong, S., et al. 2010, ApJ, 709, 447, doi: 10.1088/0004-637X/709/1/447
- Figueras (2017) Figueras, F. 2017, in Outskirts of Galaxies, ed. J. H. Knapen, J. C. Lee, & A. Gil de Paz, Vol. 434, 1, doi: 10.1007/978-3-319-56570-5_1
- Freeman & Bland-Hawthorn (2002) Freeman, K., & Bland-Hawthorn, J. 2002, ARA&A, 40, 487, doi: 10.1146/annurev.astro.40.060401.093840
- Gaia Collaboration (2018) Gaia Collaboration. 2018, A&A, 616, A1, doi: 10.1051/0004-6361/201833051
- Gaia Collaboration et al. (2016) Gaia Collaboration, Prusti, T., de Bruijne, J. H. J., et al. 2016, A&A, 595, A1, doi: 10.1051/0004-6361/201629272
- Gallart et al. (2019) Gallart, C., Bernard, E. J., Brook, C. B., et al. 2019, NatAs, 3, 932, doi: 10.1038/s41550-019-0829-5
- Gómez et al. (2013) Gómez, F. A., Helmi, A., Cooper, A. P., et al. 2013, MNRAS, 436, 3602, doi: 10.1093/mnras/stt1838
- Gómez et al. (2010) Gómez, G. C., Manríquez, A., & Fuentes-Carrera, I. 2010, in ASP Conf. Ser., Vol. 421, Galaxies in Isolation: Exploring Nature Versus Nurture, ed. L. Verdes-Montenegro, A. Del Olmo, & J. Sulentic, 256
- Grevesse et al. (2007) Grevesse, N., Asplund, M., & Sauval, A. J. 2007, Space Sci. Rev., 130, 105, doi: 10.1007/s11214-007-9173-7
- Griffith et al. (2019) Griffith, E., Johnson, J. A., & Weinberg, D. H. 2019, ApJ, 886, 84, doi: 10.3847/1538-4357/ab4b5d
- Grillmair (2011) Grillmair, C. J. 2011, ApJ, 738, 98, doi: 10.1088/0004-637X/738/1/98
- Grillmair & Carlin (2016) Grillmair, C. J., & Carlin, J. L. 2016, in Tidal Streams in the Local Group and Beyond, ed. H. J. Newberg & J. L. Carlin, Vol. 420, 87, doi: 10.1007/978-3-319-19336-6_4
- Guglielmo et al. (2018) Guglielmo, M., Lane, R. R., Conn, B. C., et al. 2018, MNRAS, 474, 4584, doi: 10.1093/mnras/stx3048
- Hayes et al. (2018a) Hayes, C. R., Majewski, S. R., Hasselquist, S., et al. 2018a, ApJ, 859, L8, doi: 10.3847/2041-8213/aac38c
- Hayes et al. (2018b) Hayes, C. R., Majewski, S. R., Shetrone, M., et al. 2018b, ApJ, 852, 49, doi: 10.3847/1538-4357/aa9cec
- Haywood et al. (2018) Haywood, M., Di Matteo, P., Lehnert, M. D., et al. 2018, ApJ, 863, 113, doi: 10.3847/1538-4357/aad235
- Helmi (2020) Helmi, A. 2020, ARA&A, 58, 205, doi: 10.1146/annurev-astro-032620-021917
- Helmi et al. (2018) Helmi, A., Babusiaux, C., Koppelman, H. H., et al. 2018, Nature, 563, 85, doi: 10.1038/s41586-018-0625-x
- Helmi et al. (2011) Helmi, A., Cooper, A. P., White, S. D. M., et al. 2011, ApJ, 733, L7, doi: 10.1088/2041-8205/733/1/L7
- Helmi & White (1999) Helmi, A., & White, S. D. M. 1999, MNRAS, 307, 495, doi: 10.1046/j.1365-8711.1999.02616.x
- Herwig (2005) Herwig, F. 2005, ARA&A, 43, 435, doi: 10.1146/annurev.astro.43.072103.150600
- Holmbeck et al. (2020) Holmbeck, E. M., Hansen, T. T., Beers, T. C., et al. 2020, ApJS, 249, 30, doi: 10.3847/1538-4365/ab9c19
- Hunter (2007) Hunter, J. D. 2007, Computing in Science and Engineering, 9, 90, doi: 10.1109/MCSE.2007.55
- Ibata et al. (2021) Ibata, R., Malhan, K., Martin, N., et al. 2021, ApJ, 914, 123, doi: 10.3847/1538-4357/abfcc2
- Ibata et al. (1994) Ibata, R. A., Gilmore, G., & Irwin, M. J. 1994, Nature, 370, 194, doi: 10.1038/370194a0
- Ibata et al. (1995) —. 1995, MNRAS, 277, 781, doi: 10.1093/mnras/277.3.781
- Ibata et al. (2019) Ibata, R. A., Malhan, K., & Martin, N. F. 2019, ApJ, 872, 152, doi: 10.3847/1538-4357/ab0080
- Ivezić et al. (2000) Ivezić, Ž., Goldston, J., Finlator, K., et al. 2000, AJ, 120, 963, doi: 10.1086/301455
- Iwamoto et al. (1999) Iwamoto, K., Brachwitz, F., Nomoto, K., et al. 1999, ApJS, 125, 439, doi: 10.1086/313278
- Ji et al. (2022) Ji, A. P., Naidu, R. P., Brauer, K., Ting, Y.-S., & Simon, J. D. 2022, MNRAS, doi: 10.1093/mnras/stac2757
- Ji et al. (2020) Ji, A. P., Li, T. S., Hansen, T. T., et al. 2020, AJ, 160, 181, doi: 10.3847/1538-3881/abacb6
- Johnston (1998) Johnston, K. V. 1998, ApJ, 495, 297, doi: 10.1086/305273
- Johnston et al. (2008) Johnston, K. V., Bullock, J. S., Sharma, S., et al. 2008, ApJ, 689, 936, doi: 10.1086/592228
- Jurić et al. (2008) Jurić, M., Ivezić, Ž., Brooks, A., et al. 2008, ApJ, 673, 864, doi: 10.1086/523619
- Karakas & Lattanzio (2014) Karakas, A. I., & Lattanzio, J. C. 2014, PASA, 31, e030, doi: 10.1017/pasa.2014.21
- Kirby et al. (2019) Kirby, E. N., Xie, J. L., Guo, R., et al. 2019, ApJ, 881, 45, doi: 10.3847/1538-4357/ab2c02
- Koppelman et al. (2018) Koppelman, H., Helmi, A., & Veljanoski, J. 2018, ApJ, 860, L11, doi: 10.3847/2041-8213/aac882
- Laporte et al. (2018) Laporte, C. F. P., Johnston, K. V., Gómez, F. A., Garavito-Camargo, N., & Besla, G. 2018, MNRAS, 481, 286, doi: 10.1093/mnras/sty1574
- Laporte et al. (2022) Laporte, C. F. P., Koposov, S. E., & Belokurov, V. 2022, MNRAS, 510, L13, doi: 10.1093/mnrasl/slab109
- Laporte et al. (2019) Laporte, C. F. P., Minchev, I., Johnston, K. V., & Gómez, F. A. 2019, MNRAS, 485, 3134, doi: 10.1093/mnras/stz583
- Larsen et al. (2022) Larsen, S. S., Eitner, P., Magg, E., et al. 2022, A&A, 660, A88, doi: 10.1051/0004-6361/202142243
- Lattimer & Schramm (1974) Lattimer, J. M., & Schramm, D. N. 1974, ApJ, 192, L145, doi: 10.1086/181612
- Li et al. (2018) Li, C., Zhao, G., Zhai, M., & Jia, Y. 2018, ApJ, 860, 53, doi: 10.3847/1538-4357/aac50f
- Li et al. (2021) Li, J., Xue, X.-X., Liu, C., et al. 2021, ApJ, 910, 46, doi: 10.3847/1538-4357/abd9bf
- Li et al. (2016) Li, T. S., Balbinot, E., Mondrik, N., et al. 2016, ApJ, 817, 135, doi: 10.3847/0004-637X/817/2/135
- Li et al. (2017) Li, T. S., Sheffield, A. A., Johnston, K. V., et al. 2017, ApJ, 844, 74, doi: 10.3847/1538-4357/aa7a0d
- Li et al. (2022) Li, T. S., Ji, A. P., Pace, A. B., et al. 2022, ApJ, 928, 30, doi: 10.3847/1538-4357/ac46d3
- Limberg et al. (2022) Limberg, G., Souza, S. O., Pérez-Villegas, A., et al. 2022, ApJ, 935, 109, doi: 10.3847/1538-4357/ac8159
- Limberg et al. (2021a) Limberg, G., Rossi, S., Beers, T. C., et al. 2021a, ApJ, 907, 10, doi: 10.3847/1538-4357/abcb87
- Limberg et al. (2021b) Limberg, G., Santucci, R. M., Rossi, S., et al. 2021b, ApJ, 913, L28, doi: 10.3847/2041-8213/ac0056
- López-Corredoira et al. (2007) López-Corredoira, M., Momany, Y., Zaggia, S., & Cabrera-Lavers, A. 2007, A&A, 472, L47, doi: 10.1051/0004-6361:20077813
- Mackereth et al. (2019) Mackereth, J. T., Schiavon, R. P., Pfeffer, J., et al. 2019, MNRAS, 482, 3426, doi: 10.1093/mnras/sty2955
- Majewski et al. (2004) Majewski, S. R., Ostheimer, J. C., Rocha-Pinto, H. J., et al. 2004, ApJ, 615, 738, doi: 10.1086/424586
- Majewski et al. (2003) Majewski, S. R., Skrutskie, M. F., Weinberg, M. D., & Ostheimer, J. C. 2003, ApJ, 599, 1082, doi: 10.1086/379504
- Majewski et al. (2017) Majewski, S. R., Schiavon, R. P., Frinchaboy, P. M., et al. 2017, AJ, 154, 94, doi: 10.3847/1538-3881/aa784d
- Malhan et al. (2018) Malhan, K., Ibata, R. A., & Martin, N. F. 2018, MNRAS, 481, 3442, doi: 10.1093/mnras/sty2474
- Martin et al. (2004) Martin, N. F., Ibata, R. A., Conn, B. C., et al. 2004, MNRAS, 355, L33, doi: 10.1111/j.1365-2966.2004.08521.x
- Martin et al. (2007) Martin, N. F., Ibata, R. A., & Irwin, M. 2007, ApJ, 668, L123, doi: 10.1086/522791
- Martin et al. (2014) Martin, N. F., Ibata, R. A., Rich, R. M., et al. 2014, ApJ, 787, 19, doi: 10.1088/0004-637X/787/1/19
- Martioli et al. (2012) Martioli, E., Teeple, D., Manset, N., et al. 2012, in Society of Photo-Optical Instrumentation Engineers (SPIE) Conference Series, Vol. 8451, Software and Cyberinfrastructure for Astronomy II, ed. N. M. Radziwill & G. Chiozzi, 84512B, doi: 10.1117/12.926627
- Mashonkina et al. (2007) Mashonkina, L., Korn, A. J., & Przybilla, N. 2007, A&A, 461, 261, doi: 10.1051/0004-6361:20065999
- Mateu et al. (2018) Mateu, C., Read, J. I., & Kawata, D. 2018, MNRAS, 474, 4112, doi: 10.1093/mnras/stx2937
- Matsuno et al. (2021) Matsuno, T., Hirai, Y., Tarumi, Y., et al. 2021, A&A, 650, A110, doi: 10.1051/0004-6361/202040227
- Matteucci & Brocato (1990) Matteucci, F., & Brocato, E. 1990, ApJ, 365, 539, doi: 10.1086/169508
- Matteucci & Francois (1989) Matteucci, F., & Francois, P. 1989, MNRAS, 239, 885, doi: 10.1093/mnras/239.3.885
- McConnachie et al. (2009) McConnachie, A. W., Irwin, M. J., Ibata, R. A., et al. 2009, Nature, 461, 66, doi: 10.1038/nature08327
- McKinney (2010) McKinney, W. 2010, in Proceedings of the 9th Python in Science Conference, ed. Stéfan van der Walt & Jarrod Millman, 56 – 61, doi: 10.25080/Majora-92bf1922-00a
- McMillan (2017) McMillan, P. J. 2017, MNRAS, 465, 76, doi: 10.1093/mnras/stw2759
- Meisner et al. (2012) Meisner, A. M., Frebel, A., Jurić, M., & Finkbeiner, D. P. 2012, ApJ, 753, 116, doi: 10.1088/0004-637X/753/2/116
- Momany et al. (2006) Momany, Y., Zaggia, S., Gilmore, G., et al. 2006, A&A, 451, 515, doi: 10.1051/0004-6361:20054081
- Momany et al. (2004) Momany, Y., Zaggia, S. R., Bonifacio, P., et al. 2004, A&A, 421, L29, doi: 10.1051/0004-6361:20040183
- Morganson et al. (2016) Morganson, E., Conn, B., Rix, H.-W., et al. 2016, ApJ, 825, 140, doi: 10.3847/0004-637X/825/2/140
- Mösta et al. (2014) Mösta, P., Richers, S., Ott, C. D., et al. 2014, ApJ, 785, L29, doi: 10.1088/2041-8205/785/2/L29
- Munari et al. (2005) Munari, U., Sordo, R., Castelli, F., & Zwitter, T. 2005, A&A, 442, 1127, doi: 10.1051/0004-6361:20042490
- Myeong et al. (2022) Myeong, G. C., Belokurov, V., Aguado, D. S., et al. 2022, ApJ, 938, 21, doi: 10.3847/1538-4357/ac8d68
- Myeong et al. (2018) Myeong, G. C., Evans, N. W., Belokurov, V., Sanders, J. L., & Koposov, S. E. 2018, ApJ, 856, L26, doi: 10.3847/2041-8213/aab613
- Naidu et al. (2020) Naidu, R. P., Conroy, C., Bonaca, A., et al. 2020, ApJ, 901, 48, doi: 10.3847/1538-4357/abaef4
- Naidu et al. (2021) —. 2021, ApJ, 923, 92, doi: 10.3847/1538-4357/ac2d2d
- Naidu et al. (2022) Naidu, R. P., Ji, A. P., Conroy, C., et al. 2022, ApJ, 926, L36, doi: 10.3847/2041-8213/ac5589
- Newberg et al. (2009) Newberg, H. J., Yanny, B., & Willett, B. A. 2009, ApJ, 700, L61, doi: 10.1088/0004-637X/700/2/L61
- Newberg et al. (2002) Newberg, H. J., Yanny, B., Rockosi, C., et al. 2002, ApJ, 569, 245, doi: 10.1086/338983
- Nissen & Schuster (2010) Nissen, P. E., & Schuster, W. J. 2010, A&A, 511, L10, doi: 10.1051/0004-6361/200913877
- Nissen & Schuster (2011) —. 2011, A&A, 530, A15, doi: 10.1051/0004-6361/201116619
- Perottoni et al. (2022) Perottoni, H. D., Limberg, G., Amarante, J. A. S., et al. 2022, ApJ, 936, L2, doi: 10.3847/2041-8213/ac88d6
- Perottoni et al. (2019) Perottoni, H. D., Martin, C., Newberg, H. J., et al. 2019, MNRAS, 486, 843, doi: 10.1093/mnras/stz869
- Perottoni et al. (2018) Perottoni, H. D., Rocha-Pinto, H. J., Girardi, L., et al. 2018, MNRAS, 473, 1461, doi: 10.1093/mnras/stx2217
- Price-Whelan et al. (2015) Price-Whelan, A. M., Johnston, K. V., Sheffield, A. A., Laporte, C. F. P., & Sesar, B. 2015, MNRAS, 452, 676, doi: 10.1093/mnras/stv1324
- Queiroz et al. (2018) Queiroz, A. B. A., Anders, F., Santiago, B. X., et al. 2018, MNRAS, 476, 2556, doi: 10.1093/mnras/sty330
- Queiroz et al. (2020) Queiroz, A. B. A., Anders, F., Chiappini, C., et al. 2020, A&A, 638, A76, doi: 10.1051/0004-6361/20193736410.48550/arXiv.1912.09778
- Queiroz et al. (2023) Queiroz, A. B. A., Anders, F., Chiappini, C., et al. 2023, arXiv e-prints, doi: 10.48550/arXiv.2303.09926
- Ramírez et al. (2014) Ramírez, I., Meléndez, J., Bean, J., et al. 2014, A&A, 572, A48, doi: 10.1051/0004-6361/201424244
- Ramos et al. (2021) Ramos, P., Antoja, T., Mateu, C., et al. 2021, A&A, 646, A99, doi: 10.1051/0004-6361/202039830
- Ratcliffe & Ness (2023) Ratcliffe, B. L., & Ness, M. K. 2023, ApJ, 943, 92, doi: 10.3847/1538-4357/aca8a1
- Reichert et al. (2021) Reichert, M., Obergaulinger, M., Eichler, M., Aloy, M. Á ., & Arcones, A. 2021, Monthly Notices of the Royal Astronomical Society, doi: 10.1093/mnras/stab029
- Rocha-Pinto et al. (2003) Rocha-Pinto, H. J., Majewski, S. R., Skrutskie, M. F., & Crane, J. D. 2003, ApJ, 594, L115, doi: 10.1086/378668
- Rocha-Pinto et al. (2004) Rocha-Pinto, H. J., Majewski, S. R., Skrutskie, M. F., Crane, J. D., & Patterson, R. J. 2004, ApJ, 615, 732, doi: 10.1086/424585
- Rosswog et al. (1999) Rosswog, S., Liebendörfer, M., Thielemann, F. K., et al. 1999, A&A, 341, 499. https://arxiv.org/abs/astro-ph/9811367
- Sales Silva et al. (2020) Sales Silva, J. V., Cunha, K., Perottoni, H. D., et al. 2020, ApJ, 901, 27, doi: 10.3847/1538-4357/abaaad
- Sales Silva et al. (2019) Sales Silva, J. V., Perottoni, H. D., Cunha, K., et al. 2019, ApJ, 886, 113, doi: 10.3847/1538-4357/ab4ada
- Sales-Silva et al. (2022) Sales-Silva, J. V., Daflon, S., Cunha, K., et al. 2022, ApJ, 926, 154, doi: 10.3847/1538-4357/ac4254
- Schlegel et al. (1998a) Schlegel, D. J., Finkbeiner, D. P., & Davis, M. 1998a, ApJ, 500, 525, doi: 10.1086/305772
- Schlegel et al. (1998b) —. 1998b, ApJ, 500, 525, doi: 10.1086/305772
- Schönrich et al. (2010) Schönrich, R., Binney, J., & Dehnen, W. 2010, MNRAS, 403, 1829, doi: 10.1111/j.1365-2966.2010.16253.x
- Schönrich & Dehnen (2018) Schönrich, R., & Dehnen, W. 2018, MNRAS, 478, 3809, doi: 10.1093/mnras/sty1256
- Searle & Zinn (1978) Searle, L., & Zinn, R. 1978, ApJ, 225, 357, doi: 10.1086/156499
- Sesar et al. (2007) Sesar, B., Ivezić, Ž., Lupton, R. H., et al. 2007, AJ, 134, 2236, doi: 10.1086/521819
- Sheffield et al. (2014) Sheffield, A. A., Johnston, K. V., Majewski, S. R., et al. 2014, ApJ, 793, 62, doi: 10.1088/0004-637X/793/1/62
- Sheffield et al. (2018) Sheffield, A. A., Price-Whelan, A. M., Tzanidakis, A., et al. 2018, ApJ, 854, 47, doi: 10.3847/1538-4357/aaa4b6
- Shipp et al. (2018) Shipp, N., Drlica-Wagner, A., Balbinot, E., et al. 2018, ApJ, 862, 114, doi: 10.3847/1538-4357/aacdab
- Skrutskie et al. (2006) Skrutskie, M. F., Cutri, R. M., Stiening, R., et al. 2006, AJ, 131, 1163, doi: 10.1086/498708
- Sneden et al. (2008) Sneden, C., Cowan, J. J., & Gallino, R. 2008, ARA&A, 46, 241, doi: 10.1146/annurev.astro.46.060407.145207
- Sneden (1973) Sneden, C. A. 1973, PhD thesis, University of Texas, Austin
- Sobeck et al. (2011) Sobeck, J. S., Kraft, R. P., Sneden, C., et al. 2011, AJ, 141, 175, doi: 10.1088/0004-6256/141/6/175
- Somerville & Davé (2015) Somerville, R. S., & Davé, R. 2015, ARA&A, 53, 51, doi: 10.1146/annurev-astro-082812-140951
- Spergel et al. (2007) Spergel, D. N., Bean, R., Dore, O., et al. 2007, The Astrophysical Journal Supplement Series, 170, 377, doi: 10.1086/513700
- Stoughton et al. (2002) Stoughton, C., Lupton, R. H., Bernardi, M., et al. 2002, AJ, 123, 485, doi: 10.1086/324741
- Suda et al. (2008) Suda, T., Katsuta, Y., Yamada, S., et al. 2008, PASJ, 60, 1159, doi: 10.1093/pasj/60.5.1159
- Suda et al. (2017) Suda, T., Hidaka, J., Aoki, W., et al. 2017, PASJ, 69, 76, doi: 10.1093/pasj/psx059
- Thielemann et al. (2017) Thielemann, F. K., Eichler, M., Panov, I. V., & Wehmeyer, B. 2017, Annual Review of Nuclear and Particle Science, 67, 253, doi: 10.1146/annurev-nucl-101916-123246
- Thielemann et al. (2020) Thielemann, F.-K., Wehmeyer, B., & Wu, M.-R. 2020, in JPhCS, Vol. 1668, doi: 10.1088/1742-6596/1668/1/012044
- Tinsley (1980) Tinsley, B. M. 1980, Fund. Cosmic Phys., 5, 287, doi: 10.48550/arXiv.2203.02041
- Tody (1986) Tody, D. 1986, in Society of Photo-Optical Instrumentation Engineers (SPIE) Conference Series, Vol. 627, Instrumentation in astronomy VI, ed. D. L. Crawford, 733, doi: 10.1117/12.968154
- Tonry & Davis (1979) Tonry, J., & Davis, M. 1979, AJ, 84, 1511, doi: 10.1086/112569
- van der Kruit & Freeman (2011) van der Kruit, P. C., & Freeman, K. C. 2011, ARA&A, 49, 301, doi: 10.1146/annurev-astro-083109-153241
- van der Walt et al. (2011) van der Walt, S., Colbert, S. C., & Varoquaux, G. 2011, Computing in Science and Engineering, 13, 22, doi: 10.1109/MCSE.2011.37
- Vasiliev (2019) Vasiliev, E. 2019, MNRAS, 482, 1525, doi: 10.1093/mnras/sty2672
- Ventura et al. (2011) Ventura, P., Carini, R., & D’Antona, F. 2011, MNRAS, 415, 3865, doi: 10.1111/j.1365-2966.2011.18997.x
- Virtanen et al. (2020) Virtanen, P., Gommers, R., Oliphant, T. E., et al. 2020, NatMe, 17, 261, doi: https://doi.org/10.1038/s41592-019-0686-2
- Wanajo et al. (2009) Wanajo, S., Nomoto, K., Janka, H. T., Kitaura, F. S., & Müller, B. 2009, ApJ, 695, 208, doi: 10.1088/0004-637X/695/1/208
- Wang et al. (2022) Wang, F., Zhang, H.-W., Xue, X.-X., et al. 2022, Monthly Notices of the Royal Astronomical Society, 513, 1958, doi: 10.1093/mnras/stac874
- Watkins et al. (2009) Watkins, L. L., Evans, N. W., Belokurov, V., et al. 2009, MNRAS, 398, 1757, doi: 10.1111/j.1365-2966.2009.15242.x
- Winteler et al. (2012) Winteler, C., Käppeli, R., Perego, A., et al. 2012, ApJ, 750, L22, doi: 10.1088/2041-8205/750/1/L22
- Woosley & Weaver (1995) Woosley, S. E., & Weaver, T. A. 1995, ApJS, 101, 181, doi: 10.1086/192237
- Xu et al. (2015) Xu, Y., Newberg, H. J., Carlin, J. L., et al. 2015, ApJ, 801, 105, doi: 10.1088/0004-637X/801/2/105
- Yanny & Newberg (2016) Yanny, B., & Newberg, H. J. 2016, in Tidal Streams in the Local Group and Beyond, ed. H. J. Newberg & J. L. Carlin, Vol. 420, 63, doi: 10.1007/978-3-319-19336-6_3
- Yanny et al. (2000) Yanny, B., Newberg, H. J., Kent, S., et al. 2000, ApJ, 540, 825, doi: 10.1086/309386
- Youakim et al. (2020) Youakim, K., Starkenburg, E., Martin, N. F., et al. 2020, Monthly Notices of the Royal Astronomical Society, 492, 4986, doi: 10.1093/mnras/stz3619
- Zasowski et al. (2019) Zasowski, G., Schultheis, M., Hasselquist, S., et al. 2019, ApJ, 870, 138, doi: 10.3847/1538-4357/aaeff4