Measurement of the cosmic p+He energy spectrum from 46 GeV to 316 TeV with the DAMPE space mission
Abstract
Recent observations of the light component of the cosmic-ray spectrum have revealed unexpected features that motivate further and more precise measurements up to the highest energies. The Dark Matter Particle Explorer (DAMPE) is a satellite-based cosmic-ray experiment that is operational since December 2015, continuously collecting data on high-energy cosmic particles with very good statistics, energy resolution, and particle identification capabilities. In this work, the latest measurements of the energy spectrum of proton+helium in the energy range from 46 GeV to 316 TeV are presented. Among the most distinctive features of the spectrum, a spectral hardening at 600 GeV has been observed, along with a softening at 29 TeV measured with a 6.6 significance. Moreover, by measuring the energy spectrum up to 316 TeV, a strong link is established between space- and ground-based experiments, also suggesting the presence of a second hardening at 150 TeV.
Introduction - Cosmic rays (CRs) are high-energy particles accelerated in extreme regions of the Universe. CRs can be of galactic (GCRs) or extragalactic (ECRs) origin and they bring information about the astrophysical particle accelerators where they are generated, and the interstellar medium they travel through. The cosmic-ray spectrum is composed of several nuclear species and it extends to energies up to 1020 eV. Shock acceleration mechanisms predict a single power-law energy spectrum for GCRs below the knee (3-4 PeV), which translates to an E-2.6 - E-2.7 energy spectrum detected at Earth [1]. However, unexpected spectral features have been reported by several experiments for protons, helium, and heavier nuclei over the past years [2, 3, 4, 5, 6, 7, 8, 9, 10, 11, 12, 13, 14, 15, 16]. The spectrum of GCRs becomes harder around several hundreds of GeV and softer again above 10 TeV [11, 17, 18]. These deviations from a single power law motivate a deeper understanding of the CR acceleration and propagation mechanisms. Space-borne magnetic spectrometers like PAMELA and AMS have provided precise measurements of different CR species. However, they can only reach rigidities up to a few TV [4, 5, 6, 7, 8, 9, 10]. Direct measurements of higher-energy CRs were performed with previous generation space and balloon-borne experiments, but with considerable statistical and instrumental uncertainties [15, 14, 13].
The Dark Matter Particle Explorer (DAMPE) is a space-based particle and gamma-ray detector that has been operational since December 2015. It is designed to observe cosmic radiation up to 10 TeV for photons and e- + e+, and hundreds of TeV for protons and ions while searching for indirect signatures of dark matter. The instrument consists of four sub-detectors: a plastic scintillator detector (PSD), designed to discriminate electrons from gamma rays and measure the absolute charge of impinging particles. The PSD comprises 82 bars, divided into 2 orthogonal layers, which are composed of 2 planes of staggered bars each. Below the PSD, a silicon-tungsten tracker-converter (STK) is used to measure the charged particle direction, giving additional information on the charge and converting photons in electron-positron pairs (with the help of tungsten layers). A bismuth germanium oxide (BGO) imaging calorimeter measures the energy of the particle and separates hadronic from electromagnetic showers. The BGO calorimeter is made of 14 layers, with 22 BGO bars each, for a total depth of more than 31 radiation lengths and 1.6 nuclear interaction lengths. Finally, the neutron detector (NUD), composed of boron-loaded plastic scintillators, collects neutrons from hadronic showers further refining the event identification. DAMPE has a deep calorimeter, large acceptance, and good energy resolution (1.5% for electrons and 30% for protons) making it an optimal instrument for measuring cosmic rays up to a few hundreds of TeV [19]. In this study, the very high energy spectrum for p+He up to 316 TeV is presented, using 6 years of flight data collected by DAMPE. By selecting a combined proton and helium sample, event selection criteria can be relaxed (with respect to the case of p alone or He alone) while keeping low contamination, thus obtaining more statistics. Consequently, higher statistics allow for an extension in energy up to 316 TeV, providing for the first time a bridge between space-based and ground-based results with relatively small uncertainties.
Monte Carlo simulations - Monte Carlo (MC) simulations are needed to understand the response of the detector to different particles. In this analysis, the GEANT4 version 4.10.5 toolkit [20] is used along with the FTFPBERT physics list***https://geant4.web.cern.ch/node/302 for protons between 10 GeV and 100 TeV and helium nuclei between 10 GeV and 500 TeV. The physics list EPOS-LHC [21] is used for the energy interval 100 TeV - 1 PeV for protons and 500 TeV - 1 PeV for helium, by linking them to GEANT4 with the Cosmic Ray Monte Carlo (CRMC) package†††https://web.ikp.kit.edu/rulrich/crmc.html [22]. Before launching DAMPE into space, several beam tests were performed at CERN, using ion beams of 40 GeV/n, 75 GeV/n and 400 GeV/n [23, 24, 25]. The data taken in the beam tests were compared with the simulations, showing a good agreement. The simulated events are initially generated with an isotropic spectrum, following an E-1 dependence, and then re-weighted during the analysis according to an E-2.6 power-law, following both theoretical expectations and experimental observations. As detailed later on, the exact shape of the energy spectrum used to weigh MC events negligibly affects our analysis results. Additional MC data are produced with alternative hadronic interaction models. Specifically, helium nuclei are simulated with FLUKA 2011.2x [26], which uses the DPMJET3 model [27, 28, 29], while GEANT4-QGSPBERT is used for protons. The spectrum is computed anew using these MC samples, with the difference between the two spectra providing an estimate for the systematic uncertainty from the hadronic interaction model.
Event Selection - In this study, 72 months of flight data taken between January 2016 and December 2021 are used. The events potentially affected by the South Atlantic Anomaly (SAA) region are excluded from the analysis. From this dataset, an event preselection is applied first, followed by a selection of p or He particles. This procedure is applied both to MC and flight data. After subtracting the instrumental dead time, which is 3.0725 ms per event (18% of the operation time), the on-orbit calibration time (1.6%), a giant solar flare period between September 9 and September 13, 2017‡‡‡https://solarflare.njit.edu/datasources.html, and the SAA passage time (5%) [30], a total live time of 14.5 s remains, corresponding to 76% of the total operation time.
(i) Preselection - The preselection is based mainly on the measurements performed by the BGO calorimeter, according to the following criteria:
-
•
The energy deposited by a Minimum Ionizing Particle (MIP) in a BGO bar is expected to be 23 MeV. The activation of the high energy trigger (HET) is required, with the condition of an energy deposition larger than 10 MIPs in the first 3 BGO layers and larger than 2 MIPs in the fourth layer [31]. Events that are able to initiate a shower at the top of the calorimeter will satisfy this condition.
-
•
Events with deposited energy in the calorimeter higher than 20 GeV are selected, to avoid the effect of the geomagnetic rigidity cutoff [32].
-
•
The energy deposited in any single layer of the BGO calorimeter has to be lower than 35% of the total energy, in order to reject most of the events entering from the sides of the calorimeter.
-
•
Additionally, a good lateral containment of the shower inside the calorimeter is achieved, by asking for the shower axis to be contained in a central region covering 93 of the calorimeter width. Furthermore, events whose maximum energy deposition occurs at the lateral edges of the calorimeter are rejected.
(ii) Track selection - The track of the incoming particle is reconstructed by the STK [33]. In order to select the highest quality events, the STK information is combined with measurements from other sub-detectors. The first requirement is that the reconstructed track in the STK should match the shower axis in the BGO calorimeter. An additional requirement is that the STK track and the signal in the PSD are consistent. To achieve this, a PSD fiducial volume (covering 97 of the PSD active area, in the central region) is defined, with the condition of having the STK track projection within that specific volume.
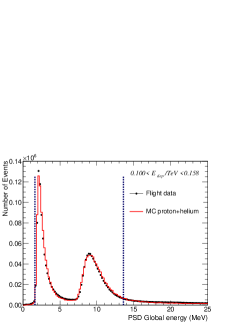
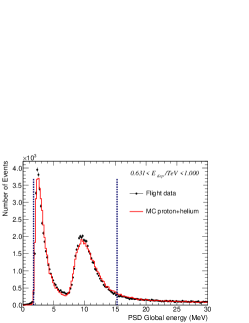
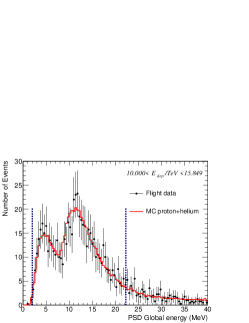
(iii) Charge selection - The different nuclei are selected according to the energy deposited in the PSD. A correction is applied to the signal of the PSD bars, accounting for light attenuation, detector alignment and incident angle [34, 35]. After this correction, the signal can be considered to be proportional to , in accordance with the Bethe-Bloch equation (with Z being the charge of the incident particle). The PSD global deposited energy for a particular event is obtained by combining the independent energy loss readings from each of the 2 PSD layers. The deposited energy loss not only depends on the charge of the incident particle but also on its primary energy. For this reason, the charge selection is performed in different bins of energy deposited in the BGO calorimeter. For each bin, the PSD global energy distribution of the events is fitted using a Landau convoluted with a Gaussian function (LanGaus). The Landau function describes fluctuations in energy loss of ionizing particles and the Gaussian is used to account for detector effects. From these fits, the most probable value (MPV) and width value (sigma) of the resulting function are obtained. Both the MPV and sigma values have a dependence on the total energy deposited in the calorimeter. This dependence is modeled by fitting the MPV and sigma obtained from the fits with a fourth-order polynomial function of the logarithm of the energy, which is used to retrieve a charge selection condition for different values of deposited energy. The functions obtained for flight data and MC data were found to have a slight disagreement, probably because of an overestimation of the back-scattering effect in MC simulations. In order to account for this mismatch, a smearing correction is applied to the charge distributions for MC results: the proton and helium peaks are corrected in order to match MPV and sigma of flight data. Figure 1 shows an example of the PSD charge distributions for three different bins of deposited energy and their comparison with MC data, after the smearing correction. The vertical dashed lines show the charge selection conditions, with a maximum value of MPVHe + 6 and a minimum value of MPVp - 2, where the sigma value is given by . These limits are optimized and chosen to maximize the statistics while maintaining a low-background level ( 0.4% up to 10 TeV, see background section).
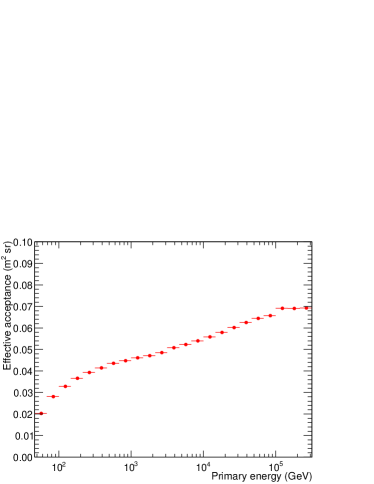
Effective acceptance - After applying the selection cuts described in the previous section, the efficiencies are computed using MC simulations. Their comparison with flight data and subsequent validation is reported in the appendix (see below). Afterwards, the effective acceptance () can be evaluated. Figure 2 shows the acceptance of the DAMPE detector as a function of the primary energy, which can be described by the following expression:
| (1) |
where is the geometrical factor used to generate MC data, is the number of MC generated events in the i-th bin of primary energy (), and the number of those MC events surviving the selection cuts. This result was found to be independent of the spectral shape or the p/He mixture assumed in the simulation (see the section on the systematic uncertainties evaluation).
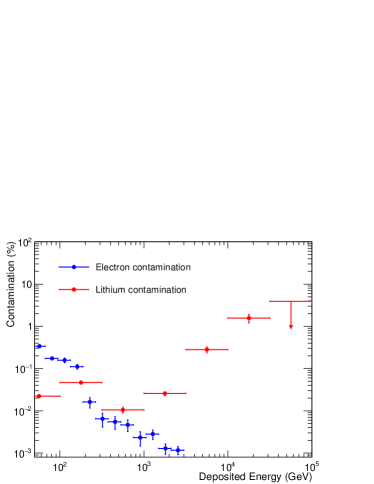
Background Estimation - Protons constitute a background for helium, and vice-versa. By combining these nuclei in a single spectrum, the remaining background is very low and mainly comprises electrons-positrons and lithium nuclei. Electrons and positrons are separated from protons in the BGO calorimeter using shower morphology discrimination. A detailed description of the separation of electrons and positrons from protons can be found in [36]. For the present analysis, the contamination of electrons in the p+He spectrum is 0.5 at 40 GeV of energy deposited in the BGO calorimeter, and it decreases with increasing energy. The lithium background is estimated using the template fit of the energy released in the PSD based on MC simulations of proton, helium and lithium. The contamination from lithium is lower than 0.3 up to 10 TeV, and it is 1.6 for energies higher than 10 TeV. The background from electrons-positrons and lithium is shown is Figure A4 of the appendix.
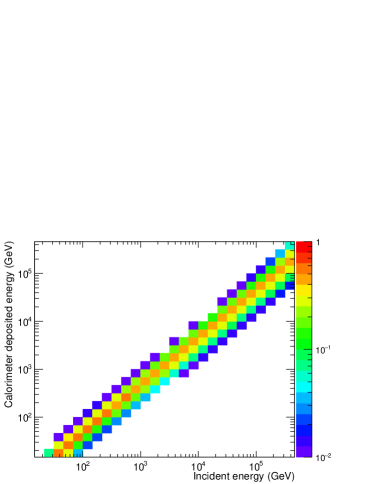
Energy measurement & unfolding procedure - The energy of the hadronic showers cannot be completely contained in the calorimeter. In particular, for p and He, around 35% to 45% of the total energy is collected in the detector. Consequently, an unfolding procedure is necessary to obtain the energy spectrum of the incident particles. In this case, a Bayesian approach is adopted [37], in which the detector response is estimated from MC simulations of both proton and helium nuclei, after applying the selection cuts described in the Event Selection section. The actual number of events in the i-th bin of true energy, , can be obtained from the following expression:
| (2) |
where is the number of observed events in the j-th bin of energy deposited in the calorimeter () and the response matrix derived from MC simulations (see Figure 3). The color scale represents the conditional probability that the p+He candidates with incident energy , are observed with deposited energy in the calorimeter.
The energy of an event is determined from the BGO calorimeter measurements, which need to be corrected in order to obtain the true energy deposited in the calorimeter. For events with deposited energy 4 TeV in a single BGO bar, some readout channels might get saturated. For this reason, a method developed using MC simulations is used to correct saturated events [38]. Another correction is applied to account for Birk’s quenching in the BGO calorimeter. Quenching is more significant for heavy nuclei which produce more secondary particles with high charge and low velocity [39]. The BGO quenching is taken into account by including its effect in the MC simulations for ionization energy densities above 10 MeV/mm [40]. The effect is more important for incident energies around 80 GeV, where it would result in a 2% lower energy reconstruction.
Results - The flux for each energy bin can be written as follows:
| (3) |
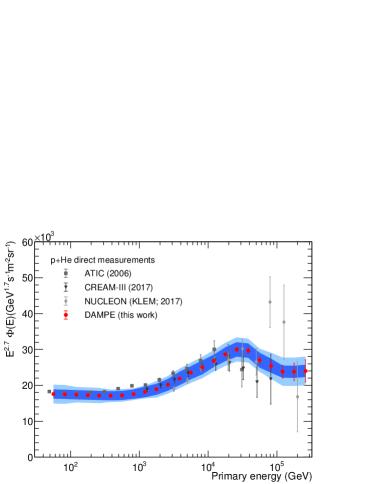
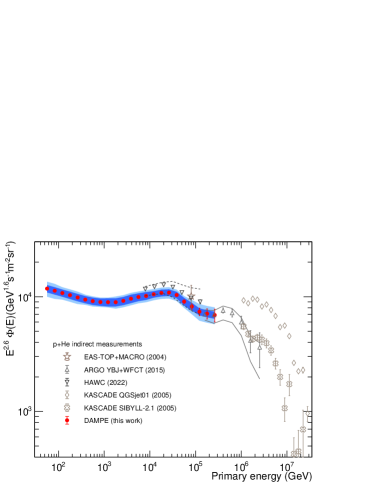
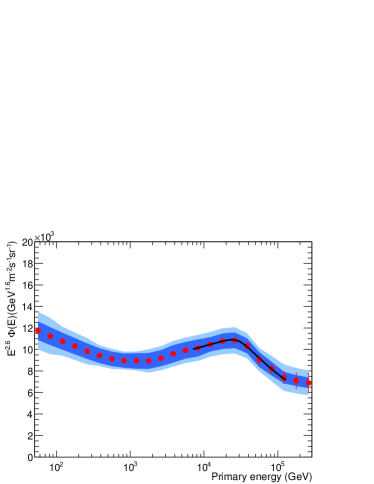
with the number of events in the i-th energy bin after the unfolding, the total live time, the acceptance in the i-th bin, and representing the width of the i-th energy interval. Figure 4 shows the p+He flux in the energy range 46 GeV - 316 TeV, multiplied by a power of the energy and compared with other direct (Fig. 4, left) and indirect (Fig. 4, right) p+He measurements. The 1 statistical uncertainties on DAMPE data are represented by error bars, while the continuous bands indicate the systematic uncertainties associated to the analysis procedure (inner band) and the total systematic uncertainties (outer band), including the one on the hadronic interaction model. The results are also reported in Table A1 of the appendix.
The statistical uncertainties are associated with the Poissonian fluctuations of the number of detected events and the MC sample. However, due to the unfolding process, this uncertainty cannot be directly translated into the incident energy bins. To achieve this, a batch of toy-MC samples is generated according to a Poisson distribution for each deposited energy bin. The fluxes are then obtained through the regular unfolding procedure, and their root mean square is taken as the 1 statistical error for each energy bin [11].
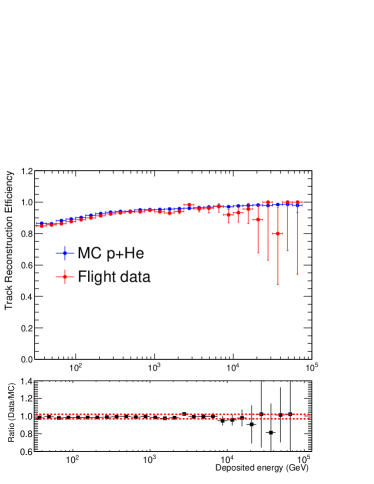
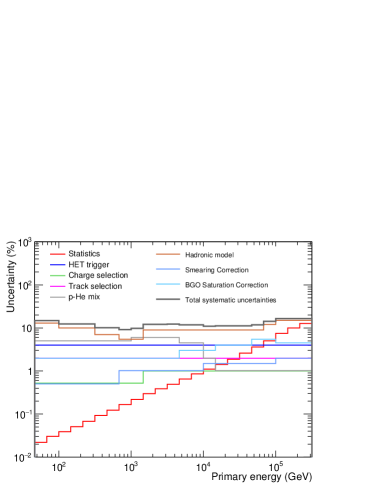
The systematic uncertainty band is the result of several contributions. The main contribution (up to 15%, for energy larger than 100 TeV) comes from the hadronic interaction model used for the MC simulation. The GEANT4-FTFPBERT model is found to be in better agreement with flight and test beam data [45, 23, 24], and is therefore chosen for the computation of the p+He spectrum. To quantify the uncertainty resulting from this choice, the p+He spectrum is computed also using the FLUKA DPMJET-3 model for helium and GEANT4-QGSPBERT for protons. The difference between the two spectra is used to estimate the uncertainty on the hadronic model. Additional contributions to the systematic uncertainties are given by the event selection procedure. In this case, selection efficiencies of MC and flight data are compared (more details are given in the appendix). Their difference is found to be 4% for the HET efficiency, 2% for the track selection efficiency, and a maximum of 3% for the charge selection efficiency at energies higher than 2 TeV, as shown in Figure A1, A2 and A3 of the appendix. The quadratic sum of the aforementioned differences in efficiencies (between MC and data) is taken as the systematic uncertainty of the acceptance, amounting to 5.4 % for energies higher than 2 TeV. Another source of uncertainties is the assumed proton and helium mixture in the simulation. In the energy range considered in this work, the abundance of proton and helium is of the same order of magnitude. For this reason, the spectrum was initially computed assuming the same amount of proton and helium (50% proton and 50% helium). Afterwards, the spectrum was obtained again by weighting the proton and helium MC samples, using a fit function to the DAMPE proton and helium spectrum, respectively [11, 17]. The difference between the spectra obtained with these two approaches is taken as a source of systematic uncertainty and results in 5% at low energy and 2% for energies higher than 10 TeV. The spectrum with 50% proton and 50% helium is taken as the final result, to avoid introducing any bias while still assuming the correct order of magnitude. For more information on the systematic uncertainties and their energy dependence please refer to Figure A5 of the appendix.
The proton+helium spectrum has been fitted with a smoothly-broken power-law (SBPL) function following a similar approach as the one used in [46, 36, 11, 17] (see details in the appendix). The result shows the presence of a spectral hardening around 600 GeV followed by a softening at 28.8 4.5 TeV, measured with a significance of 6.6. The hardening feature is in line with results obtained by other experiments [4, 5, 6, 7, 8, 9, 10, 47, 12, 2, 13, 3, 14] and previous results from DAMPE on proton [11] and helium [17] spectra. Moreover, DAMPE revealed a softening feature in both the proton and helium spectra [11, 17], further confirmed by the present analysis (the fit is shown in Figure A6 of the appendix). The spectral fit parameters obtained with the three analyses are reported in Tab. 1, where is the energy in which there is a change of slope in the spectrum, represents the spectral index before and the difference between the 2 indexes, before and after . The values suggest rigidity-dependent features, even though a mass dependence cannot be ruled out.
| Proton | Helium | Proton+Helium | |
|---|---|---|---|
| (TeV) | |||
The DAMPE p+He spectrum is in agreement with other direct-detection experiments, within the systematic uncertainties. The p+He spectrum was also compared with the sum of the DAMPE proton and helium spectra, showing good compatibility. The comparison with indirect measurements shows an overall consistency, although this picture will be clarified with further observations made by future space-borne experiments (e.g. HERD [48, 49]) along with a spectral extension at higher energies. The p+He spectrum shows a novel hint regarding a possible direct detection of a second hardening around 150 TeV, also suggested by preliminary results from the HAWC collaboration [50] and foreseen in [51].
Summary - The p+He spectrum was measured from 46 GeV to 316 TeV, using 72 months of data from the DAMPE satellite. The spectrum confirms the hardening and softening features, with the unprecedented significance of 6.6. The selection of proton+helium, instead of individual proton and helium contributions, allows the collection of additional statistics, thus reaching higher energies with low background. Consequently, these results provide a link between direct and indirect cosmic-ray measurements, exhibiting a good general agreement among very different techniques, and pointing out deviations from a simple power-law behavior.
Acknowledgments - The DAMPE mission was funded by the strategic priority science and technology projects in space science of Chinese Academy of Sciences (CAS). In China, the data analysis was supported by the National Key Research and Development Program of China (No. 2022YFF0503302) and the National Natural Science Foundation of China (Nos. 12220101003, 11921003, 11903084, 12003076 and 12022503), the CAS Project for Young Scientists in Basic Research (No. YSBR061), the Youth Innovation Promotion Association of CAS, the Young Elite Scientists Sponsorship Program by CAST (No. YESS20220197), and the Program for Innovative Talents and Entrepreneur in Jiangsu. In Europe, the activities and data analysis are supported by the Swiss National Science Foundation (SNSF), Switzerland, the National Institute for Nuclear Physics (INFN), Italy, and the European Research Council (ERC) under the European Union’s Horizon 2020 research and innovation programme (No. 851103).
I Appendix: Supplemental Material
I.1 Efficiency validations
I.1.1 HET and track efficiency
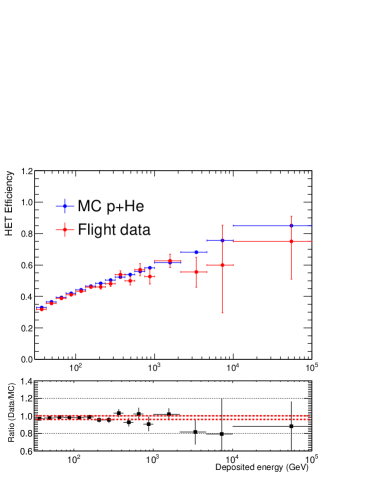
There are four implemented triggers for the DAMPE detector: the Unbiased Trigger (UNBT), the Minimum Ionizing Particle Trigger (MIPT), the Low Energy Trigger (LET) and the High Energy Trigger (HET) [31]. These triggers are subject to different pre-scaling factors depending on the latitude. The UNBT is the least restrictive and it is used to estimate the HET efficiency, which can be calculated as follows:
| (4) |
where is the number of events that pass both the HET and UNBT triggers. Figure A1 shows the HET efficiency as a function of the deposited energy in the BGO for MC simulations and flight data. The UNBT sample has a pre-scale factor of 1/512 (1/2048) when the satellite operates in (out of) the geographical latitude range [-20o; 20o]. Therefore, at high energies, the statistical uncertainties of the flight data are expected to be relatively large.
Tracks can be determined from hits in the STK and the BGO. However, the former is more precise and is therefore more commonly employed in standard analyses. The STK track efficiency is evaluated by selecting a sample of p and He based on the BGO tracks and PSD charge and considering only the events that pass the STK track selection. The STK track efficiency is given by:
| (5) |
where is the number of events selected with the BGO track that match the PSD charge, and is the number of events that pass the STK track selection cuts used in the present analysis. Figure A2 shows the track selection efficiency as a function of the deposited energy both for MC simulations and flight data.
I.1.2 Charge selection efficiency
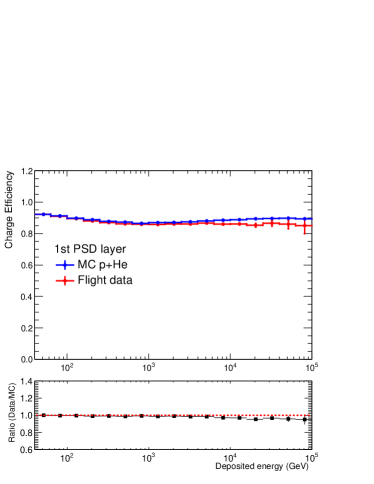
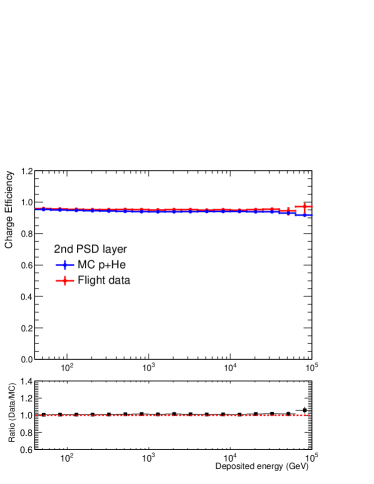
Charge selection efficiencies are calculated individually for each PSD layer, using the measurements coming from the first cluster point of the STK track. For example, the efficiency of the first PSD layer is determined by the ratio between the events selected using the charge of both PSD layers and the first cluster point of the STK track (), and the events selected using only the second PSD layer and the first cluster of STK track ():
| (6) |
An analogous method is used to compute the efficiency of the second layer. Figure A3 shows the charge selection efficiencies as a function of the deposited energy for each PSD layer.
I.2 Background contamination
Combining protons and helium in a single spectrum leaves a very low background, mainly constituted by electrons, positrons and lithium. Electron contamination is calculated by discriminating the morphology of proton-electron showers. The method is thoroughly described in [36]. The lithium background is estimated using the template fit of the energy released in the PSD, based on MC simulations of protons, helium and lithium. Figure A4 shows the estimated electron and lithium backgrounds, which are smaller than 0.4% up to 10 TeV, and equal to 1.6% for energy larger than 10 TeV.
I.3 Unfolded flux and systematic uncertainties
Table A1 shows the p+He flux, (see also Figure 4 of the main text [ref]). E, Elow and Ehigh are the median energy and bin edges of the corresponding flux . is the statistical error, and are the systematic uncertainties on the analysis procedure and on the hadronic model, respectively (see section of the main text [ref]). Figure A5 shows the statistical error and the relative uncertainty for each considered systematic effect, as described in the paper.
| E | Elow | Ehigh | |
| [GeV] | [GeV] | [GeV] | [GeV] |
| 56.23 | 46.42 | 68.13 | (3.31 0.00073 0.24 0.49) 10-01 |
| 82.54 | 68.13 | 100.00 | (1.17 0.00035 0.08 0.17) 10-01 |
| 121.15 | 100.00 | 146.78 | (4.12 0.0016 0.30 0.51) 10-02 |
| 177.83 | 146.78 | 215.44 | (1.45 0.0074 0.11 0.18) 10-02 |
| 261.02 | 215.44 | 316.23 | (5.13 0.0035 0.37 0.63) 10-03 |
| 383.12 | 316.23 | 464.16 | (1.81 0.0017 0.13 0.18) 10-03 |
| 562.34 | 464.16 | 681.29 | (6.46 0.0079 0.47 0.65) 10-04 |
| 825.40 | 681.29 | 1000.00 | (2.34 0.0039 0.17 0.22) 10-04 |
| 1211.53 | 1000.00 | 1467.80 | (8.60 0.019 0.69 0.84) 10-05 |
| 1778.28 | 1467.80 | 2154.44 | (3.17 0.0094 0.26 0.38) 10-05 |
| 2610.16 | 2154.44 | 3162.28 | (1.20 0.0046 0.10 0.15) 10-05 |
| 3831.19 | 3162.28 | 4641.59 | (4.63 0.023 0.39 0.57) 10-06 |
| 5623.42 | 4641.59 | 6812.92 | (1.76 0.012 0.14 0.21) 10-06 |
| 8254.04 | 6812.92 | 10000.00 | (6.65 0.057 0.52 0.79) 10-07 |
| 12115.28 | 10000.00 | 14678.00 | (2.53 0.028 0.16 0.28) 10-07 |
| 17782.80 | 14678.00 | 21544.35 | (0.96 0.014 0.06 0.11) 10-07 |
| 26101.58 | 21544.35 | 31622.79 | (3.57 0.067 0.24 0.40) 10-08 |
| 38311.88 | 31622.79 | 46415.90 | (1.25 0.033 0.08 0.14) 10-08 |
| 56234.15 | 46415.90 | 68129.23 | (4.04 0.15 0.31 0.48) 10-09 |
| 82540.44 | 68129.23 | 100000.03 | (1.35 0.068 0.10 0.19) 10-09 |
| 121152.80 | 100000.03 | 146779.97 | (4.49 0.33 0.32 0.74) 10-10 |
| 177827.99 | 146779.97 | 215443.53 | (1.59 0.16 0.11 0.26) 10-10 |
| 261015.80 | 215443.53 | 316227.88 | (5.70 0.73 0.40 0.95) 10-11 |
I.4 Spectral fitting
The proton+helium spectrum exhibits several features that are well described by a smoothly broken power law:
| (7) |
where is the flux normalization, the spectral index before the break energy (), the difference between the spectral index before and after the break, and s the smoothness of the break. To properly account for the systematic uncertainties, a set of independent nuisance parameters are adopted and multiplied to the input model, using a similar procedure as the one used in [46, 36, 11, 17]. The function is defined as follows:
| (8) |
where is the median energy, the flux in the i-th energy bin, is the model predicted flux in each corresponding energy bin, is a piece-wise function defined by its value in the corresponding energy range covered by the j-th nuisance parameter, represents the covariance matrix of the fluxes obtained from toy MC simulations when estimating the statistical uncertainties and is the relative systematic uncertainty of the data in such an energy range. The fit is performed in the energy range from 7 to 130 TeV, using 2 nuisance parameters. In order to account for the uncertainties on the fit parameters resulting from the selected hadronic model, the same fit is performed on the spectrum computed with MC samples simulated using the FLUKA DPMJET-3 and GEANT4-QGSP_BERT models. The difference between the two fits is taken as a second uncertainty on the parameters. The results of the fit are = (1.35 0.09) 10-4 GeV-1m-2s-1sr-1, = , = , EB = TeV, and /dof = 0.9/2. The parameter s was fixed to 5, which is consistent with the DAMPE proton and helium fit of the softening [11, 17] considering their combined smoothness. To estimate the significance of the softening, the same energy region has been fitted with a single power-law function, giving a result of /dof = 48.14/4, resulting in a significance of 6.63. The SBPL fit of the softening is shown in Figure A6.
References
- Aloisio et al. [2018] R. Aloisio, P. Blasi, I. De Mitri, and S. Petrera, Selected topics in cosmic ray physics, in Multiple Messengers and Challenges in Astroparticle Physics, edited by R. Aloisio, E. Coccia, and F. Vissani (Springer International Publishing, Cham, 2018) pp. 1–95.
- Panov and ten others [2009] A. D. Panov et al. (ATIC-2 Collaboration), Bulletin of the Russian Academy of Sciences: Physics 73, 564 (2009).
- Yoon and ten others [2017] Y. S. Yoon et al. (CREAM-III Collaboration), The Astrophysical Journal 839, 5 (2017).
- Adriani and ten others [2011] O. Adriani et al. (PAMELA Collaboration), Science 332, 69 (2011), https://www.science.org/doi/pdf/10.1126/science.1199172 .
- Adriani and ten others [2013] O. Adriani et al. (PAMELA Collaboration), Advances in Space Research 51, 219 (2013), the Origins of Cosmic Rays: Resolving Hess’s Century-Old Puzzle.
- Aguilar and ten others [2015a] M. Aguilar et al. (AMS Collaboration), Phys. Rev. Lett. 114, 171103 (2015a).
- Aguilar and ten others [2015b] M. Aguilar et al. (AMS Collaboration), Phys. Rev. Lett. 115, 211101 (2015b).
- Aguilar and ten others [2017] M. Aguilar et al. (AMS Collaboration), Phys. Rev. Lett. 119, 251101 (2017).
- Aguilar and ten others [2018] M. Aguilar et al. (AMS Collaboration), Phys. Rev. Lett. 120, 021101 (2018).
- Aguilar and ten others [2020] M. Aguilar et al. (AMS Collaboration), Phys. Rev. Lett. 124, 211102 (2020).
- An and ten others [2019] Q. An et al. (DAMPE Collaboration), Science Advances 5, eaax3793 (2019), https://www.science.org/doi/pdf/10.1126/sciadv.aax3793 .
- Adriani and ten others [2019] O. Adriani et al. (CALET Collaboration), Phys. Rev. Lett. 122, 181102 (2019).
- Ahn and ten others [2010] H. S. Ahn et al. (CREAM Collaboration), The Astrophysical Journal 714, L89 (2010).
- Atkin and ten others [2017] E. Atkin et al. (NUCLEON Collaboration), J. Cosmol. Astropart. Phys. 2017 (07), 020.
- Ahn and ten others [2006] H. Ahn et al. (ATIC Collaboration), Advances in Space Research 37, 1950 (2006).
- Alemanno and ten others [2022] F. Alemanno et al. (DAMPE Collaboration), Science Bulletin 67, 2162 (2022).
- Alemanno and ten others [2021] F. Alemanno et al. (DAMPE Collaboration), Phys. Rev. Lett. 126, 201102 (2021).
- Adriani and ten others [2022] O. Adriani et al. (CALET Collaboration), Phys. Rev. Lett. 129, 101102 (2022).
- Chang and ten others [2017] J. Chang et al. (DAMPE Collaboration), Astroparticle Physics 95, 6 (2017).
- Agostinelli and ten others [2003] S. Agostinelli et al., Nucl. Instrum. Meth. A 506, 250 (2003).
- Pierog and ten others [2015] T. Pierog et al., Phys. Rev. C 92, 034906 (2015).
- Tykhonov and ten others [2019] A. Tykhonov et al., PoS ICRC2019, 143 (2019).
- Wei and ten others [2019] Y. Wei et al., Nucl. Instrum. Meth. A 922, 177 (2019).
- Zhang and ten others [2020] Y. Zhang et al., Nucl. Instrum. Meth. A 953, 163139 (2020).
- Jiang and ten others [2020] W. Jiang et al., Chinese Physics Letters 37, 119601 (2020).
- Böhlen and ten others [2014] T. Böhlen et al., Nuclear Data Sheets 120, 211 (2014).
- Engel [1995] R. Engel, Z. Phys. C 66, 203 (1995).
- Roesler and ten others [2000] S. Roesler et al., in (MC 2000) (2000) pp. 1033–1038, arXiv:hep-ph/0012252 .
- Fedynitch [2015] A. Fedynitch, Cascade equations and hadronic interactions at very high energies, Ph.D. thesis, KIT, Karlsruhe, Dept. Phys. (2015).
- Ambrosi and ten others [2019] G. Ambrosi et al. (DAMPE Collaboration), Astroparticle Physics 106, 18 (2019).
- Zhang and ten others [2019] Y.-Q. Zhang et al., Res. Astron. Astrophys. 19, 123 (2019).
- Thébault and ten others [2015] E. Thébault et al., Earth, Planets and Space 67, 79 (2015).
- Tykhonov and ten others [2018] A. Tykhonov et al., Nucl. Instrum. Meth. A 893, 43 (2018).
- Dong and ten others [2019] T. Dong et al., Astroparticle Physics 105, 31 (2019).
- Ma and ten others [2019] P.-X. Ma et al., Res. Astron. Astrophys. 19, 082 (2019).
- Ambrosi and ten others [2017] G. Ambrosi et al. (DAMPE Collaboration), Nature (London) 552, 63 (2017), arXiv:1711.10981 [astro-ph.HE] .
- D’Agostini [1995] G. D’Agostini, Nucl. Instrum. Meth. A 362, 487 (1995).
- Yue and ten others [2020] C. Yue et al., Nucl. Instrum. Meth. A 984, 164645 (2020).
- Birks [1951] J. B. Birks, Proc. Phys. Soc. Sect. A 64, 874 (1951).
- Wei and ten others [2020] Y. Wei et al., IEEE Trans. Nucl. Sci. 67, 939 (2020).
- Bartoli and ten others [2015] B. Bartoli et al. (ARGO-YBJ Collaboration and LHAASO Collaboration), Phys. Rev. D 92, 092005 (2015).
- Albert and ten others [2022] A. Albert et al. (HAWC Collaboration), Phys. Rev. D 105, 063021 (2022).
- Antoni and ten others [2005] T. Antoni et al. (KASCADE Collaboration), Astroparticle Physics 24, 1 (2005).
- Aglietta and ten others [2004] M. Aglietta et al. (MACRO Collaboration and EAS-TOP Collaboration), Astroparticle Physics 21, 223 (2004).
- Vitillo [2018] S. Vitillo, Tracker charge identification and measurement of the proton flux in cosmic rays with the DAMPE experiment, Ph.D. thesis, University of Geneva (2018), ID: unige:113361.
- Abdollahi and ten others [2017] S. Abdollahi et al. (The Fermi-LAT Collaboration), Phys. Rev. D 95, 082007 (2017).
- Aguilar and ten others [2021] M. Aguilar et al. (AMS Collaboration), Phys. Rev. Lett. 126, 041104 (2021).
- Zhang and ten others [2014] S. N. Zhang et al. (HERD Collaboration), in Space Telescopes and Instrumentation 2014, Vol. 9144 (SPIE, 2014) pp. 293 – 301.
- Kyratzis [2022] D. Kyratzis, Physica Scripta 97, 054010 (2022).
- Abeysekara and ten others [2021] A. U. Abeysekara et al., PoS ICRC2021, 374 (2021).
- Yue et al. [2019] C. Yue, P.-X. Ma, Q. Yuan, Y.-Z. Fan, Z.-F. Chen, M.-Y. Cui, H.-T. Dai, T.-K. Dong, X. Huang, W. Jiang, et al., Frontiers of Physics 15, 10.1007/s11467-019-0946-8 (2019).