justified
Dynamical fluctuations in a minimal model of higher-order networks
Abstract
Although higher-order interactions are known to affect the typical state of dynamical processes giving rise to new collective behavior, how they drive the emergence of rare events and fluctuations is still an open problem. We investigate how fluctuations of a dynamical quantity of a random walk exploring a higher-order network arise over time. By focusing on a minimal model, we show that higher-order interactions always hamper the appearance of rare events, although the same structure facilitates visits of certain nodes, an event considered atypical on the corresponding system with only pairwise interactions. If the structure of interactions is not fixed but is optimally selected to favour a particular fluctuation, a phase transition emerges where a random walk is typically both homogeneously spread over the network and localised on a portion of it. Our study lays the groundwork for a wider and general theory of fluctuations and rare events in higher-order networks.
The appearance of fluctuations in dynamical processes is pivotal in determining the future evolution of many real-world systems [1]. The emergence of rare events may be bolstered or hindered by the hosting complex environment, which often can be conveniently modeled as a complex network [2, 3, 4]. Large fluctuations in complex networks have been studied across a variety of processes, including percolation [5, 6, 7, 8], spreading [9, 10], and transport [11, 12, 13, 14]. A stream of research has focused on random walks as a versatile model of diffusion in discrete spaces [15, 16, 17, 18, 19] and on their rare event properties [20, 21, 22]. Large deviation theory has revealed that low-degree nodes are more susceptible than hubs to the appearance of atypical loads, possibly leading to dynamical phase transitions [23, 24, 25, 26].
Despite their success, graphs can only provide a constrained description of real-world systems, as links are inherently limited to model pairwise interactions only [27, 28]. Yet, from social [29, 30, 31, 32] to biological [33, 34, 35, 36] networks, in a wide variety of real-word systems interactions may occur among three or more units at a time. In recent years, hypergraphs [37] have emerged as a versatile tool to model systems with such higher-order interactions. Interestingly, taking into account higher-order interactions has shown to lead to new collective phenomena in a variety of dynamical processes [38], including diffusion [39, 40], contagion [41, 42, 43], synchronization [44, 45, 46, 47, 48] and evolutionary games [49, 50, 51]. While such studies have focused on characterising dynamical behavior at the typical state, understanding fluctuations and rare events statistics driven by the presence of higher-order interactions is to this day still an open problem.
To this end, in this work we propose a study of fluctuations and rare events on higher-order networks using large-deviation theory tools. We focus on random walks on higher-order networks and on a particular time-additive observable that monitors the time the random walker spends in a certain region (core) of the hypergraph. Our study reveals how fluctuations arise in time for a random walk on a fixed hypergraph structure (quenched case), and which higher-order structure is optimal to achieve them (annealed case). We show that in the quenched case fluctuations of the core occupation time are always hampered by the higher-order structure, while the same higher-order interactions are best to visit nodes that would not be typically visited on the corresponding system with only pairwise interactions. In the annealed case, when the structure of interactions is not a-priori fixed, a phase transition arises between a typically homogeneously-spread random walk and a random walk more localised on subportions of the hypergraph.
Model
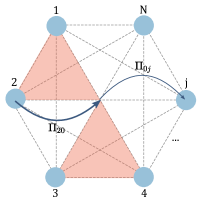
We introduce a hypergraph , where represents the set of nodes, and the set of hyperedges, i.e., is an unordered collection of nodes belonging to the same hyperedge . We consider in particular an illustrative structure consisting of a core node, labelled , connected with peripheral nodes through a varying number of higher-order connections, labelled by . As shown in Fig. 1, the graph is composed by nodes, a fully connected pairwise structure, i.e. binary edges for and , and a binomially-distributed random number of parameter of three-body interactions where is an odd node and , i.e., all triangular interactions are centered in . Intuitively, the higher the number of higher-order interactions the better connected the core node is with the periphery of the hypergraph. For simplicity, in the following we constrain the higher-order structure so that each peripheral node can participate in at most one three-body interaction. As we will show, for this symmetric model, non-pairwise interactions affect the statistics of the core occupation time only through their total number . In particular, the probability of drawing a hypergraph with a number of three-body interactions is given by
| (1) |
This minimal model is no special with regards to our findings below—it only simplifies calculations. We have checked this numerically with hypergraphs that allow for overlapping three-body interactions and since results do not qualitatively change we have decided to not include them. In summary, for the model we consider here, comes as an instance of an ensemble of hypergraphs whose higher-order structure is fully described by two parameters only, namely, and .
We consider on a discrete-time random walk , where is the node where the random walk sits at time [40]. The random walk is characterized by an unbiased dynamics encoded in the transition matrix whose entries are
| (2) |
where represents the hyperdegree, i.e., the number of nodes, excluding , that are present in the hyperedges that are common to and . As the random walk explores the graph, it collects information in the form of the time-additive observable
| (3) |
which measures the fraction of time the random walk has spent on the core node up to time . Typically, for a very long time, for a number of higher-order interactions the fraction of time the walker spends in can be calculated [40] and reads
| (4) |
The higher the number of triangular interactions, the better connected is the core with the periphery of the graph, and the longer the time the random walk will spend on .
We consider dynamical fluctuations in two different physical scenarios. First, we study the mean behavior of rare events of over the ensemble of hypergraphs (quenched case). Then, at the expense of an entropic cost associated with the logarithm of in (1), we let the random walk choose the optimal hypergraph that generates a particular atypical fluctuation of (annealed case).
Quenched fluctuations
Here, we study fluctuations of , which play a crucial role in the finite-time evolution of real-world systems, using large deviation theory [52, 53, 54]. This is possible because the leading scaling behavior of the probability distribution is exponential in time, i.e.,
| (5) |
where is the non-negative large-deviation rate function and denotes sub-linear corrections in . Further notice the subscript which refers to the fact that, at this stage, we are studying fluctuations of on a fixed graph with higher-order interactions. To understand rare events, we need to calculate in (5). However, evaluating directly is often non-trivial, hence we resort to a change of ensemble in order to get more meaningful information on fluctuations. To this end, we introduce the Scaled Cumulant Generating Function (SCGF)
| (6) |
which characterizes the leading exponential behavior of the moment generating function associated with . For finite and connected hypergraphs, is analytic, and one can calculate with a procedure described in the Gartner–Ellis theorem [55, 52, 53, 54] that makes use of the Legendre–Fenchel transform
| (7) |
which links the Laplace parameter with a fluctuation via
| (8) |
Because the random walk is ergodic, the SCGF can be obtained spectrally as
| (9) |
where , computed numerically, is the dominant eigenvalue of the so-called tilted matrix
| (10) |
To account for average properties of the ensemble of hypergraphs considered, one can take a quenched average over the disorder—here characterized by the number of higher-order interactions—of the function . Recalling that is a binomially distributed random variable with parameter and that the maximum number of higher-order interactions is , the quenched average can explicitly be written as
| (11) |
where q stands for quenched. 111Remarkably, the quenched average (11) takes such a simplified form because for a fixed number of higher-order interactions we have only one possible transition matrix. However, we note that more complicated models might lead to different disorder configurations and therefore different transition matrices. In the latter case, to disentangle disorder and dynamics one would need to carefully study combinatorially how many different configurations arise by fixing . Given in (11), the quenched rate function can be obtained via a Legendre–Fenchel transform of (rather than ) in (7).
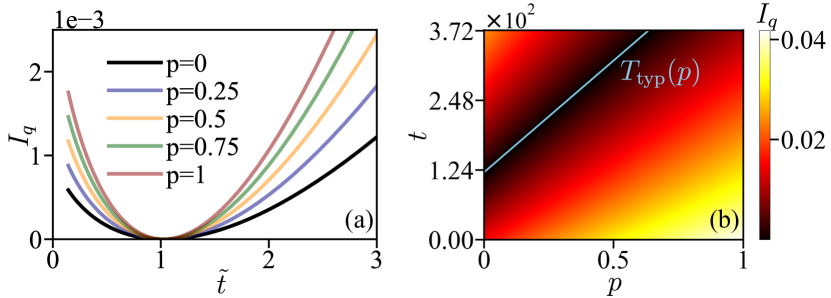
To understand the role of higher-order interactions, we first look at whether fluctuations, of the same magnitude but for different values of , are more or less likely to appear on higher-order networks generated with different values of . To understand this, we re-scale in with the typical fraction of time spent in by the random walk at a fixed parameter , namely , obtained by averaging (4) over . In Fig. 2(a) we plot the rate functions for different values of and compare them with the rate function for a graph with no higher-order interactions ( case). Because of the re-scaling, all rate functions are at the typical value . The likelihood is encoded in the shape of the rate function branches, the higher (lower) the branch the exponentially-less (more) likely is a fluctuation to appear. We note that for , higher-order interactions always hinder fluctuations away from the typical value, making it harder for the random walk to visit a core-localized or periphery-delocalized phase in the fluctuations. This is because with increasing the average number of higher-order interactions pointing to node grows generating a ‘containment’ effect on the dynamics. As a direct consequence escaping from node is made harder and dynamical fluctuations are (exponentially) suppressed.
In Fig. 2(b), we also look at how, for a fluctuation of for the random walk on the graph with only pairwise interactions, the large deviation rate function changes with increasing . On the one hand, what is typical for the case becomes more and more atypical with increasing . On the other hand, rare values of greater than the typical one for the case , can become typical just by increasing the number of higher-order interactions. On the opposite, rare values of smaller than the typical one, become only more atypical by introducing higher-order interactions. In other words, by introducing higher-order interactions on a fully-pairwise network we make it easier for the random walk to spend more (less) time on the core (peripheral) node(s).
Annealed fluctuations
We have hitherto considered the higher-order interaction structure of the hypergraph and the dynamics as two distinct objects and have studied how the dynamics itself is influenced by a fixed underlying structure. However, in a variety of real-world systems, structure and dynamics are characterised by a tight interplay [57]. In such a scenario, fluctuations arising for a dynamical observable, such as , will be sustained by an optimal, i.e., the most likely one in probability terms, underlying structure. Motivated by this, in the following we make use of our model to investigate how and which higher-order interactions can be considered optimal for realising a fluctuation of our dynamical observable.
In practice, we calculate annealed averages of the moment generating function over the disorder as follows:
| (12) |
where we remind the reader that fixing corresponds to fixing (on average) according to (8). By considering both the long-time and large-graph (and hence large ) asymptotics, and introducing the re-scaled parameter , we approximate in (12) with its saddle-point solution for as
| (13) |
where we call annealing parameter and is the saddle-point solution, i.e. the most probable fraction of higher-order interactions appearing that generates the fluctuation . We only consider the leading exponential behaviour in of (13), i.e.,
| (14) |
whose Legendre–Fenchel transform is obtained replacing with in (7). The annealing parameter plays a key role. On the one hand, in the limit the hypergraph size blows up and, because the disorder is self-averaging, all probability concentrates around the typical number of higher-order interactions, hence recovering the quenched average (11) for a fixed . [Notice however that it is only in the limit that the quenched average is recovered because the disorder is self-averaging. Indeed, for small but finite spurious contributions of appear at exponent in (13) and shift upwards.] On the other hand, for the hypergraph size, although large, does not blow up and therefore disorder and dynamics ‘interact’ at the saddle-point solution of (13) selecting the most likely structure that realises the fluctuation associated to . We refer to as the annealed SCGF and to as the annealed rate function which characterises the leading exponential behaviour of the probability distribution of in such a scenario. Notice that all intermediate values of do not necessarily define a good SCGF.222More explicitly, a large deviation principle for , similar in form to (5), does not hold for all values of . In particular, for finite and small, one has and therefore the ergodicity assumption necessary to derive falls. It is only for and large that we get a good approximation—exact in the limit —for the distribution of .
In Fig. 3(a) we plot for several values of . As expected, for small we retrieve the quenched rate function (for the same parameter used here) which is realised by the typical number of higher-order interactions throughout all fluctuations (see Fig. 3(b)). As we increase , the function tends to flatten, and in the limit the annealed rate function develops a plateau of zeros.333That an annealed rate function is a lower bound of a quenched one is known in the mathematics literature [63, 64, 65, 66]. Intuitively, this is consequence of picking an optimal structure to generate fluctuations in the dynamics rather than having it fixed as in the quenched case. We characterise this behaviour as a phase transition, which can be well understood by looking at the optimal values that are selected in the limit . Indeed, as one slightly moves from the typical scenario and looks into fluctuations for either or the structure optimally realising such fluctuations abruptly changes from, respectively, a graph with no higher-order interactions to a structure that maximizes their number. This comes as a consequence of our previous observations: considering the case with no higher-order interactions as the reference one, fluctuations on the right of the typical value, i.e., , are boosted by having more triangles on the graph, also hampering fluctuations on the left, i.e., (see Fig. 2(b)). Despite the non-singleton set of zeros of , we remark that not all values of can be considered typical: only those created by the most likely disorder configurations—sitting at the extreme values of the plateau—will be.
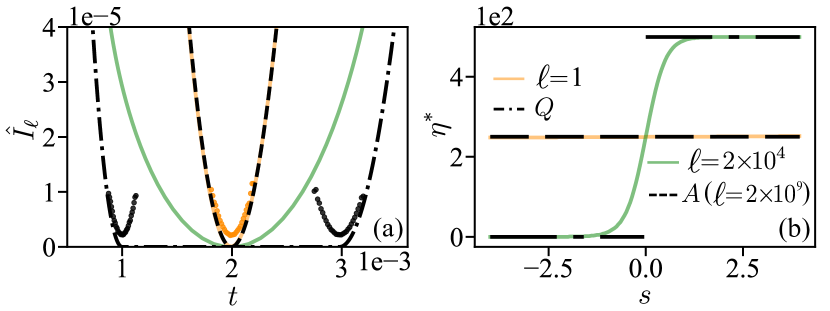
To validate our argument, always in Fig. 3(a) we plot Monte-Carlo (MC) simulations as coloured dots for three different scenarios of random walks exploring a graph with no (left-most black), max (right-most black), and half-max (orange) number of higher-order interactions. By nature, MC simulations for finite time underestimates the true probability (the dots do not touch the abscissa) and can only show small fluctuations from the typical value. However, simulations seem to fully agree with our description. Orange dots well describe the shape of the quenched rate function close to its minimum. Bearing in mind that is only the convex hull of the real annealed rate function, black dots describe as well the two different extreme—although always typical—behaviour appearing as a consequence of annealing the dynamics through the disorder of higher-order interactions. The structural phase transition signals the appearance of multiple typical states between two extreme values for the random walk exploring our hypergraph , namely (i) a regime where the random walk is well spread over the whole graph, and (ii) a regime where the random walk spends three times as much time on the core node because of many higher-order interactions driving it there.
Conclusion
In summary, we have presented an original study of dynamical fluctuations for a stochastic process exploring a network with higher-order interactions. For simplicity we have considered a model of a fully-connected pairwise graph with additional random higher-order interactions connecting a core with peripheral nodes. By using spectral methods of large deviation theory we have derived the leading exponential scaling of fluctuations for a dynamical observable, here considered to be the mean fraction of time the random walk spends on the core. We have first focused on the (quenched) case of a fixed topology, finding that a network with higher-order interactions always inhibit random walk fluctuations. However, this same network facilitates visits of the core, an event considered atypical on the fully-pairwise network. We have then considered the (annealed) case where the random walk dynamics select the optimal structure that realises a particular fluctuation. Our analysis reveals the emergence of a phase transition characterised by two typical regimes: a random walk visiting all nodes homogeneously, and another walk spending a much bigger portion of time on the core node of the graph.
An interesting open problem is to characterise the appearance of fluctuations for co-evolving systems, a setting where both the random walk and topology evolve on a similar time scale [60], to better understand which physical processes lead to the selection of optimal higher-order structures. Similarly, additional insights might originate from considering more complex higher-order structures, such as hypergraphs displaying a broad distribution of higher-order interactions [61] or community structure [62]. Finally, an interesting question is whether considering not only complex higher-order structures, but also how complex pairwise connectivity patterns enhances or hinders dynamical fluctuations, and—in the case of the former—which exact organization maximizes the appearance of rare events. Higher-order interactions are known to give rise to new collective behavior, affecting the typical state of several processes, including spreading [41] and synchronization [47]. Hence, beyond diffusive dynamics, our study lays the groundwork for a wider and general theory of rare events in higher-order networks, a necessary step towards understanding the finite-time evolution of real-world systems.
The authors are grateful to Pierpaolo Vivo and Hugo Touchette for valuable feedback during the writing stage of the manuscript.
References
- Albeverio et al. [2006] S. Albeverio, V. Jentsch, and H. Kantz, eds., Extreme Events in Nature and Society, The Frontiers Collection (Springer Berlin Heidelberg, 2006).
- Barrat et al. [2008] A. Barrat, M. Barthélemy, and A. Vespignani, Dynamical Processes on Complex Networks (Cambridge University Press, 2008) pp. 1–347.
- Newman [2010] M. E. J. Newman, Networks: An Introduction (Oxford University Press, 2010) pp. 1–784.
- Latora et al. [2017] V. Latora, V. Nicosia, and G. Russo, Contemporary Physics (Cambridge University Press, 2017) p. 575.
- Bianconi [2017] G. Bianconi, Fluctuations in percolation of sparse complex networks, Physical Review E 96, 012302 (2017).
- Bianconi [2018] G. Bianconi, Rare events and discontinuous percolation transitions, Physical Review E 97, 022314 (2018).
- Coghi et al. [2019] F. Coghi, J. Morand, and H. Touchette, Large deviations of random walks on random graphs, Physical Review E 99, 022137 (2019).
- Kumar et al. [2020] A. Kumar, S. Kulkarni, and M. S. Santhanam, Extreme events in stochastic transport on networks, Chaos: An Interdisciplinary Journal of Nonlinear Science 30, 043111 (2020).
- Hindes and Schwartz [2016] J. Hindes and I. B. Schwartz, Epidemic extinction and control in heterogeneous networks, Physical Review Letters 117, 028302 (2016).
- Hindes and Schwartz [2017] J. Hindes and I. B. Schwartz, Large order fluctuations, switching, and control in complex networks, Scientific Reports 7, 1 (2017).
- Chen et al. [2014] Y. Z. Chen, Z. G. Huang, and Y. C. Lai, Controlling extreme events on complex networks, Scientific Reports 4, 1 (2014).
- Chen et al. [2015] Y. Z. Chen, Z. G. Huang, H. F. Zhang, D. Eisenberg, T. P. Seager, and Y. C. Lai, Extreme events in multilayer, interdependent complex networks and control, Scientific Reports 5, 1 (2015).
- Staffeldt and Hartmann [2019] W. Staffeldt and A. K. Hartmann, Rare-event properties of the Nagel-Schreckenberg model, Physical Review E 100, 062301 (2019).
- Gupta and Santhanam [2021] K. Gupta and M. S. Santhanam, Extreme events in Nagel–Schreckenberg model of traffic flow on complex networks, The European Physical Journal Special Topics 230, 3201 (2021).
- Noh and Rieger [2004] J. D. Noh and H. Rieger, Random walks on complex networks, Physical Review Letters 92, 118701 (2004).
- Rosvall et al. [2005] M. Rosvall, A. Trusina, P. Minnhagen, and K. Sneppen, Networks and cities: An information perspective, Physical Review Letters 94, 028701 (2005).
- Gómez-Gardeñes and Latora [2008] J. Gómez-Gardeñes and V. Latora, Entropy rate of diffusion processes on complex networks, Physical Review E 78, 065102 (2008).
- Burda et al. [2009] Z. Burda, J. Duda, J. M. Luck, and B. Waclaw, Localization of the maximal entropy random walk, Physical Review Letters 102, 160602 (2009).
- Sinatra et al. [2011] R. Sinatra, J. Gómez-Gardeñes, R. Lambiotte, V. Nicosia, and V. Latora, Maximal-entropy random walks in complex networks with limited information, Physical Review E 83, 030103 (2011).
- Kishore et al. [2011] V. Kishore, M. S. Santhanam, and R. E. Amritkar, Extreme events on complex networks, Physical Review Letters 106, 188701 (2011).
- Kishore et al. [2012] V. Kishore, M. S. Santhanam, and R. E. Amritkar, Extreme events and event size fluctuations in biased random walks on networks, Physical Review E - Statistical, Nonlinear, and Soft Matter Physics 85, 056120 (2012).
- Gandhi and Santhanam [2022] G. Gandhi and M. S. Santhanam, Biased random walkers and extreme events on the edges of complex networks, Physical Review E 105, 014315 (2022).
- De Bacco et al. [2016] C. De Bacco, A. Guggiola, R. Kühn, and P. Paga, Rare events statistics of random walks on networks: localisation and other dynamical phase transitions, Journal of Physics A: Mathematical and Theoretical 49, 184003 (2016).
- Coghi et al. [2018] F. Coghi, F. Radicchi, and G. Bianconi, Controlling the uncertain response of real multiplex networks to random damage, Physical Review E 98, 062317 (2018).
- Gutierrez and Perez-Espigares [2021] R. Gutierrez and C. Perez-Espigares, Generalized optimal paths and weight distributions revealed through the large deviations of random walks on networks, Physical Review E 103, 022319 (2021).
- Carugno et al. [2022] G. Carugno, P. Vivo, and F. Coghi, Delocalization-localization dynamical phase transition of random walks on graphs 10.48550/arxiv.2206.09866 (2022).
- Battiston et al. [2020] F. Battiston, G. Cencetti, I. Iacopini, V. Latora, M. Lucas, A. Patania, J.-G. Young, and G. Petri, Networks beyond pairwise interactions: structure and dynamics, Physics Reports 874, 1 (2020).
- Battiston and Petri [2022] F. Battiston and G. Petri, Higher-Order Systems (Springer, 2022).
- Patania et al. [2017] A. Patania, G. Petri, and F. Vaccarino, The shape of collaborations, EPJ Data Science 6, 1 (2017).
- Benson et al. [2018] A. R. Benson, R. Abebe, M. T. Schaub, A. Jadbabaie, and J. Kleinberg, Simplicial closure and higher-order link prediction, Proceedings of the National Academy of Sciences 115, E11221 (2018).
- Cencetti et al. [2021] G. Cencetti, F. Battiston, B. Lepri, and M. Karsai, Temporal properties of higher-order interactions in social networks, Scientific Reports 11, 1 (2021).
- Musciotto et al. [2022] F. Musciotto, D. Papageorgiou, F. Battiston, and D. R. Farine, Beyond the dyad: uncovering higher-order structure within cohesive animal groups, bioRxiv (2022).
- Klamt et al. [2009] S. Klamt, U.-U. Haus, and F. Theis, Hypergraphs and cellular networks, PLOS Computational Biology 5, e1000385 (2009).
- Petri et al. [2014] G. Petri, P. Expert, F. Turkheimer, R. Carhart-Harris, D. Nutt, P. J. Hellyer, and F. Vaccarino, Homological scaffolds of brain functional networks, Journal of The Royal Society Interface 11, 20140873 (2014).
- Giusti et al. [2016] C. Giusti, R. Ghrist, and D. S. Bassett, Two’s company, three (or more) is a simplex, Journal of Computational Neuroscience 41, 1 (2016).
- Zimmer et al. [2016] A. Zimmer, I. Katzir, E. Dekel, A. E. Mayo, and U. Alon, Prediction of multidimensional drug dose responses based on measurements of drug pairs, Proceedings of the National Academy of Sciences 113, 10442 (2016).
- Berge [1973] C. Berge, Graphs and hypergraphs (North-Holland Pub. Co., 1973).
- Battiston et al. [2021] F. Battiston, E. Amico, A. Barrat, G. Bianconi, G. Ferraz de Arruda, B. Franceschiello, I. Iacopini, S. K’efi, V. Latora, Y. Moreno, et al., The physics of higher-order interactions in complex systems, Nature Physics 17, 1093 (2021).
- Schaub et al. [2020] M. T. Schaub, A. R. Benson, P. Horn, G. Lippner, and A. Jadbabaie, Random walks on simplicial complexes and the normalized hodge 1-laplacian, SIAM Review 62, 353 (2020).
- Carletti et al. [2020] T. Carletti, F. Battiston, G. Cencetti, and D. Fanelli, Random walks on hypergraphs, Physical Review E 101, 022308 (2020).
- Iacopini et al. [2019] I. Iacopini, G. Petri, A. Barrat, and V. Latora, Simplicial models of social contagion, Nature Communications 10, 1 (2019).
- Neuh”auser et al. [2020] L. Neuh”auser, A. Mellor, and R. Lambiotte, Multibody interactions and nonlinear consensus dynamics on networked systems, Physical Review E 101, 032310 (2020).
- Ferraz de Arruda et al. [2023] G. Ferraz de Arruda, G. Petri, P. M. Rodriguez, and Y. Moreno, Multistability, intermittency, and hybrid transitions in social contagion models on hypergraphs, Nature Communications 14, 1375 (2023).
- Lucas et al. [2020] M. Lucas, G. Cencetti, and F. Battiston, Multiorder laplacian for synchronization in higher-order networks, Physical Review Research 2, 033410 (2020).
- Skardal and Arenas [2020] P. S. Skardal and A. Arenas, Higher order interactions in complex networks of phase oscillators promote abrupt synchronization switching, Communications Physics 3, 1 (2020).
- Mill’an et al. [2020] A. P. Mill’an, J. J. Torres, and G. Bianconi, Explosive higher-order kuramoto dynamics on simplicial complexes, Physical Review Letters 124, 218301 (2020).
- Gambuzza et al. [2021] L. V. Gambuzza, F. Di Patti, L. Gallo, S. Lepri, M. Romance, R. Criado, M. Frasca, V. Latora, and S. Boccaletti, Stability of synchronization in simplicial complexes, Nature Communications 12, 1 (2021).
- Zhang et al. [2023] Y. Zhang, M. Lucas, and F. Battiston, Higher-order interactions shape collective dynamics differently in hypergraphs and simplicial complexes, Nature Communications 14, 1605 (2023).
- Alvarez-Rodriguez et al. [2021] U. Alvarez-Rodriguez, F. Battiston, G. F. de Arruda, Y. Moreno, M. Perc, and V. Latora, Evolutionary dynamics of higher-order interactions in social networks, Nature Human Behaviour 5, 586 (2021).
- Civilini et al. [2021] A. Civilini, N. Anbarci, and V. Latora, Evolutionary game model of group choice dilemmas on hypergraphs, Physical Review Letters 127, 268301 (2021).
- Civilini et al. [2023] A. Civilini, O. Sadekar, F. Battiston, J. Gómez-Gardeñes, and V. Latora, Explosive cooperation in social dilemmas on higher-order networks, arXiv preprint arXiv:2303.11475 (2023).
- den Hollander [2000] F. den Hollander, Large Deviations (American Mathematical Society, 2000).
- Touchette [2009] H. Touchette, The large deviation approach to statistical mechanics, Physics Reports 478, 1 (2009).
- Dembo and Zeitouni [2010] A. Dembo and O. Zeitouni, Large Deviations Techniques and Applications, Stochastic Modelling and Applied Probability, Vol. 38 (Springer Berlin Heidelberg, 2010).
- Ellis [1985] R. S. Ellis, Entropy, Large Deviations, and Statistical Mechanics, Classics in Mathematics (Springer New York, 1985).
- Note [1] Remarkably, the quenched average (11\@@italiccorr) takes such a simplified form because for a fixed number of higher-order interactions we have only one possible transition matrix. However, we note that more complicated models might lead to different disorder configurations and therefore different transition matrices. In the latter case, to disentangle disorder and dynamics one would need to carefully study combinatorially how many different configurations arise by fixing .
- Gross and Blasius [2007] T. Gross and B. Blasius, Adaptive coevolutionary networks: a review, Journal of The Royal Society Interface 5, 259 (2007).
- Note [2] More explicitly, a large deviation principle for , similar in form to (5\@@italiccorr), does not hold for all values of .
- Note [3] That an annealed rate function is a lower bound of a quenched one is known in the mathematics literature [63, 64, 65, 66]. Intuitively, this is consequence of picking an optimal structure to generate fluctuations in the dynamics rather than having it fixed as in the quenched case.
- Zimmermann et al. [2004] M. G. Zimmermann, V. M. Egu’ıluz, and M. San Miguel, Coevolution of dynamical states and interactions in dynamic networks, Physical Review E 69, 065102 (2004).
- Kovalenko et al. [2021] K. Kovalenko, I. Sendina-Nadal, N. Khalil, A. Dainiak, D. Musatov, A. M. Raigorodskii, K. Alfaro-Bittner, B. Barzel, and S. Boccaletti, Growing scale-free simplices, Communications Physics 4, 43 (2021).
- Contisciani et al. [2022] M. Contisciani, F. Battiston, and C. De Bacco, Inference of hyperedges and overlapping communities in hypergraphs, Nature Communications 13, 7229 (2022).
- Greven and den Hollander [1994] A. Greven and F. den Hollander, Large deviations for a random walk in random environment, Annals of Probability 22, 1381 (1994).
- Comets et al. [2000] F. Comets, N. Gantert, and O. Zeitouni, Quenched, annealed and functional large deviations for one-dimensional random walk in random environment, Probability Theory and Related Fields 118, 65 (2000).
- Varadhan [2003] S. R. Varadhan, Large deviations for random walks in a random environment, Communications on Pure and Applied Mathematics 56, 1222 (2003).
- Zeitouni [2006] O. Zeitouni, Random walks in random environments, Journal of Physics A: Mathematical and General 39, R433 (2006).