Pressure evolution of electronic and crystal structure of non-centrosymmetric EuCoGe3
Abstract
We report on the pressure evolution of the electronic and crystal structures of the non-centrosymmetric antiferromagnet EuCoGe3. Using a diamond anvil cell, we performed high pressure fluorescence detected near-edge x-ray absorption spectroscopy at the Eu , Co , and Ge edges and synchrotron powder x-ray diffraction. In the Eu spectrum, both divalent and trivalent Eu peaks are observed from the lowest pressure measurement (2 GPa). By increasing pressure, the relative intensity of the trivalent Eu peak increases, and an average Eu valence continuously increases from 2.2 at 2 GPa to 2.31 at 50 GPa. On the other hand, no discernible changes are observed in the Co and Ge spectra as a function of pressure. With the increase in pressure, lattice parameters continuously decrease without changing symmetry. Our study revealed a robust divalent Eu state and an unchanged crystal symmetry of EuCoGe3 against pressure.
I Introduction
Intermetallic compounds with lanthanoids host various fascinating phenomena, such as heavy fermion behavior, spin/charge ordering, Kondo effect, and superconductivity, originating from an interplay of strongly correlated electrons and itinerant conduction electrons [1, 2]. A plethora of ternary lanthanoid transition metal silicides/germanides crystallize with the ThCr2Si2-type structure () [3], for instance, the first heavy fermion superconductor CeCu2Si2 [4] and the quantum critical Kondo lattice YbRh2Si2 [5, 6]. In isostructural europium-based silicides, Eu ions bear a divalent valence state Eu2+ (4f7, = 7/2) that favors an antiferromagnetic ground state [7, 8, 9]. However, the energy difference between Eu2+ and nonmagnetic Eu3+ (4f6, = 0) valence states is not very large [10] and can be tuned by applying pressure and/or by chemical substitutions. Applying pressure or substituting smaller ions tend to increase the antiferromagnetic transition temperature (), followed by a sudden disappearance of magnetic moments and a valence crossover at a critical pressure. Indeed, a pressure-induced Eu valence transition with a simultaneous collapse of antiferromagnetism was reported for Eu(Pd0.8Au0.2)2Si2 [7], EuNi2Si2 [8], and EuRh2Si2 [9], and a substitution-induced valence transition was found in EuNi2(Ge1-xSix)2 [11] and Eu(Pt1-xNix)2Si2 [12]. Due to the different ionic radii of Eu2+ and Eu3+ ions [13], the Eu valence transition and the ground state properties in such systems are usually discussed in relation to the lattice volume. It has been established that compounds with a large unit cell volume possess an antiferromagnetic ground state with Eu2+ ions, while materials with a small unit cell volume exhibit a nonmagnetic ground state with Eu3+ ions[14, 15].
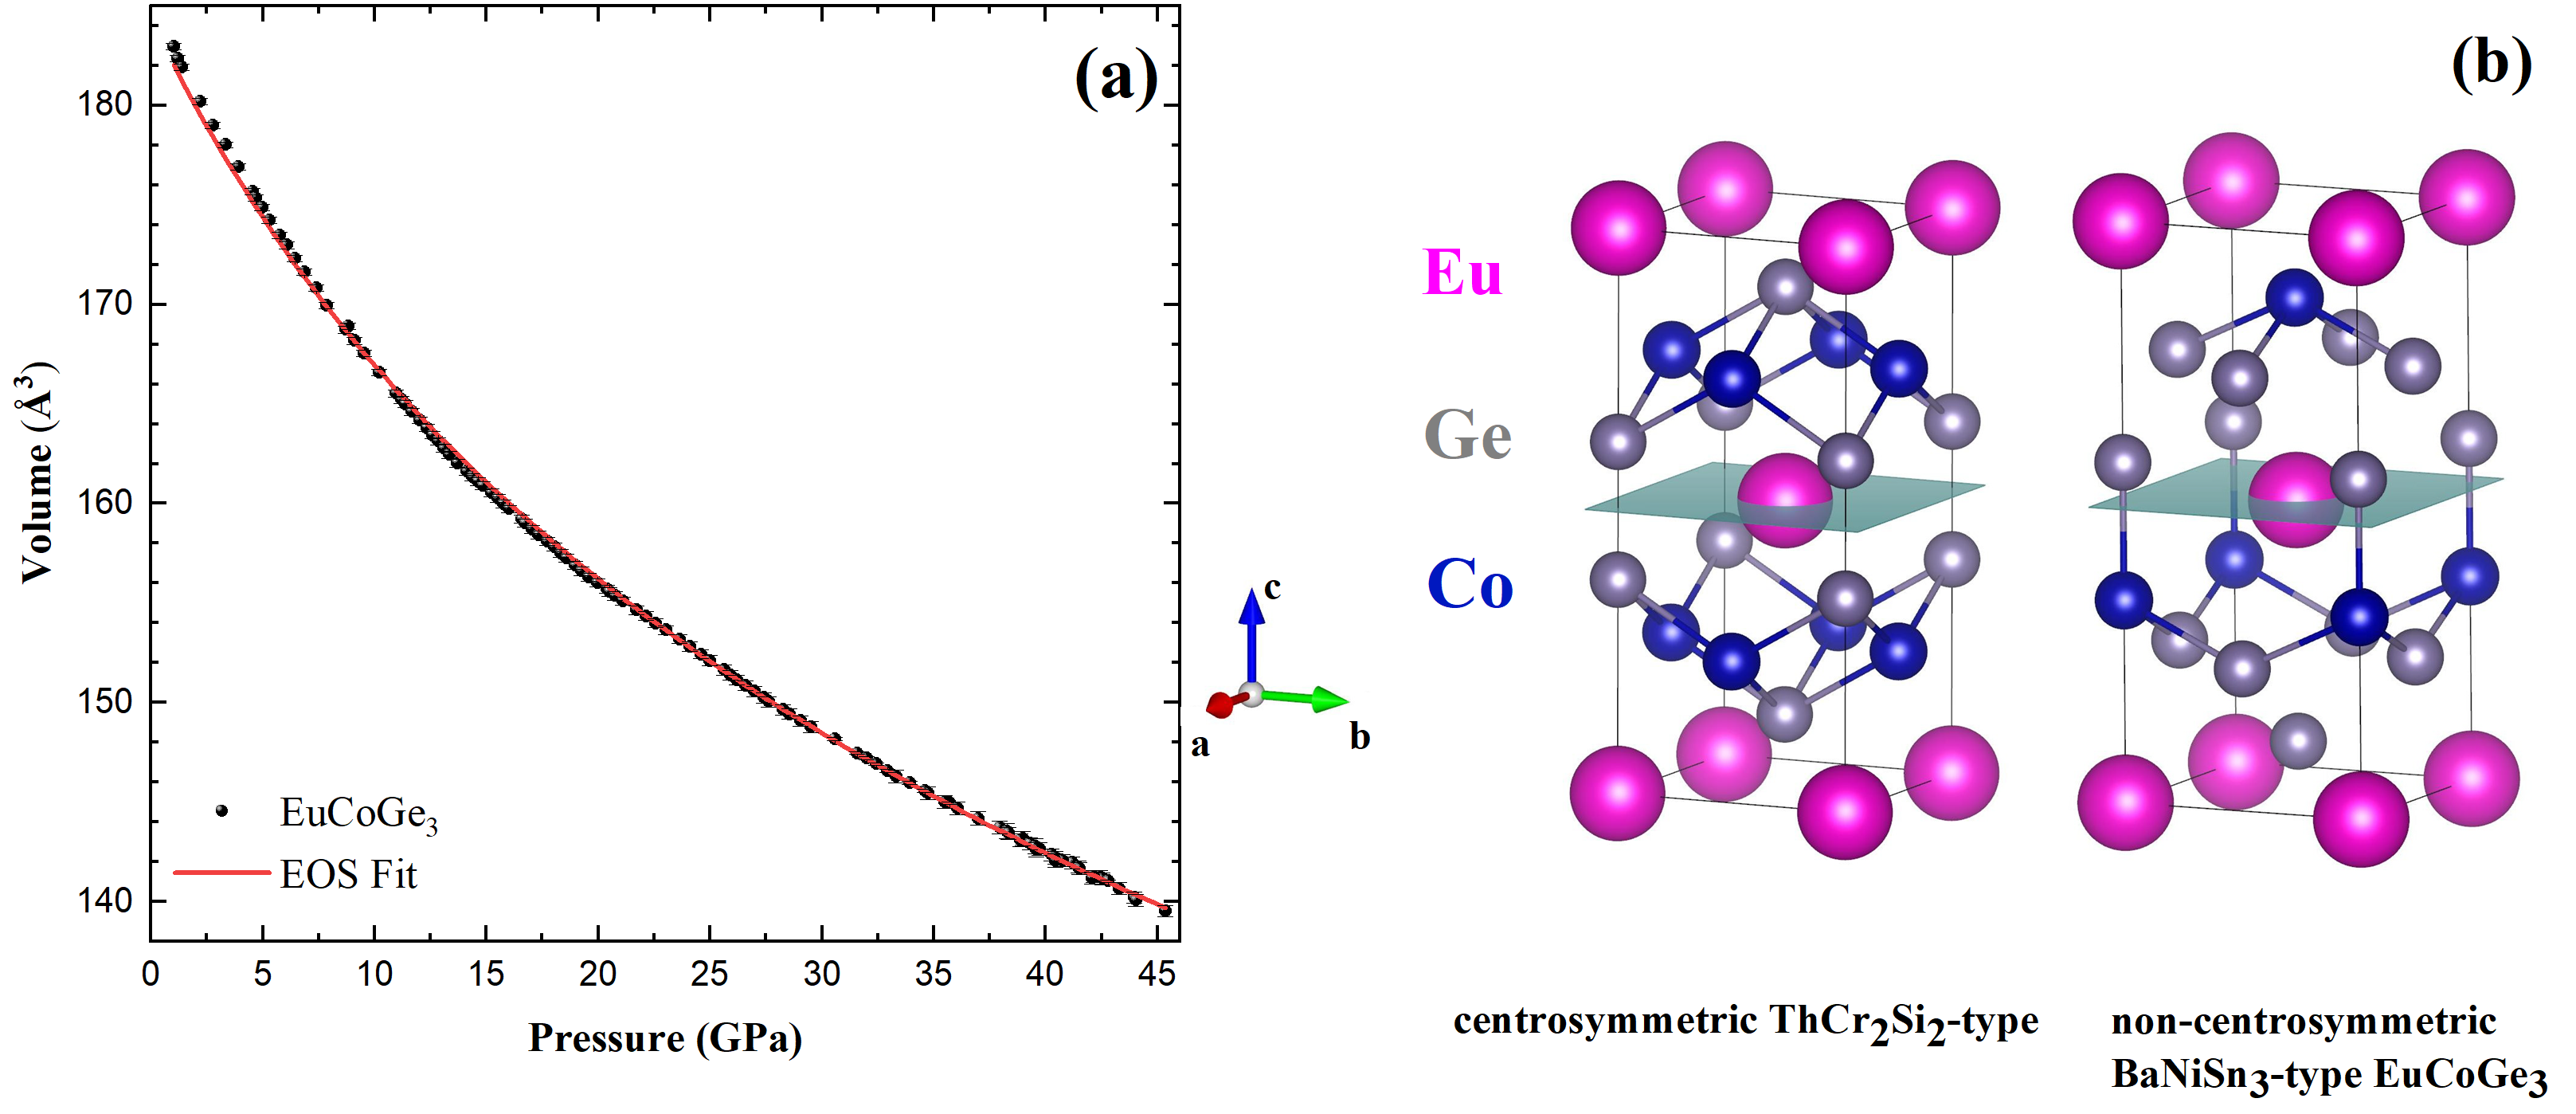
Contrary to rather extensive studies on the Eu-122 systems, much less attention has been given to ternary Eu-compounds crystallizing with the BaNiSn3-type structure () which is a close relative to the ThCr2Si2-type structure (see Fig. 7 (b)). Recently a series of europium transition metal silicides/germanides Eu : T= transition metal, X=Si or Ge, with the BaNiSn3-type structure [16] was reported to exhibit complex magnetic properties[17, 18, 19, 20, 21, 22, 23] and atypical behavior under hydrostatic pressure[24, 25]. In this context, it is worth mentioning that pressure-induced superconductivity was discovered in a few Ce-based counterparts [26, 27, 28, 29]. These compounds bear an unconventional character with a mixed singlet-triplet pairing caused by large anti-symmetric spin-orbit coupling in strongly correlated electron systems which lack an inversion symmetry in their crystal lattice[30, 31].
In the crystallographic unit cell of Eu systems, Eu atoms occupy the 2 Wyckoff site, silicon/germanium atoms are located at two different Wyckoff positions 2 and 4, while transition metal atoms occupy the 2 site [20]. Magnetic susceptibility measurements [32, 33, 21] and Mössbauer spectroscopy [17, 18] revealed the presence of magnetic Eu2+ ions in each of the investigated compounds. While all of them order antiferromagnetically (AFM) at similar temperatures, the magnetic structure formed by the localized Eu 4 moments depends on the transition metal constituent. For example, in EuRhGe3 the AFM order sets in at = 11.3 K and the Eu moments are confined in the ab plane, while they are aligned along the -axis in EuCoGe3, EuNiGe3 and EuIrGe3 that order at = 15.4, 13.5, and 12.3 K respectively [20, 32, 33]. Below , successive magnetic phase transitions were observed at = 13.4 K in EuCoGe3 and = 7.5 K and = 5.0 K in EuIrGe3 [20, 21]. Very recently, EuIrGe3 was studied by neutron and resonant x-ray diffraction and complex magnetic phase transitions from an incommensurate longitudinal sinusoidal structure below to a cycloidal structure below , then to a cycloidal structure rotated by 45° in-plane below were revealed [23].
In order to check for possible valence changes and long-sought emergence of superconductivity in Eu-based materials, electric transport measurements were performed on EuCoGe3, EuNiGe3, EuRhGe3, and EuIrGe3 under pressure up to 8 GPa [34, 21]. The magnetic transition temperatures and were found to increase with increasing pressure and no sign of any other phase transition was observed. Similar results were obtained from pressure-dependent ac calorimetry in EuCoGe3 up to 10.4 GPa, which additionally indicated a pressure-driven moderate effective mass enhancement [35].
In this study, we performed high energy resolution fluorescence detected (HERFD) near-edge x-ray absorption spectroscopy and powder x-ray diffraction on EuCoGe3 under pressure as high as 50 GPa. By increasing pressure, the average Eu valence of EuCoGe3 continuously increases from 2.2 at 2 GPa to 2.31 at 50 GPa, while no discernible changes are observed in the Co and Ge spectra as a function of pressure. Concurrently, the crystal lattice volume of EuCoGe3 continuously decreases without changing the symmetry.
II Experiment
Single crystals of EuCoGe3 were grown from the In flux, as described elsewhere [20, 33, 21]. The crystals were taken from the same batch that was studied in Ref. 20. Their high quality was proved by electrical resistivity and magnetic susceptibility measurements (see Ref. 20).
HERFD near-edge x-ray absorption spectroscopy (XAS) experiment was performed at the GALAXIES beamline of the SOLEIL synchrotron [36, 37]. The incident synchrotron beam was monochromatized using a Si(111) double-crystal monochromator followed by a Pd-coated spherical collimating mirror [38]. The HERFD near-edge XAS spectra were observed by varying photon energy across the Eu , Co , and Ge edges and recorded using a silicon drift detector. Each fluorescence line was selected by changing the Bragg angle of the single crystal analyzer: Eu (5846 eV), Co (7649 eV), and Ge (9886 eV) with the Bragg angles of 77° Ge(333), 84° Ge(444), and 74° Ge(555), respectively. HERFD method suppresses 2p or 1s core-hole lifetime broadening owing to the resonant inelastic x-ray scattering process. The sample was mounted in a diamond anvil cell (DAC) with Ne gas as a pressure medium and a ruby as a pressure indicator [39]. A high purity beryllium gasket was used through which the incident and fluorescence x-rays traverse to measure the Eu , Co , and Ge emissions. The pressure was applied by manually tightening a set of 4 screws on the DAC. For an accurate pressure calibration, the ruby fluorescence signal was measured before and after the XAS cycle at each pressure.
The high-resolution x-ray diffraction (XRD) was carried out at the PSICHE beamline of SOLEIL synchrotron with a photon energy of 23 keV ( = 0.3738 Å). The single crystal of EuCoGe3 was gently crushed by pestle into powder. The powdered sample was mounted in a DAC with Ne gas as a pressure medium, and a piece of Au was loaded in the DAC together with the sample as a pressure reference material. The gasket was made of inox with a thickness of 27 m and a sample space diameter of 150 m. Diamonds of 300 m diameter culet size were used. The pressure was controlled by a membrane on the DAC and was determined by the Au equation of state.
III Results and Discussion
III.1 HERFD near-edge XAS results
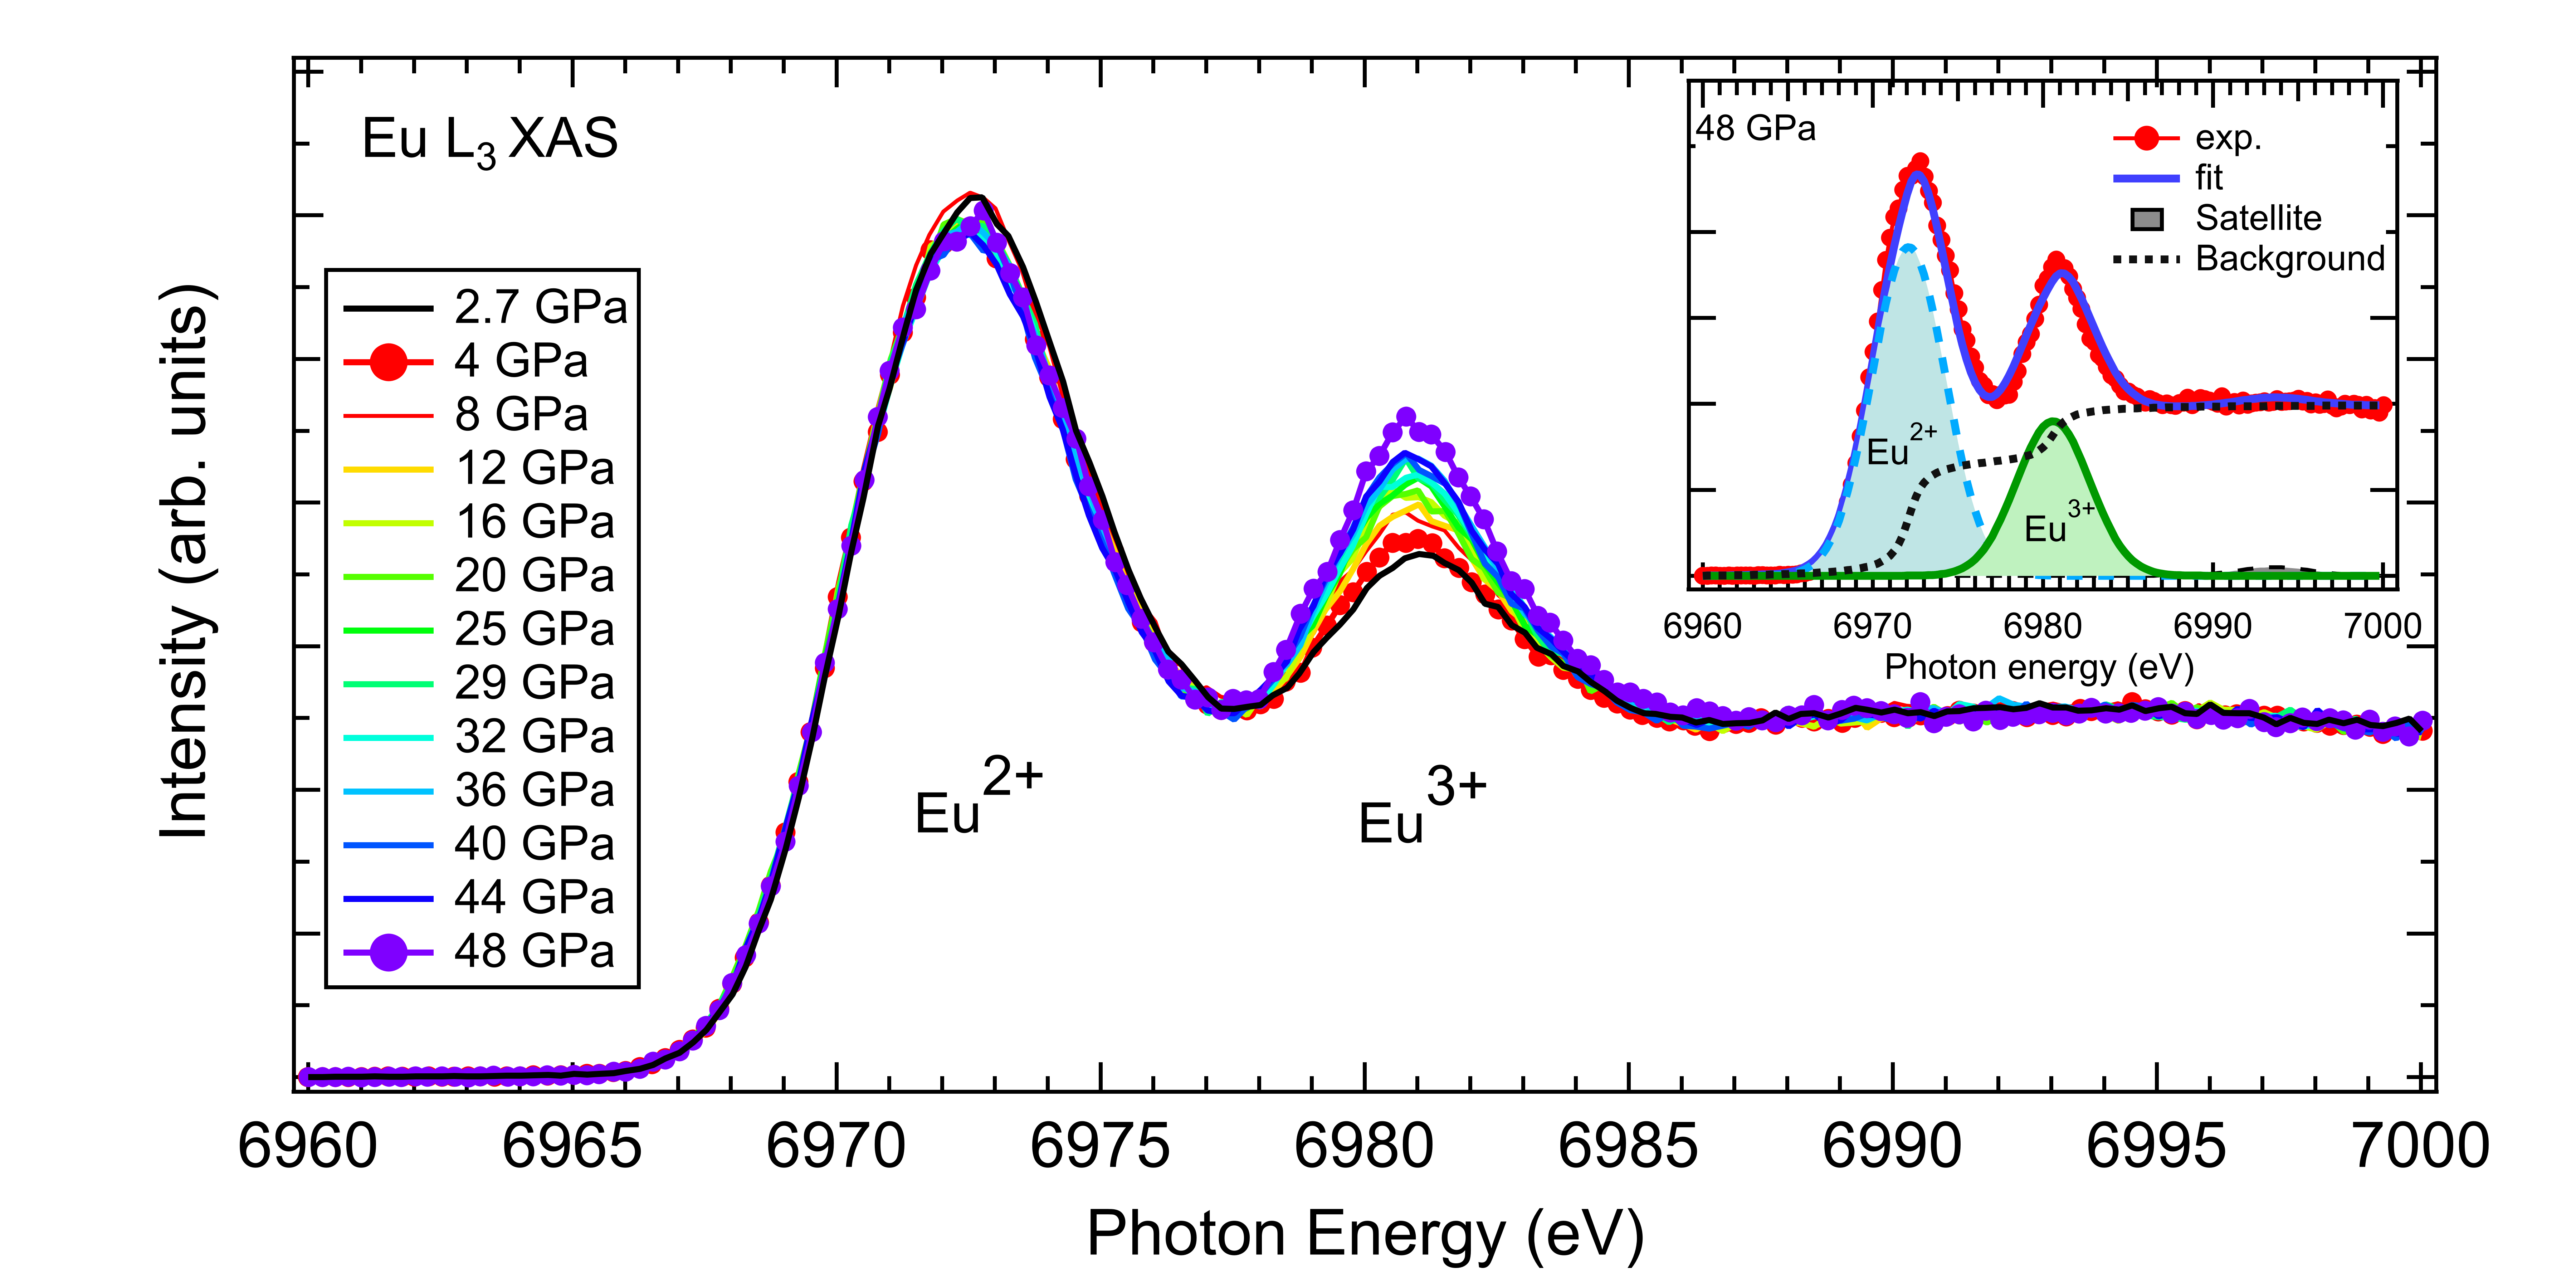
Fig. 1 shows the pressure-dependent Eu XAS spectra of EuCoGe3 measured at room temperature. The spectra were obtained by scanning the incident x-ray energy through the Eu absorption edge while recording the scattered intensity of the Eu fluorescence energy. The HERFD spectra resemble a standard XAS spectrum, though the spectral shape is sharper due to the absence of a deep 2 core hole in the final state. The Eu HERFD spectra exhibit a prominent peak at 6972 eV and a broad peak centered at 6981 eV corresponding to Eu2+ ( + () ) and Eu3+ ( + () ) components, respectively. Although the transition process does not directly include the 4 states, the Eu2+ and Eu3+ peaks in the Eu HERFD spectra are well separated and they are sensitive to the change of the Eu valence due to strong Coulomb interaction between the 3 core hole and the final state 4 electron. A broad satellite peak around 20 eV above the main line is not evident in EuCoGe3, in contrast to that observed in EuRhGe3[40]. The inset of Fig. 1 shows the Eu XAS spectra fitting with three Gaussian functions corresponding to Eu2+, Eu3+ and the satellite peak, and two arctangent backgrounds for the Eu2+ and Eu3+ peaks. There is no signal of the quadrupolar 2 - 4 transition in the pre-edge region. The mean Eu valence was estimated using the formula ), where and denote the integrated spectral intensities of the Eu2+ and Eu3+ peaks respectively, extracted from the fitting analysis. Note that the intensity of the satellite peak is not included in the Eu valence estimation.
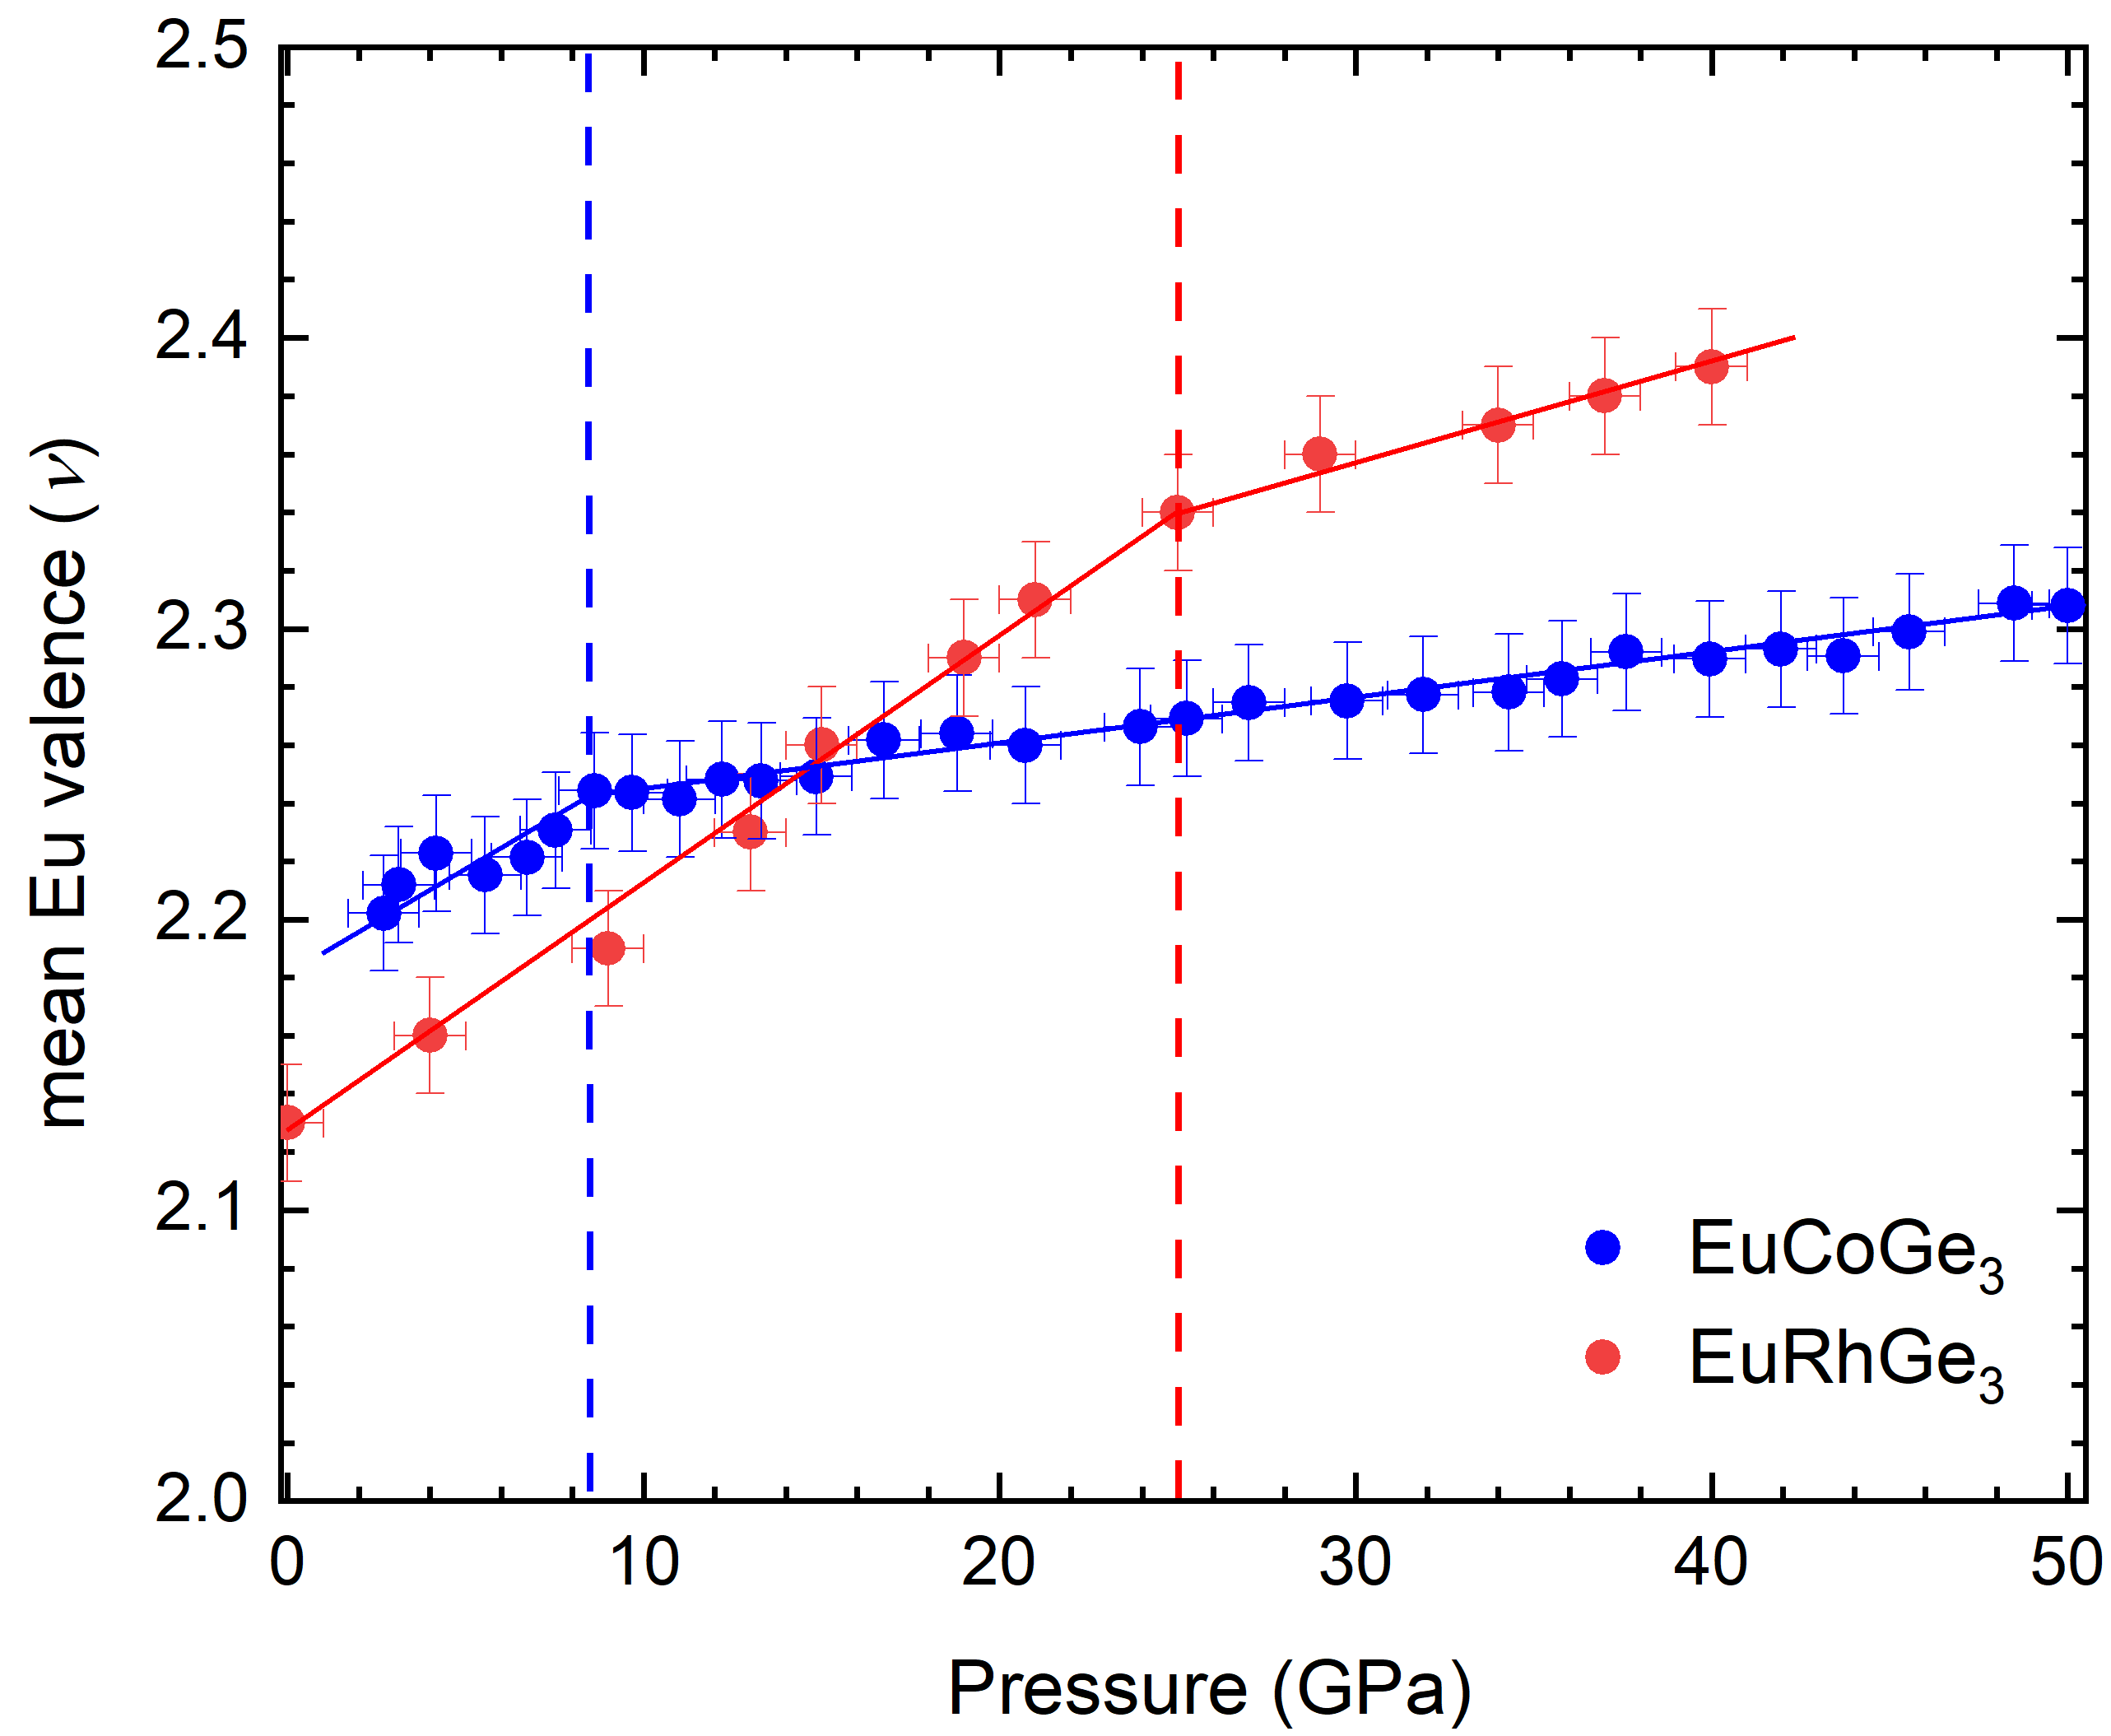
In Fig. 2 we present the variation of the mean Eu valence with pressure in EuCoGe3. The valence at 2.7 GPa (the lowest measurement pressure) is = 2.20 0.02. With increasing pressure, linearly increases to 2.31 0.02 at 50 GPa. For comparison, in Fig. 2 we also show pressure variation of the mean Eu valence in EuRhGe3 [40]. No valence/phase transition was observed in the entire pressure range investigated. Compared to the latter compound, the pressure evolution of Eu valence in EuCoGe3 is rather small. The rate of valence change / in EuRhGe3 is around 0.0065/GPa, while that in EuCoGe3 is only 0.0023/GPa. Similarly a stable Eu2+ valence state is relatively uncommon for Eu-compounds. The origin of the kinks in the Eu valence changes is unclear, though they are not artefacts created by the pressure medium since both were measured with a Ne gas pressure medium. For the most intensively studied ternaries with the ThCr2Si2-type structure, a pressure-induced valence transition from Eu2+ to almost Eu3+, usually occurs in the range 4-5 GPa. [15][41]
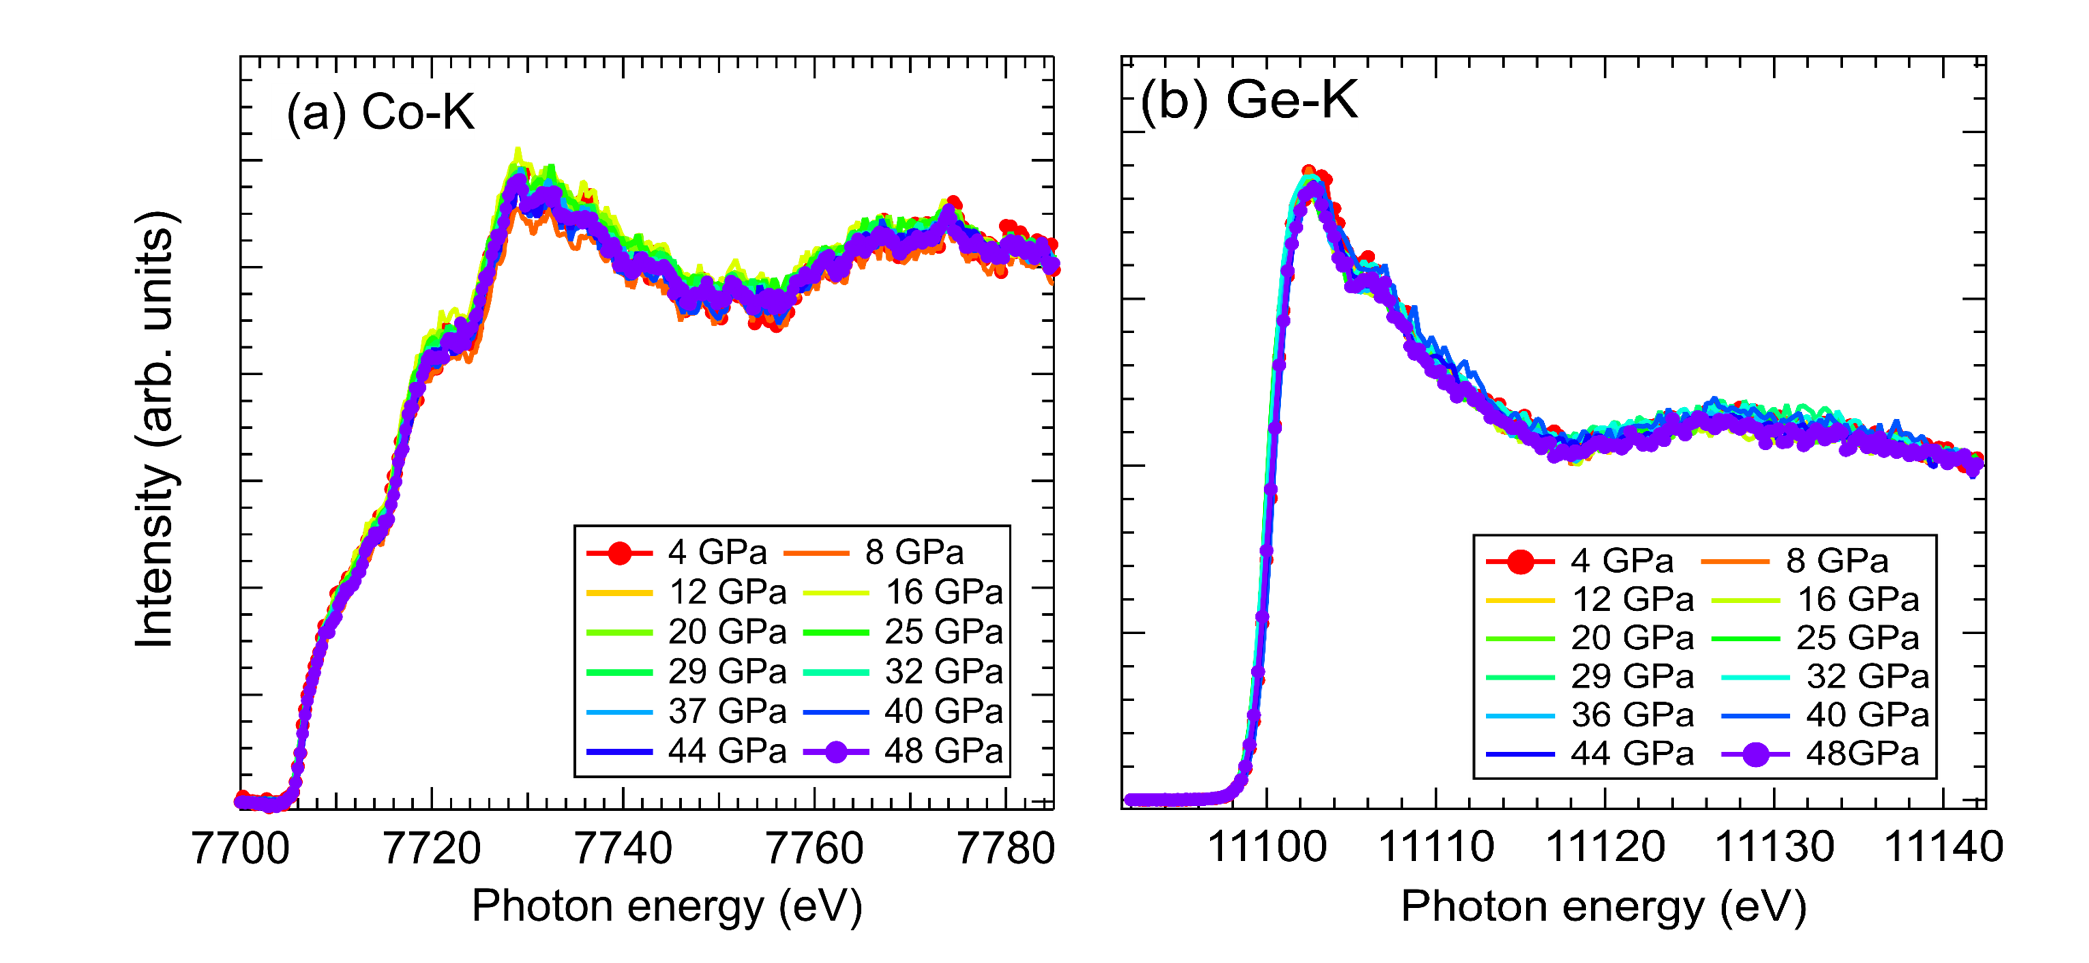
In Fig 3, the HERFD spectra at the Co and Ge edges are shown. After subtracting a constant background below the edges, the spectra were normalized over the higher energy end. The Co edge spectra show pre-edge shoulder structures at 7710 eV and 7720 eV and the main peak at 7729 eV which corresponds to the Co 1 dipolar transition. The pre-edge structures were reported for Co foil [42] and Co-bearing oxides [43]. The pre-edge shoulder at 7710 eV can be attributed to the Co 1 direct quadrupolar transition and the dipolar transition to hybridised state [43, 42]. The following pre-edge structure at 7720 eV could be due to a shakedown process of ligand to metal charge transfer [44]. The broad satellite peak far above the edge centred at 7775 eV may originate from extended x-ray absorption fine structure oscillations. The Ge edge spectra have a main peak at 11102 eV and a shoulder peak at 11106 eV. The spectral shape is similar to the Ge XAS spectrum of CeCoGe3 which is isostructural to EuCoGe3. Following the interpretation of Ge XAS spectrum of CeCoGe3 [45], the prominent peak at 11102 eV and the shoulder peak at 11106 eV are considered to originate from Ge atoms in the Wyckoff positions and , respectively. Within experimental resolution, neither Co nor Ge edge spectra show any remarkable changes with pressure. In order to elucidate a slight change by pressure, we also observed the Co and Ge x-ray emission spectra, though no reasonable changes have been detected (see appendix). The results indicate that the increase of the mean Eu valence under pressure is due to intra-atomic charge transfer from Eu to 5, and negligible contributions from Ge and Co ions.
III.2 XRD results
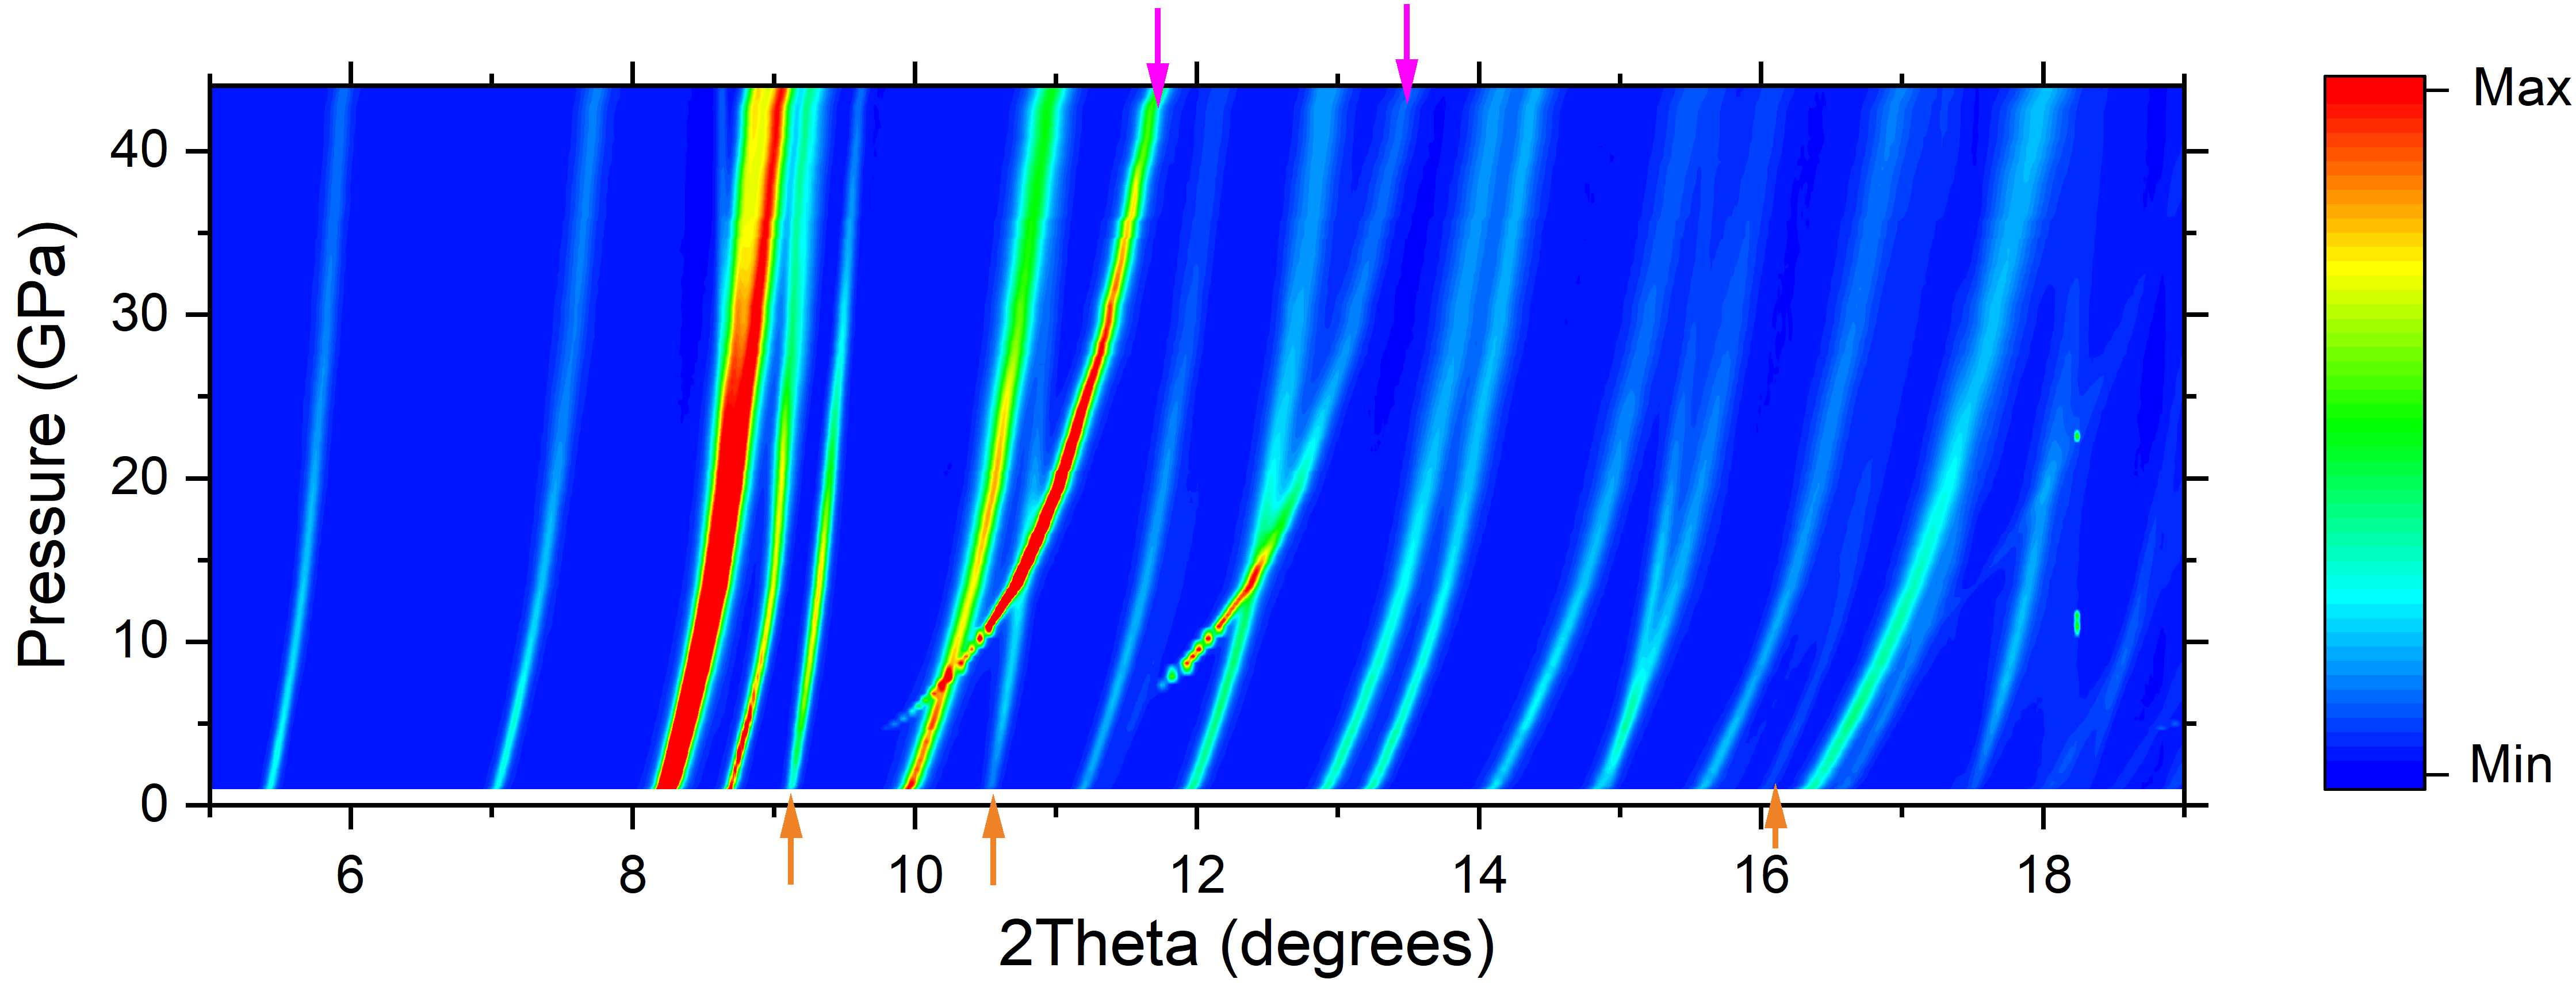
Synchrotron powder XRD of EuCoGe3 was performed as a function of pressure at room temperature. The contour map of diffraction intensities in the pressure range from 1 to 45 GPa is shown in Fig 4. In order to highlight the change with pressure, the diffraction intensities are plotted only in the 2 range 5° to 19°. The pressure evolution of Bragg peak positions indicates three different phases, EuCoGe3 (main phase), gold, and neon as a hydrostatic pressure medium. Neon is known to crystallize around 4.8 GPa at room temperature [46]. A sign of non-hydrostaticity in neon appears above 15 GPa, though its pressure gradient stays very small up to 50 GPa [47, 48]. The fast-changing peaks at 2 = 10° and 12° in the contour map correspond to crystalized neon. No emergence or disappearance of Bragg peaks was observed that could be related to any symmetry change in the investigated pressure range. This result proves the absence of any structural phase transition in EuCoGe3 up to 45 GPa. In order to extract more detailed information on the crystal structure of EuCoGe3, Rietveld refinement of the XRD data was performed by using the Profex programme.[49]
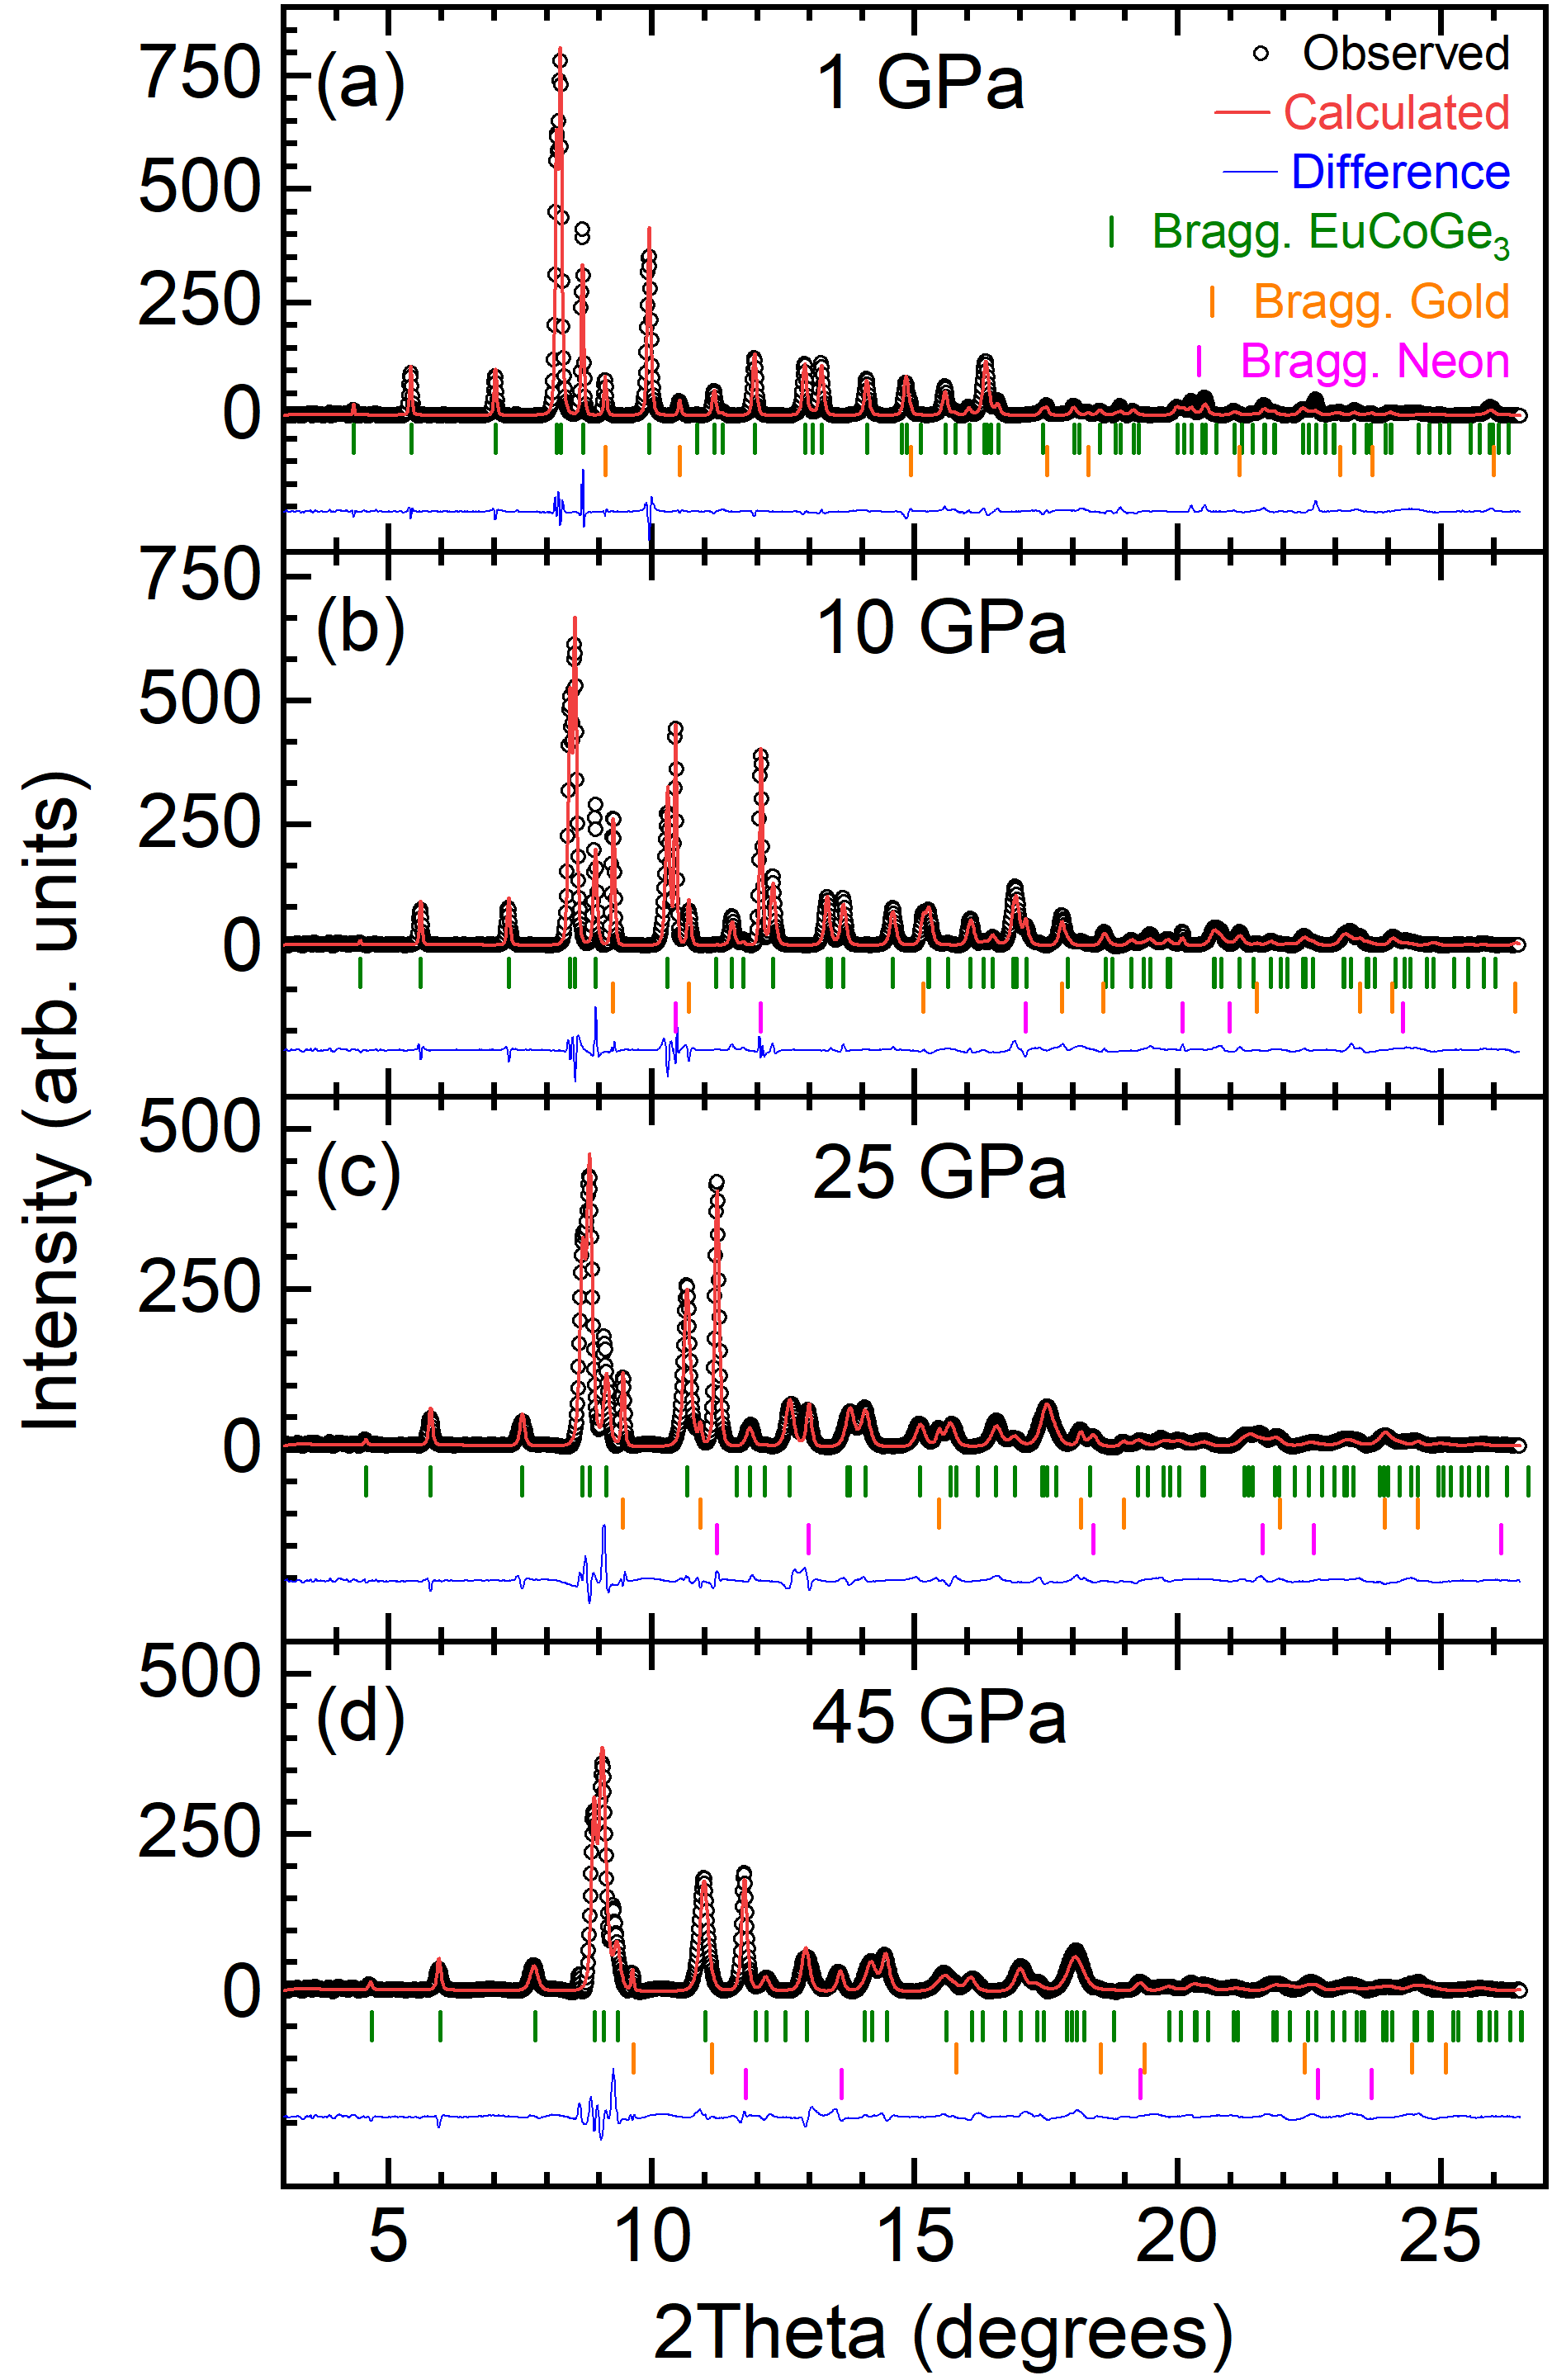
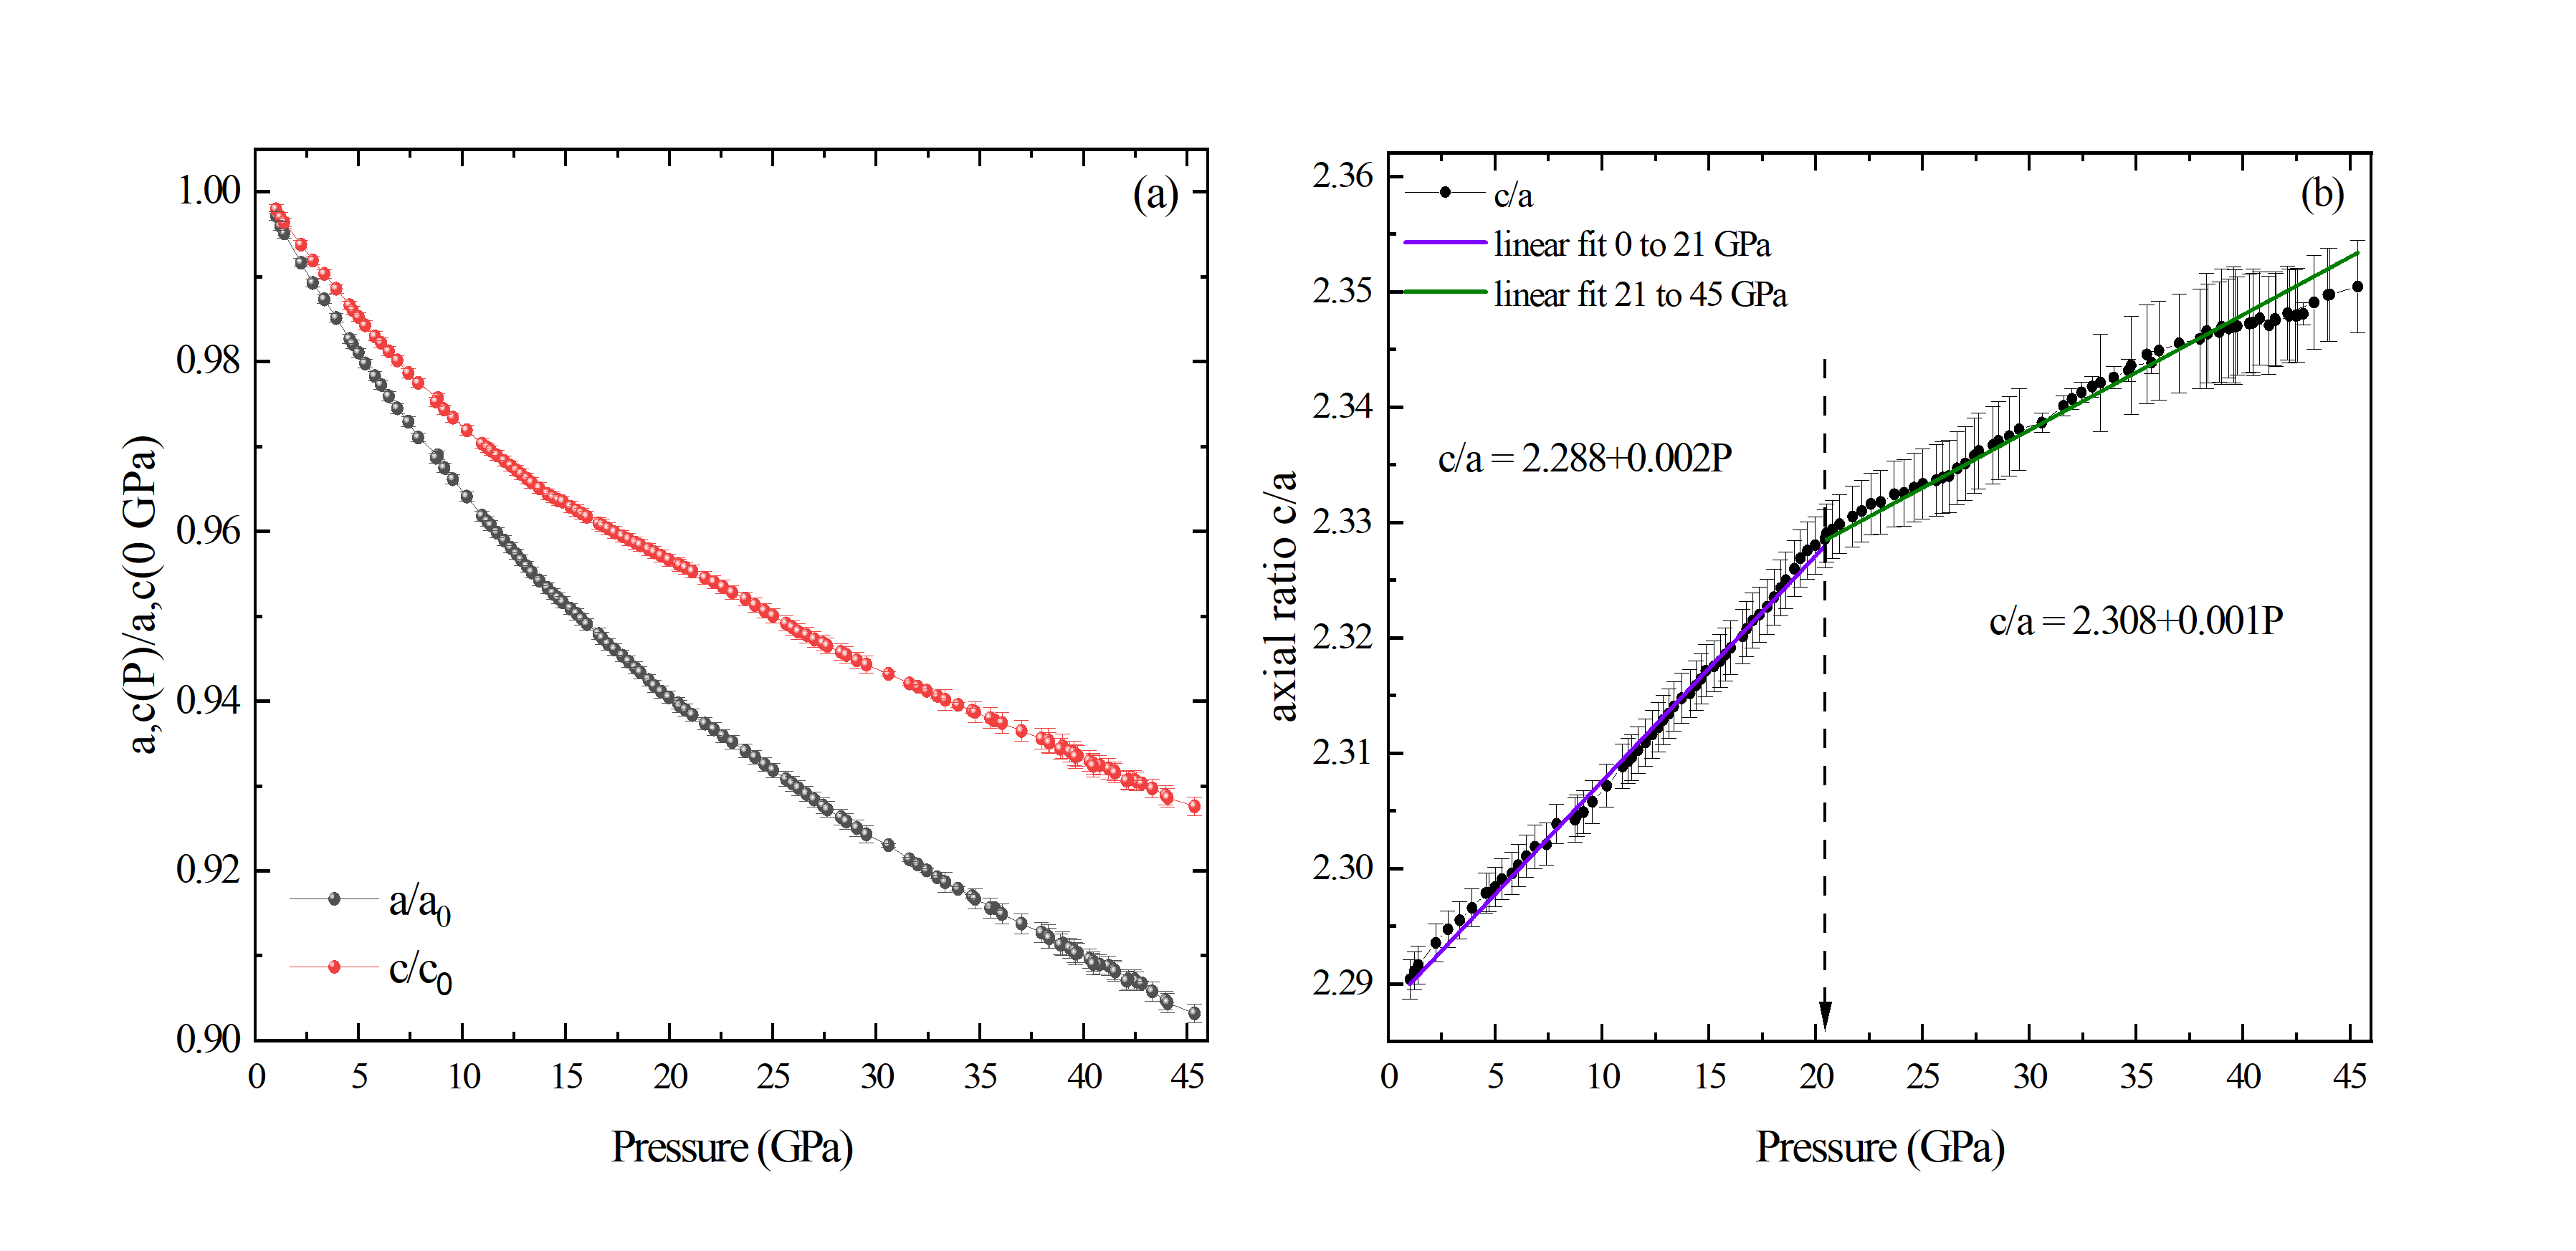
In Fig. 5, the XRD patterns at 1, 10, 25, and 45 GPa are presented along with the results of Rietveld refinements (See also Table 1). The analysis confirmed that EuCoGe3 keeps the same crystal symmetry () up to 45 GPa. Fig. 6 (a) shows the relative changes in both the - and -lattice parameters with respect to the values at ambient pressure : = 4.3191(3) Å and = 9.8847(15) Å (taken from Ref [20]). In both directions, a smooth contraction with pressure (P) was found, however, the change along the -axis is larger than along the -axis. The ratio is plotted in Fig. 6 (b) as a function of pressure. It linearly increases with increasing pressure up to 21 GPa with a rate 2.288+0.002P and then continues to increase nearly linearly with a slope 2.308+0.001P. The change of the increase rate around 20 GPa can be attributed to the anisotropic compression of - and -axis. A small deviation from the linear behavior above 40 GPa might be due to the non-hydrostatic pressure effect in high-pressure region.
Compared to the axial ratio of various ternary Eu-compounds in the ThCr2Si2-type structure () which has a centrosymmetry [14], that of EuCoGe3 is relatively small. In the case of stoichiometric compounds (: rare-earth or alkali earth, : transition metal, and : 14-15 group elements) with the ThCr2Si2-type structure, the structure can be disassemble to -layers and ions. The -layers are constructed from tetrahedrons that have covalent bonding and weak metal-metal bonding. The interrelationship between intra- and inter-layer bonding distances, namely the ratio, and its relation to the physical properties in compounds have been proposed [50, 51, 52, 53]. Although the correlation between lattice parameters and physical properties may exist in compounds in the BaNiSn3-type structure, the bonding nature can differ from the ThCr2Si2-type compounds. In compounds, transition metal and atoms form square pyramids with the apex of atom pointing alternately up and down in the layers [54]. The metal-metal distance in the layer corresponds to the -lattice constant and is relatively larger than that in the ThCr2Si2-type compounds. Furthermore, the interlayer distance is defined by the bonding. Here, we only refer to the structural differences between the ThCr2Si2-type and the BaNiSn3-type compounds. In order to understand the relation between structure and properties in compounds, further systematic studies of series and chemical bonding analyses are necessary.
| Pressure | 1 GPa | 10 GPa | 25 GPa | 45 GPa |
|---|---|---|---|---|
| Lattice constants | ||||
| a (Å) | 4.308 (4) | 4.164 (2) | 4.019 (6) | 3.901(1) |
| c (Å) | 9.867 (1) | 9.606 (9) | 9.379 (2) | 9.167 (1) |
| V (Å3) | 183.156 (1) | 166.573 (1) | 151.541 (4) | 139.472 (9) |
| Refinement parameters | ||||
| RWP | 17.84 | 16.12 | 17.69 | 21.16 |
| Rexp | 21.87 | 19.74 | 20.68 | 22.04 |
| 0.674 | 0.6669 | 0.7317 | 0.9231 | |
| GOF | 0.821 | 0.8166 | 0.8554 | 0.9601 |
The pressure evolution of the unit cell volume also shows a smooth contraction as shown in Fig. 7. The contraction of the unit cell volume can be approximated a linear decrease up to 10 GPa, which almost coincides the kink in the pressure change of the mean Eu valence. The linear increases of the mean Eu valence and by applying pressure [21, 35] might be related to the linear contraction of the unit cell volume, at least up to 10 GPa (See Supplemental Material Fig. S1 [55]). However, the pressure change of the Eu valence does not seem to be proportional to the pressure change of the unit cell volume in higher pressure region. As mentioned earlier, the ground state properties of the Eu-122 system have been discussed in relation to the unit cell volume [14, 15]. Such a tendency was also reported in the Eu-113 system. With an increase of Ge substitution in EuNi(Si1-xGex)3, the unit cell volume showed a monotonous increase, while decreased monotonously, indicating its strong connection to the volume change [56]. On the other hand, the change in in EuGe3 by transition metal substitution did not show a proportional change with the unit cell volume [20]. Although it has to be taken into account that the chemical pressure and applying external pressure do not always lead to the same results, the Eu-113 systems do not likely follow the same unit cell volume regime as the Eu-122 systems.
We performed equation of state (EOS) fitting for EuCoGe3 by using the EOSFit7c software[57]. We used the third-order Birch Murnaghan equation below for EOS fitting [58]:
Where,
Here and denote a bulk modulus at 0 GPa and the first pressure derivative of the bulk modulus, respectively. The result of EOS fitting is presented in Fig. 7. The value of = 184.39 3 was taken from Ref. [20]. The obtained values of and are 75.6 0.3 GPa and 5.58 0.04, respectively (See Supplemental Material Fig. S2 [55]). We also performed refinement for the gold reference material and neon pressure medium and extracted the pressure-dependent unit cell volumes. From the obtained unit cell volume of gold, the pressure was determined by using third-order Birch Murnaghan equation with =67.847 , =167 GPa, and =5.5 taken from Ref. [59]. For the EOS fitting of the unit cell volume of neon (See Supplemental Material Fig. S3 [55]), we used = 88.967 from Ref. [60] and obtained = 1.15 0.06 GPa and = 9.0 0.3, that are in good agreement with earlier studies [46, 60].
IV Conclusion
We studied the electronic and crystal structure of non-centrosymmetric EuCoGe3 by HERFD near-edge XAS and synchrotron powder XRD as a function of pressure. By applying pressure, the intensity of the Eu3+ peak in the Eu XAS spectra slightly increases relative to the Eu2+ peak. The mean Eu valence increases from 2.2 at 2.7 GPa to 2.31 at 50 GPa without a first-order valence transition. Compared to EuRhGe3, the pressure variation of the Eu valence is relatively small in EuCoGe3. The XAS spectra at the Ge and Co edges show no discernible changes against pressure. This indicates that the pressure evolution of the mean Eu valence is due to charge transfer from Eu to 5, with no contribution from Ge and Co ions.
The powder XRD experiment revealed a continuous compression of the lattice volume without changing structural symmetry within the investigated pressure range. The compressibility of the lattice constant along the -axis is larger than that along the -axis. From EOS fitting of the unit cell volume, we obtained the bulk modulus and the pressure derivative of the bulk modulus of EuCoGe3. The contraction of the unit cell volume may contribute to the increase of the Eu valence, as our experimental results seem to show a relation between the mean Eu valence and the pressure evolution of the unit cell volume in EuCoGe3 up to 10 GPa. However, the pressure change of the Eu valence does not seem to be proportional to the pressure change of the unit cell volume in higher pressure region.
V Acknowledgments
We would like to thank Dominique Prieur for his skillful technical assistance. The HERFD near-edge XAS experiment was performed under the approval of the GALAXIES beamline station (proposal No. 20191156) and powder XRD experiment was performed under the approval of the PSICHE beamline station (proposal No. 20210410). The work has been supported by the Croatian Science Foundation under project number UIP-2019-04-2154. This work has been supported in part by the Croatian Science Foundation under the Project No. IP-2020-02-9666. The research leading to this result has been supported by the project CALIPSOplus under the Grant Agreement 730872 from the EU Framework Program for Research and Innovation HORIZON 2020. N. S. D acknowledges financing from the Croatian Science Foundation under the ”Young Researchers’ Career Development Project”: project number DOK-2018-09-9906. C. M. N. Kumar acknowledges support of project Cryogenic Centre at the Institute of Physics - KaCIF- (Grant No. KK.01.1.1.02.0012), co-financed by the Croatian Government and the European Union through the European Regional Development Fund - Competitiveness and Cohesion Operational Programme.
VI APPENDIX
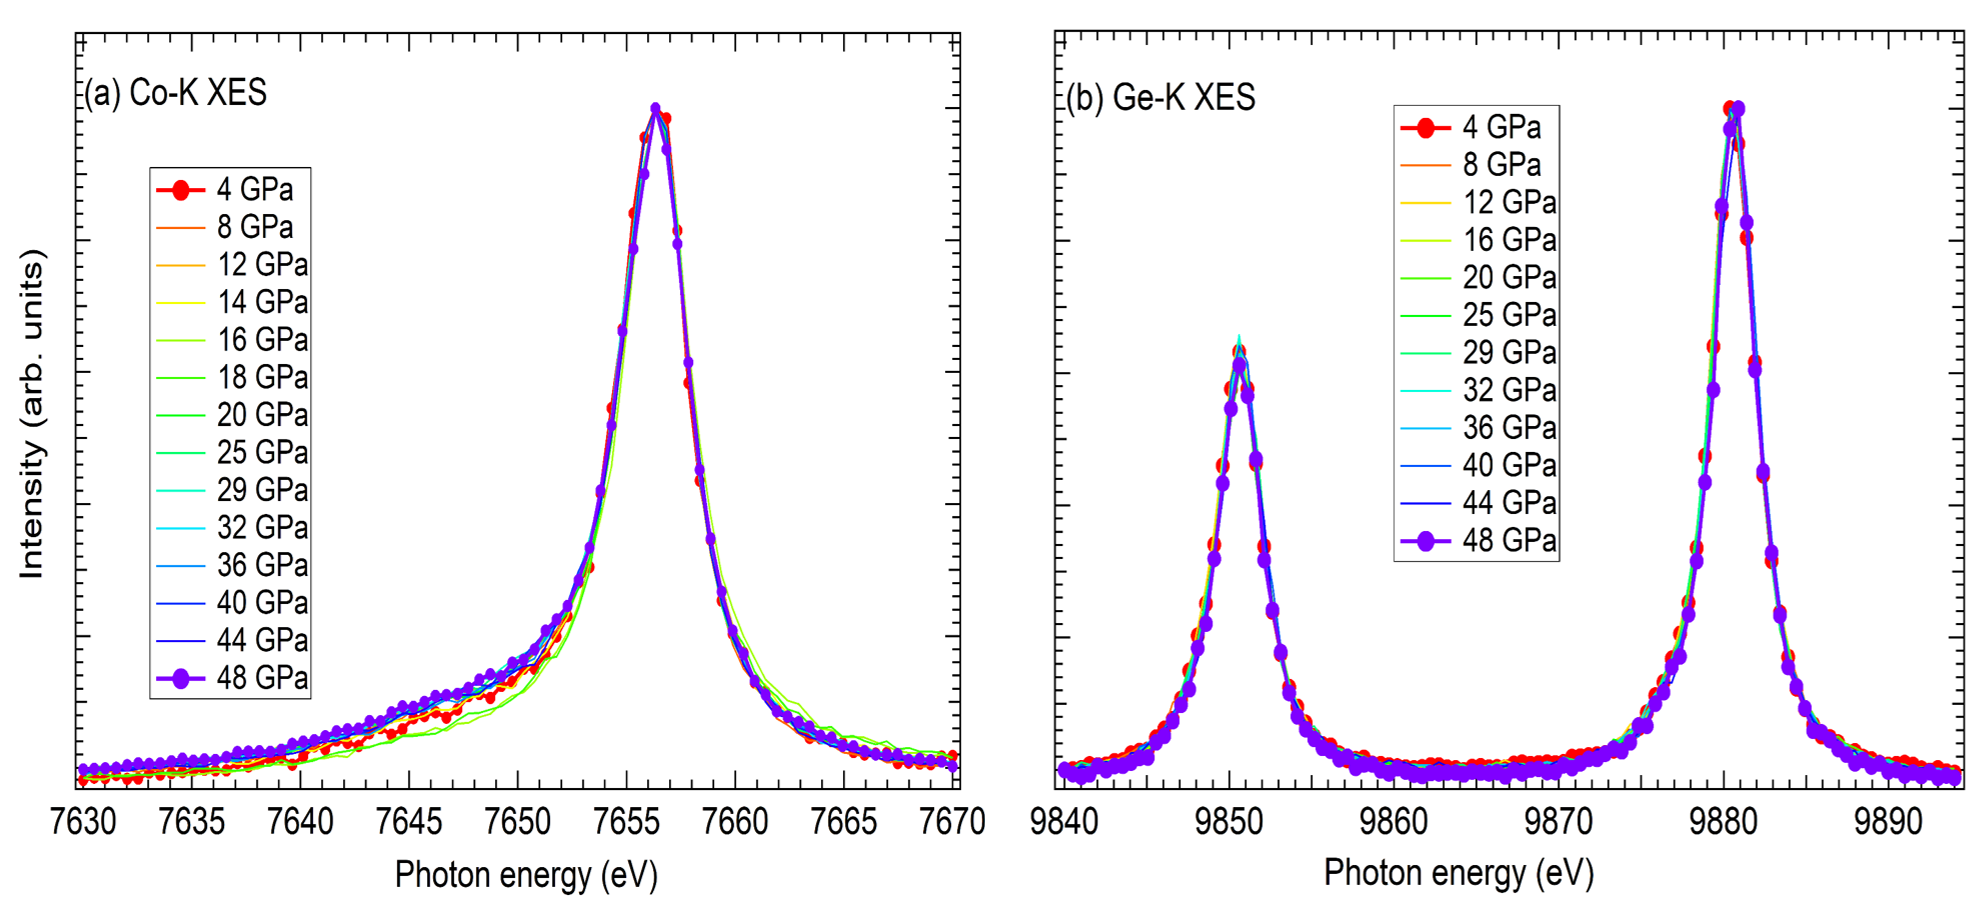
In Fig. 8, we present (a) Co Kβ and (b) Ge Kα emission spectra of EuCoGe3 as a function of pressure. The Co Kβ and Ge Kα emission spectra were recorded at incident photon energies of 8209 and 11603 eV, respectively. The Co Kβ emission spectrum represents the main peak located at 7656 eV corresponding to the Kβ1,3 line. The satellite peak between 7645 eV and 7650 eV corresponds to the K line. The intensity of the satellite peak changes slightly but no systematic change as a function of pressure is observed. For emission along Ge Kα, we have two peaks, the first peak at 9850 eV which corresponds to Kα2 and the second peak at 30 eV higher at 9880 eV, which corresponds to Kα1. Similar to XAS spectra no considerable changes were observed in spectra within experimental resolution as a function of pressure.
References
- Pfleiderer [2009] C. Pfleiderer, Rev. Mod. Phys. 81, 1551 (2009), URL https://link.aps.org/doi/10.1103/RevModPhys.81.1551.
- Si and Steglich [2010] Q. Si and F. Steglich, Science 329, 1161 (2010), eprint https://www.science.org/doi/pdf/10.1126/science.1191195, URL https://www.science.org/doi/abs/10.1126/science.1191195.
- Just and Paufler [1996] G. Just and P. Paufler, Journal of Alloys and Compounds 232, 1 (1996), ISSN 0925-8388, URL https://www.sciencedirect.com/science/article/pii/0925838895019391.
- Steglich et al. [1979] F. Steglich, J. Aarts, C. D. Bredl, W. Lieke, D. Meschede, W. Franz, and H. Schäfer, Phys. Rev. Lett. 43, 1892 (1979), URL https://link.aps.org/doi/10.1103/PhysRevLett.43.1892.
- Trovarelli et al. [2000] O. Trovarelli, C. Geibel, S. Mederle, C. Langhammer, F. M. Grosche, P. Gegenwart, M. Lang, G. Sparn, and F. Steglich, Phys. Rev. Lett. 85, 626 (2000), URL https://link.aps.org/doi/10.1103/PhysRevLett.85.626.
- Gegenwart et al. [2002] P. Gegenwart, J. Custers, C. Geibel, K. Neumaier, T. Tayama, K. Tenya, O. Trovarelli, and F. Steglich, Phys. Rev. Lett. 89, 056402 (2002), URL https://link.aps.org/doi/10.1103/PhysRevLett.89.056402.
- Abd-Elmeguid et al. [1985] M. M. Abd-Elmeguid, C. Sauer, and W. Zinn, Phys. Rev. Lett. 55, 2467 (1985), URL https://link.aps.org/doi/10.1103/PhysRevLett.55.2467.
- Hesse et al. [1997] H.-J. Hesse, R. Lübbers, M. Winzenick, H. Neuling, and G. Wortmann, Journal of Alloys and Compounds 246, 220 (1997), ISSN 0925-8388, URL https://www.sciencedirect.com/science/article/pii/S092583889602467X.
- Mitsuda et al. [2012] A. Mitsuda, S. Hamano, N. Araoka, H. Yayama, and H. Wada, Journal of the Physical Society of Japan 81, 023709 (2012), eprint https://doi.org/10.1143/JPSJ.81.023709, URL https://doi.org/10.1143/JPSJ.81.023709.
- Bauminger et al. [1973] E. R. Bauminger, D. Froindlich, I. Nowik, S. Ofer, I. Felner, and I. Mayer, Phys. Rev. Lett. 30, 1053 (1973), URL https://link.aps.org/doi/10.1103/PhysRevLett.30.1053.
- Wada et al. [1999] H. Wada, M. F. Hundley, R. Movshovich, and J. D. Thompson, Phys. Rev. B 59, 1141 (1999), URL https://link.aps.org/doi/10.1103/PhysRevB.59.1141.
- Mitsuda et al. [2007] A. Mitsuda, Y. Ikeda, N. Ietaka, S. Fukuda, and Y. Isikawa, Journal of Magnetism and Magnetic Materials 310, 319 (2007), ISSN 0304-8853, proceedings of the 17th International Conference on Magnetism, URL https://www.sciencedirect.com/science/article/pii/S0304885306011632.
- Shannon [1976] R. D. Shannon, Acta Crystallographica Section A 32, 751 (1976), URL https://doi.org/10.1107/S0567739476001551.
- Ōnuki et al. [2020] Y. Ōnuki, M. Hedo, and F. Honda, journal of the physical society of japan 89, 102001 (2020).
- Honda et al. [2017] F. Honda, K. Okauchi, A. Nakamura, D. Aoki, H. Akamine, Y. Ashitomi, M. Hedo, T. Nakama, and Y. Ōnuki, in Journal of Physics: Conference Series (IOP Publishing, 2017), vol. 807, p. 022004.
- Venturini et al. [1985] G. Venturini, M. Méot-Meyer, B. Malaman, and B. Roques, Journal of the Less Common Metals 113, 197 (1985), ISSN 0022-5088, URL https://www.sciencedirect.com/science/article/pii/0022508885902772.
- Maurya et al. [2014] A. Maurya, P. Bonville, A. Thamizhavel, and S. K. Dhar, Journal of Physics: Condensed Matter 26, 216001 (2014), URL https://doi.org/10.1088/0953-8984/26/21/216001.
- Maurya et al. [2016] A. Maurya, P. Bonville, R. Kulkarni, A. Thamizhavel, and S. Dhar, Journal of Magnetism and Magnetic Materials 401, 823 (2016), ISSN 0304-8853, URL https://www.sciencedirect.com/science/article/pii/S0304885315307654.
- Fabrèges et al. [2016] X. Fabrèges, A. Gukasov, P. Bonville, A. Maurya, A. Thamizhavel, and S. K. Dhar, Phys. Rev. B 93, 214414 (2016), URL https://link.aps.org/doi/10.1103/PhysRevB.93.214414.
- Bednarchuk et al. [2015] O. Bednarchuk, A. Gagor, and D. Kaczorowski, Journal of Alloys and Compounds 622, 432 (2015).
- Kakihana et al. [2017] M. Kakihana, H. Akamine, K. Tomori, K. Nishimura, A. Teruya, A. Nakamura, F. Honda, D. Aoki, M. Nakashima, Y. Amako, et al., Journal of Alloys and Compounds 694, 439 (2017), ISSN 0925-8388, URL https://www.sciencedirect.com/science/article/pii/S092583881633050X.
- Bauer et al. [2022] A. Bauer, A. Senyshyn, R. Bozhanova, W. Simeth, C. Franz, S. Gottlieb-Schönmeyer, M. Meven, T. E. Schrader, and C. Pfleiderer, Phys. Rev. Materials 6, 034406 (2022), URL https://link.aps.org/doi/10.1103/PhysRevMaterials.6.034406.
- Matsumura et al. [2022] T. Matsumura, M. Tsukagoshi, Y. Ueda, N. Higa, A. Nakao, K. Kaneko, M. Kakihana, M. Hedo, T. Nakama, and Y. Ōnuki, Journal of the Physical Society of Japan 91, 073703 (2022), eprint https://doi.org/10.7566/JPSJ.91.073703, URL https://doi.org/10.7566/JPSJ.91.073703.
- Nakashima et al. [2017] M. Nakashima, Y. Amako, K. Matsubayashi, Y. Uwatoko, M. Nada, K. Sugiyama, M. Hagiwara, Y. Haga, T. Takeuchi, A. Nakamura, et al., Journal of the Physical Society of Japan 86, 034708 (2017), eprint https://doi.org/10.7566/JPSJ.86.034708, URL https://doi.org/10.7566/JPSJ.86.034708.
- Nakamura et al. [2015] A. Nakamura, T. Okazaki, M. Nakashima, Y. Amako, K. Matsubayashi, Y. Uwatoko, S. Kayama, T. Kagayama, K. Shimizu, T. Uejo, et al., Journal of the Physical Society of Japan 84, 053701 (2015), eprint https://doi.org/10.7566/JPSJ.84.053701, URL https://doi.org/10.7566/JPSJ.84.053701.
- Kimura et al. [2005] N. Kimura, K. Ito, K. Saitoh, Y. Umeda, H. Aoki, and T. Terashima, Phys. Rev. Lett. 95, 247004 (2005), URL https://link.aps.org/doi/10.1103/PhysRevLett.95.247004.
- Sugitani et al. [2006] I. Sugitani, Y. Okuda, H. Shishido, T. Yamada, A. Thamizhavel, E. Yamamoto, T. D. Matsuda, Y. Haga, T. Takeuchi, R. Settai, et al., Journal of the Physical Society of Japan 75, 043703 (2006), eprint https://doi.org/10.1143/JPSJ.75.043703, URL https://doi.org/10.1143/JPSJ.75.043703.
- Settai et al. [2007] R. Settai, I. Sugitani, Y. Okuda, A. Thamizhavel, M. Nakashima, Y. Ōnuki, and H. Harima, Journal of magnetism and magnetic materials 310, 844 (2007).
- Honda et al. [2010] F. Honda, I. Bonalde, S. Yoshiuchi, Y. Hirose, T. Nakamura, K. Shimizu, R. Settai, and Y. Ōnuki, Physica C: Superconductivity and its applications 470, S543 (2010).
- Takimoto [2008] T. Takimoto, Journal of the Physical Society of Japan 77, 113706 (2008), eprint https://doi.org/10.1143/JPSJ.77.113706, URL https://doi.org/10.1143/JPSJ.77.113706.
- Takimoto and Thalmeier [2009] T. Takimoto and P. Thalmeier, Journal of the Physical Society of Japan 78, 103703 (2009).
- Bednarchuk and Kaczorowski [2015a] O. Bednarchuk and D. Kaczorowski, Journal of Alloys and Compounds 646, 291 (2015a).
- Bednarchuk and Kaczorowski [2015b] O. Bednarchuk and D. Kaczorowski, Acta Physica Polonica A 127, 418 (2015b).
- Uchima et al. [2014a] K. Uchima, N. Arakaki, S. Hirakawa, Y. Hiranaka, T. Uejo, A. Teruya, A. Nakamura, M. Takeda, Y. Takaesu, M. Hedo, et al., Pressure Effect on Transport Properties of EuNiGe3 (2014a), eprint https://journals.jps.jp/doi/pdf/10.7566/JPSCP.1.012015, URL https://journals.jps.jp/doi/abs/10.7566/JPSCP.1.012015.
- Muthu et al. [2019] S. E. Muthu, D. Braithwaite, B. Salce, S. Arumugam, L. Govindaraj, C. Saravanan, M. Kanagaraj, S. Sarkar, and S. C. Peter, Journal of the Physical Society of Japan 88, 074702 (2019), eprint https://doi.org/10.7566/JPSJ.88.074702, URL https://doi.org/10.7566/JPSJ.88.074702.
- Rueff et al. [2015] J.-P. Rueff, J. M. Ablett, D. Céolin, D. Prieur, T. Moreno, V. Balédent, B. Lassalle-Kaiser, J. E. Rault, M. Simon, and A. Shukla, Journal of Synchrotron Radiation 22, 175 (2015), URL https://doi.org/10.1107/S160057751402102X.
- Ablett et al. [2019] J. M. Ablett, D. Prieur, D. Céolin, B. Lassalle-Kaiser, B. Lebert, M. Sauvage, T. Moreno, S. Bac, V. Balédent, A. Ovono, et al., Journal of Synchrotron Radiation 26, 263 (2019), URL https://doi.org/10.1107/S160057751801559X.
- Ablett et al. [2021] J. M. Ablett, S. R. Shieh, V. Balédent, J. C. Woicik, E. Cockayne, and E. L. Shirley, Phys. Rev. B 104, 054119 (2021), URL https://link.aps.org/doi/10.1103/PhysRevB.104.054119.
- Mao et al. [1986] H. K. Mao, J. Xu, and P. M. Bell, Journal of Geophysical Research: Solid Earth 91, 4673 (1986), URL https://agupubs.onlinelibrary.wiley.com/doi/abs/10.1029/JB091iB05p04673.
- Utsumi et al. [2021] Y. Utsumi, I. Batistić, V. Balédent, S. R. Shieh, N. S. Dhami, O. Bednarchuk, D. Kaczorowski, J. M. Ablett, and J. P. Rueff, Electronic Structure 3, 034002 (2021), URL https://doi.org/10.1088/2516-1075/ac0c27.
- Ōnuki et al. [2017] Y. Ōnuki, A. Nakamura, F. Honda, D. Aoki, T. Tekeuchi, M. Nakashima, Y. Amako, H. Harima, K. Matsubayashi, Y. Uwatoko, et al., Philosophical Magazine 97, 3399 (2017), eprint https://doi.org/10.1080/14786435.2016.1218081, URL https://doi.org/10.1080/14786435.2016.1218081.
- Hlil et al. [1996] E. K. Hlil, R. Baudoing-Savois, B. Moraweck, and A. J. Renouprez, The Journal of Physical Chemistry 100, 3102 (1996), eprint https://doi.org/10.1021/jp951440t, URL https://doi.org/10.1021/jp951440t.
- Vankó et al. [2006] G. Vankó, J.-P. Rueff, A. Mattila, Z. Németh, and A. Shukla, Phys. Rev. B 73, 024424 (2006), URL https://link.aps.org/doi/10.1103/PhysRevB.73.024424.
- Kim et al. [1997] M. Kim, Y. Im, E. Oh, K. Kim, and C. Yo, Physica B: Condensed Matter 229, 338 (1997), ISSN 0921-4526, URL https://www.sciencedirect.com/science/article/pii/S0921452696008484.
- Rogalev et al. [2021] A. Rogalev, F. Wilhelm, E. Ovchinnikova, A. Enikeev, R. Bakonin, K. Kozlovskaya, A. Oreshko, D. Aoki, and V. E. Dmitrienko, Crystals 11 (2021), ISSN 2073-4352, URL https://www.mdpi.com/2073-4352/11/5/544.
- Finger et al. [1981] L. W. Finger, R. M. Hazen, G. Zou, H. K. Mao, and P. M. Bell, Applied Physics Letters 39, 892 (1981), eprint https://doi.org/10.1063/1.92597, URL https://doi.org/10.1063/1.92597.
- Meng et al. [1993] Y. Meng, D. J. Weidner, and Y. Fei, Geophysical Research Letters 20, 1147 (1993), URL https://agupubs.onlinelibrary.wiley.com%****␣20032023_Revised_EuCoGe3_pressure_By_14001.bbl␣Line␣600␣****/doi/abs/10.1029/93GL01400.
- Klotz et al. [2009] S. Klotz, J.-C. Chervin, P. Munsch, and G. L. Marchand, Journal of Physics D: Applied Physics 42, 075413 (2009), URL https://doi.org/10.1088/0022-3727/42/7/075413.
- Doebelin and Kleeberg [2015] N. Doebelin and R. Kleeberg, Journal of Applied Crystallography 48, 1573 (2015), URL https://doi.org/10.1107/S1600576715014685.
- Hoffmann and Zheng [1985] R. Hoffmann and C. Zheng, The Journal of Physical Chemistry 89, 4175 (1985), eprint https://doi.org/10.1021/j100266a007, URL https://doi.org/10.1021/j100266a007.
- Johrendt et al. [1997] D. Johrendt, C. Felser, O. Jepsen, O. K. Andersen, A. Mewis, and J. Rouxel, Journal of Solid State Chemistry 130, 254 (1997), ISSN 0022-4596, URL https://www.sciencedirect.com/science/article/pii/S002245969797300X.
- Huhnt et al. [1998] C. Huhnt, W. Schlabitz, A. Wurth, A. Mewis, and M. Reehuis, Physica B: Condensed Matter 252, 44 (1998), ISSN 0921-4526, URL https://www.sciencedirect.com/science/article/pii/S0921452697009046.
- Reehuis et al. [1998] M. Reehuis, W. Jeitschko, G. Kotzyba, B. Zimmer, and X. Hu, Journal of Alloys and Compounds 266, 54 (1998), ISSN 0925-8388, URL https://www.sciencedirect.com/science/article/pii/S0925838897004866.
- Li and Hoffmann [1986] J. Li and R. Hoffmann, Zeitschrift für Naturforschung B 41, 1399 (1986), URL https://doi.org/10.1515/znb-1986-1114.
- Sup [2023] See supplement material for the relation among pressure dependent unit cell volume, and Eu valence, F-f plot of EuCoGe3, and the equation of state fitting of neon (2023).
- Uchima et al. [2014b] K. Uchima, Y. Takaesu, H. Akamine, M. Kakihana, K. Tomori, T. Uejo, A. Teruya, A. Nakamura, M. Hedo, T. Nakama, et al., Journal of Physics: Conference Series 568, 042032 (2014b), URL https://doi.org/10.1088/1742-6596/568/4/042032.
- Angel et al. [2014] R. Angel, J. Gonzalez-Platas, and M. Alvaro, Zeitschrift für Kristallographie (2014).
- Birch [1947] F. Birch, Phys. Rev. 71, 809 (1947), URL https://link.aps.org/doi/10.1103/PhysRev.71.809.
- Heinz and Jeanloz [1984] D. L. Heinz and R. Jeanloz, Journal of Applied Physics 55, 885 (1984), eprint https://doi.org/10.1063/1.333139, URL https://doi.org/10.1063/1.333139.
- Hemley et al. [1989] R. J. Hemley, C. S. Zha, A. P. Jephcoat, H. K. Mao, L. W. Finger, and D. E. Cox, Phys. Rev. B 39, 11820 (1989), URL https://link.aps.org/doi/10.1103/PhysRevB.39.11820.
- Momma and Izumi [2011] K. Momma and F. Izumi, Journal of Applied Crystallography 44, 1272 (2011), URL https://doi.org/10.1107/S0021889811038970.