Synergistic Graph Fusion via Encoder Embedding111This work was supported in part by the National Science Foundation HDR TRIPODS 1934979, the National Science Foundation DMS-2113099, and by funding from Microsoft Research.
Abstract
In this paper, we introduce a novel approach called graph fusion embedding, designed for multi-graph embedding with shared vertex sets. Under the framework of supervised learning, our method exhibits a remarkable and highly desirable ”synergistic effect”: for sufficiently large vertex size, the accuracy of vertex classification consistently benefits from the incorporation of additional graphs. We establish a solid mathematical foundation for the method, beginning with the stochastic block model for binary graphs. We rigorously prove the asymptotic behavior, establish a sufficient condition for the method to achieve asymptotic optimal classification, and demonstrate the existence of the synergistic effect. These results are then extended to a general graph model, allowing the method to be applicable to any data types with appropriate transformations, making it versatile for various applications. Our comprehensive simulations and real data experiments provide compelling evidence supporting the effectiveness of our proposed method, showcasing the pronounced synergistic effect for multiple graphs from disparate sources.
keywords:
Graph Fusion , Encoder Embedding , Supervised Learning[1]organization=University of Delaware, postcode=19716, city=Newark, country=United States
[2]organization=Johns Hopkins University, postcode=21218, city=Baltimore, country=United States
[3]organization=Microsoft Research, postcode=98052, city=Redmond, country=United States
[4]organization=Microsoft Research, postcode=98052, city=Redmond, country=United States
1 Introduction
Graphs have become increasingly prevalent in various real-world scenarios, including social networks, communication networks, webpage hyperlinks, and biological systems [1, 2, 3, 4, 5, 6]. In graph data, we have a set of vertices denoted as , and edges represented as connecting these vertices. This information can be captured by an adjacency matrix , where indicates the existence of an edge between vertices and , and indicates the absence of an edge.
Traditionally, the adjacency matrix is binary and primarily used for representing unweighted graphs. Its capacity extends to handling weighted graphs, where the elements of are assigned the corresponding edge weights. Moreover, graph representation can be used for any data via proper transformations. For instance, when vertex attributes are available, they can be transformed into a pairwise distance or kernel matrix, thus creating a general graph structure. This adaptability enables the incorporation of additional information from vertex attributes, making graph representation a powerful tool for data analysis that goes beyond traditional binary or weighted graphs.
Graph embedding is a fundamental and versatile approach for analyzing and exploring graph data, encompassing a wide range of techniques such as spectral embedding [7, 8], graph convolutional neural networks [9, 10], node2vec [11, 12], among others. By projecting the vertices into a low-dimensional space while preserving the structural information of the graph, graph embedding yields vertex representations in Euclidean space that facilitate various downstream inference tasks, such as community detection [13, 14], vertex classification [15, 9], outlier detection [16, 17], etc.
This manuscript addresses a crucial and increasingly prevalent scenario in data analysis where we encounter multiple graphs sharing a common vertex set [18, 19, 20, 21]. This situation is becoming more frequent as data collection accelerates, and it arises in diverse fields such as social network analysis, neuroscience, and linguistics. For instance, one may want to analyze different social network connections for the same group of individuals, different measurements on the same brain regions, hyperlinks in articles written in different languages, or citation networks enriched with additional attributes. In such settings, it is essential to develop a method that can effectively integrate data from multiple sources. The ideal method should not only exhibit improved performance as more signals from different graphs are incorporated but also be robust against noisy or irrelevant data sources. By leveraging information from multiple graphs, we aim to achieve a richer and more comprehensive representation of the underlying structure and relationships within the data. This can lead to better insights and enhanced accuracy in various downstream tasks, such as vertex classification and link prediction.
To that end, in this paper we present a supervised multi-graph embedding approach called ”graph fusion embedding,” which builds upon the recently proposed graph encoder embedding [22]. The method is designed to handle multiple graphs, accommodating binary, weighted, distance or similarity matrix representations derived from vertex attributes. A notable and distinctive feature of graph fusion embedding is the ”synergistic effect” in supervised learning. This effect guarantees that, for sufficiently large vertex sizes, the accuracy of vertex classification consistently benefits from the incorporation of additional graphs and never degrades. We prove this synergistic effect under both the stochastic block model for binary graphs and a more general graph model. Additionally, we explore the asymptotic behavior of graph fusion embedding and establish a sufficient condition for it to achieve asymptotically perfect vertex classification.
To validate the superiority of our proposed method, we conduct extensive simulations and evaluations on real graph data. By applying the graph fusion embedding to various types of graphs, we showcase its effectiveness and versatility in different settings. Our method consistently outperforms existing techniques and demonstrates the synergistic effect, making it a robust and powerful tool for multi-graph analysis. The appendix includes additional simulations on three other methods for comparison. The MATLAB code for the method and simulations are made available on Github222https://github.com/cshen6/GraphEmd.
2 Method
The graph fusion embedding takes as input graphs with a common set of vertices and a label vector representing communities. For vertices with unknown labels, the corresponding entry in the label vector is set to , and such labels are not used in the embedding process.
-
•
Input: The graphs and a label vector .
-
•
Step 1: For each , compute the number of observations per-class
-
•
Step 2: Compute the one-hot encoding matrix based on , then normalize by the number of observations per-class. Specifically, for each vertex , we set
if and only if , and otherwise. Note that vertices with unknown labels are unused and effectively zero, i.e., is a zero vector if .
-
•
Step 3: For each graph , calculate the graph encoder embedding:
-
•
Step 4: Let denote each row of , and be the Euclidean norm. For each and each where , normalize the non-zero row by the norm
then construct the row-concatenated embedding by setting
for each vertex .
-
•
Output: The graph fusion embedding .
-
•
Vertex Classification: Train a nearest-neighbor classifier using with known labels.
The computation complexity of the graph fusion embedding is , where is the number of entries in each graph. Step 1 and 2 are shared across all graphs, and step 3 is carried out separately for each graph, allowing for parallelization and further reducing the running time to . Note that if , the fusion embedding is equivalent to the normalized graph encoder embedding for a single graph [23]. Additionally, for sparse graphs, step 3 can be implemented in linear time using two simple edgelist operations. In terms of computation efficiency, the encoder embedding outperforms any existing graph embedding approach and can process millions of edges in just a few seconds [22, 24].
In the supervised setting, the label vector is always available. During steps 1 to 3 of the graph fusion embedding process, the labels of training vertices are used to construct the matrix, while the labels of testing vertices are set to zero and remain unused throughout the embedding process. It is important to note that both the training and testing vertices are present in the graph, and as a result, the resulting embedding provides representations for all vertices in the graph. Let be a random variable taking values in that represents the true label for any testing vertex , and let denotes a classifier function. The true classification error can be denoted as
Throughout the paper we used the 5-nearest-neighbor classifier, which suffices for the asymptotic theory and performs well in experiments. However, other classifiers such as discriminant analysis, random forest, or a simple two-layer neural network can be readily used and yield similar numerical outcomes.
3 Theory on Binary Graph
3.1 The Stochastic Block Model
The binary graph serves as the foundation of most graph methods and is commonly used in various applications. To demonstrate the functionality of graph fusion embedding on binary graphs, we focus on the stochastic block model (SBM) for both theoretical analysis and simulations.
Under SBM, each vertex in a graph is assigned a label . The probability of an edge between a vertex from class and a vertex from class is determined by a block probability matrix , and for any it holds that
It is worth mentioning that this formulation generates a directed graph, but it can be easily adapted for an undirected graph by setting for all . The choice of directed or undirected graph does not affect the method or theory, and in this case, we opt for the directed case. Additionally, the graph may or may not have self-loops, i.e., could be or , and the method and the theorems still hold.
The degree-corrected stochastic block model (DC-SBM) is an extension of the SBM that accounts for the sparsity observed in real graphs [14]. In addition to the parameters defined in the SBM, each vertex is associated with a degree . When conditioned on the degrees, each edge from vertex to another vertex is independently generated as follows:
As standard SBM is a special case where all degrees are , it suffices to consider the DC-SBM graphs for theory purpose.
Finally, the class labels are assumed to follow a categorical distribution with prior probability . Under this assumption, as the number of vertices increases to infinity, the number of vertices within each class also converges to infinity. If not, asymptotically approaches , rendering class trivial in the model.
3.2 Convergence of the Fusion Embedding
Given graphs from DC-SBM with a common vertex set, we define as the row-normalized block probability matrix of , such that for each row ,
Then we form the row concatenation of all as:
The first theorem demonstrates that given DC-SBM graphs, the graph fusion embedding converges to the normalized and concatenated block probability matrix.
Theorem 1.
Suppose that follows the DC-SBM model in Section 3.1. Let be the number of vertices with known labels. Then, for any vertex belonging to class , its graph fusion embedding satisfies:
Proof.
First, based on the convergence theorem in [22], under the DC-SBM model, the un-normalized embedding for vertex of class satisfies
It is important to note that the above conditioning assumes knowledge of everything about vertex , including the degree and class label . It follows that the Euclidean norm satisfies
Then, the normalized embedding satisfies
By concatenating every dimension from to within graph , we obtain:
The graph fusion embedding is a row-concatenation of for , so it follows that
where is the row concatenation of every . ∎
3.3 Asymptotic Perfect Separation
Under DC-SBM, the normalized and concatenated block probability matrix fully determines the embedding. As a result, there exists a simple condition to ensure the embedding is asymptotically perfect for vertex classification. In the context of vertex classification, both the training and testing vertices follow the same asymptotic convergence in Theorem 1, with the only difference being that the training labels are known while the testing labels are not observed. We denote the finite-sample nearest-neighbor classification error using graphs and training vertices as .
Theorem 2.
Suppose that follows the DC-SBM model in Section 3.1. As the number of training vertices increases to infinity, the graph fusion embedding achieves asymptotically perfect vertex classification, i.e.,
if and only if there are no repeating rows in .
Proof.
First, it is important to note that the convergence described in Theorem 1 applies to both training vertices and testing vertices, as both use the same matrix that is based on the labels of the training vertices only. Consequently, the embedding for a testing vertex of class asymptotically equals the embedding for all training vertices of class , which in turn converges to .
Perfect classification is achievable only when the vertex embedding of each class are completely distinct and well-separated from the vertex embedding of all other classes. Consequently, the testing vertices can be classified perfectly if and only if for all pairs of classes . This condition is met if and only if every row of is unique. ∎
In essence, the graph fusion embedding can achieve perfect classification when there is no overlap between the rows of , meaning that each row represents a unique class. Conversely, if any two rows of coincide, then the embedding vectors for vertices in those two classes will also coincide, making them indistinguishable.
It is worth noting that the theorem also suggests that the nearest-neighbor classifier is sufficient for the graph fusion embedding on DC-SBM graphs, as the vertex embedding within each class become the same point mass asymptotically. Discriminant analysis performs similarly, while more complicated classifiers like random forest and simple two-layer neural networks shall work equally well, but they are computationally excessive for this task.
3.4 The Synergistic Effect
Theorem 3.
Suppose that follows the DC-SBM model in Section 3.1. For any subset of graphs , the classification error using the fusion embedding satisfies:
for sufficiently large sample size .
Proof.
As the graph fusion embedding converges to the block probability matrix, it suffices to consider the concatenated block matrices. Let denote the concatenated block matrix for graphs, and as the concatenated block matrix for the remaining graphs, i.e.,
The graph fusion embedding using only graphs asymptotically equals , and the embedding using graphs asymptotically equals .
If there are no repeating rows in , then the classification is already perfect using the fusion embedding of graphs. Moreover, all rows will remain unique in , ensuring that the classification remains perfect when using the fusion embedding of all graphs. Therefore, for sufficiently large , using more graphs in the fusion embedding cannot deteriorate the classification performance.
On the other hand, if there exists a pair such that
i.e., using the fusion embedding of graphs, vertices in class cannot be separated from vertices in class . However, if the remaining graphs can separate these two classes, we have
and
Namely, these two classes may become perfectly separable using the fusion embedding of all graphs. Therefore, for sufficiently large , adding additional graphs never deteriorates the classification performance, but has the potential to improve and successfully classify previously mis-classified vertices. Consequently,
∎
Therefore, as more graphs are collected and included, vertex classification via the graph fusion embedding always achieves equal or better performance. If an included graph contains pure noise, the classification error does not deteriorate; however, any graph that contains additional signal to better separate classes can lead to a reduction in classification error. It is important to note that the theorems are based on asymptotic analysis, and the finite-sample error may still exhibit minimal deterioration, especially for small vertex sizes.
4 Extension to General Graphs
4.1 A General Graph Model
To understand how the graph fusion embedding can be applied to weighted graphs or distance transformation of vertex attributes, we consider the following general graph model. For any fixed vertex , we assume that
and the densities have finite moments. Namely, each row of the adjacency matrix is independently and identically distributed when conditioning on vertex . Note that when we condition on the vertex , it means that all relevant information associated with that vertex are known, including its degree, class label, or Euclidean position, depending on the underlying distribution of the entries in the adjacency matrix.
This model includes a wide range of graph representations, including the aforementioned degree-corrected stochastic block model (DC-SBM), the random dot product graph model [25], as well as a pairwise distance or kernel matrix from Euclidean space. To illustrate, consider the scenario where we have vertex attributes for each vertex , and we construct a Euclidean distance matrix where . Under this transformation, when we condition on the attributes , the entries and are independently and identically distributed for any .
4.2 Convergence under General Graph
Given the above model, we define the following conditional expectation for the th graph:
which is a K-dimensional vector. We then define the normalized vector as follows:
Finally, we form the concatenated mean matrix as follows:
which represents the concatenation of all the normalized conditional expectation vectors for vertex across all graphs.
Theorem 4.
Suppose that follows the general graph model in Section 4.1. Let be the number of vertices with known labels. Then, for any vertex belonging to class , its graph fusion embedding satisfies:
Proof.
For each :
Given vertex , each are independently and identically distributed, and they have finite moments. As increases to infinity, so is , and law of large numbers applies:
Then the Euclidean norm satisfies
and
By concatenating all dimensions within the th graph, we obtain:
Finally, by concatenating all individual graph embedding into the fusion embedding, we have:
∎
Thus, in the context of a general graph model, the fusion embedding provides point masses represented by the concatenated conditional means. The location of each point mass is determined by the specific vertex under consideration, reflecting the characteristics of the underlying graph model. For example, under the DC-SBM graph, , implying that all vertices belonging to the same class share a common point. This effectively reduces embedding position to points, where each point corresponds to a distinct class.
4.3 Vertex Classification under General Graph
Let denotes the density family where each represents all possible from class . Generally, is continuous, but in specific cases, such as discrete graph models, the density can be discrete, e.g., under DC-SBM, and otherwise. Using the density characterization, the next theorem expands the results of Theorem 2 and Theorem 3 to the general graph model. It establishes a general condition for achieving asymptotically optimal classification through the fusion embedding and demonstrates the presence of a synergistic effect in general scenarios.
Theorem 5.
Suppose that follows the general graph model in Section 4.1. As the number of training vertices increases to infinity, the graph fusion embedding achieves asymptotically perfect vertex classification, i.e.,
if and only if
| (1) |
for any .
Additionally, for any subset of graphs , the classification error using the fusion embedding satisfies:
for sufficiently large sample size .
Proof.
As the fusion embedding converges to the concatenated class-conditional means, it suffices to focus on the density family to analyze the classification performance. When all densities are distinct from each other, it implies that vertex embedding for each class are asymptotically separated from embedding of other classes, leading to perfect classification. In other words, the embedding in class is perfectly distinguishable from the embedding in class if and only if . This condition extends to Equation 1 by considering all possible pairs.
Regarding the synergistic property, let represents the densities using graphs, and represents the densities using all graphs. Assuming Equation 1 is not equal to zero for embedding using graphs, we define:
as the set of mis-classified points. An element has at least one pair of such that , meaning that may occur in both class and class , making these two classes not perfectly separable.
Now, upon adding an additional graphs, the element is appended more entries from the additional graphs, leading to . Either and it remains a mis-classified point, or is perfectly separable based on the additional graphs, leading to for the fusion embedding using graphs. On the other hand, any element not in is already separable in the , and still separable in the larger, appended space. Therefore, we have:
indicating that the probability of mis-classification is either the same or reduced as more graphs are included in the fusion embedding. ∎
5 Simulations
In this section, we conduct three simulations to demonstrate the synergistic effect of the graph fusion embedding. The classifier being used is the 5-nearest-neighbor classifier throughout all simulations and real data. The main paper focuses on presenting the graph fusion embedding, while the appendix contains a comparison to three benchmark methods: the omnibus embedding (Omnibus) [26, 27], multiple adjacency spectral embedding (MASE) [21], and unfolded spectral embedding (USE) [28]. These benchmark methods serve as reference points to assess the performance and advantages of the graph fusion embedding.
Simulation 1
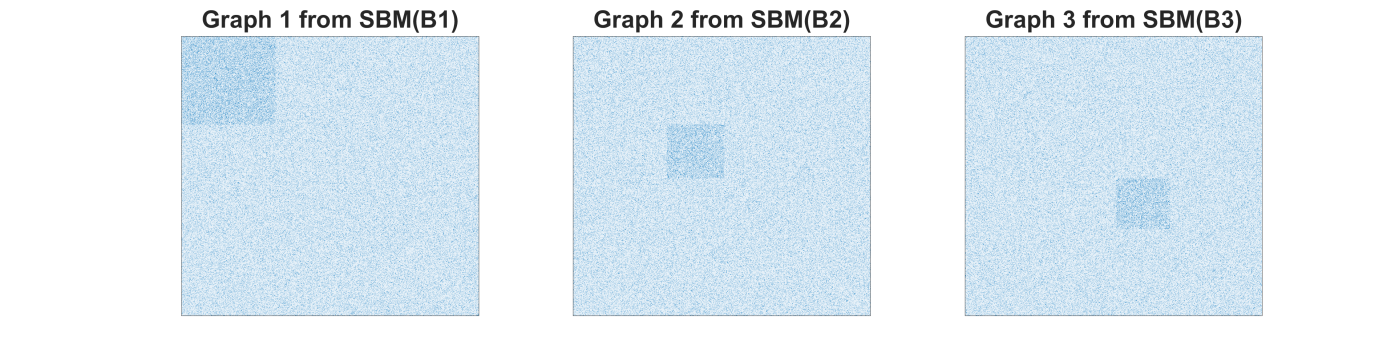
We consider a scenario with classes, where the prior probabilities for each vertex to belong to class are set to . Three SBM graphs are generated with block probability matrices . For each , the probabilities are for all , except for . This means that the th class has a stronger connection in graph . A visualization of this setup is provided in Figure 1. While no single graph is asymptotically perfect for classification, the concatenated block probability matrix
satisfies the condition in Theorem 2. Therefore, each graph provides additional information to aid in separating the communities, and using all three graphs leads to asymptotic perfect classification.
Simulation 2
Simulations 2 uses the same settings as simulation 1, except that the three graphs are generated using DC-SBM. The parameters are the same as above, and the degrees are drawn independently from a uniform distribution in the interval .
Simulation 3
This simulation involves starting with one signal graph and progressively adding independent graphs. The number of classes remains at four with the same prior probability. We first generate using SBM with the block probability matrix , which has in off-diagonal entries and in diagonal entries. Next, we generate five independent SBM graphs for with the block probability matrix being in all entries. The concatenated block probability matrix always satisfies Theorem 2, even in the presence of independent graphs, i.e.,
Theorems 2 and 3 predict that the classification error should stay almost the same with the addition of noisy graphs.
Results
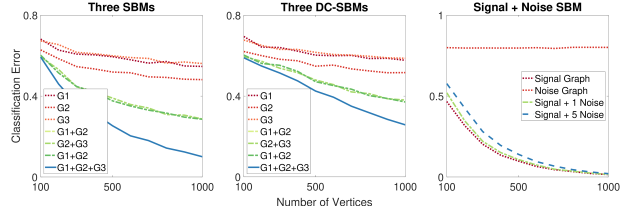
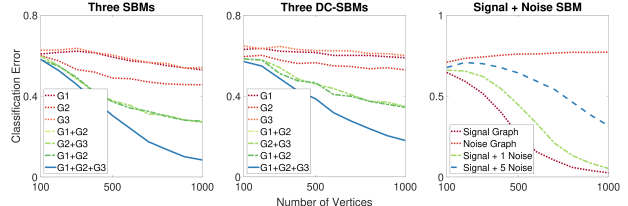
In both simulation 1 and simulation 2, the classification error improves with the inclusion of more graphs, as illustrated in the left and center panels of Figure 2. Using two graphs yields a lower error than using only one graph, and using all three graphs yields the lowest error. This is because each new graph contains new signal about the labels, so including a new graph shall always yields better performance.
In simulation 3, only the first graph is related to the label, while all additional graphs are essentially noise. The addition of noise graphs has a minimal effect on the classification error of fusion embedding as the number of vertices increases, as shown in the right panels of Figure 2. This suggests that the graph fusion embedding is robust and maintains its performance despite the inclusion of noise graphs.
In the appendix, the same simulations were conducted for three competing methods: Omnibus, MASE, and USE. In both simulation 1 and simulation 2, all three methods demonstrated an improvement in performance. However, in simulation 3, where noise graphs were introduced, all competitor methods exhibited a significant degradation in classification error. Therefore, graph fusion embedding is the only method that performed consistently well throughout the simulations.
6 Real Data
In this section, we showcase the performance and synergistic effect of the graph fusion embedding using a wide range of real-world graphs. The dataset consists of various types of graphs, including binary graphs, weighted graphs, directed and undirected graphs, as well as general graphs such as distance matrices of vertex attributes. The majority of the data were sourced from the network repository [29], while a few were collected directly by the authors. All the public data has been properly formatted in MATLAB and is made available on GitHub333https://github.com/cshen6/GraphEmd. The results for Omnibus, MASE, and USE methods are provided in the Appendix for comparison.
6.1 Two-Graph Data
Table 1 presents the 5-fold classification error for five graph datasets, each having two graphs. The results are reported as the mean and standard deviation over Monte-Carlo replicates. A brief description of each data and pre-processing steps is as follows:
- •
-
•
The cora dataset [32] is a citation network with vertices and edges and classes, and each vertex has a -dimensional 0/1 vertex attribute, indicating the absence or presence of corresponding words from the dictionary. is a binary matrix indicating the existence of edges, while where is the pairwise cosine distance matrix of the vertex attributes and is the matrix of ones.
-
•
The citeseer data [33] is another citation network with vertices and edges and classes, with a vertex attribute of dimensions. We apply the same processing as in the cora dataset to yield a binary graph and a general graph from the cosine distance of the attributes.
-
•
The IMDB [34] data consists of two slighly un-matched graphs, one with binary labels and vertices, and another with three-class labels and vertices. We remove the unmatched vertices to ensure a common vertex set, and use the -class label as the label vector.
-
•
COIL-RAG has vertices with edges, classes, and a vertex attribute of dimensions. is a binary matrix indicating the existence of edges, while where is the pairwise Euclidean distance matrix of the vertex attributes.
In the cora and citeseer datasets, we employed the cosine distance as it is a widely-used and effective distance measure in word-frequency analysis [35]. Additionally, we transformed the distance matrix by subtracting the distance entries from the maximum value in the distance matrix, denoted as (which equals for cosine distance). This transformation ensures that the resulting matrix is a valid kernel or similarity matrix [36].
The comparison presented in Table 1 with the tables in the Appendix clearly demonstrates that the graph fusion embedding outperforms all other methods by a significant margin across all real datasets, regardless of whether it involves single graph classification, multiple binary graph classification, or multiple general graphs. The only exception is the C-elegans data, where the fusion embedding exhibits slightly lower performance, likely due to the small size of the vertex set. Furthermore, the graph fusion embedding consistently exhibits improved classification performance as more graphs are included, while other methods may display worse errors as more graphs are added, similar to their performance in simulation 3.
| Graph 1 | Graph 2 | Graph 1+2 | |
|---|---|---|---|
| C-elegans | |||
| Cora | |||
| Citeseer | |||
| COIL-RAG | |||
| IMDB |
6.2 Three-Graph and Three-Label Data
The letter dataset consists of three binary graphs, named letter-high, letter-med, and letter-low, each of which has its own label vector with a total of classes. The graphs contain over vertices and , and edges, respectively. After removing several unmatched vertices, we use all three graphs to predict the class labels, and the results are shown in Table 2. The results show that the fusion embedding consistently exhibits the synergistic effect. Specifically, the classification error for each graph and its corresponding label is better than that of a mismatched pair, for example using Letter-High to predict Label-High results in better error than using Letter-Mid for the same task. Additionally, using all three graphs yields the best classification error in all cases.
| Letter-High | Letter-Med | Letter-Low | All Graphs | |
|---|---|---|---|---|
| Label-High | ||||
| Label-Med | ||||
| Label-Low |
6.3 Four-Graph Wikipedia Data
The Wikipedia dataset consists of four disparate graph representations we collected from Wikipedia articles [37, 20]. The dataset has a total of Wikipedia articles based on a 2-neighborhood of the English article “Algebraic Geometry” and the corresponding French articles. Latent Dirichlet Allocation is applied to the word-frequency of each article to calculate the English text feature and French text feature, from which we generate two graphs and via the cosine distance transformation. The hyperlink information in the English articles and the corresponding French articles yields and . All articles are manually labeled into disjoint classes: category, people, locations, date, math.
Table 3 displays the classification errors using 5-nearest-neighbor on graph fusion embedding for the Wikipedia dataset, which demonstrates the synergistic effect. The best error is obtained when all four graphs are utilized, which is slightly better than using only the two text graphs. This indicates that the hyperlink information does not add much signal over the text information in predicting the given labels. Additionally, comparing to the competitors in the appendix, the graph fusion embedding consistently outperforms the other methods in actual classification error and is the only method that exhibits the synergistic effect.
| English Text | French Text | English Hyperlinks | French Hyperlinks | |
| One Graph | ||||
| Two Graphs | (1+2) | (2+4) | (1+3) | (3+4) |
| Three Graphs | (-4) | (-3) | (-2) | (-1) |
| All | ||||
7 Discussion
This paper presented the graph fusion embedding, and provided compelling evidence on its theoretical soundness and numerical advantages. The most important feature of this method is the synergistic effect, which results in improved numerical performance as more graphs are included. To some extent, the method can be viewed as a supervised and deterministic version of spectral embedding, but without requiring any additional transformation, and works well for general graphs. In contrast, most competitor methods require extra alignment or additional singular value decomposition.
This paper opens up several promising directions for future research. Firstly, while the current manuscript focuses on supervised settings, exploring the unsupervised and semi-supervised cases would be valuable. Even without labels, graph encoder embedding can be computed using fast labeling methods such as Leiden and label propagation [38, 39, 40], or iterative refinement techniques with random label initialization [23]. A fusion version without label is definitely possible but might require additional tuning. Secondly, as the dimensionality of the concatenated embedding may become high for large values of or , investigating dimension reduction techniques and further explanation and interpretation of the dimensions would be interesting. Thirdly, since the graph encoder embedding can be used for distance and kernel matrices, exploring connections with other areas like multi-dimensional scaling [41, 42, 43], distance and kernel correlation [44, 45, 46], etc., could yield valuable insights. Lastly, the application of this method to general graphs suggests its potential to improve existing data fusion tasks, as long as an appropriate metric can be identified. Therefore, exploring more applications using this method and possible variants on different data regimes would be an exciting avenue for future research.
References
- [1] M. Girvan, M. E. J. Newman, Community structure in social and biological networks, Proceedings of National Academy of Science 99 (12) (2002) 7821–7826.
- [2] M. E. J. Newman, The structure and function of complex networks, SIAM Review 45 (2) (2003) 167–256.
- [3] A.-L. Barab’asi, Z. N. Oltvai, Network biology: Understanding the cell’s functional organization, Nature Reviews Genetics 5 (2) (2004) 101–113.
- [4] S. Boccaletti, V. Latora, Y. Moreno, M. Chavez, D.-U. Hwang, Complex networks: Structure and dynamics, Physics Reports 424 (4-5) (2006) 175–308.
- [5] L. Varshney, B. Chen, E. Paniagua, D. Hall, D. Chklovskii, Structural properties of the caenorhabditis elegans neuronal network, PLoS Computational Biology 7 (2) (2011) e1001066.
- [6] J. Ugander, B. Karrer, L. Backstrom, C. Marlow, The anatomy of the facebook social graph, arXiv preprint arXiv:1111.4503 (2011).
- [7] K. Rohe, S. Chatterjee, B. Yu, Spectral clustering and the high-dimensional stochastic blockmodel, Annals of Statistics 39 (4) (2011) 1878–1915.
- [8] D. Sussman, M. Tang, D. Fishkind, C. Priebe, A consistent adjacency spectral embedding for stochastic blockmodel graphs, Journal of the American Statistical Association 107 (499) (2012) 1119–1128.
- [9] T. N. Kipf, M. Welling, Semi-supervised classification with graph convolutional networks, in: International Conference on Learning Representations, 2017.
- [10] Z. Wu, S. Pan, F. Chen, G. Long, C. Zhang, P. S. Yu, A comprehensive survey on graph neural networks, IEEE Transactions on Neural Networks and Learning Systems 32 (2019) 4–24.
- [11] A. Grover, J. Leskovec, node2vec: Scalable feature learning for networks, in: Proceedings of the 22nd ACM SIGKDD international conference on Knowledge discovery and data mining, 2016, pp. 855–864.
- [12] R. Liu, A. Krishnan, Pecanpy: a fast, efficient and parallelized python implementation of node2vec, Bioinformatics 37 (19) (2021) 3377–3379.
- [13] B. Karrer, M. E. J. Newman, Stochastic blockmodels and community structure in networks, Physical Review E 83 (2011) 016107.
- [14] Y. Zhao, E. Levina, J. Zhu, Consistency of community detection in networks under degree-corrected stochastic block models, Annals of Statistics 40 (4) (2012) 2266–2292.
- [15] B. Perozzi, R. Al-Rfou, S. Skiena, Deepwalk: Online learning of social representations, in: Proceedings of the 20th ACM SIGKDD international conference on Knowledge discovery and data mining, ACM, 2014, pp. 701–710.
- [16] S. Ranshous, S. Shen, D. Koutra, S. Harenberg, C. Faloutsos, N. F. Samatova, Anomaly detection in dynamic networks: a survey, Wiley Interdisciplinary Reviews: Computational Statistics 7 (3) (2015) 223–247.
- [17] L. Akoglu, H. Tong, D. Koutra, Graph based anomaly detection and description: A survey, Data Mining and Knowledge Discovery 29 (3) (2015) 626–688.
- [18] Y. Park, C. E. Priebe, A. Youssef, Anomaly detection in time series of graphs using fusion of graph invariants, IEEE J. Sel. Top. Signal Process. 7 (2013) 67–75.
- [19] V. Lyzinski, D. Fishkind, C. E. Priebe, Seeded graph matching for correlated Erdos-Renyi graphs, Journal of Machine Learning Research 15 (2014) 3513–3540.
- [20] C. Shen, J. T. Vogelstein, C. Priebe, Manifold matching using shortest-path distance and joint neighborhood selection, Pattern Recognition Letters 92 (2017) 41–48.
- [21] J. Arroyo, A. Athreya, J. Cape, G. Chen, C. E. Priebe, J. T. Vogelstein, Inference for multiple heterogeneous networks with a common invariant subspace, Journal of Machine Learning Research 22 (142) (2021) 1–49.
- [22] C. Shen, Q. Wang, C. E. Priebe, One-hot graph encoder embedding, IEEE Transactions on Pattern Analysis and Machine Intelligence 45 (6) (2023) 7933 – 7938.
- [23] C. Shen, Y. Dong, J. Larson, H. Trinh, Y. Park, C. E. Priebe, Sufficient dimension reduction and principal community discovery via graph encoder embedding, https://arxiv.org/abs/2303.18051 (2023).
- [24] C. Shen, J. Larson, H. Trinh, X. Qin, Y. Park, C. E. Priebe, Discovering communication pattern shifts in large-scale networks using encoder embedding and vertex dynamics, https://arxiv.org/abs/2305.02381 (2023).
- [25] S. Young, E. Scheinerman, Random dot product graph models for social networks, in: Algorithms and Models for the Web-Graph, Springer Berlin Heidelberg, 2007, pp. 138–149.
- [26] C. E. Priebe, D. J. Marchette, Z. Ma, S. Adali, Manifold matching: Joint optimization of fidelity and commensurability, Brazilian Journal of Probability and Statistics 27 (3) (2013) 377–400.
- [27] V. Lyzinski, Y. Park, C. E. Priebe, M. W. Trosset, Fast embedding for jofc using the raw stress criterion, Journal of Computational and Graphical Statistics 26 (4) (2017) 786–802.
- [28] I. Gallagher, A. Jones, P. Rubin-Delanchy, Spectral embedding for dynamic networks with stability guarantees, Advances in Neural Information Processing Systems (2021).
- [29] R. A. Rossi, N. K. Ahmed, The network data repository with interactive graph analytics and visualization, in: AAAI, 2015.
- [30] D. Pavlovic, P. Vertes, E. Bullmore, W. Schafer, T. Nicholas, Stochastic blockmodeling of the modules and core of the caenorhabditis elegans connectome, PLoS ONE 9 (9) (2014) e97584.
- [31] L. Chen, J. T. Vogelstein, V. Lyzinski, C. E. Priebe, A joint graph inference case study: the c.elegans chemical and electrical connectomes, Worm 5 (2) (2016) 1.
- [32] A. K. McCallum, K. Nigam, J. Rennie, K. Seymore, Automating the construction of internet portals with machine learning, Information Retrieval 3 (2000) 127–163.
- [33] C. L. Giles, K. D. Bollacker, S. Lawrence, Citeseer: An automatic citation indexing system, in: Proceedings of the Third ACM Conference on Digital Libraries, 1998, pp. 89–98.
- [34] P. Yanardag, S. Vishwanathan, Deep graph kernels, in: KDD 15: Proceedings of the 21th ACM SIGKDD International Conference on Knowledge Discovery and Data Mining, 2015, pp. 1365–1374.
- [35] D. Blei, A. Ng, M. Jordan, Latent dirichlet allocation, Journal of Machine Learning Research 3 (2003) 993–1022.
- [36] C. Shen, J. T. Vogelstein, The exact equivalence of distance and kernel methods in hypothesis testing, AStA Advances in Statistical Analysis 105 (3) (2021) 385–403.
- [37] C. Shen, M. Sun, M. Tang, C. E. Priebe, Generalized canonical correlation analysis for classification, Journal of Multivariate Analysis 130 (2014) 310–322.
- [38] V. D. Blondel, J. L. Guillaume, R. Lambiotte, E. Lefebvre, Fast unfolding of communities in large networks, Journal of Statistical Mechanics: Theory and Experiment 10008 (2008) 6.
- [39] V. A. Traag, L. Waltman, N. J. van Eck, From louvain to leiden: guaranteeing well-connected communities, Scientific Reports 9 (2019) 5233.
- [40] U. N. Raghavan, R. Albert, S. Kumara, Near linear time algorithm to detect community structures in large-scale networks, Physical Review E 76 (3) (2007) 036106.
- [41] I. Borg, P. Groenen, Modern Multidimensional Scaling: theory and applications, Springer-Verlag, 2005.
- [42] T. Cox, M. Cox, Multidimensional Scaling, Chapman and Hall, 2001.
- [43] M. W. Trosset, C. E. Priebe, The out-of-sample problem for classical multidimensional scaling, Computational Statistics and Data Analysis 52 (10) (2008) 4635–4642.
- [44] G. Szekely, M. Rizzo, Brownian distance covariance, Annals of Applied Statistics 3 (4) (2009) 1233–1303.
- [45] A. Gretton, R. Herbrich, A. Smola, O. Bousquet, B. Scholkopf, Kernel methods for measuring independence, Journal of Machine Learning Research 6 (2005) 2075–2129.
- [46] C. Shen, S. Panda, J. T. Vogelstein, The chi-square test of distance correlation, Journal of Computational and Graphical Statistics 31 (1) (2022) 254–262.
APPENDIX
Appendix A Additional Experiments
Here we replicate the simulations and experiments for three competitor methods. Unlike the graph fusion embedding, these approaches require choosing a dimension parameter , and we test all possible values of from to . Note that for a single graph, these three methods are essentially the same as the adjacency spectral embedding [8].
The Omnibus method [26, 27] creates a large matrix by using the input adjacency on the diagonal, and computing the average of two adjacency matrices on the off-diagonal sub-matrix. The matrix is then projected into an matrix using spectral embedding via singular value decomposition. Then we use the 5-nearest-neighbor classifier and report the best error for .
The Multiple adjacency spectral embedding (MASE) [21] carries out individual spectral embedding for each adjacency matrix, resulting in an matrix for each graph. These matrices are then concatenated into an matrix, followed by another SVD to obtain an matrix. The best 5-nearest-neighbor error is reported for .
The Unfolded spectral embedding (USE) [28] concatenates all the adjacency matrices into an matrix, followed by SVD to obtain an matrix. The best 5-nearest-neighbor error is reported for .
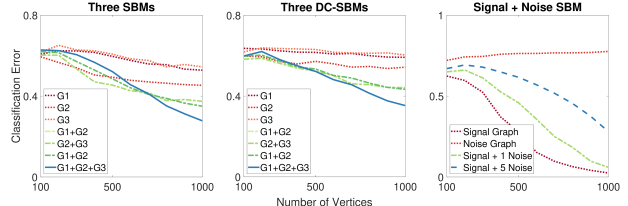
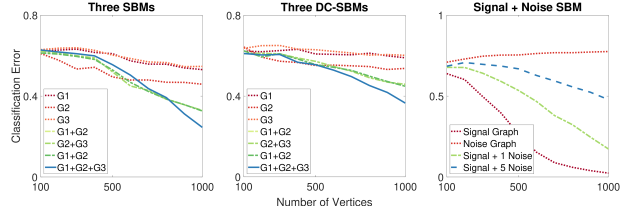
The simulation figures (Figure F1, F2, F3) demonstrate that all three methods are capable of improving classification errors when the additional graph contains signal for the labels. Among the three methods, USE performs the best and has a similar error as the fusion embedding in the main paper. However, in simulation 3, all three methods show a significant degradation in error, especially when five independent graphs are included. For the real data experiments presented in the remaining tables, except for the C-elegans data, all three methods exhibit significantly worse actual classification error compared to the fusion embedding and do not demonstrate the synergistic effect observed for the fusion embedding.
| Graph 1 | Graph 2 | Graph 1+2 | |
|---|---|---|---|
| C-elegans | |||
| Cora | |||
| Citeseer | |||
| COIL-RAG | |||
| IMDB |
| Graph 1 | Graph 2 | Graph 1+2 | |
|---|---|---|---|
| C-elegans | |||
| Cora | |||
| Citeseer | |||
| COIL-RAG | |||
| IMDB |
| Graph 1 | Graph 2 | Graph 1+2 | |
|---|---|---|---|
| C-elegans | |||
| Cora | |||
| Citeseer | |||
| COIL-RAG | |||
| IMDB |
| English Text | English Hyperlinks | French Text | French Hyperlinks | |
| One Graph | ||||
| Two Graphs | (1+2) | (3+4) | (1+3) | (2+4) |
| Three Graphs | (-4) | (-3) | (-2) | (-1) |
| All | ||||
| English Text | English Hyperlinks | French Text | French Hyperlinks | |
| One Graph | ||||
| Two Graphs | (1+2) | (3+4) | (1+3) | (2+4) |
| Three Graphs | (-4) | (-3) | (-2) | (-1) |
| All | ||||
| English Text | English Hyperlinks | French Text | French Hyperlinks | |
| One Graph | ||||
| Two Graphs | (1+2) | (3+4) | (1+3) | (2+4) |
| Three Graphs | (-4) | (-3) | (-2) | (-1) |
| All | ||||