Effectiveness of iNTS vaccination in Sub-Saharan Africa
Abstract
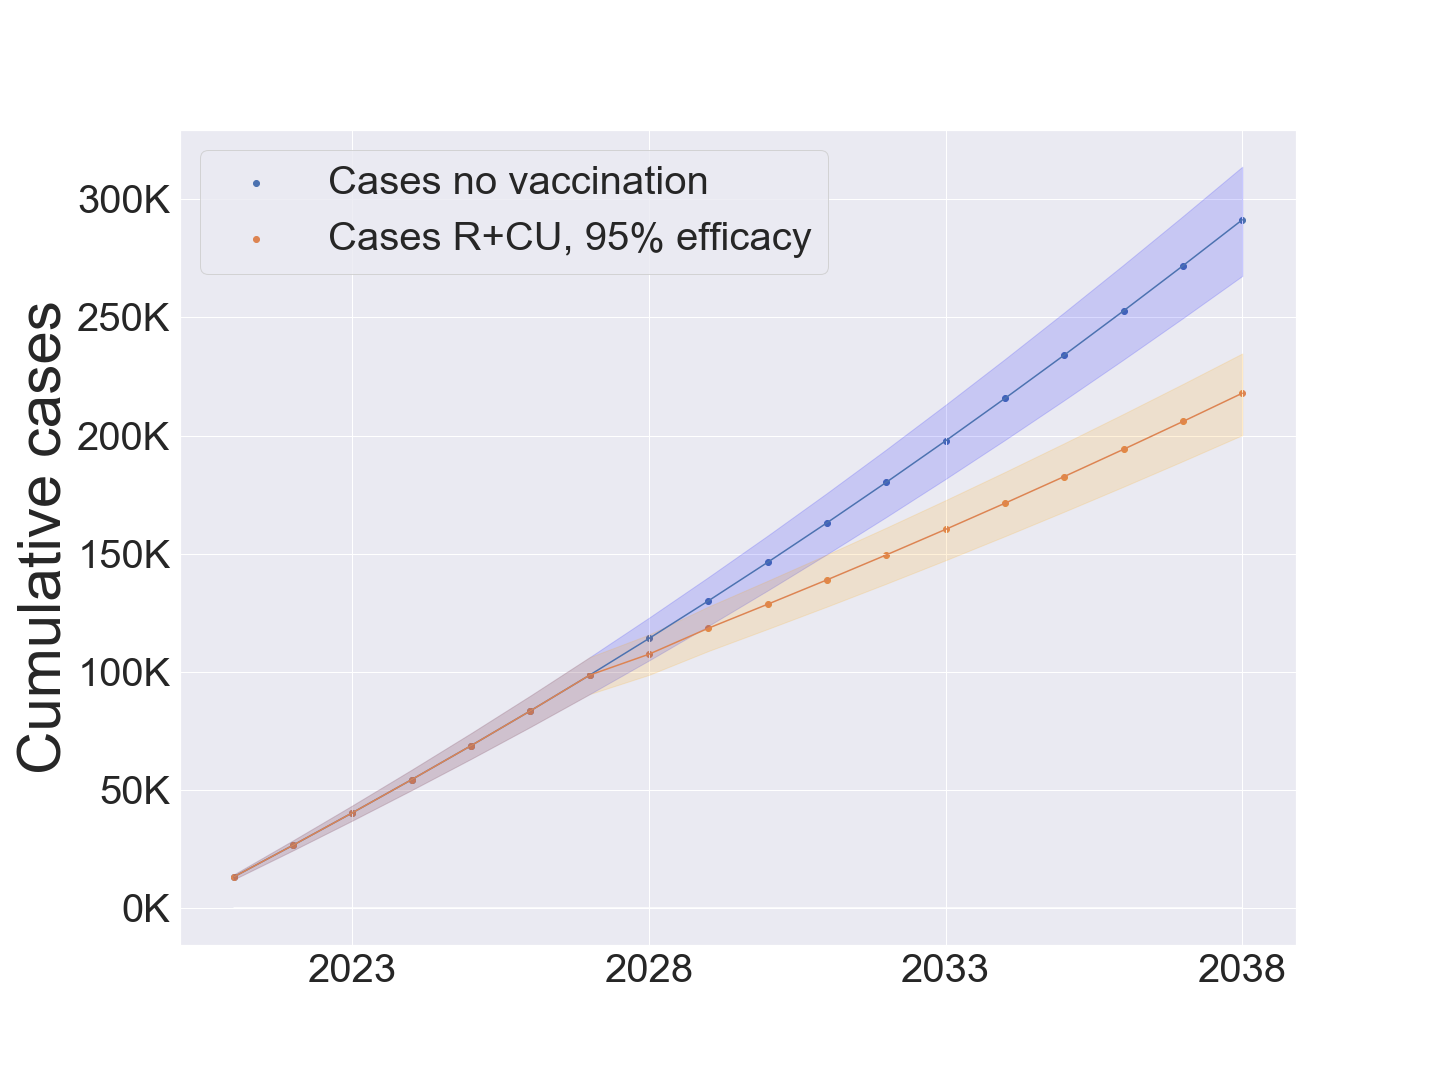
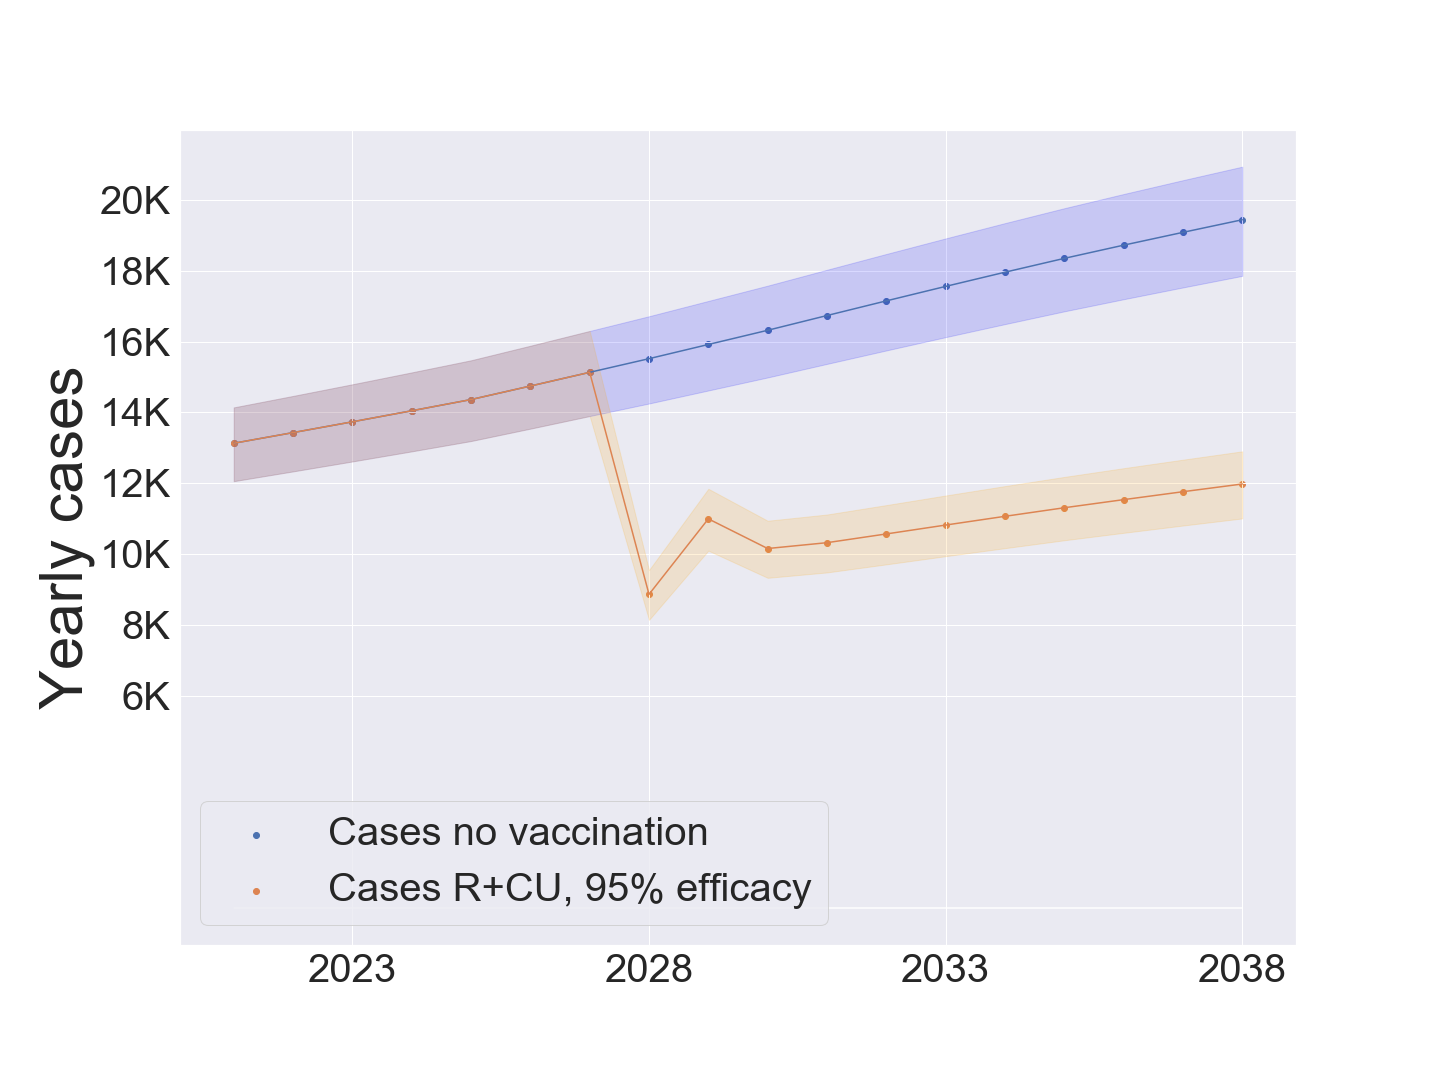
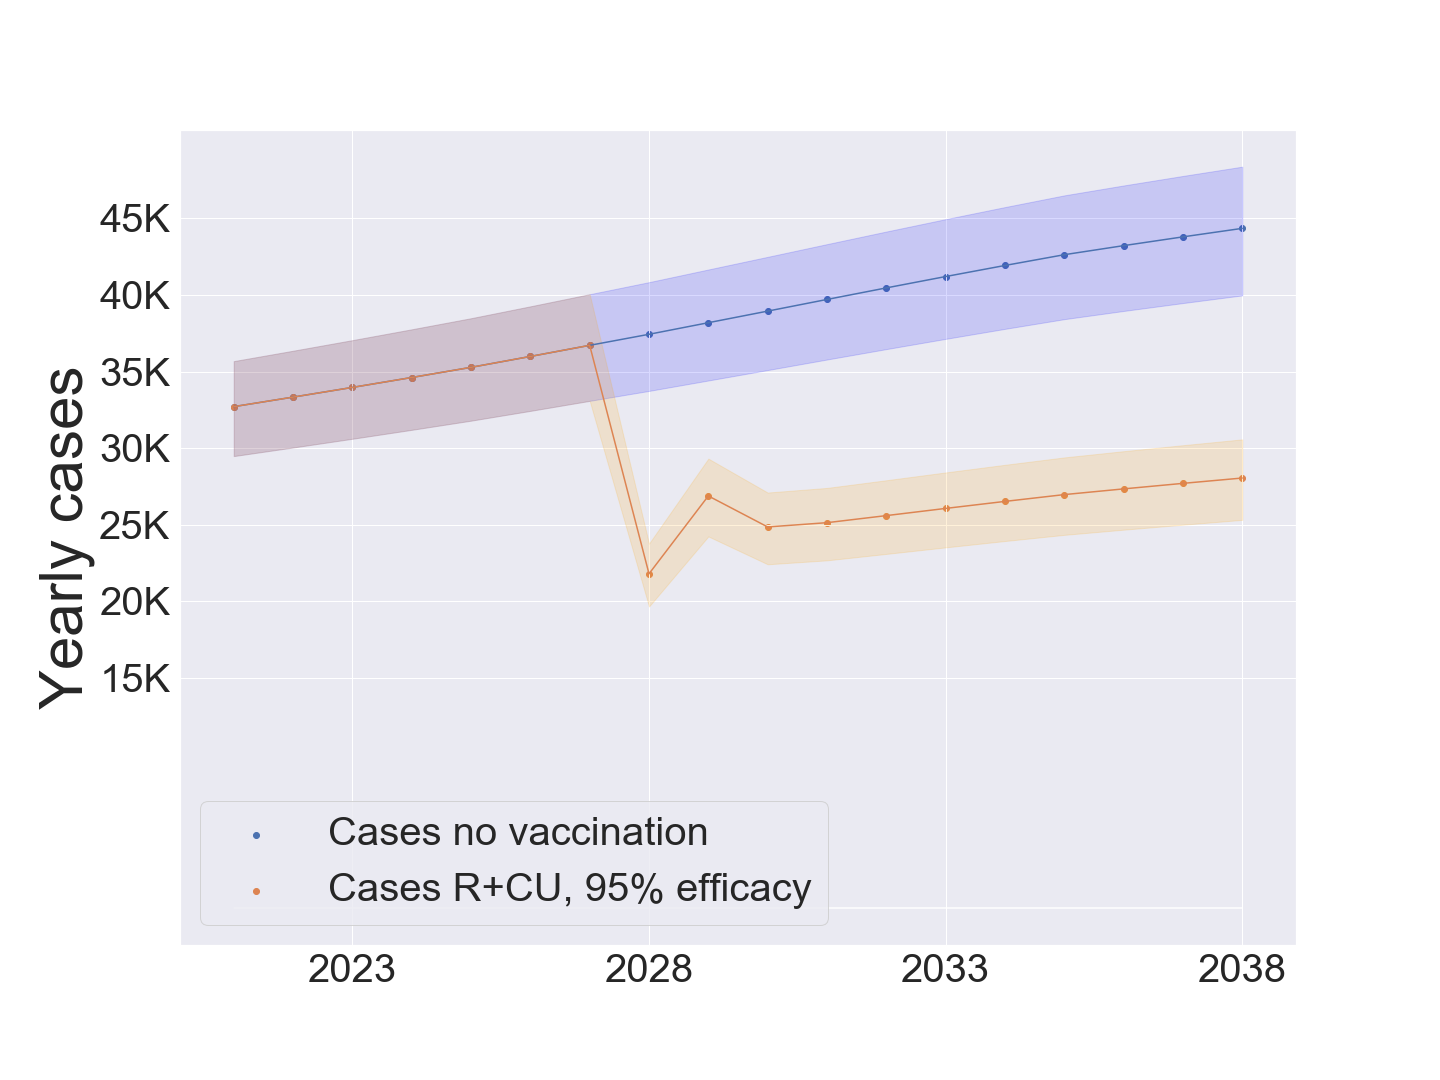
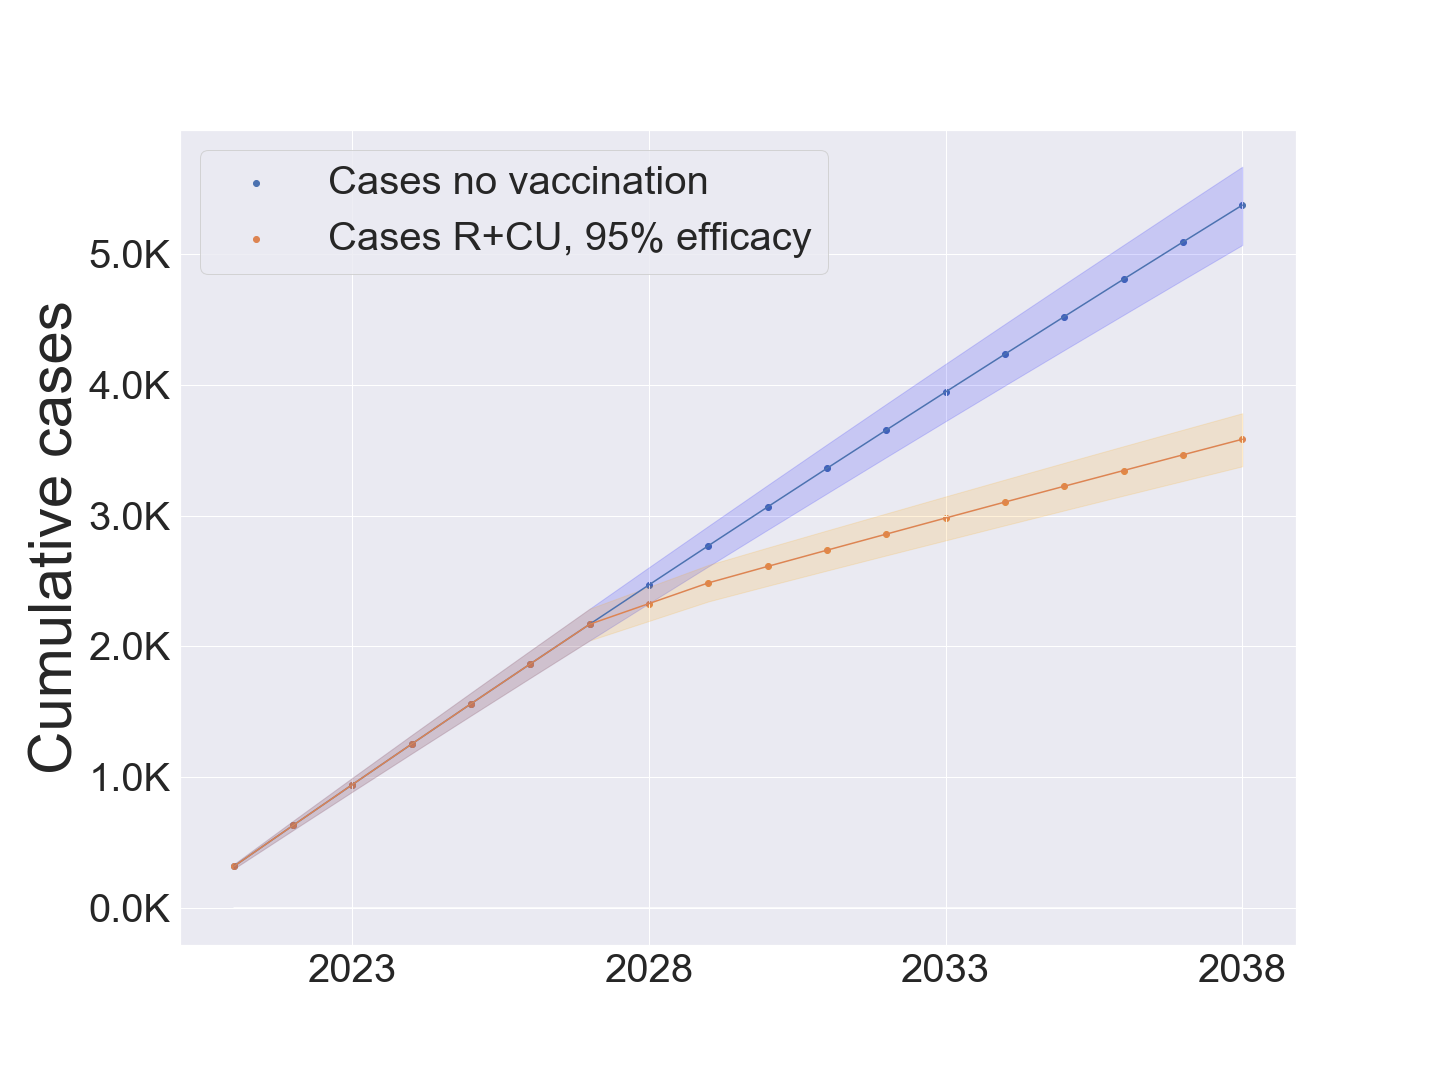
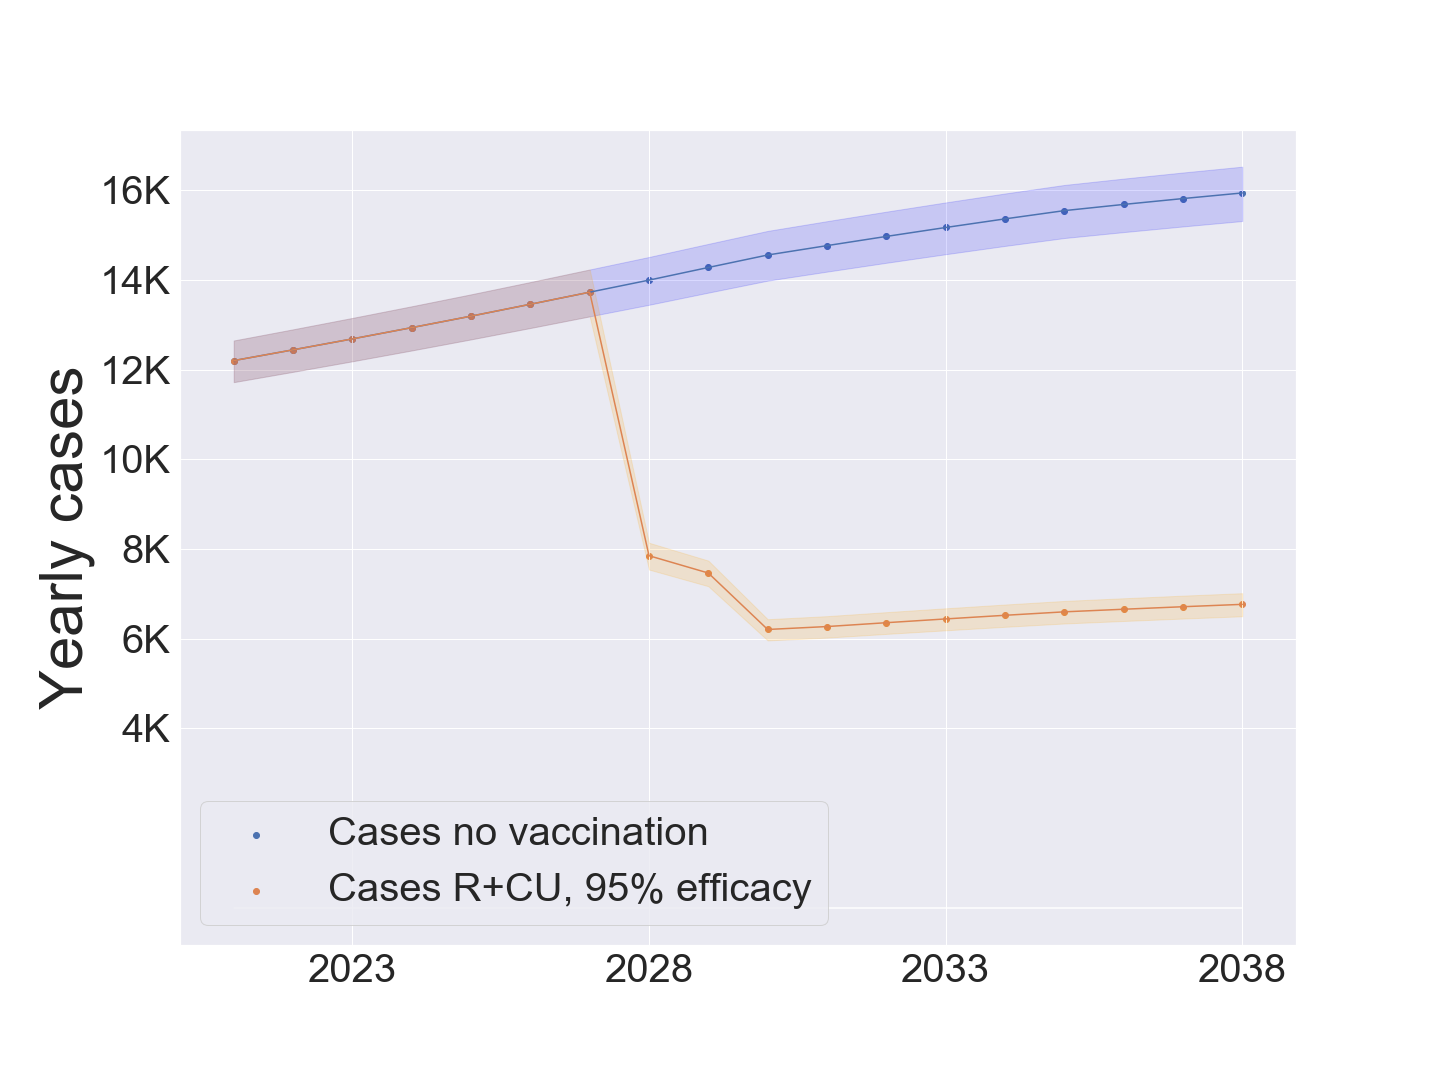
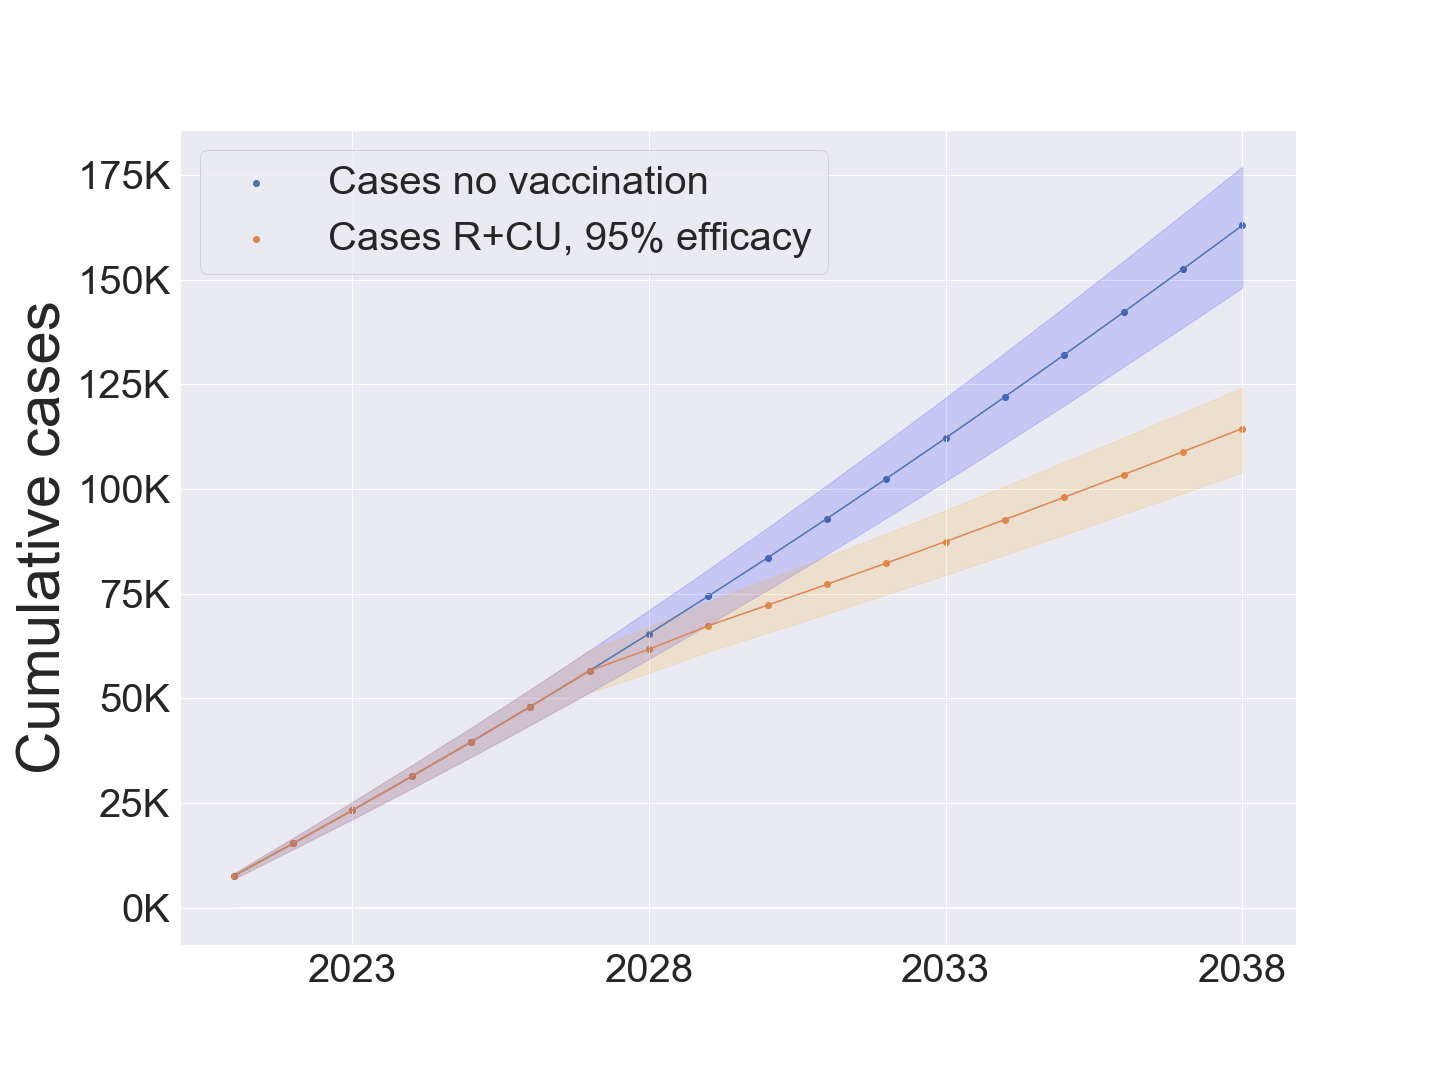
Invasive non-Typhoidal Salmonella (iNTS) is one of the leading causes of blood stream infections in Sub-Saharan Africa, especially among children. iNTS can be difficult to diagnose, particularly in areas where malaria is endemic and difficult to treat, partly because of the emergence of antibiotic resistance. We developed a mathematical model to evaluate the impact of a vaccine for iNTS in 49 countries of sub-Saharan Africa. Without vaccination we estimate 9.2 million new iNTS cases among children below 5 years old in these 49 countries from 2022 to 2038, 6.2 million of which between 2028 and 2038. The introduction of a () efficacy vaccine in 2028 would prevent 2.6 (2.9) million of these new infections. We provide the country-specific impact of a iNTS vaccine considering the different age structures and vaccine coverage levels.
1 Introduction
Non-typhoidal Salmonella invasive (iNTS) disease is an emerging neglected infectious disease that causes a serious global burden of morbidity and mortality. The first global estimates of iNTS disease, produced as part of the Global Burden of Disease (GBD) 2017, showed that iNTS disease affects more than half a million people [535,000 (409,000-705,000) cases] with an average Case Fatality Rates (CFR) of about [49, 35] and 4.26 million (2.38-7.38) DALYs. Most recently, iNTS disease has been globally associated to 87,100 [53,800-131,000] deaths due to bloodstream infection, with an age mortality rate of 1.2 years [20]. INTS is among the 10 top pathogens in the estimation of the years of life lost (YLL) burden [20]. Data on iNTS incidence and the prevalence of complications and case-fatality ratio (CFR) of iNTS [35] has been systematically reviewed on behalf of the Vacc-iNTS Consortium [34]. They have calculated a global incidence ( CI) of 44.8 (31.5-60.5) per 100,000 persons per year, with Africa significantly higher [51.0 (36.3-68.0)] and estimated that approximately of patients with iNTS disease die, similarly to [49]. Approximately of currently reported iNTS cases are observed in sub-Saharan Africa (sSA) [49, 34], where it is among the leading cause of community-acquired bloodstream infections and is associated with increasing antibiotic resistance[55, 28, 43, 1, 16]. In sSA, iNTS disease spreads mostly among children under 5 years of age, with comordibities as malaria, anaemia, malnutrition, and HIV infection being prominent risk factors [49, 34] together with young age. In adults, HIV infection is by far the most important risk factor. These infections usually present as a febrile illness, frequently without gastrointestinal symptoms in both young adults and children, leading to severe, extra-intestinal, invasive bacteremia. iNTS disease has been reported across Africa, demonstrating it is a widespread threat throughout the continent [34, 53, 37, 20] with indication that the disease is endemic in much of the Region.
Over the past years, it has emerged that the serovars Enteritidis and Typhimurium are the ones most commonly associated with iNTS in Africa, causing more than of cases [34, 53, 8] characterized by genome degradation and appear to be adapting to an invasive lifestyle. Recent estimates have been showing the increasing emergence of multidrug-resistant (MDR) S. Typhimurium and S. Enteritidis strains especially in sSA [11, 21, 24, 55], which compromise the clinical treatment of iNTS disease in settings where diagnosis, surveillance programmes and affordable medicines are often scarce [25]. Salmonella spp. have been included in the World Health Organization (WHO) antibiotic-resistant high priority pathogens list and show a concerning increase in MDR [11, 50]. iNTS causes major disease and socioeconomic burden in resource-poor communities, particularly in children, elderly people, and people with HIV infection in sSA, and no vaccine is currently available [51, 4, 45, 20]. Medical need, difficult diagnosis and increasing AMR make the investigation of the sources and transmission pathways of iNTS disease a crucial point to implement effective preventive and control measures and definitely strongly advocate for rapid development of an effective vaccine.
Several iNTS vaccines are currently under development, some of which are bivalent and targeting the two serovars leading causes of iNTS, and include live attenuated, protein-polysaccharide vaccines, multiple antigen presenting system complexes and Outer Membrane Vesicles-based vaccines. The ideal iNTS vaccine should be poor reactogenic, cross-protective against multiple serovars and at affordable production and delivery costs. Among them the generalised modules for membrane antigens (GMMA) of S. enterica serovars Enteritidis and Typhimurium expressed on outer membrane vesicles. The development of this candidate has been carried out also in the context of the S-AFRIVAC project (supported by the Tuscany Region) and is advancing under the H2020 Vacc-iNTS and EDCTP2 PEDVAC- iNTS projects.
To evaluate the impact of the introduction of a vaccine against iNTS on the African burden we developed a mathematical model for the transmission of iNTS disease. We simulate the transmission dynamic for each country separately, using country-specific population pyramids and comorbidity data, as well as vaccine coverage rates. The effect of the introduction of the iNTS vaccine has been evaluated comparing two different scenarios: the status quo, without any intervention, and a vaccination scenario where we consider a catch-up campaign followed by a routine campaign. The catch-up campaign starts in 2028 and lasts for one year, during which children between 9 months and 5 years of age are vaccinated, while the routine vaccination campaign lasts 9 years, during which children are vaccinated upon reaching 9 months of age. The epidemiological trajectories are projected up to 2038, and we consider two levels of vaccine efficacy, and .
2 Results
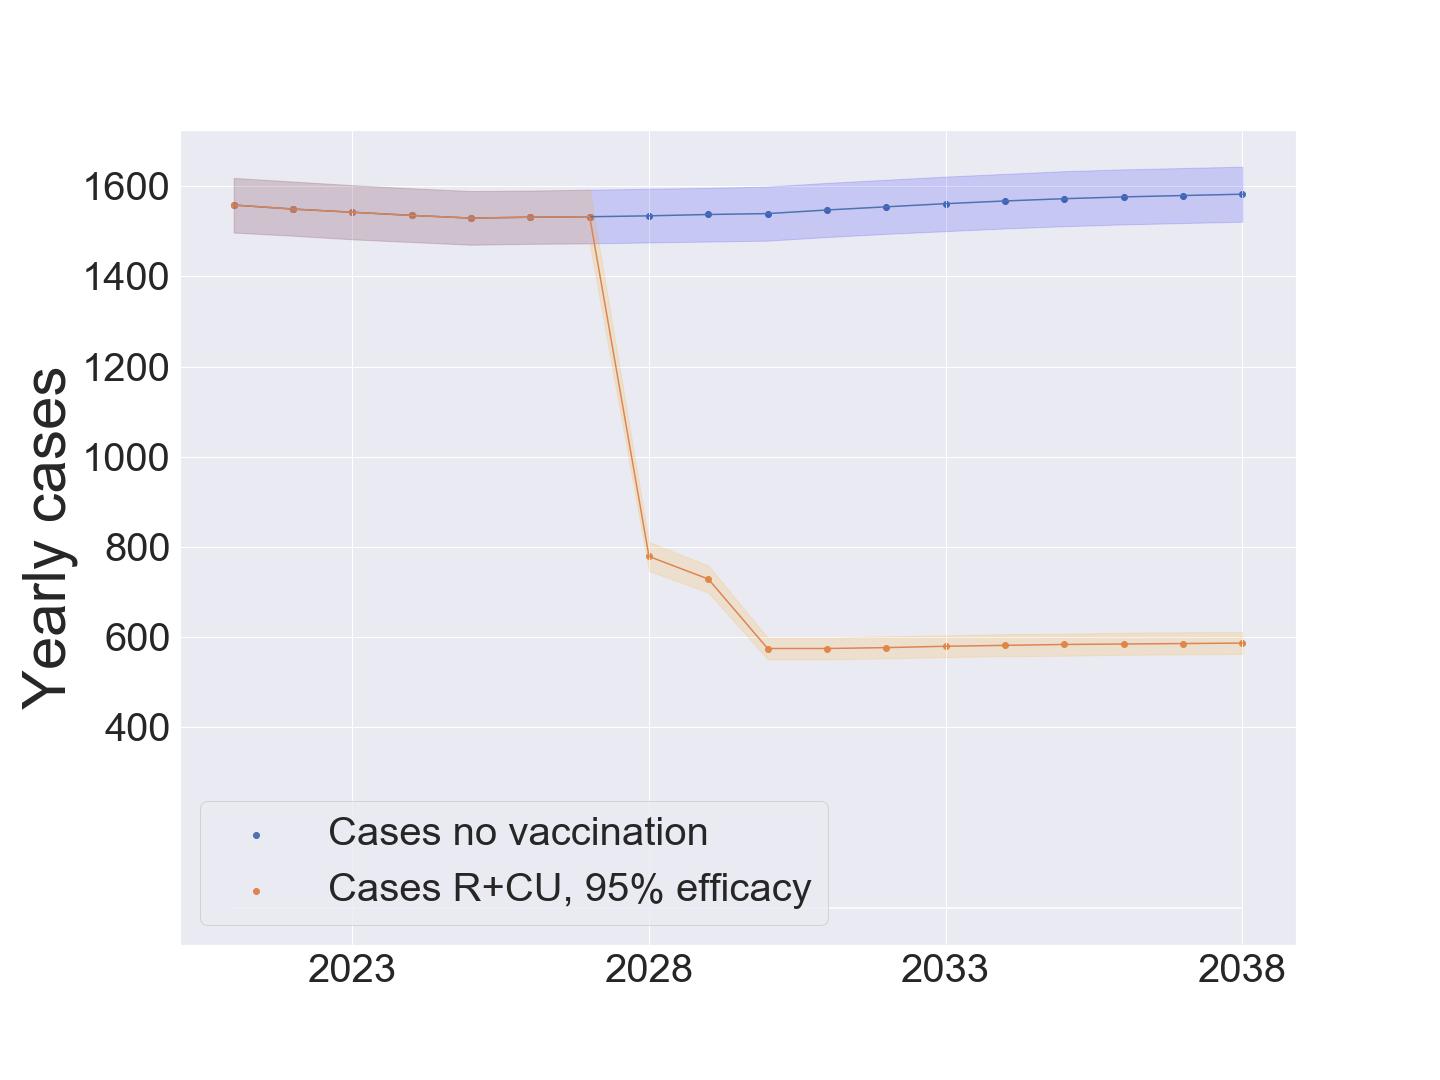
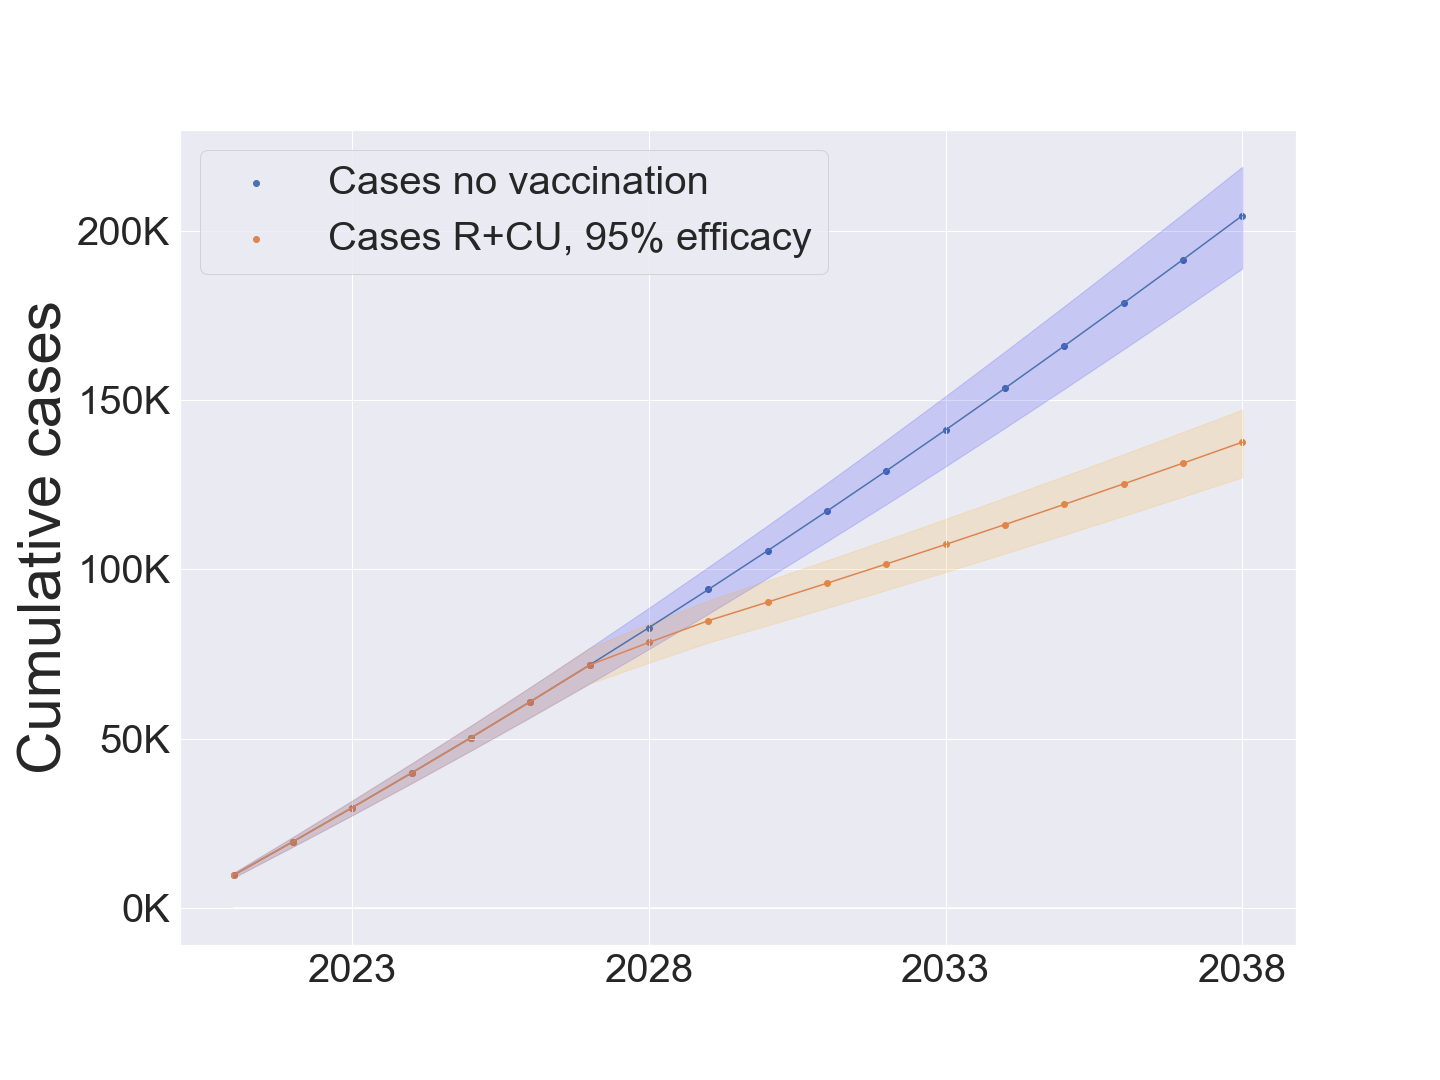
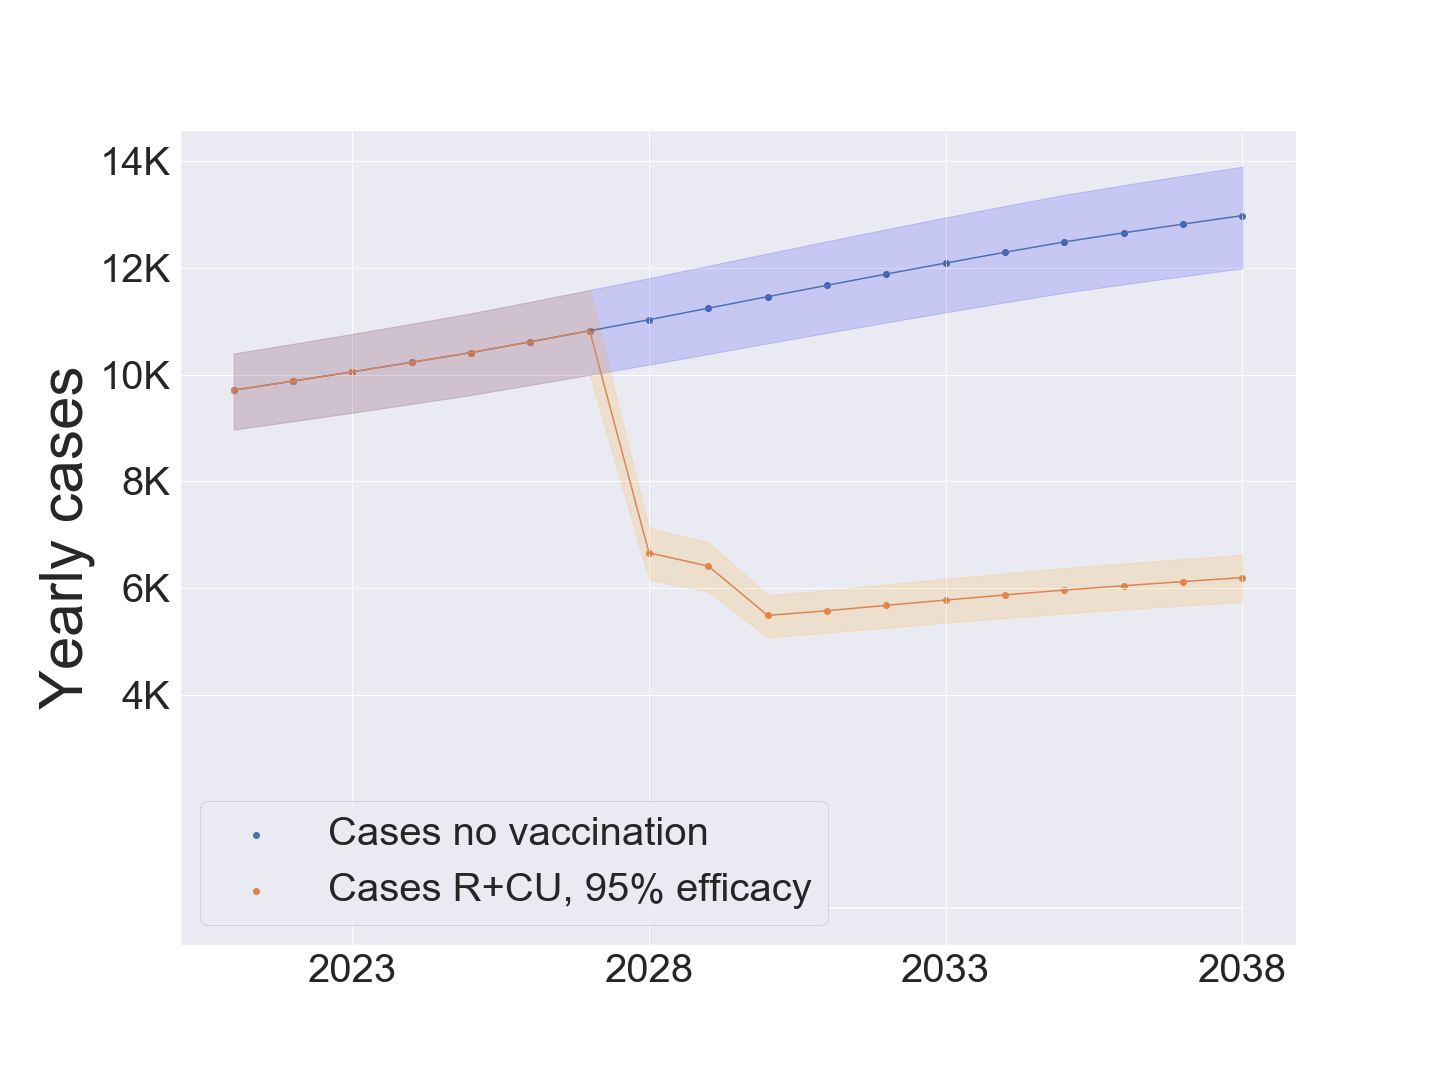
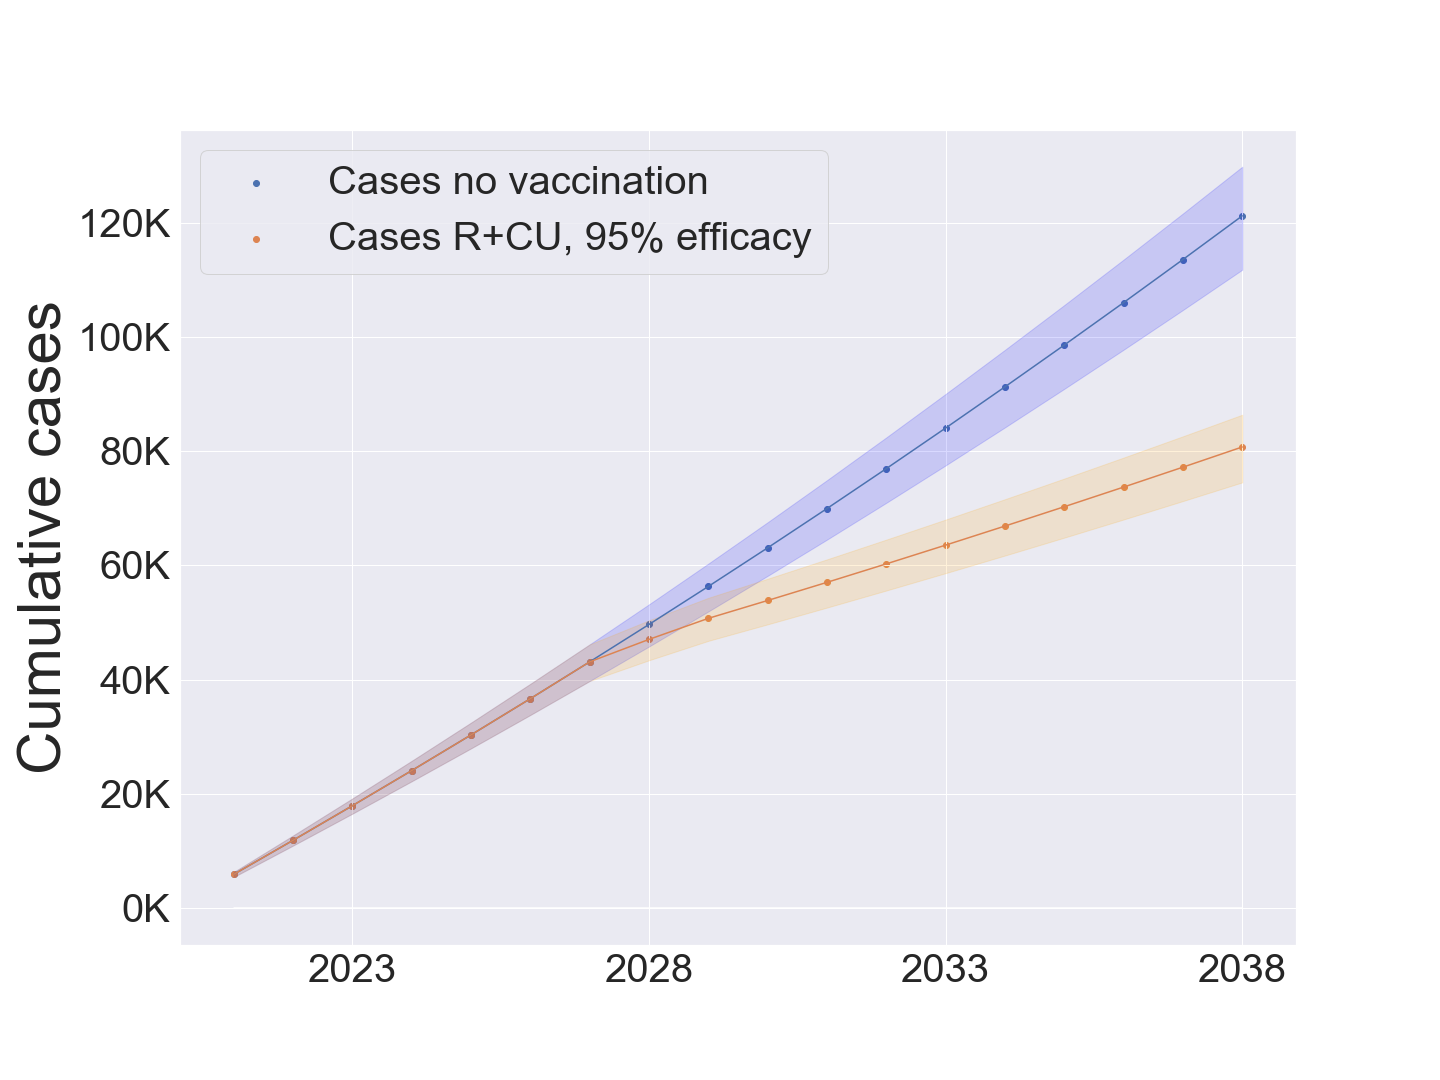
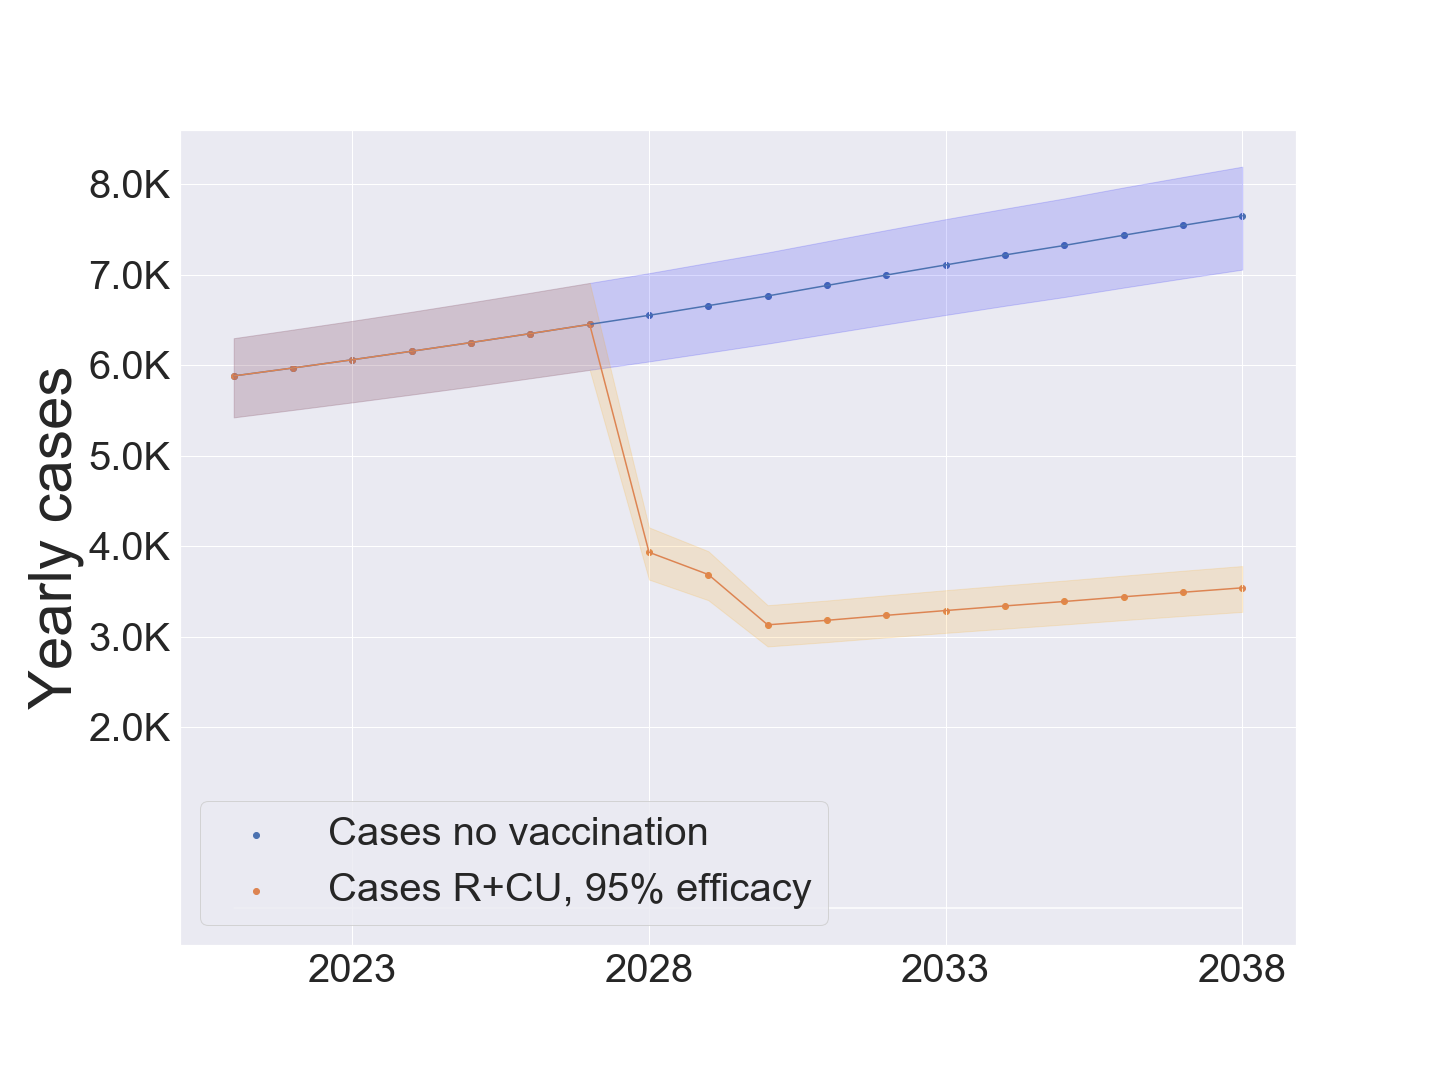
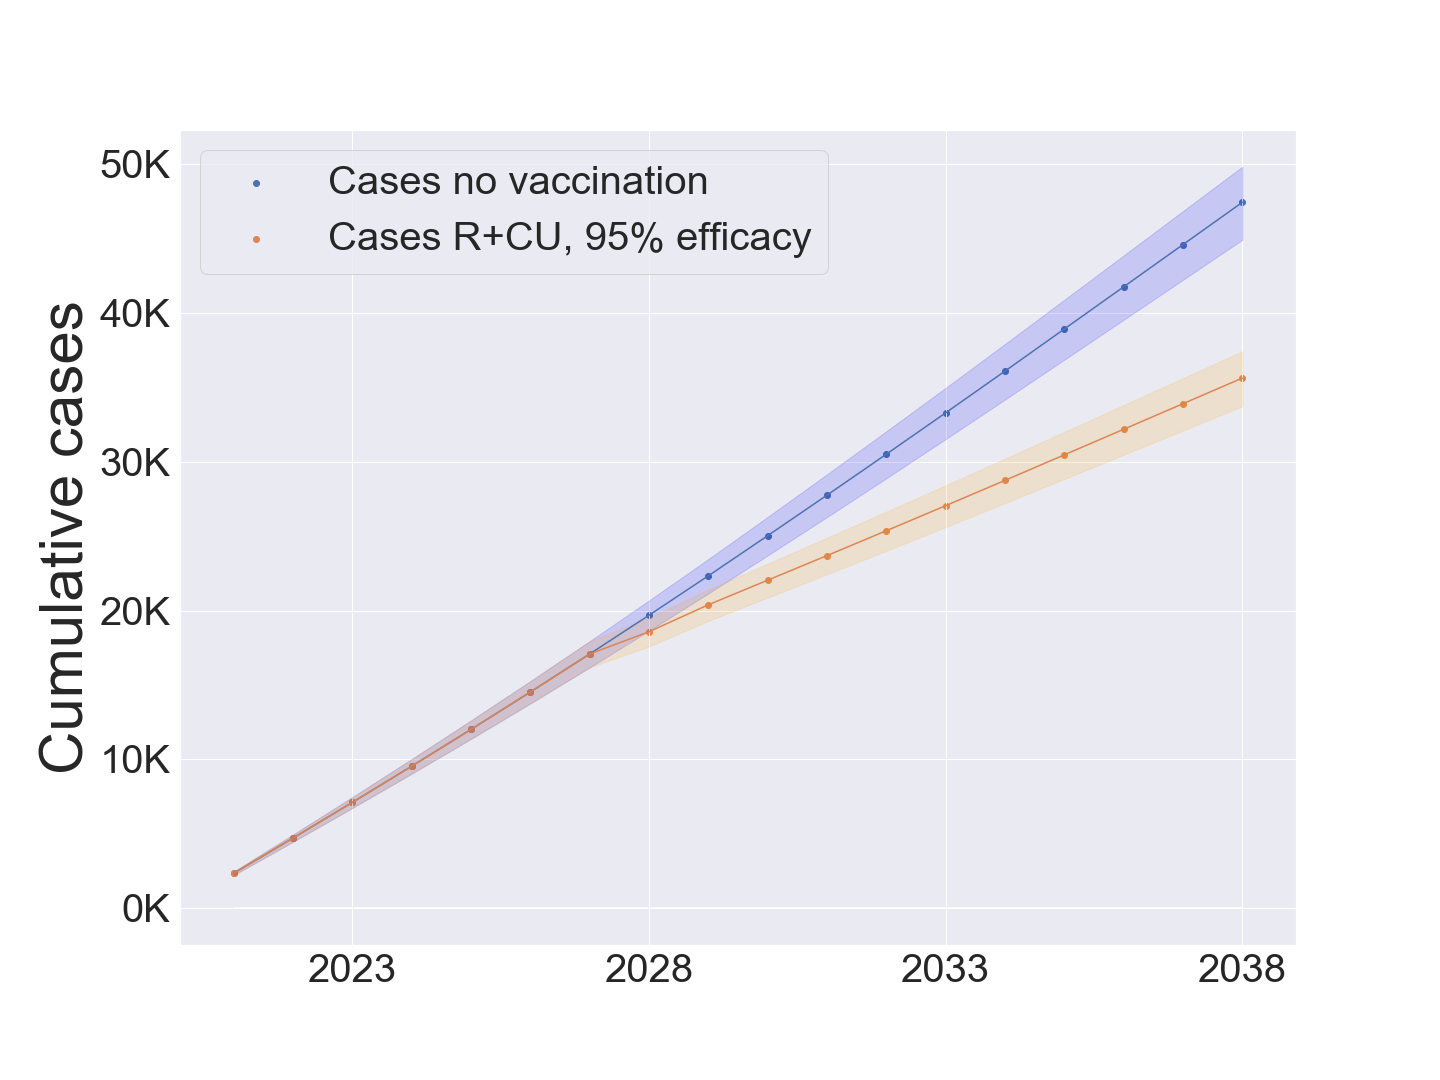
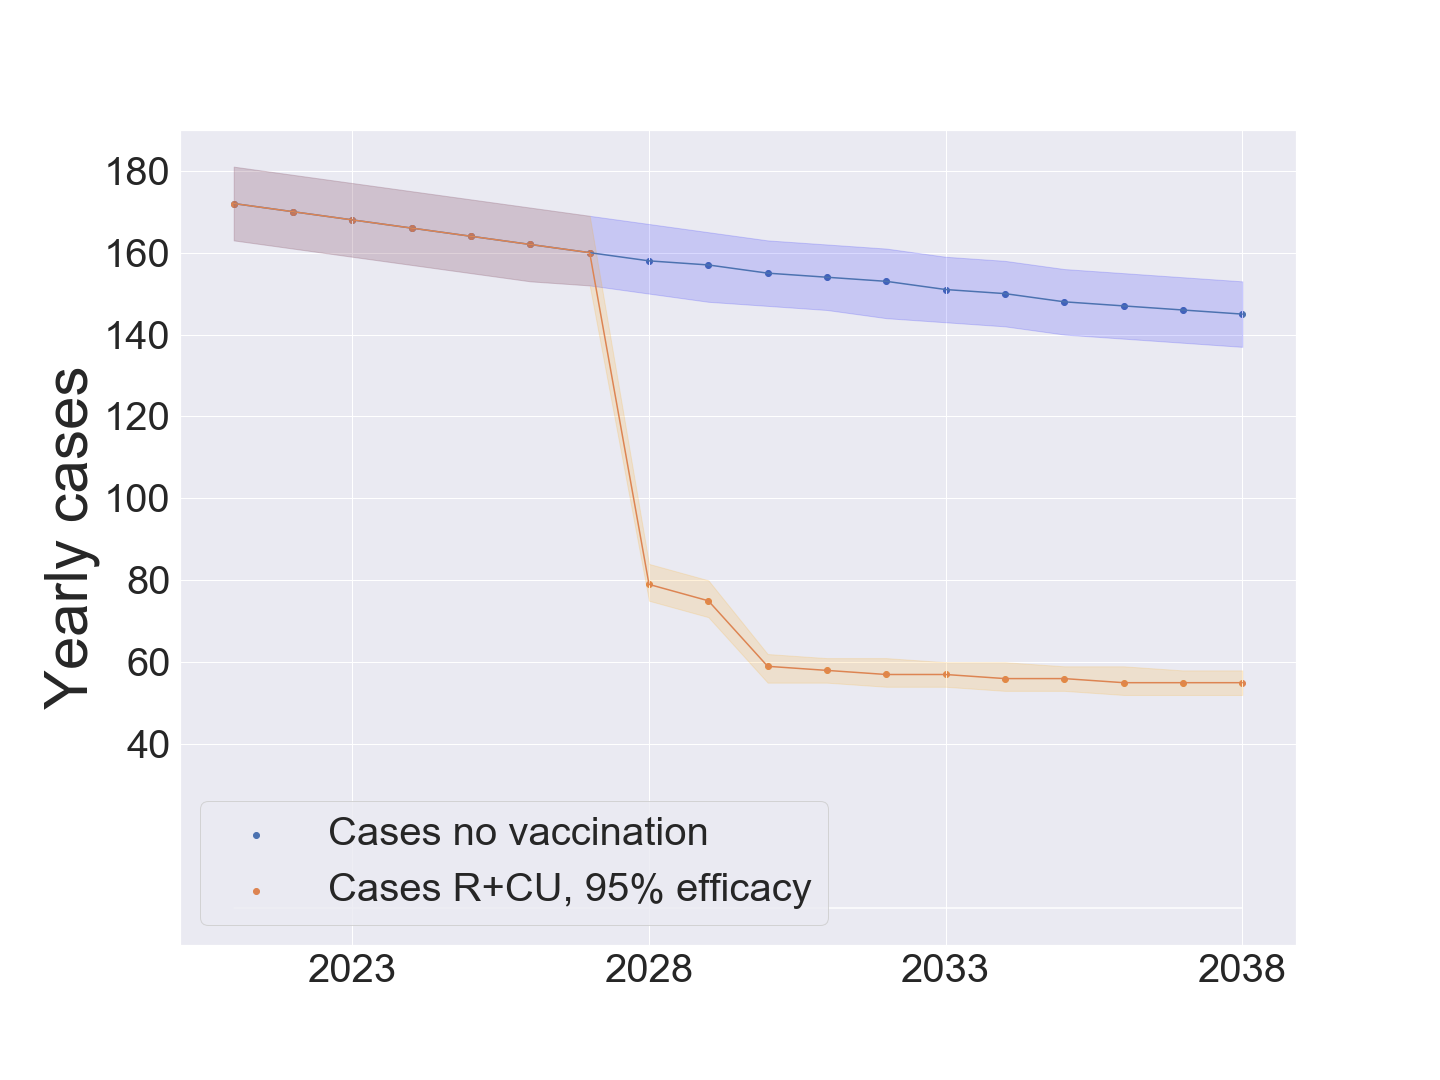
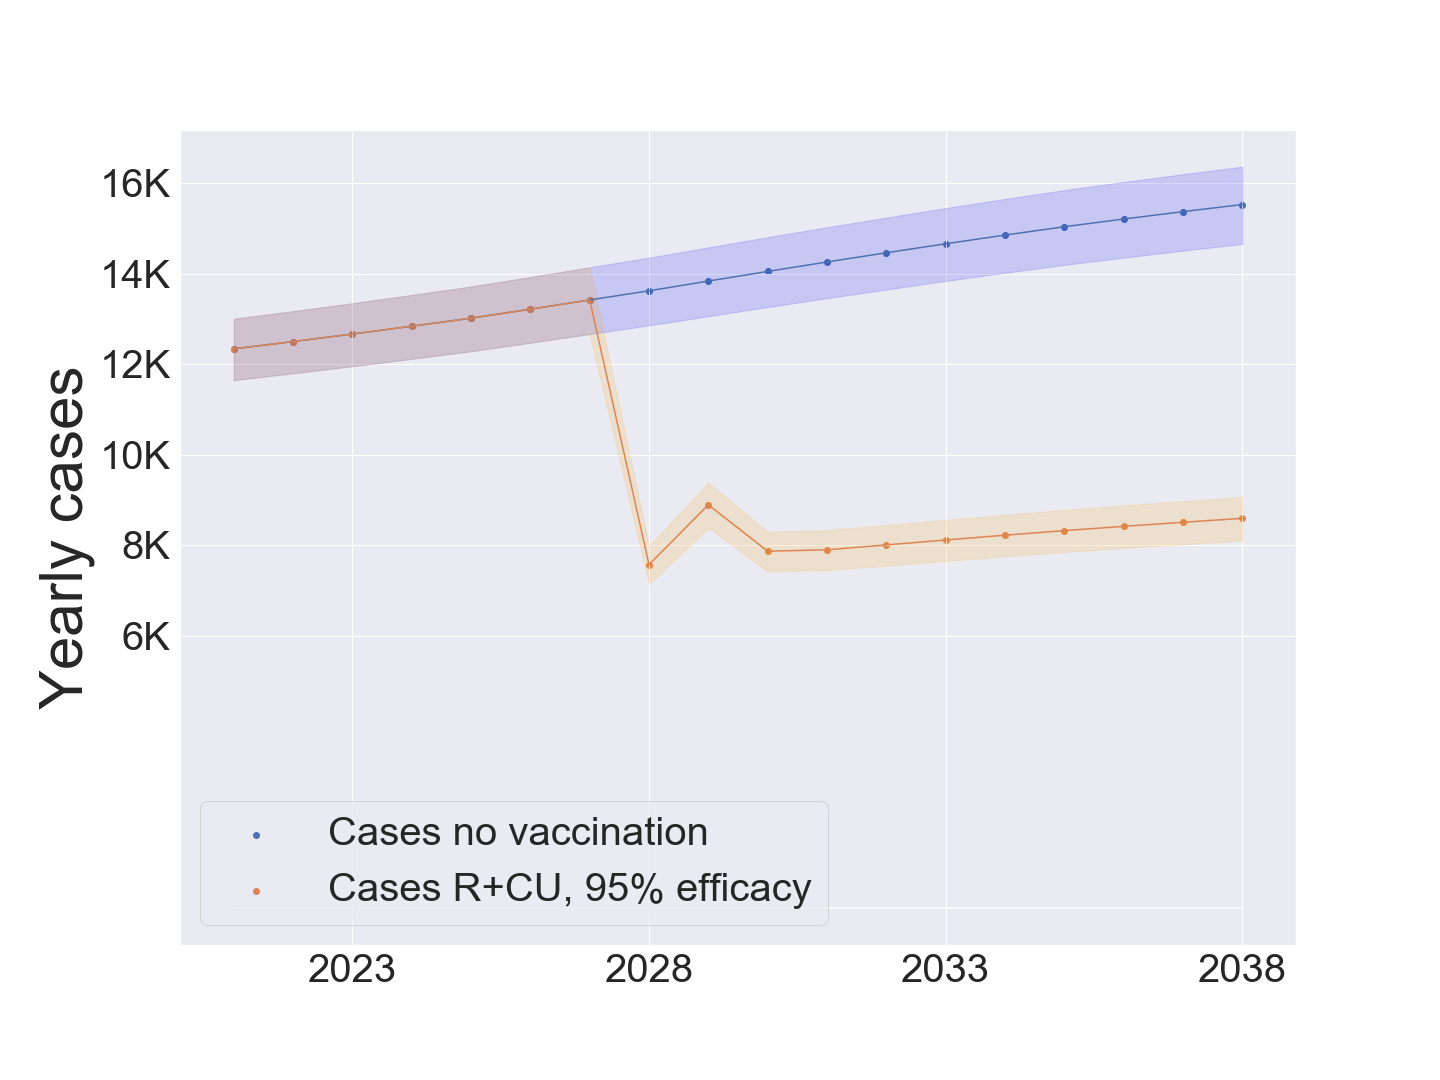
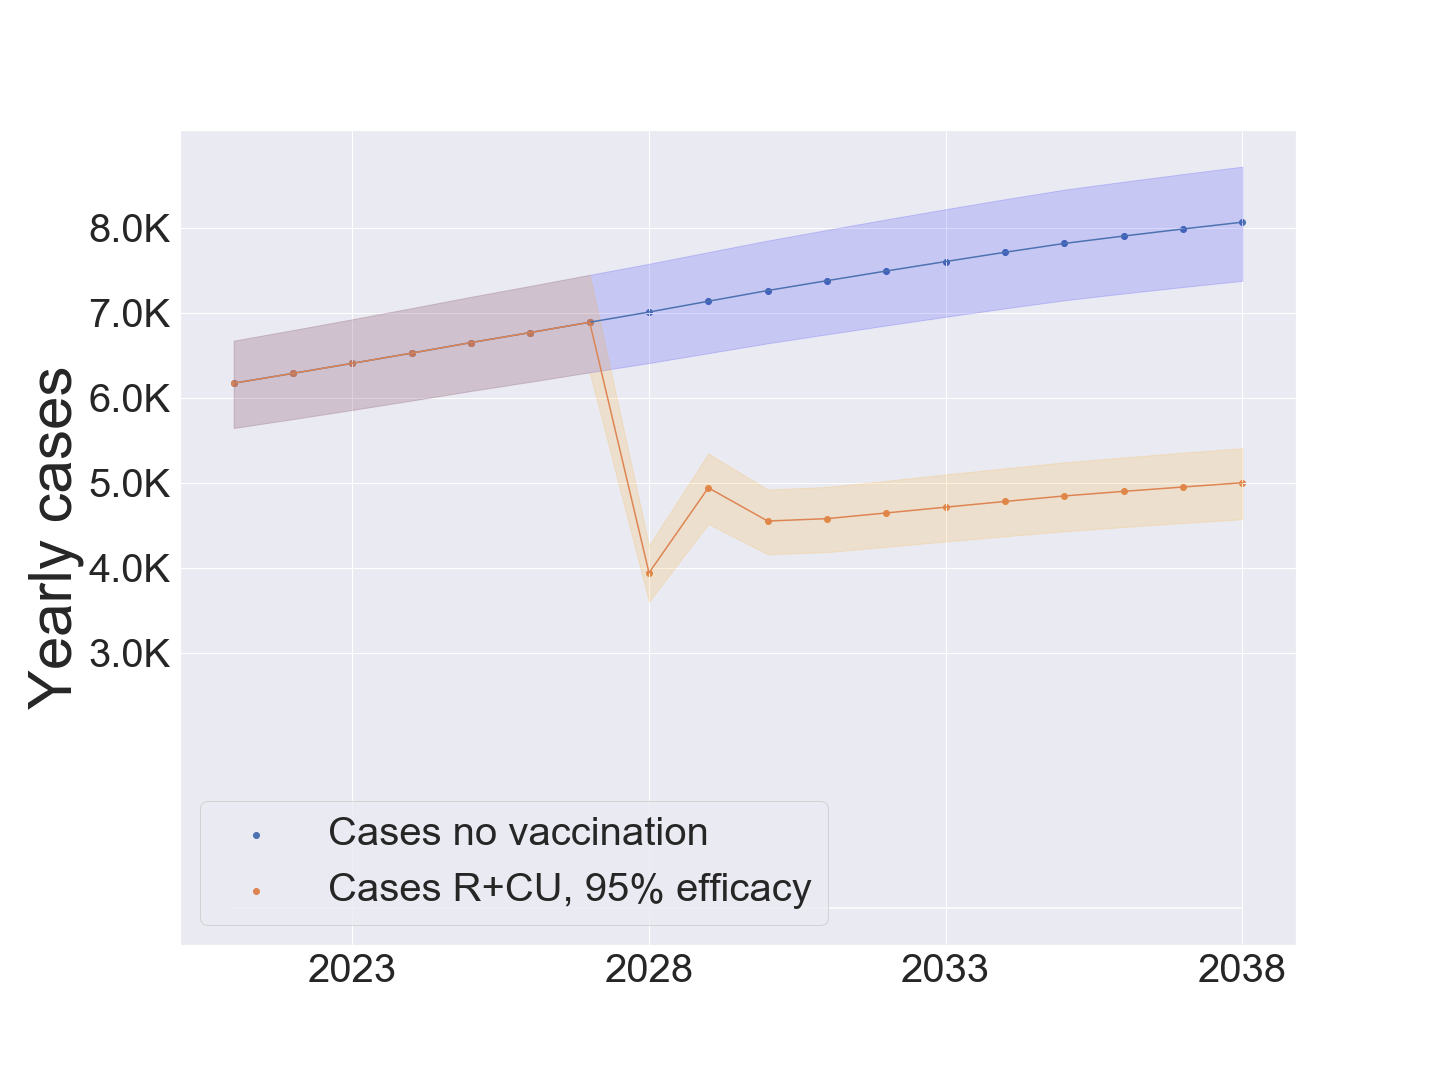
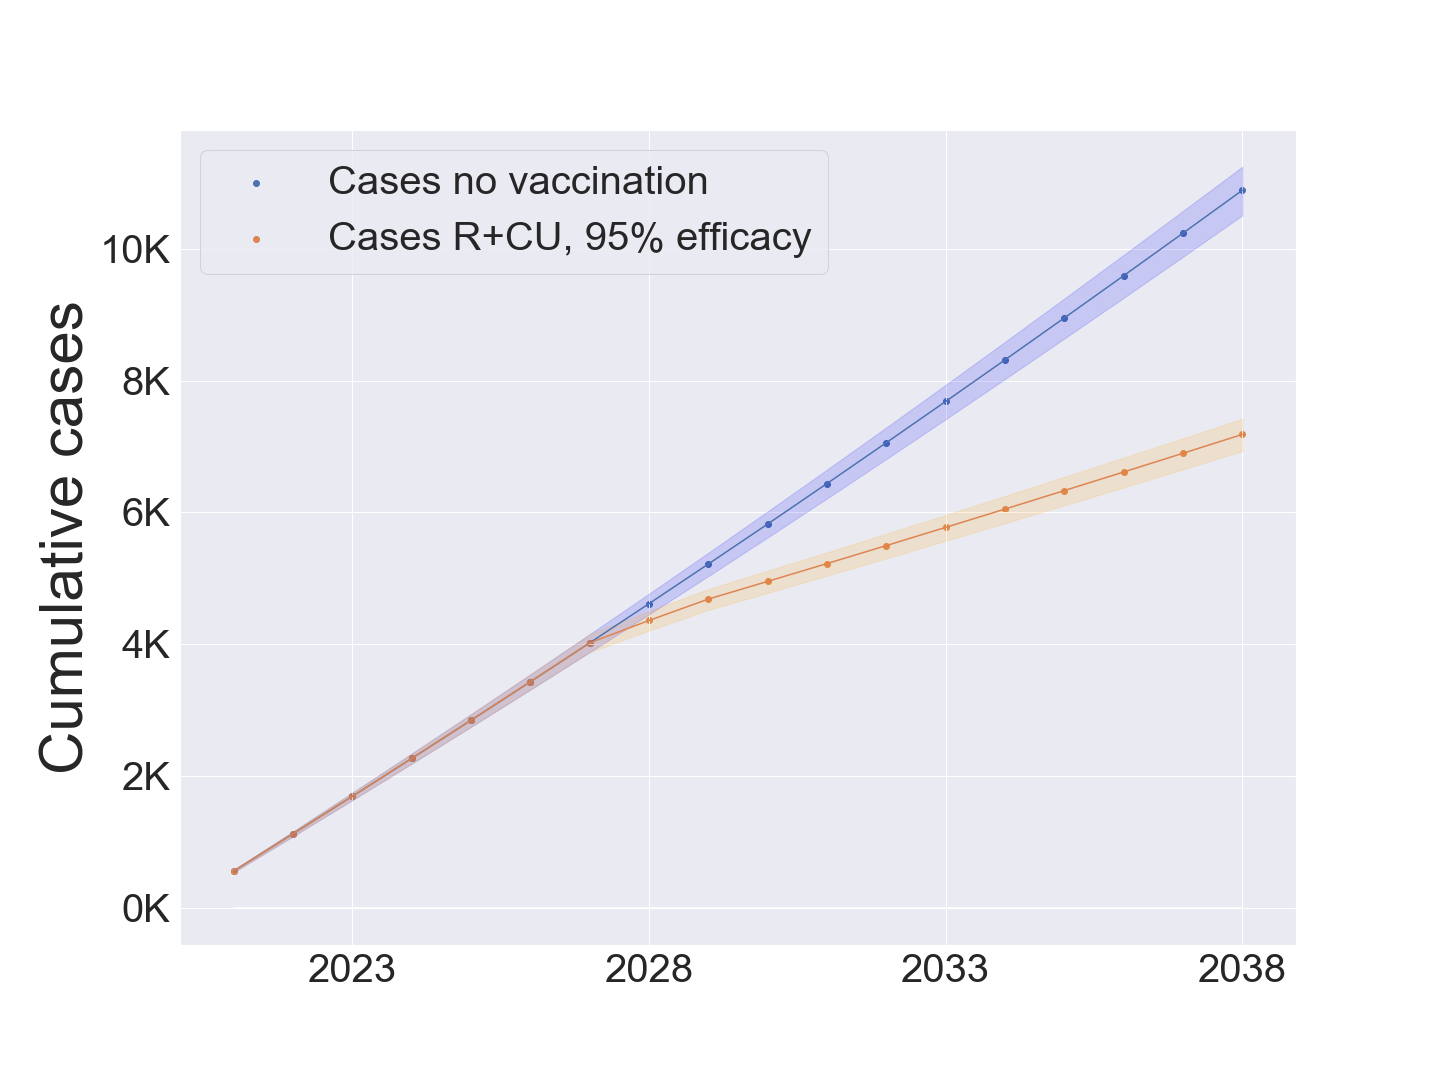
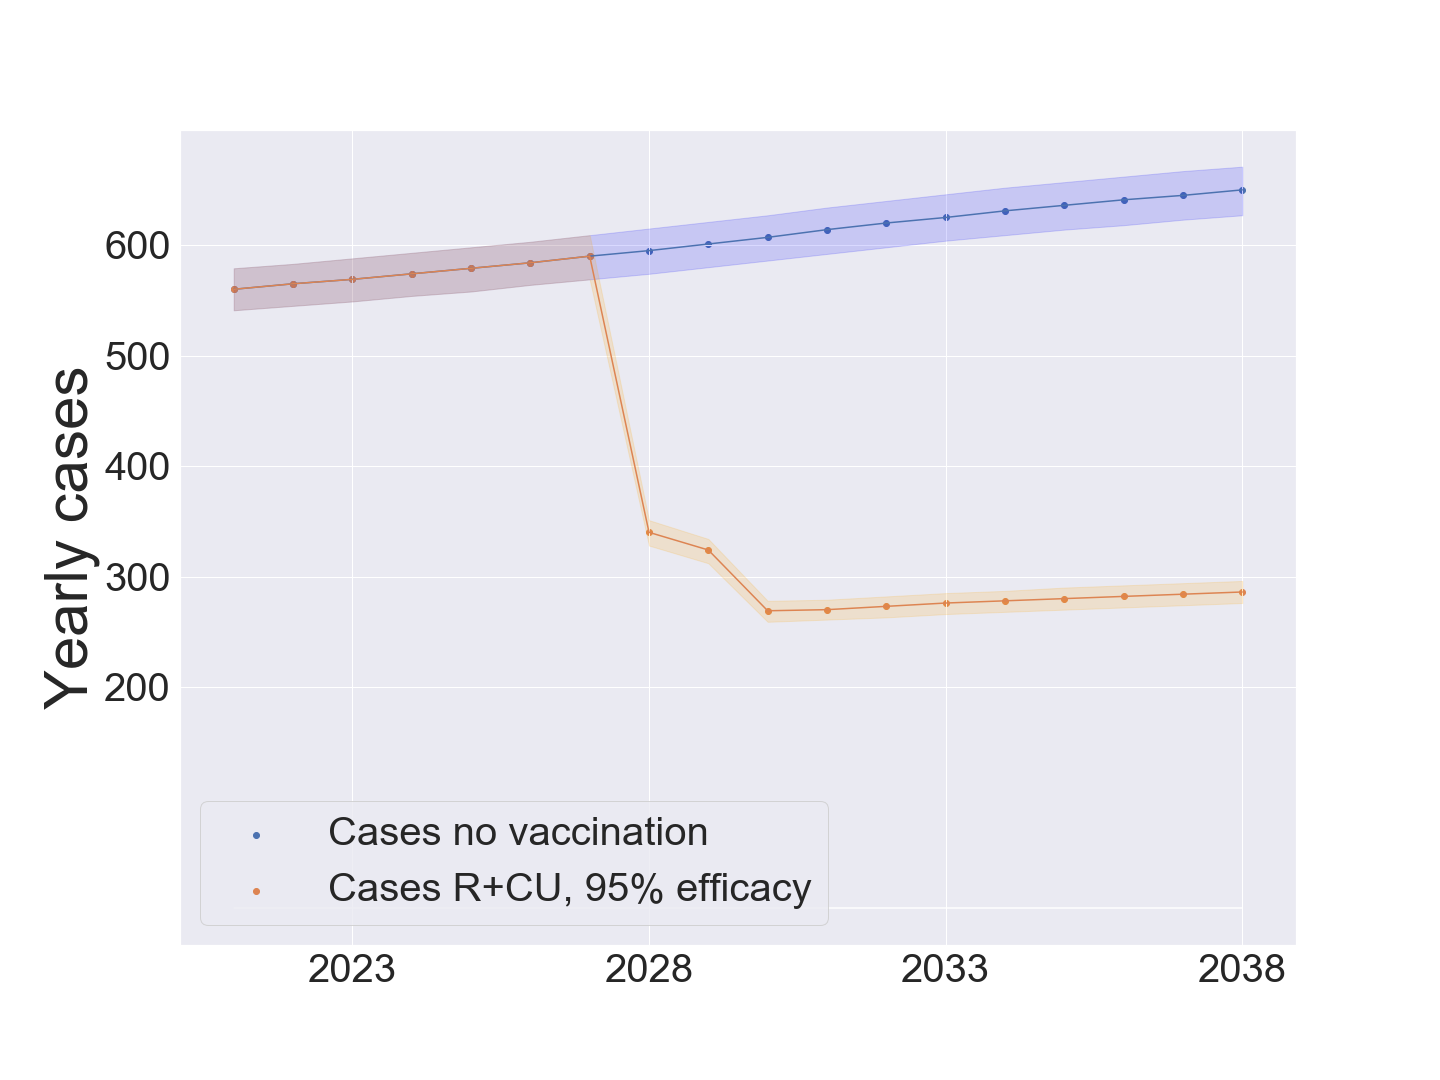
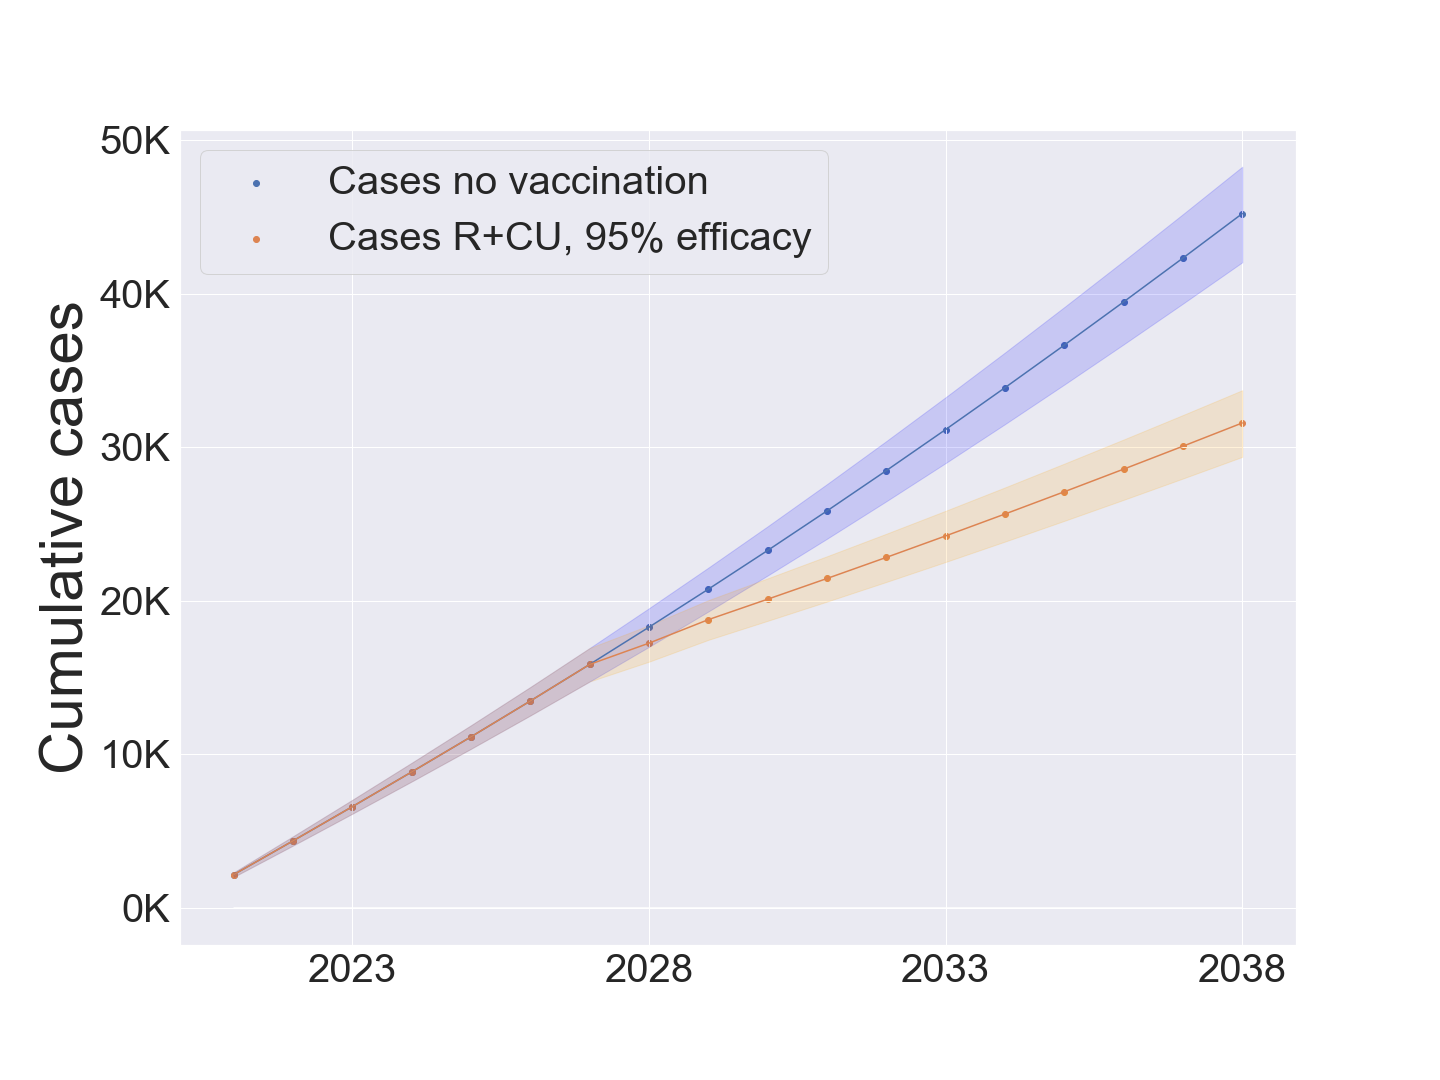
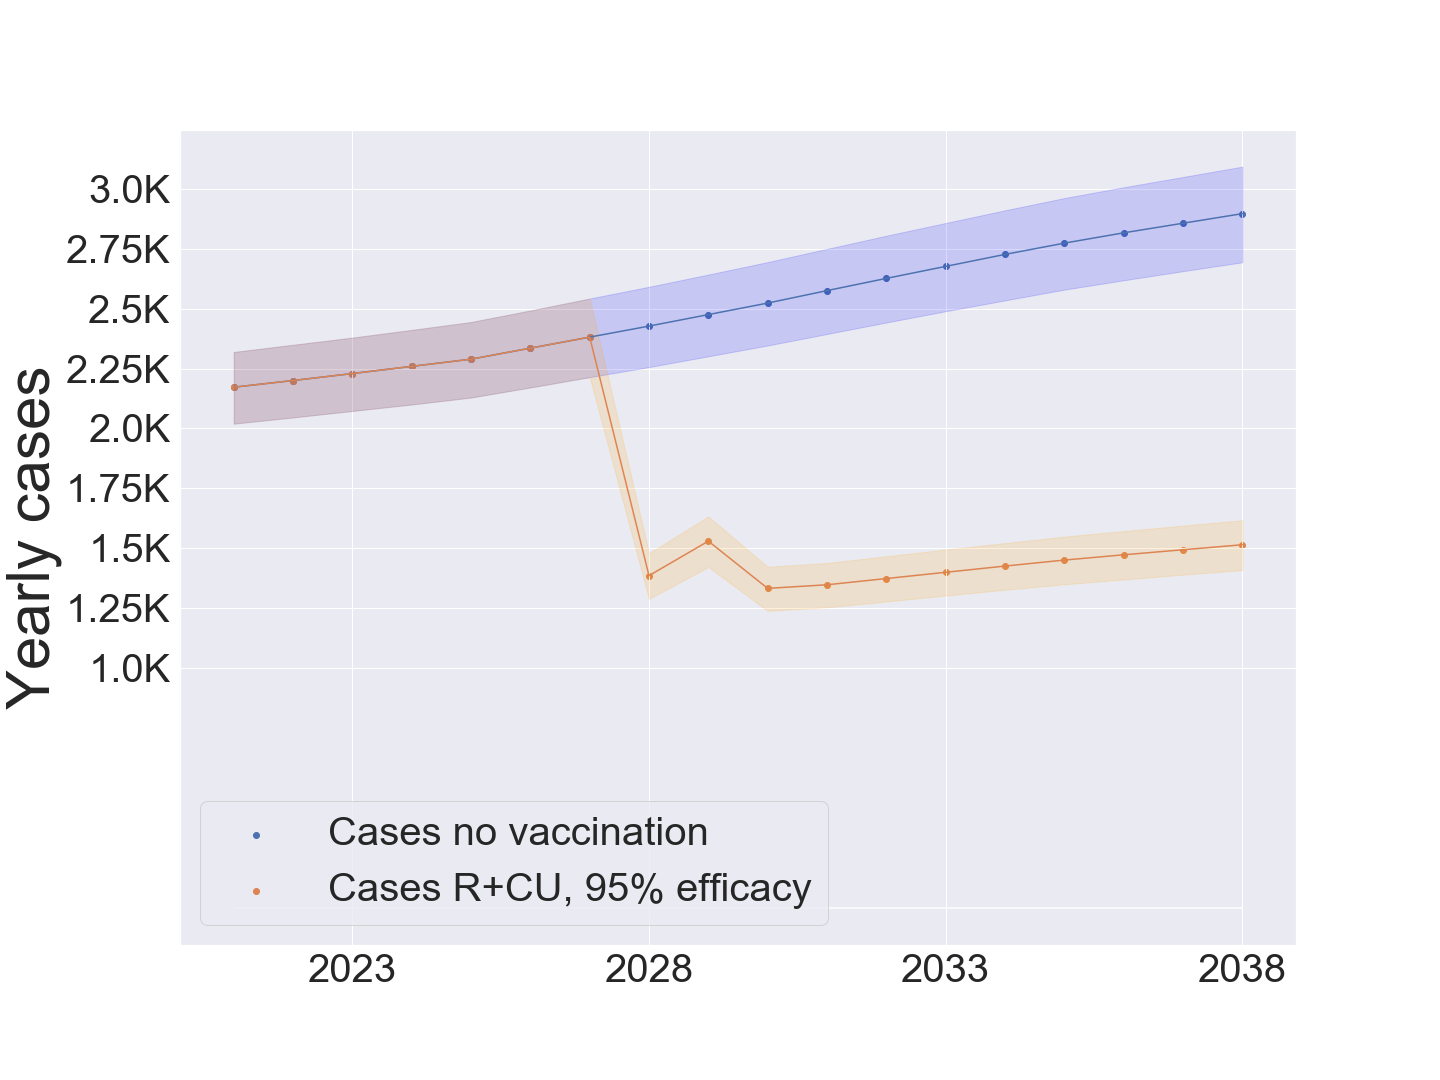
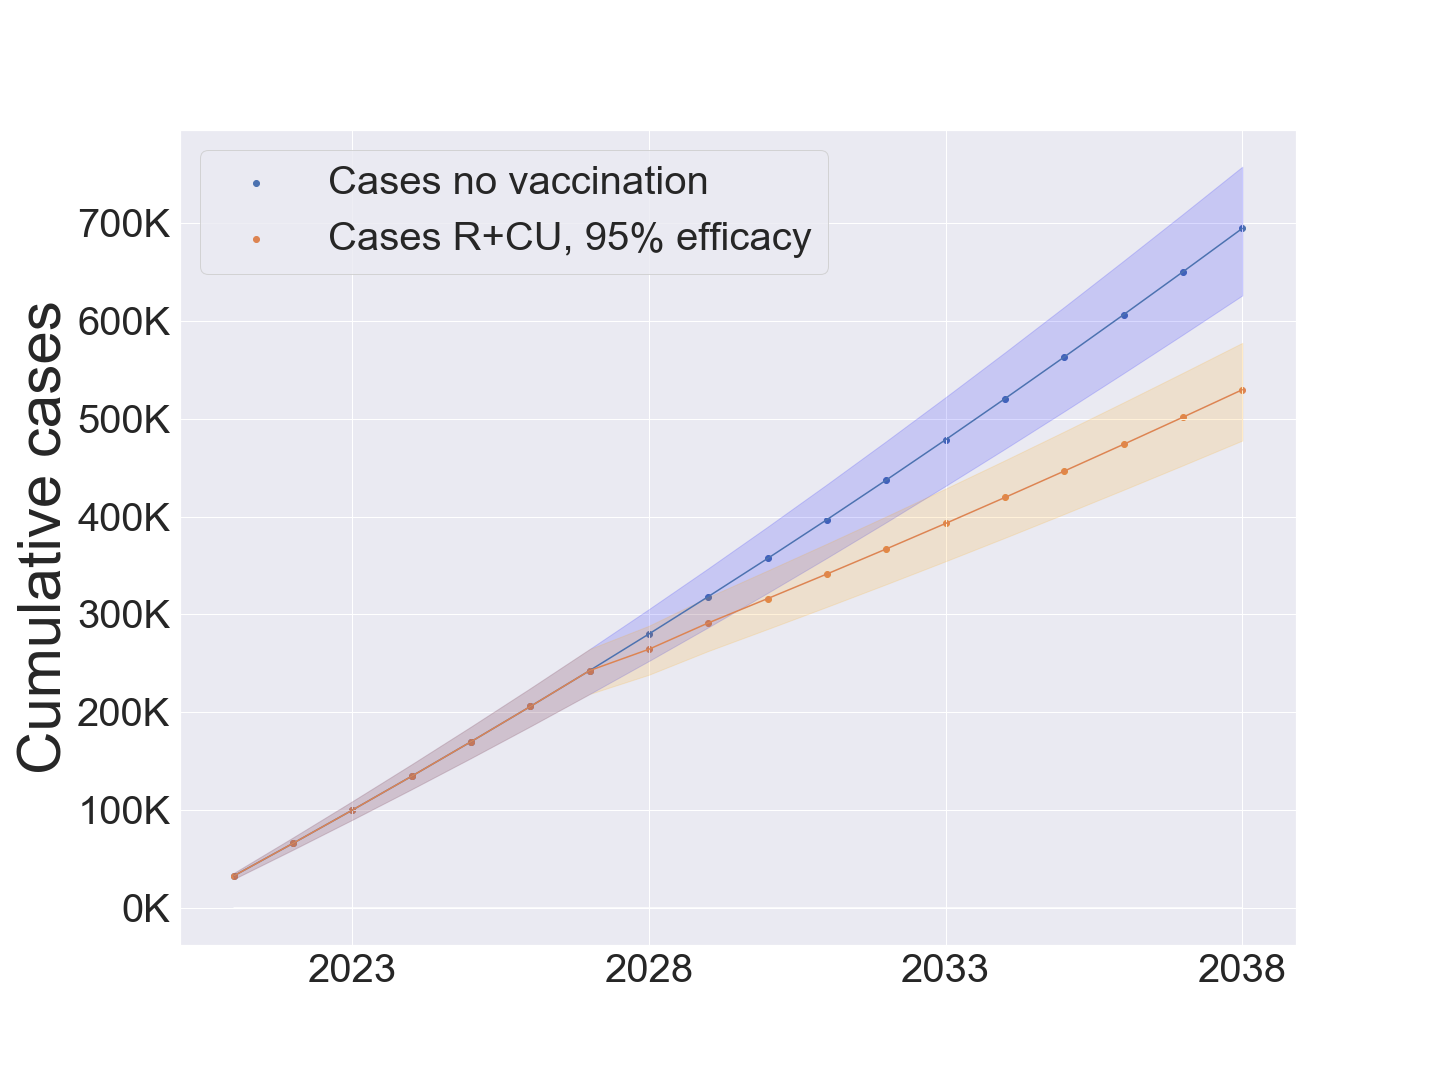
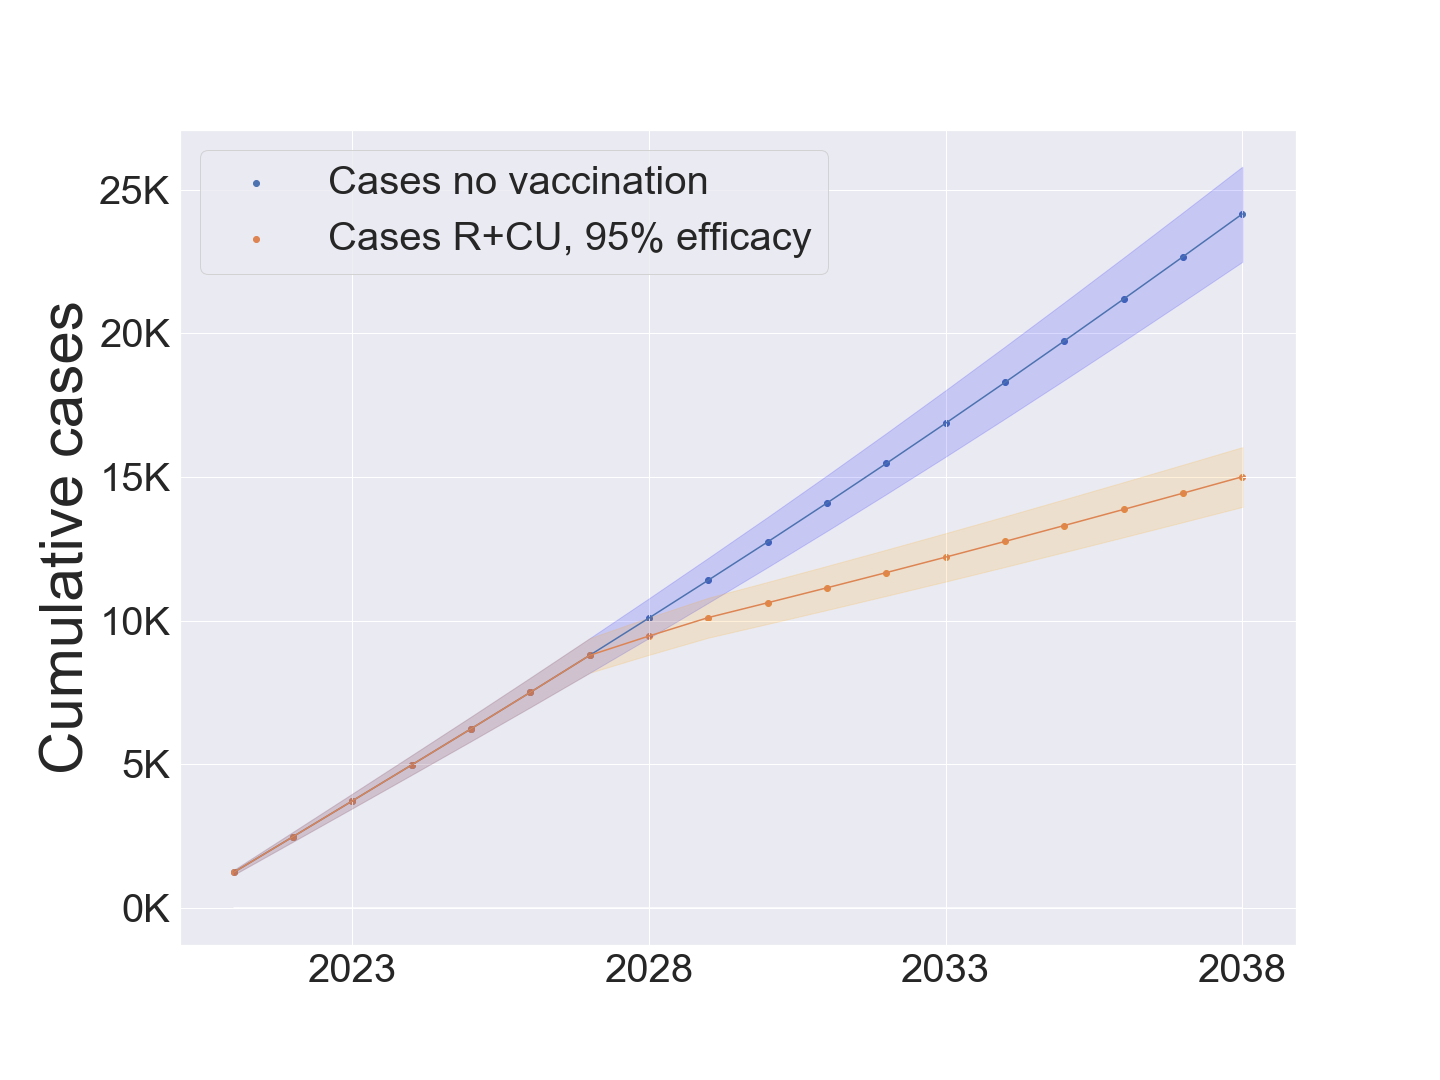
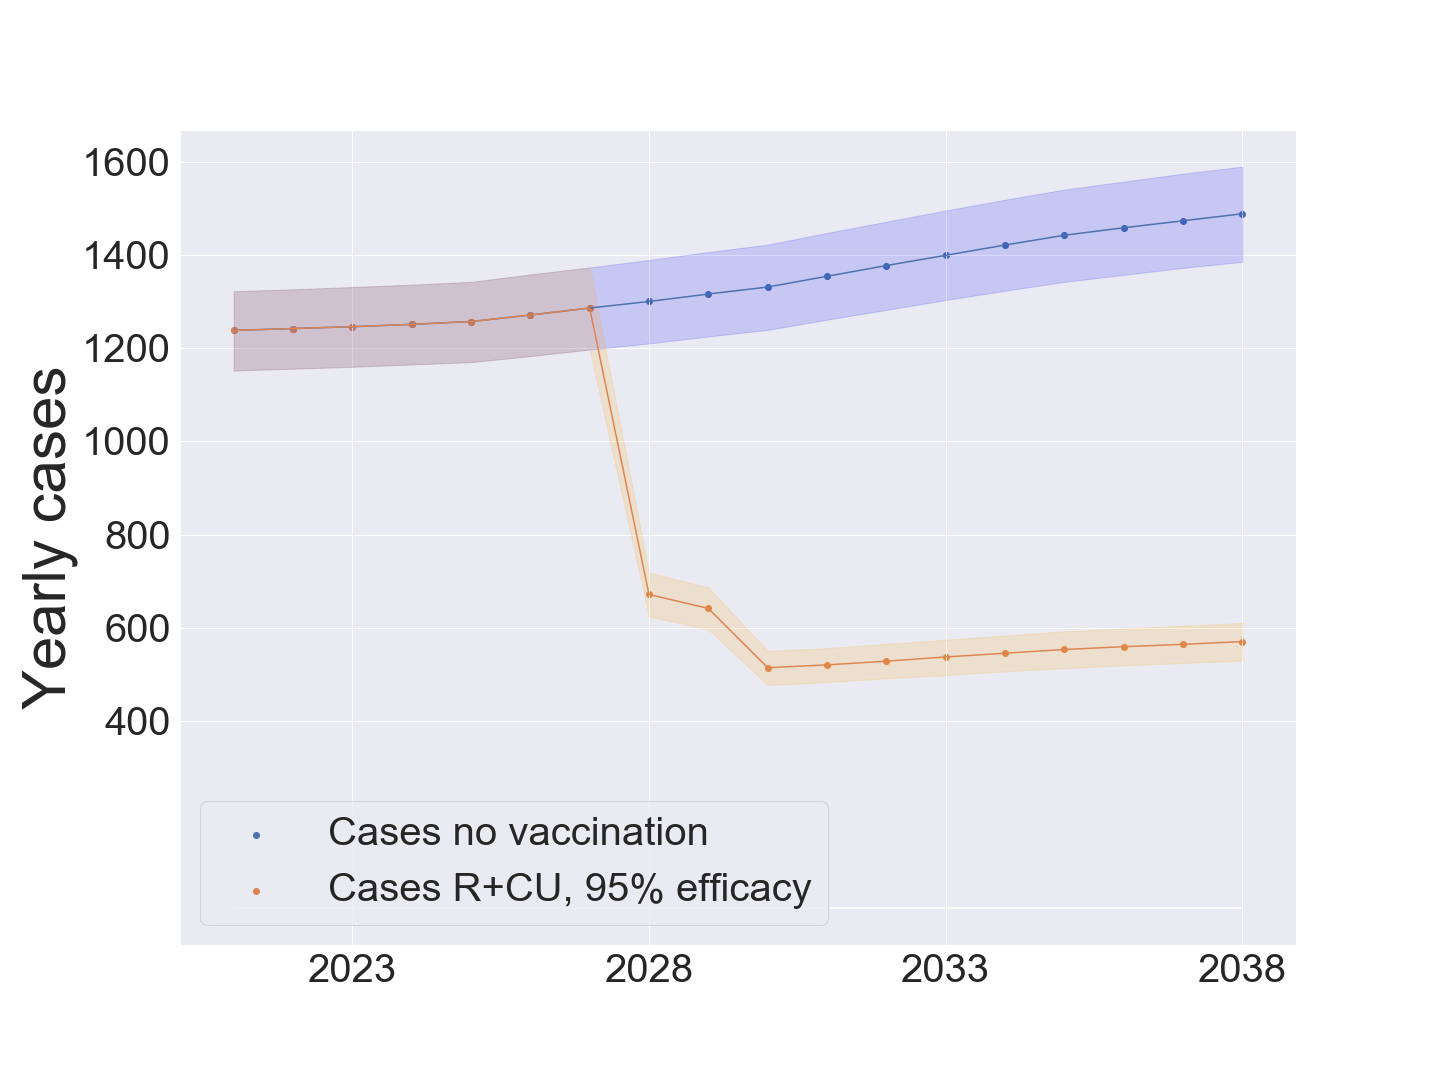
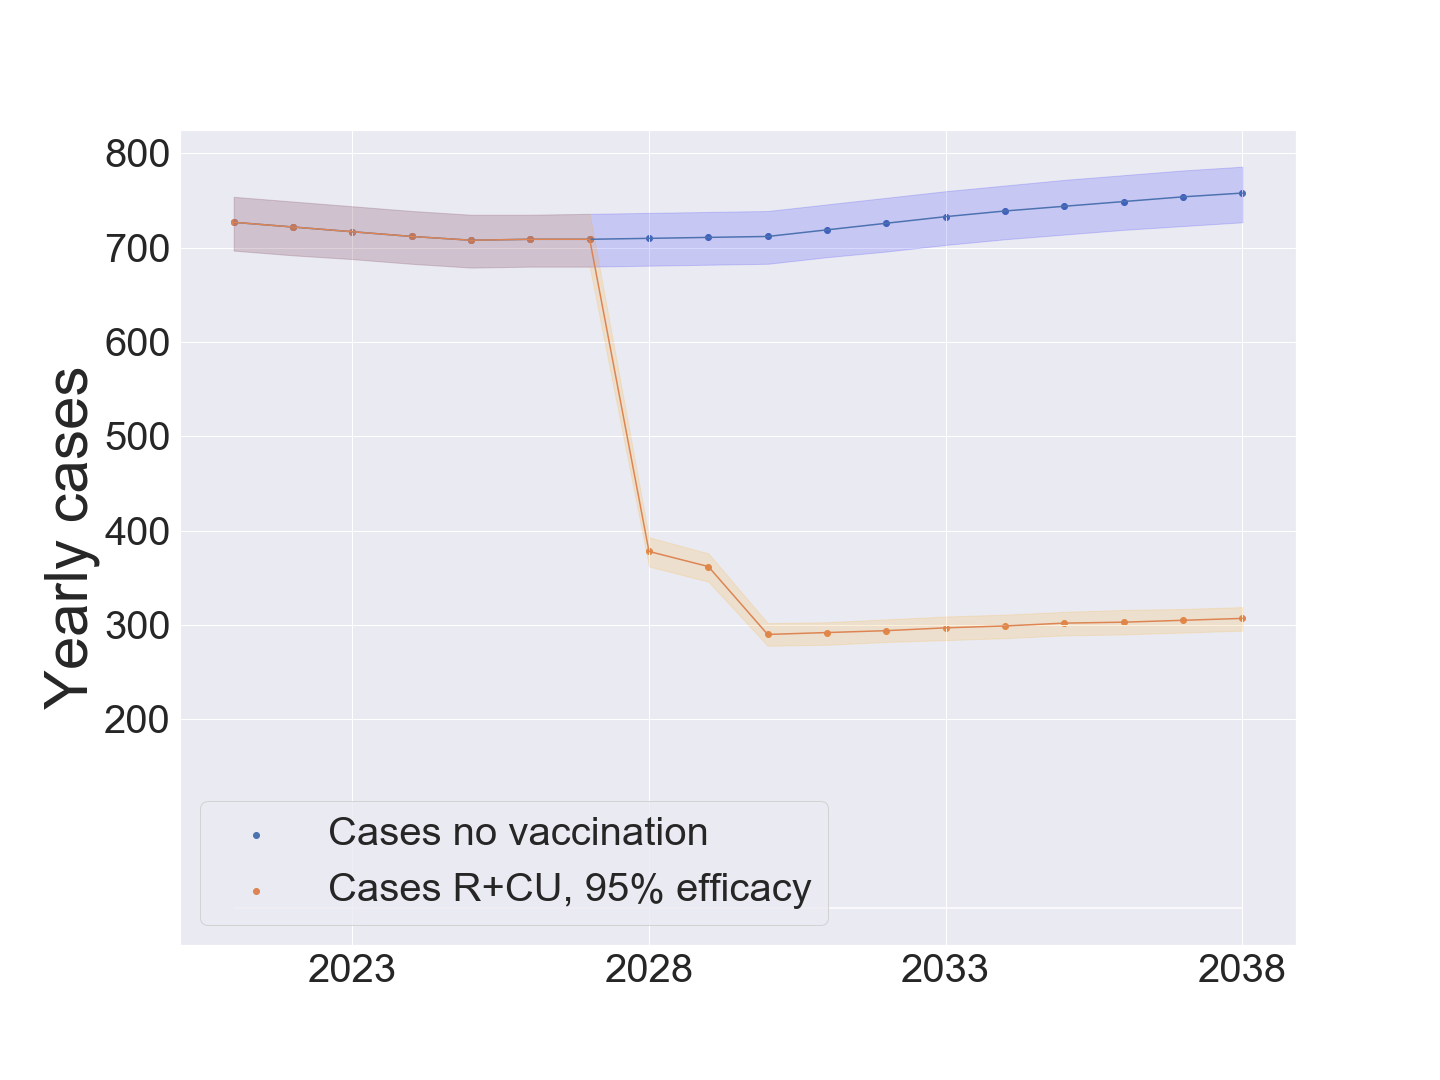
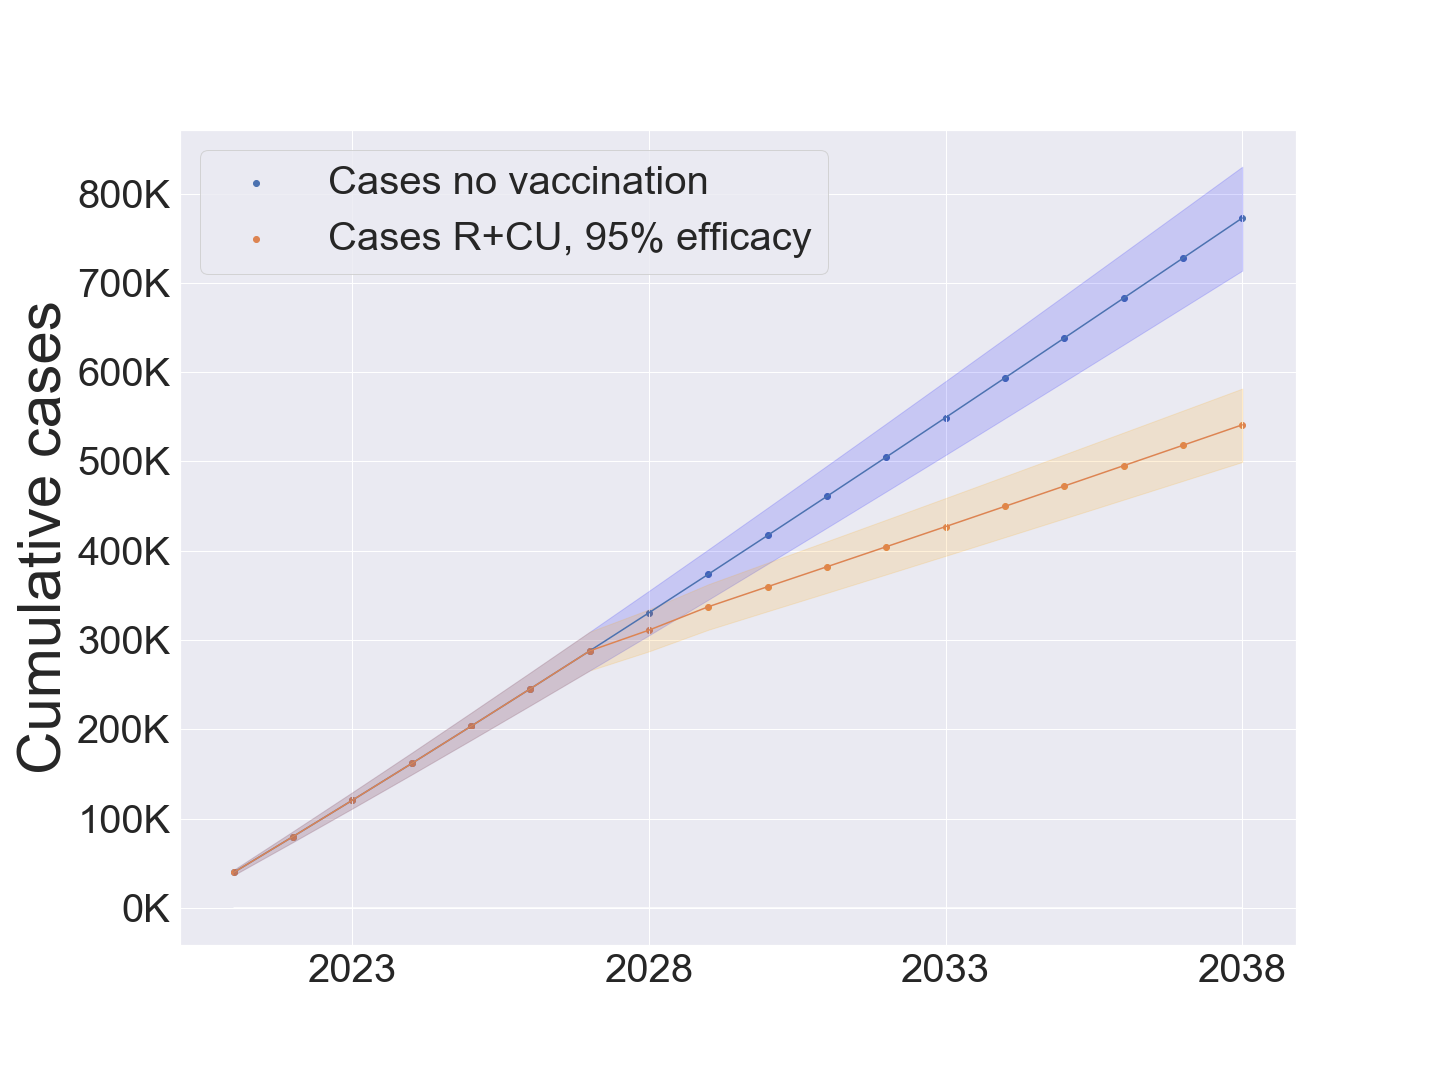
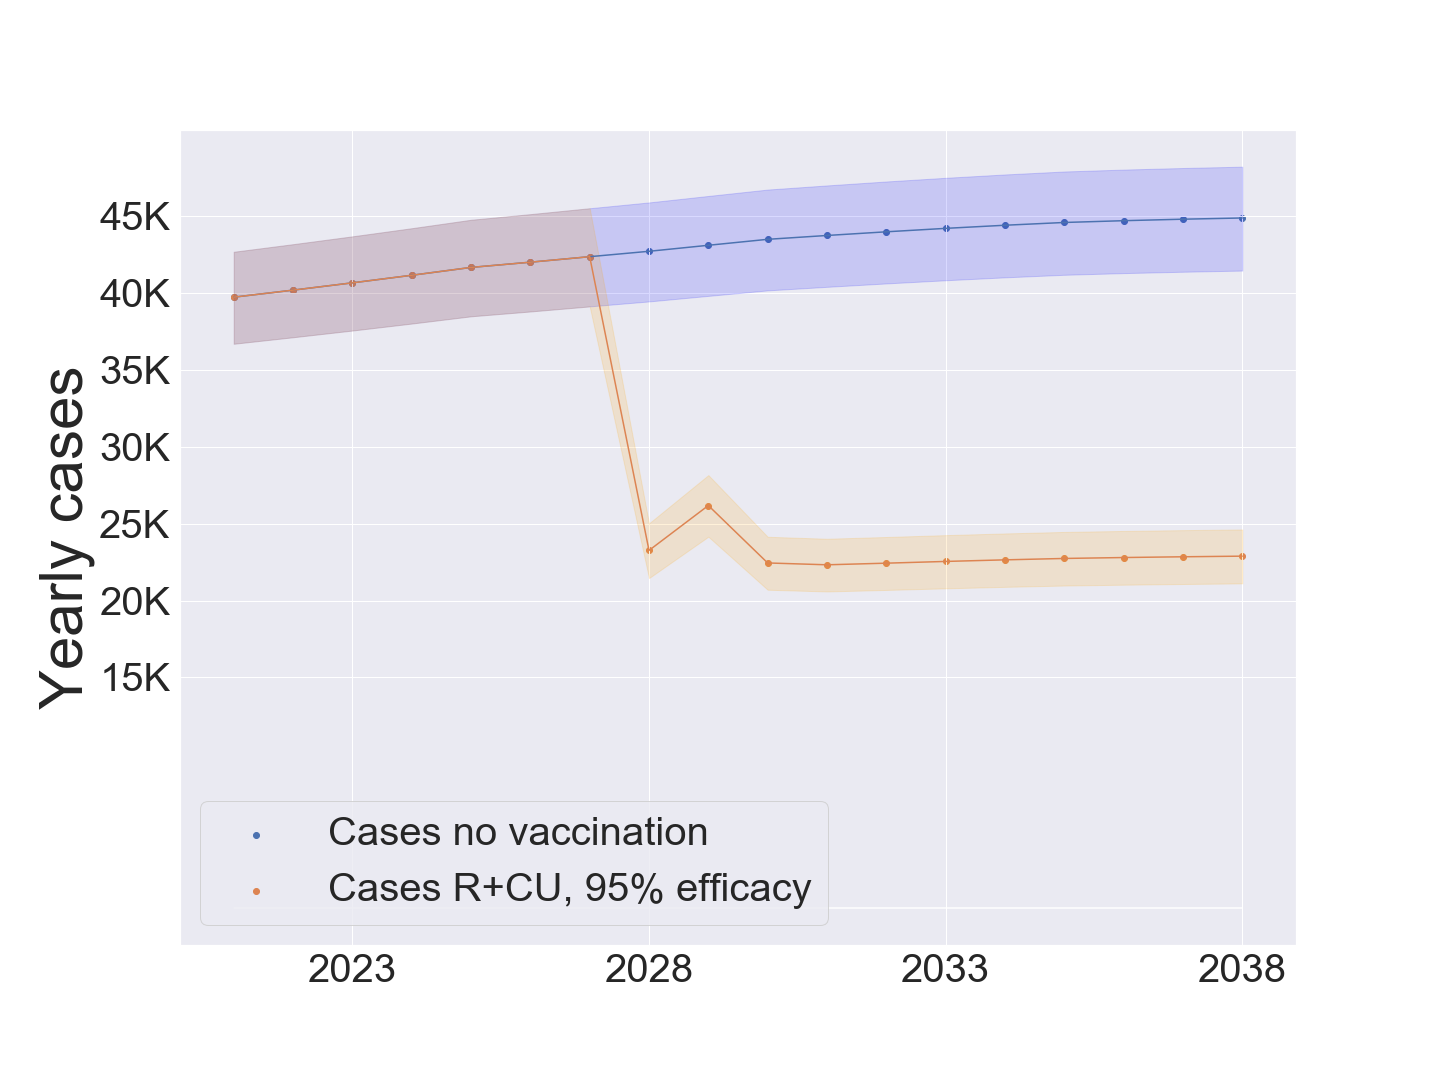
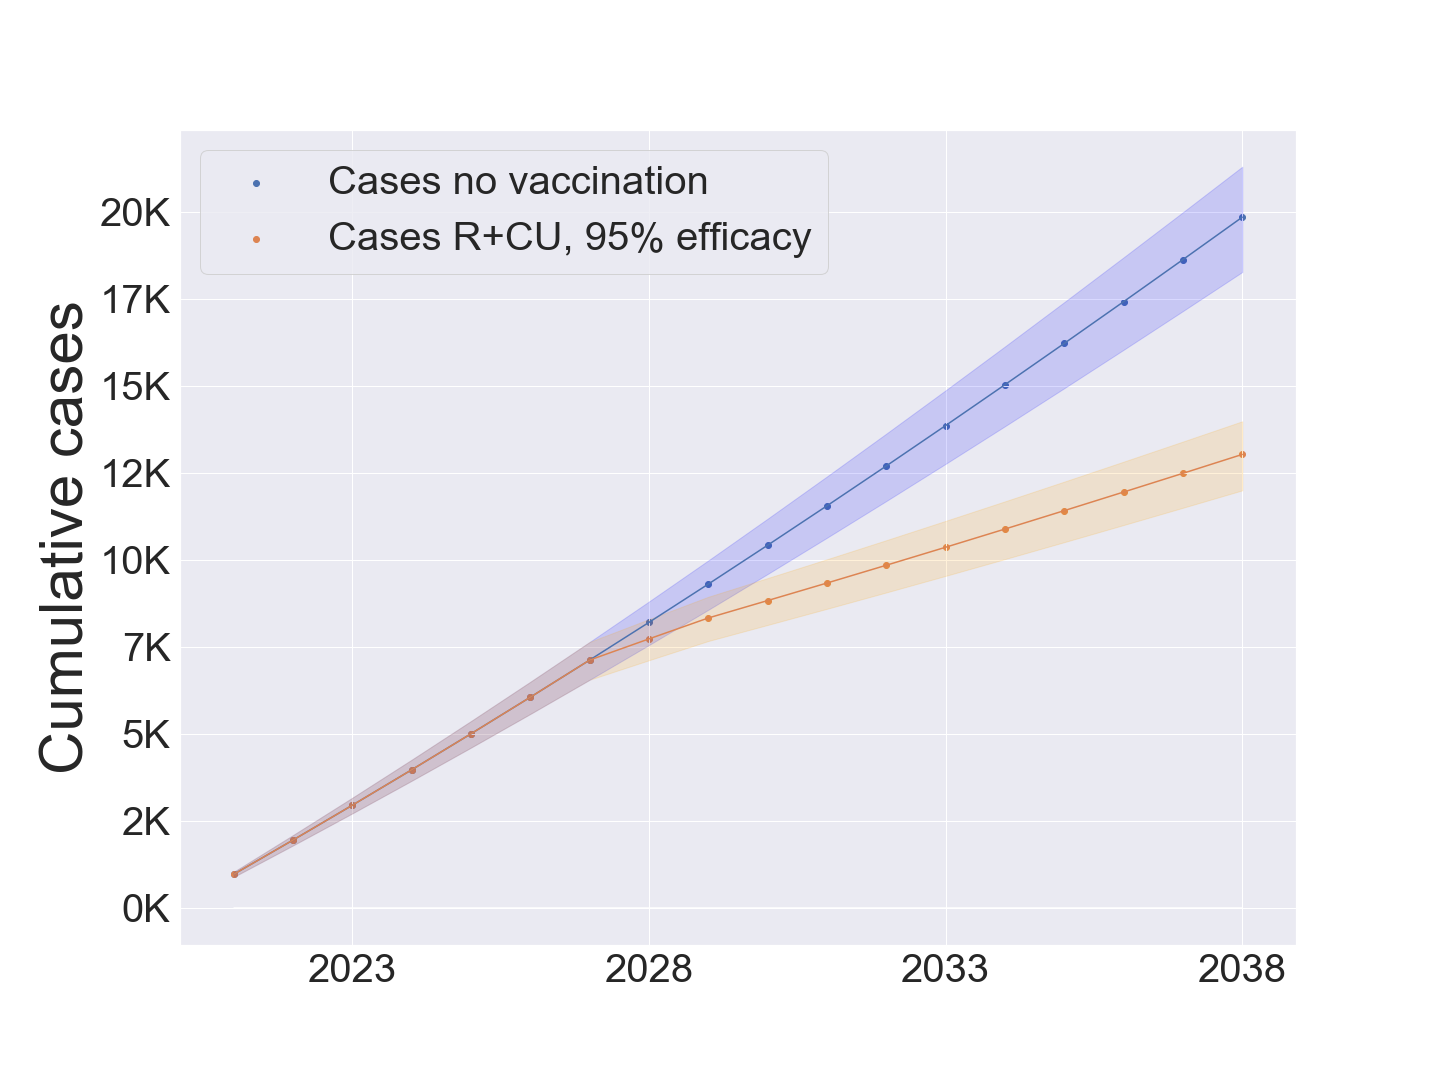
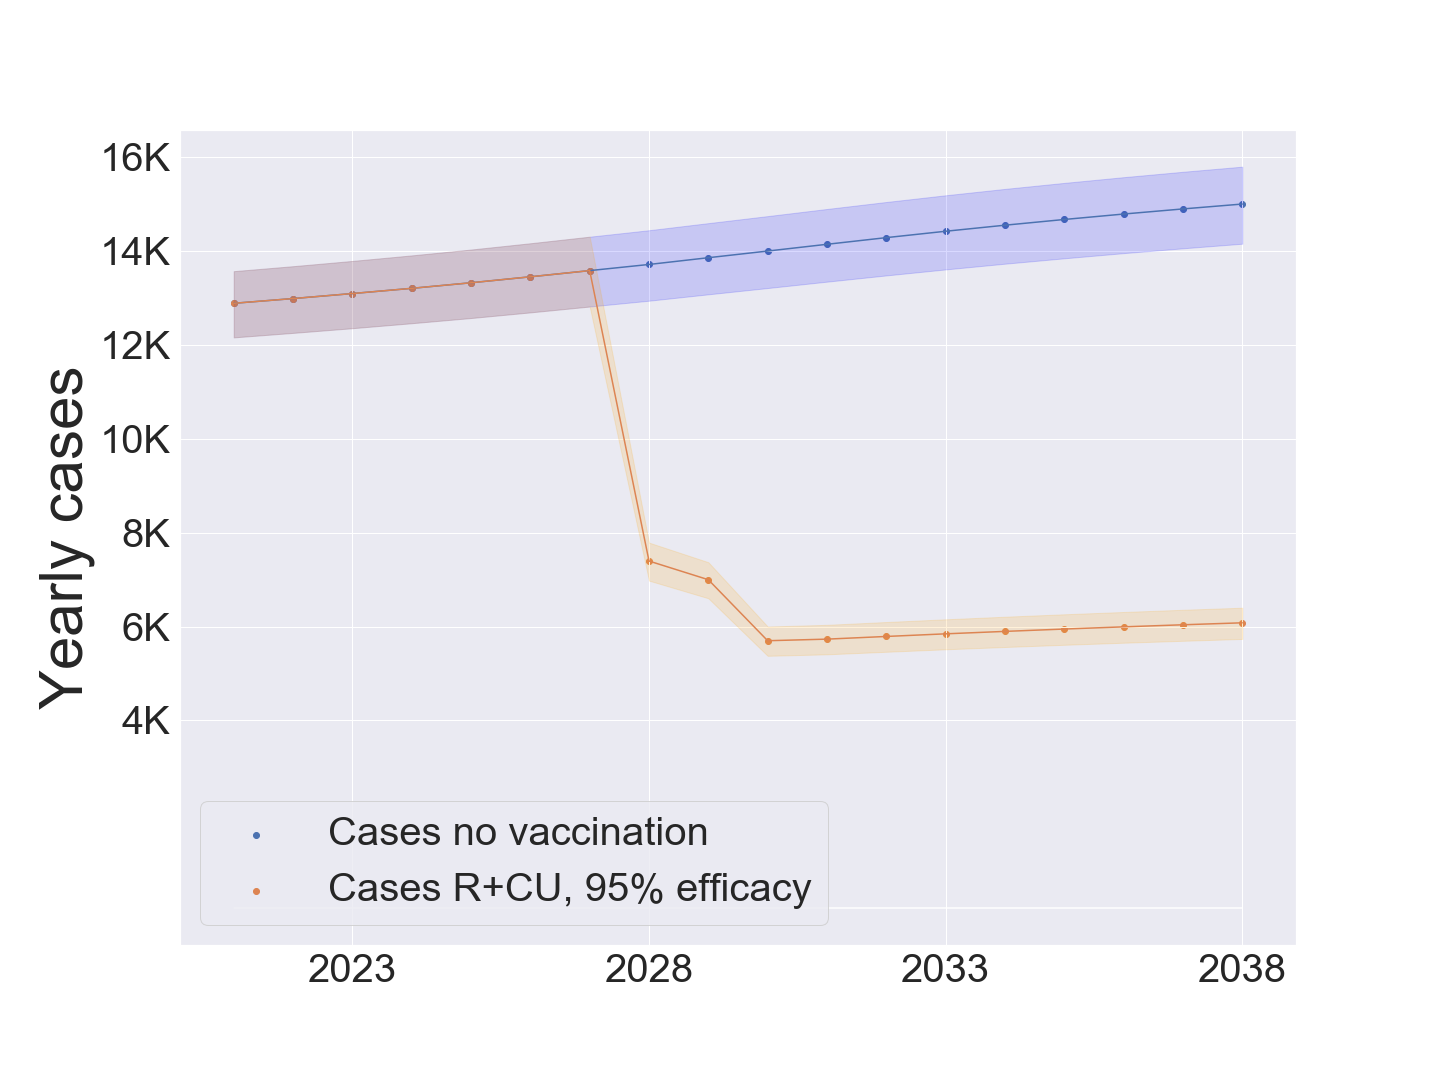
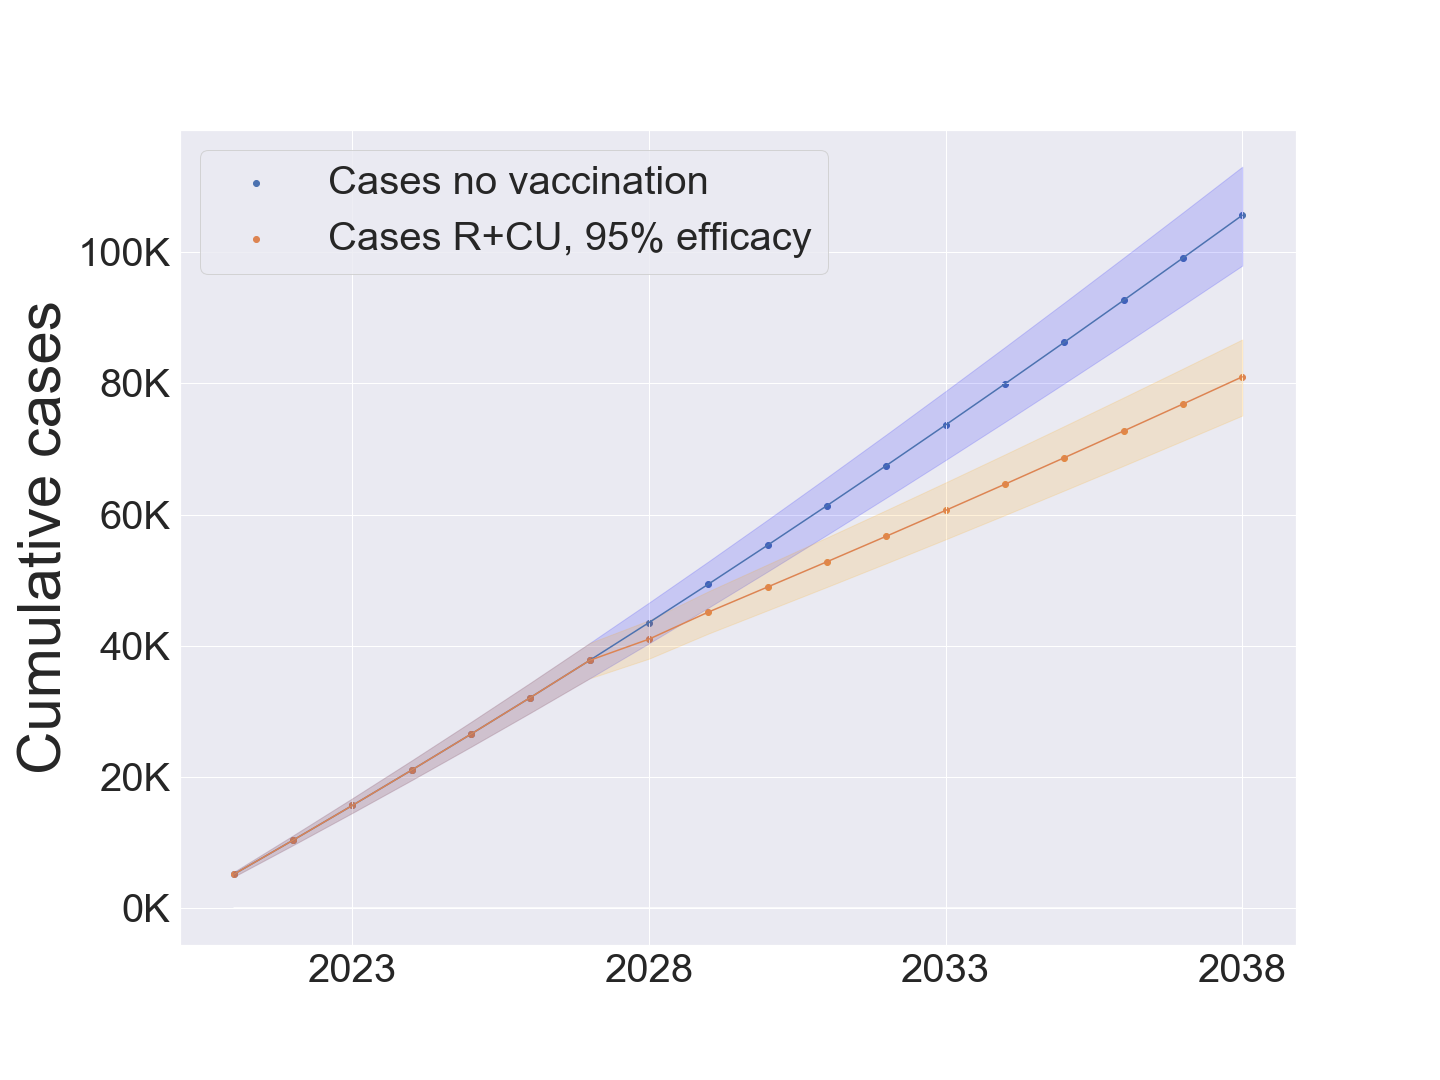
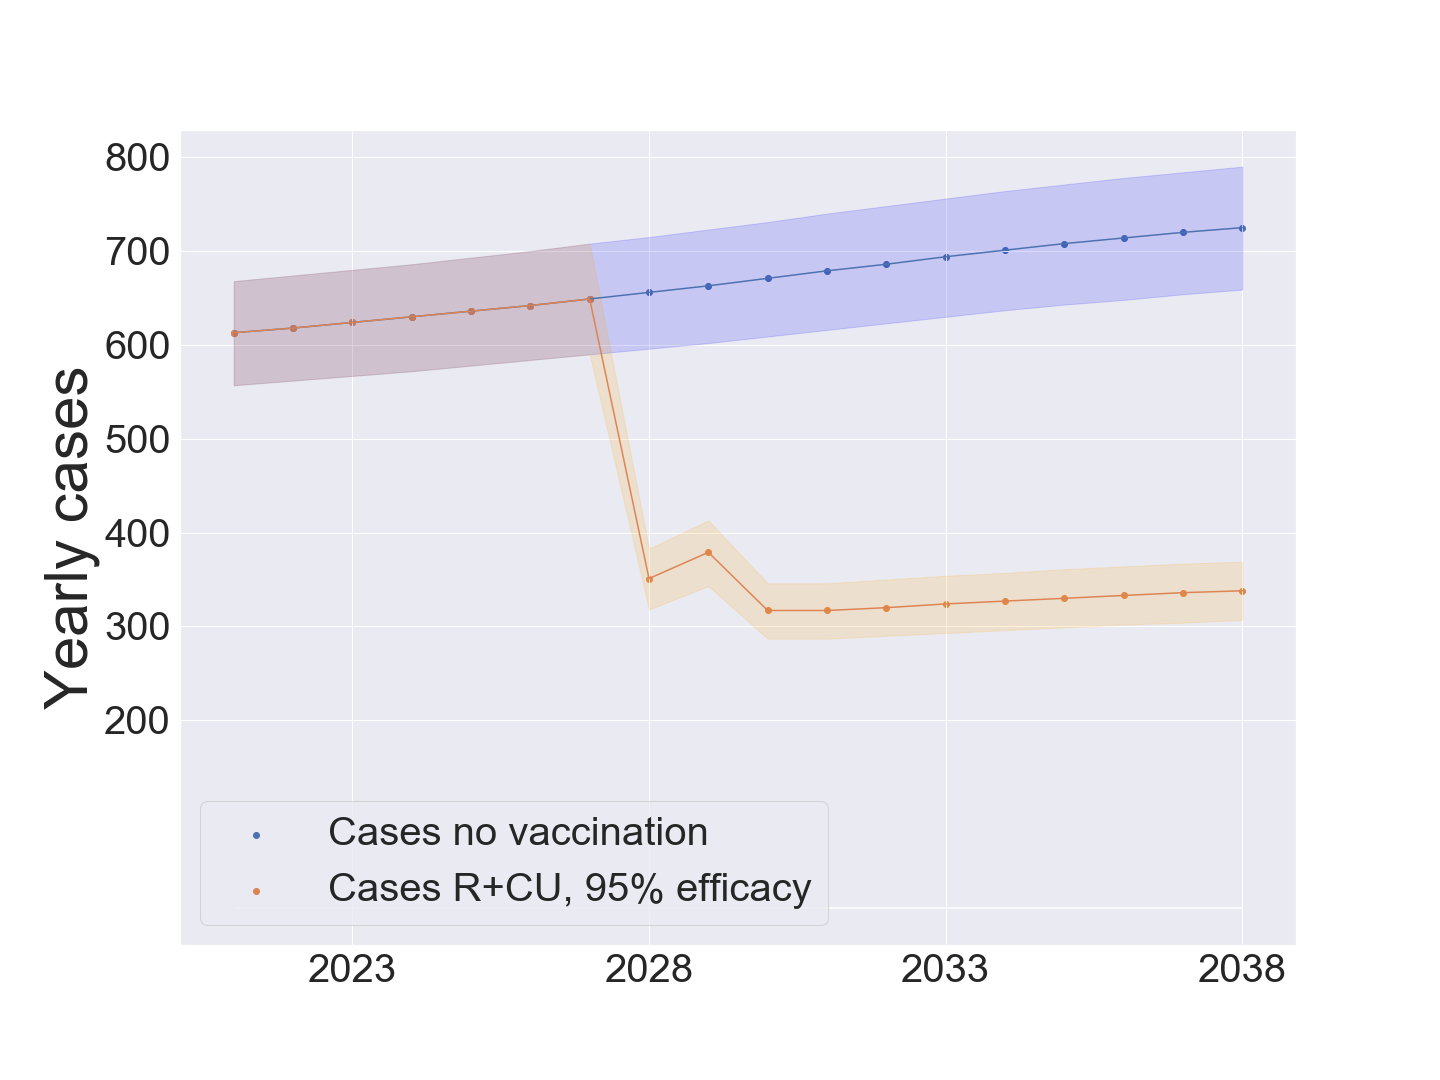
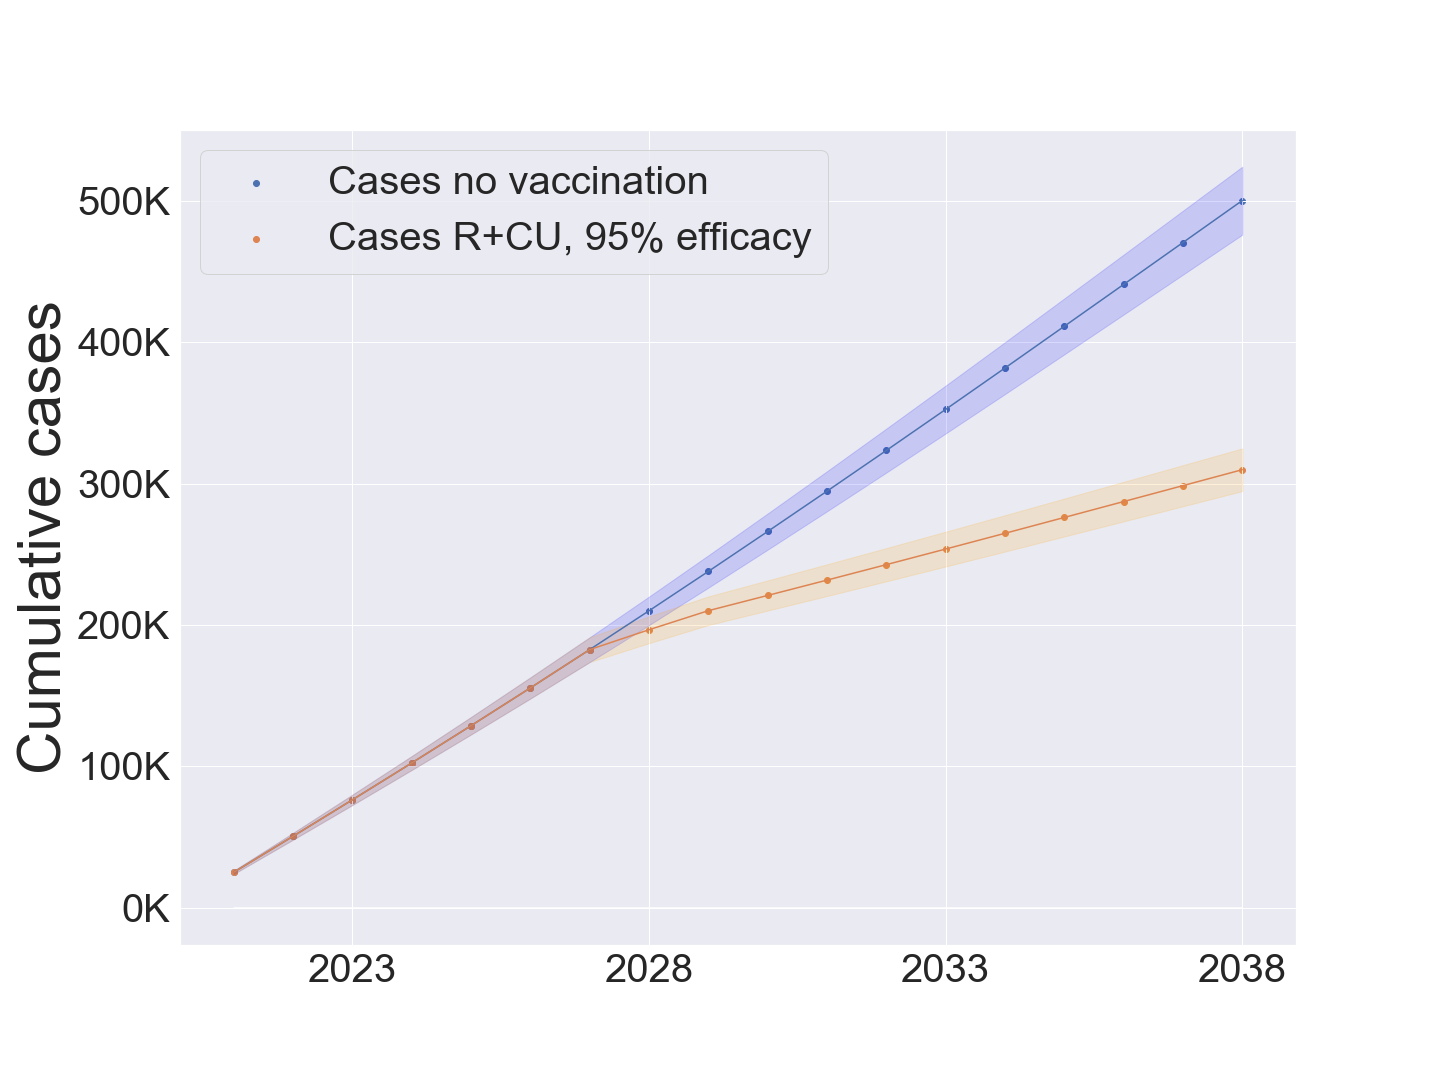
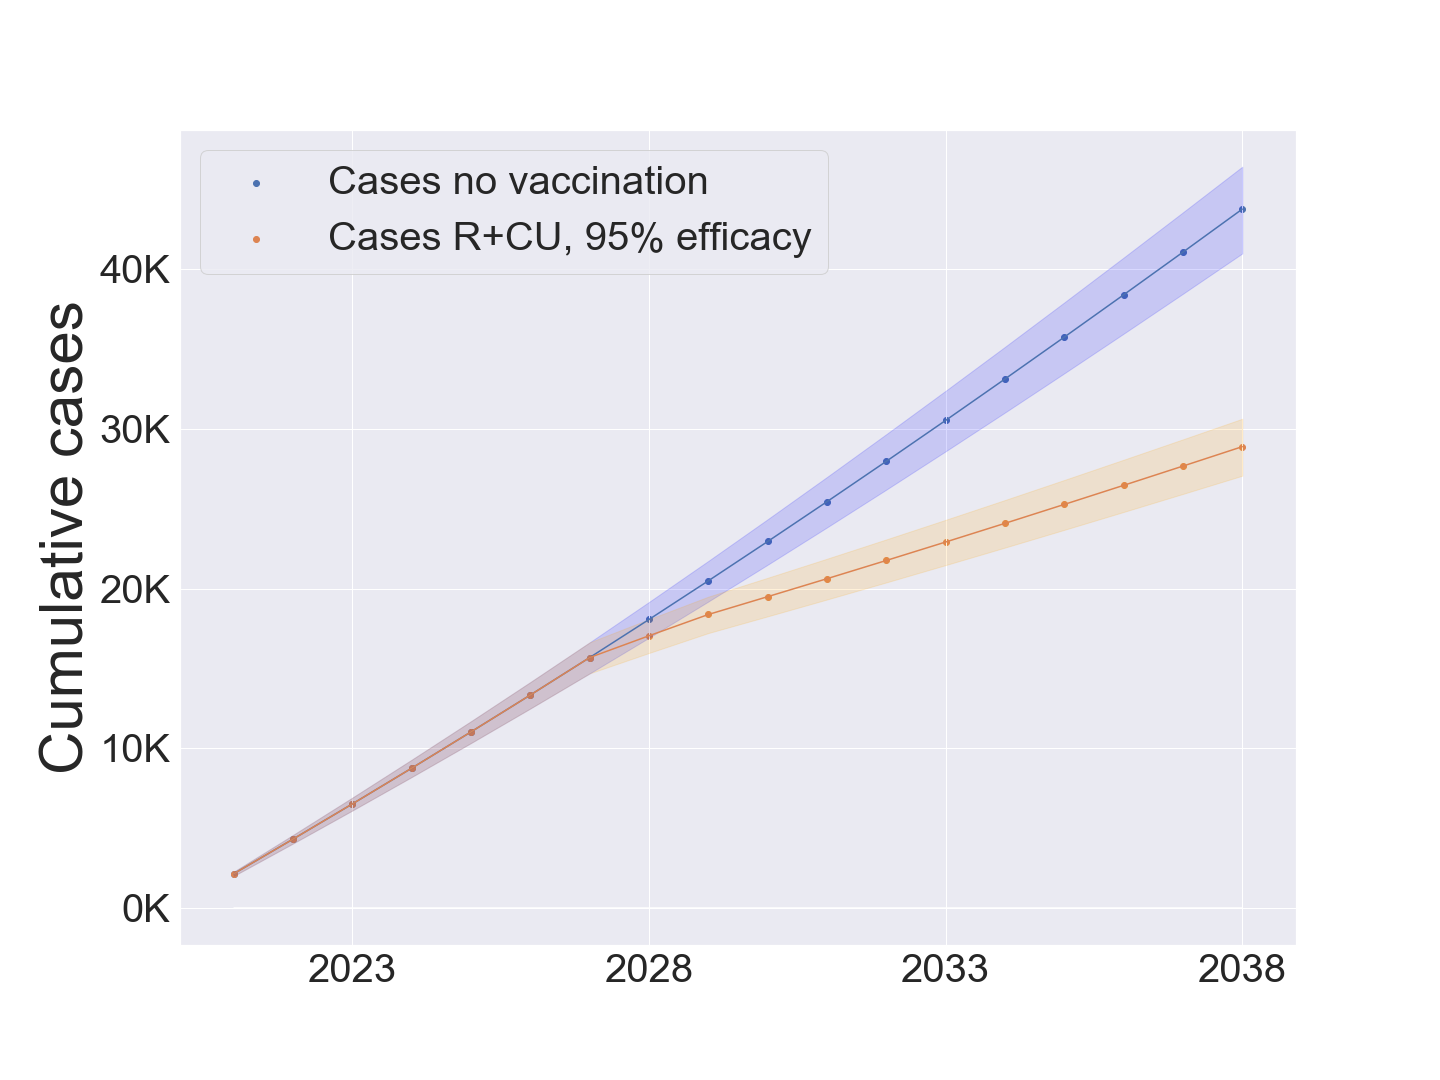
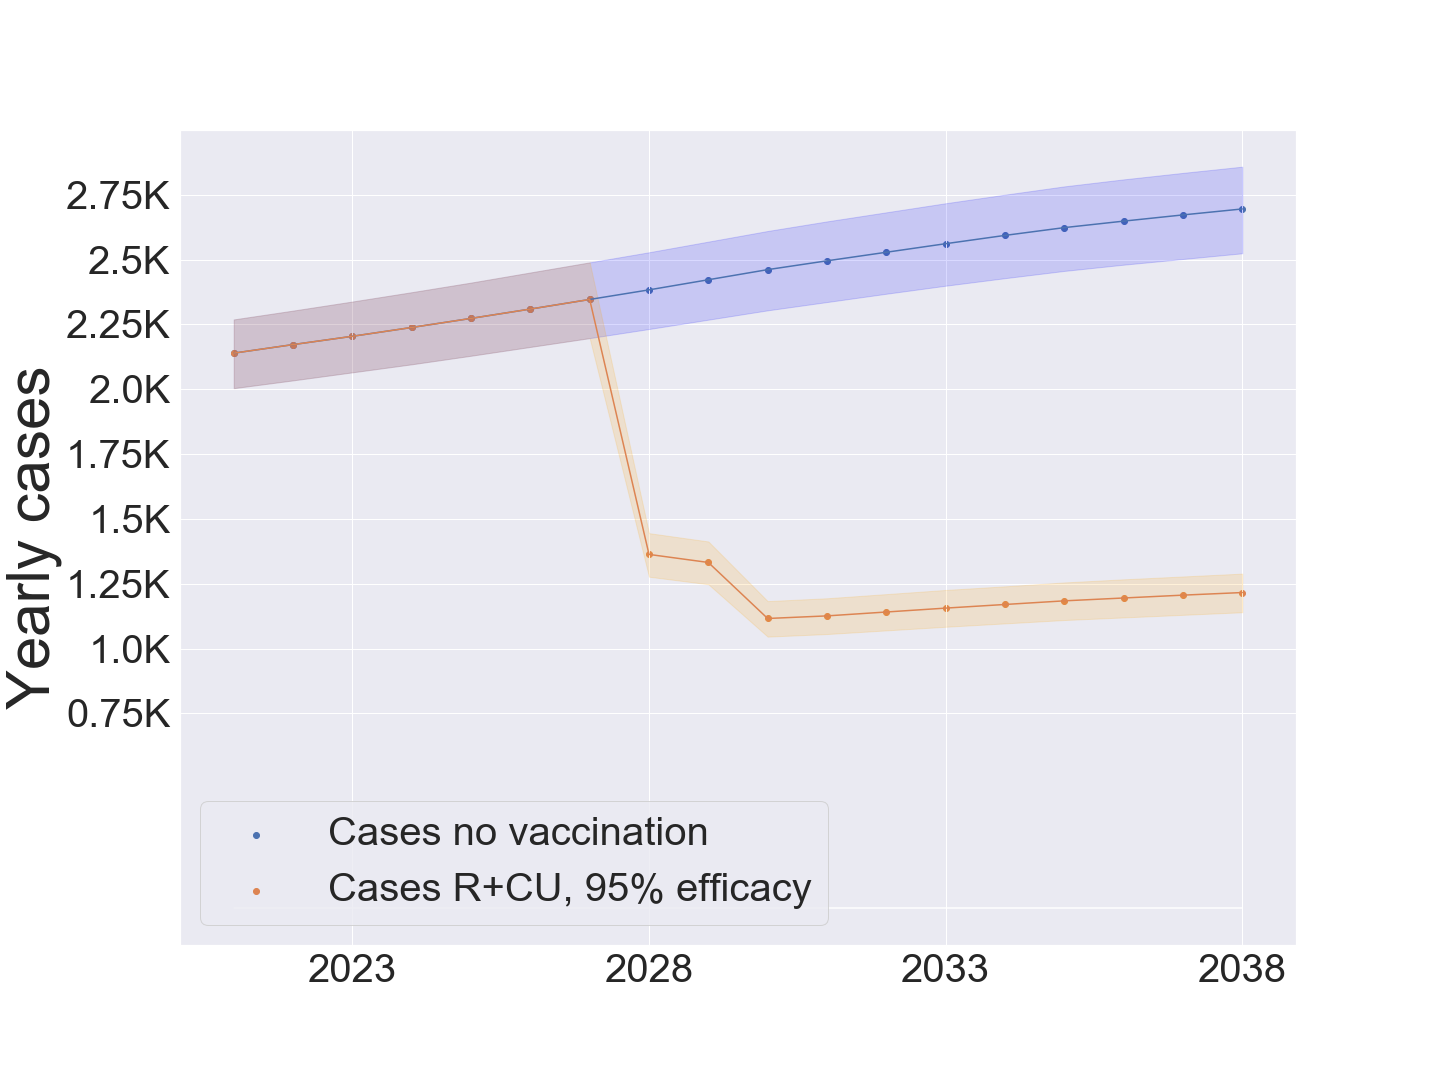
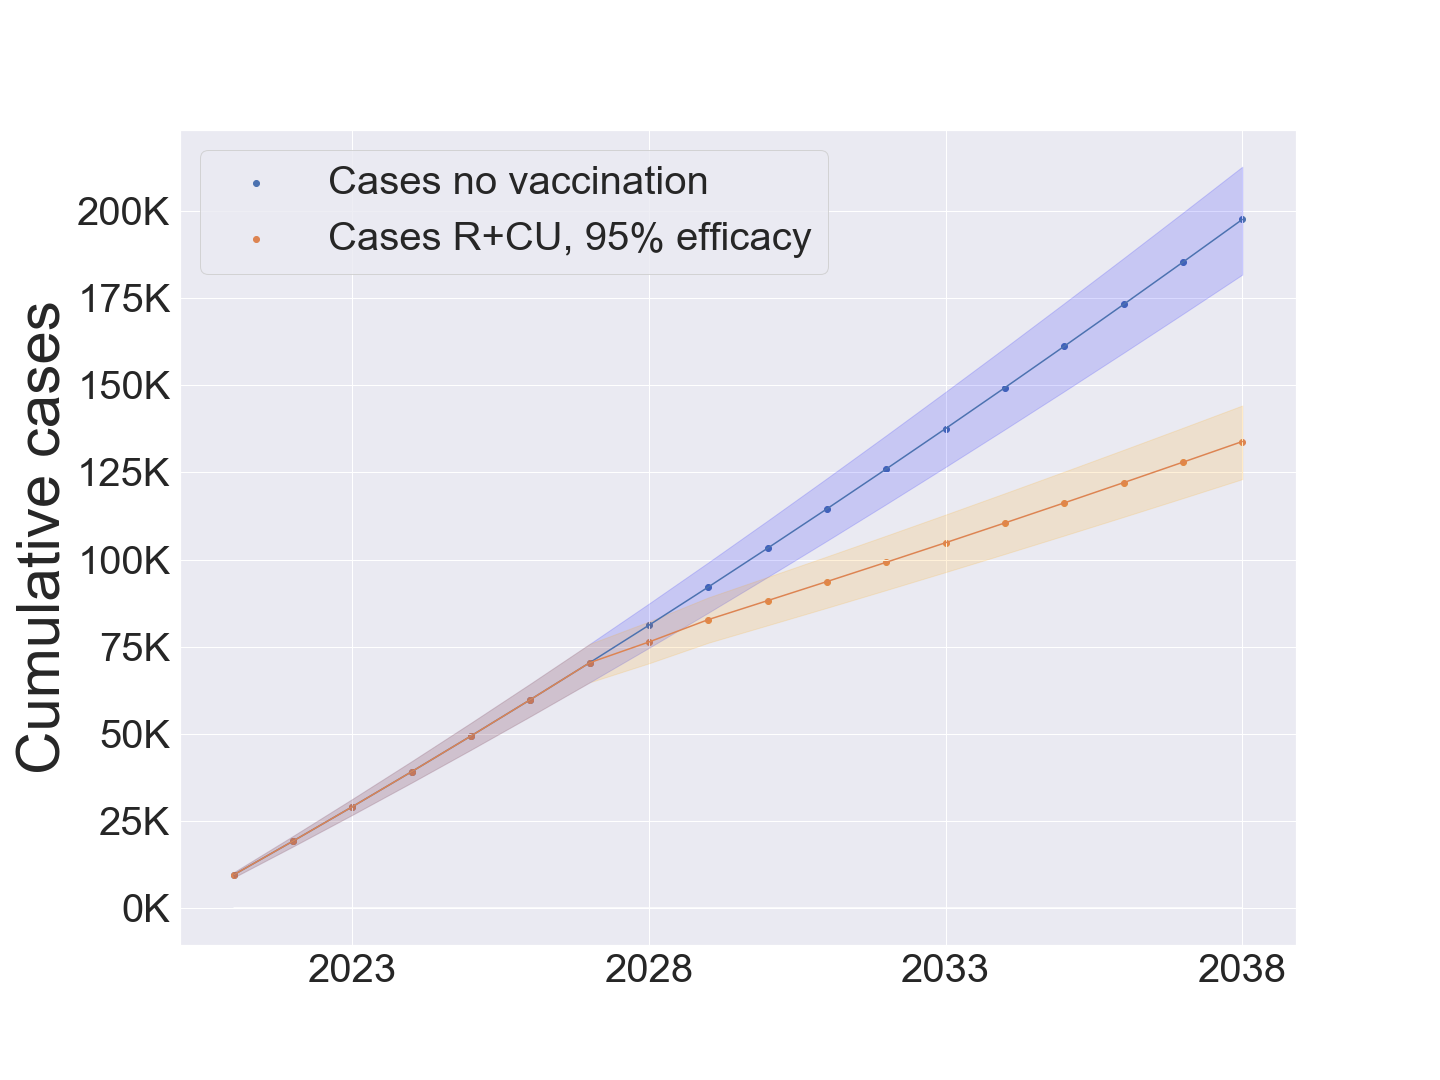
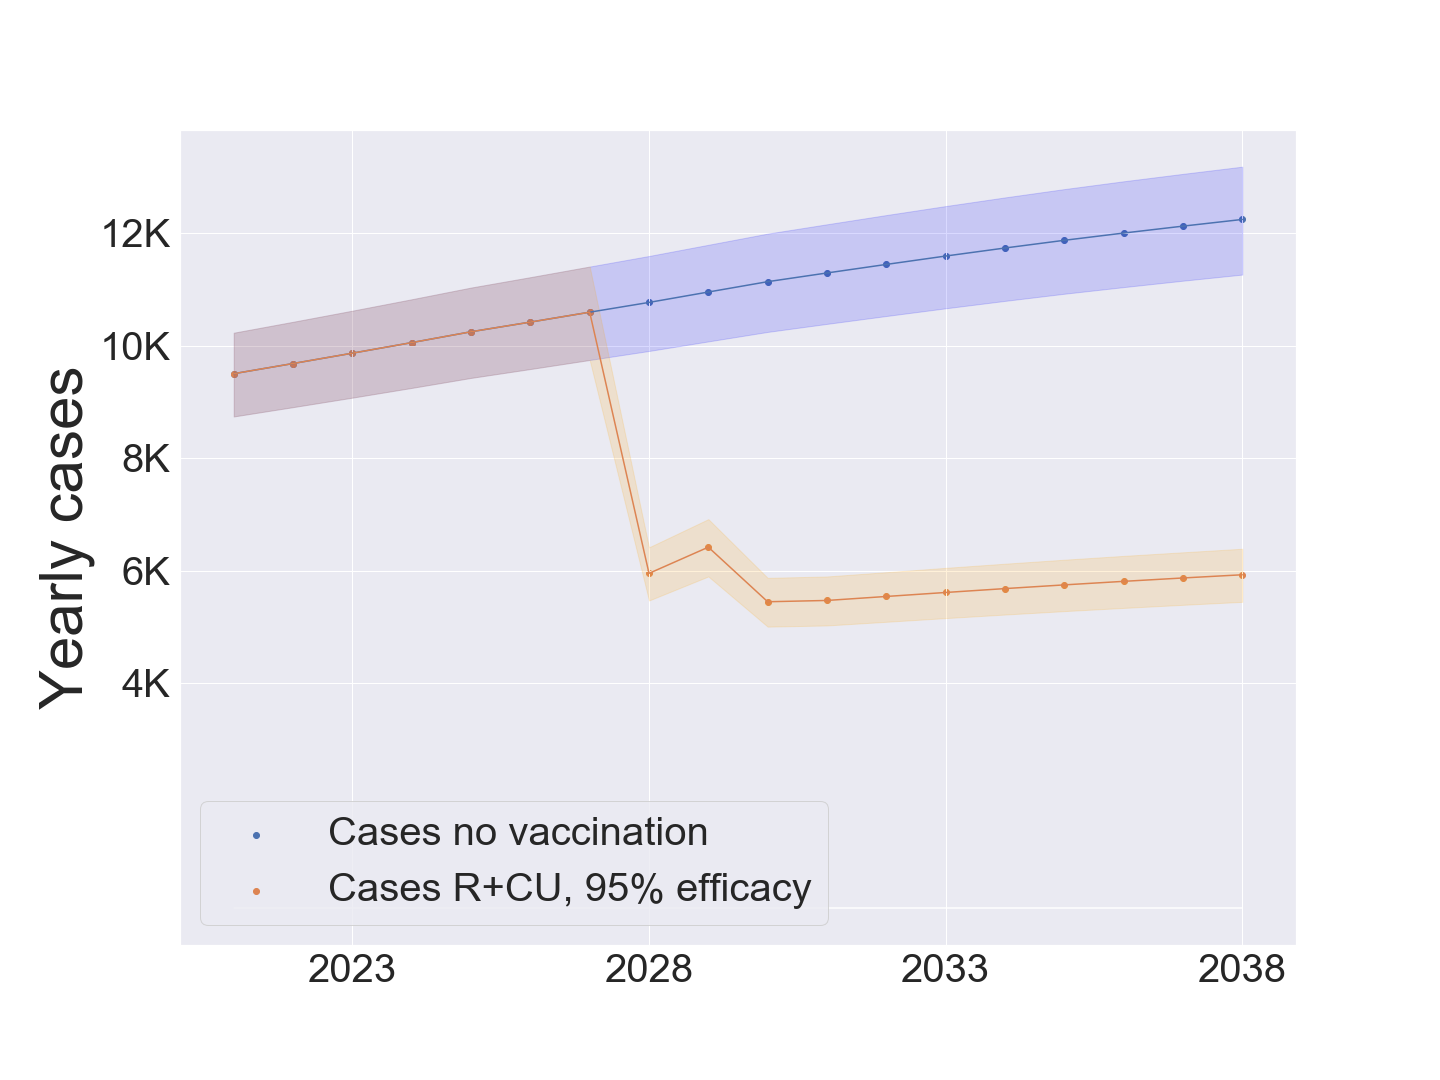
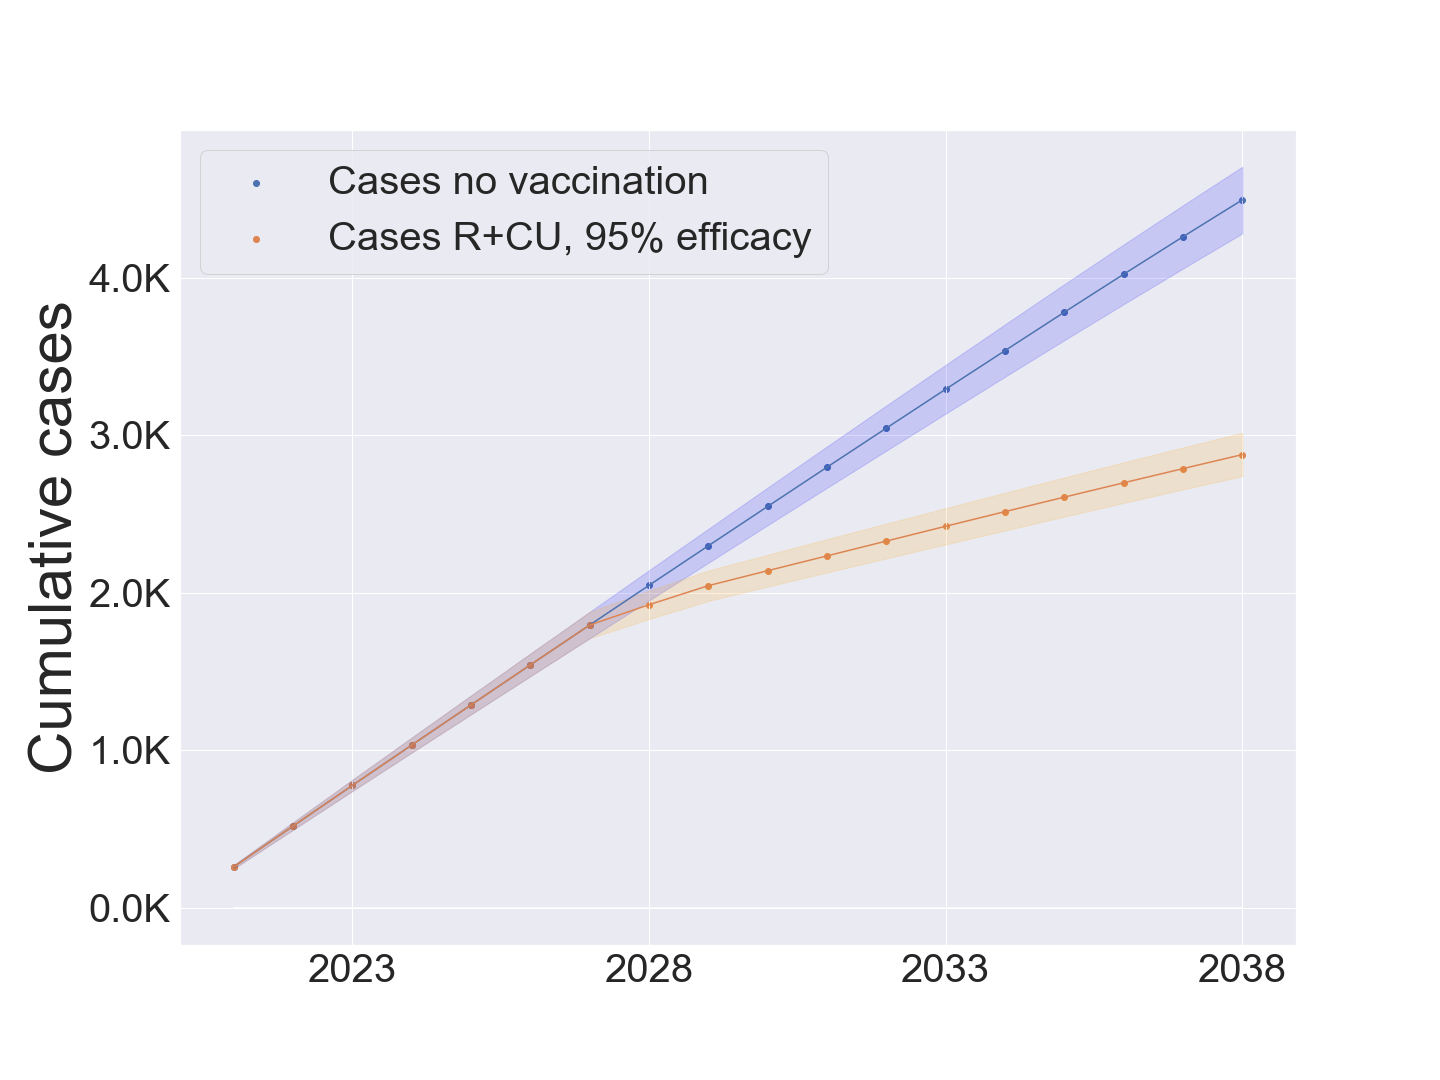
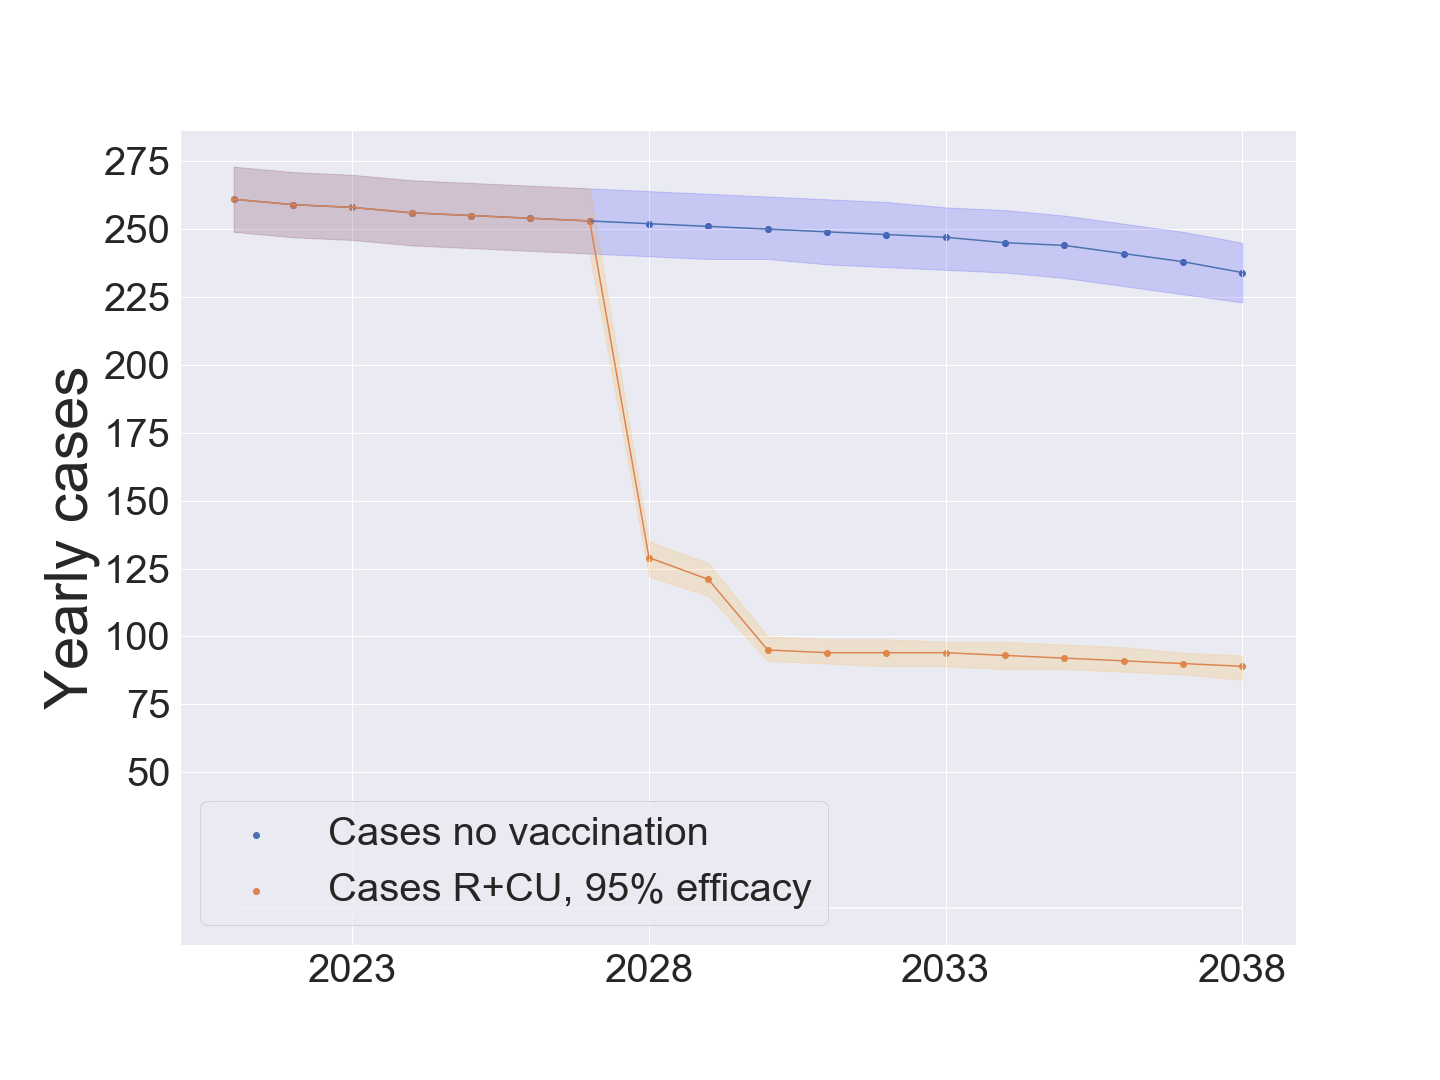
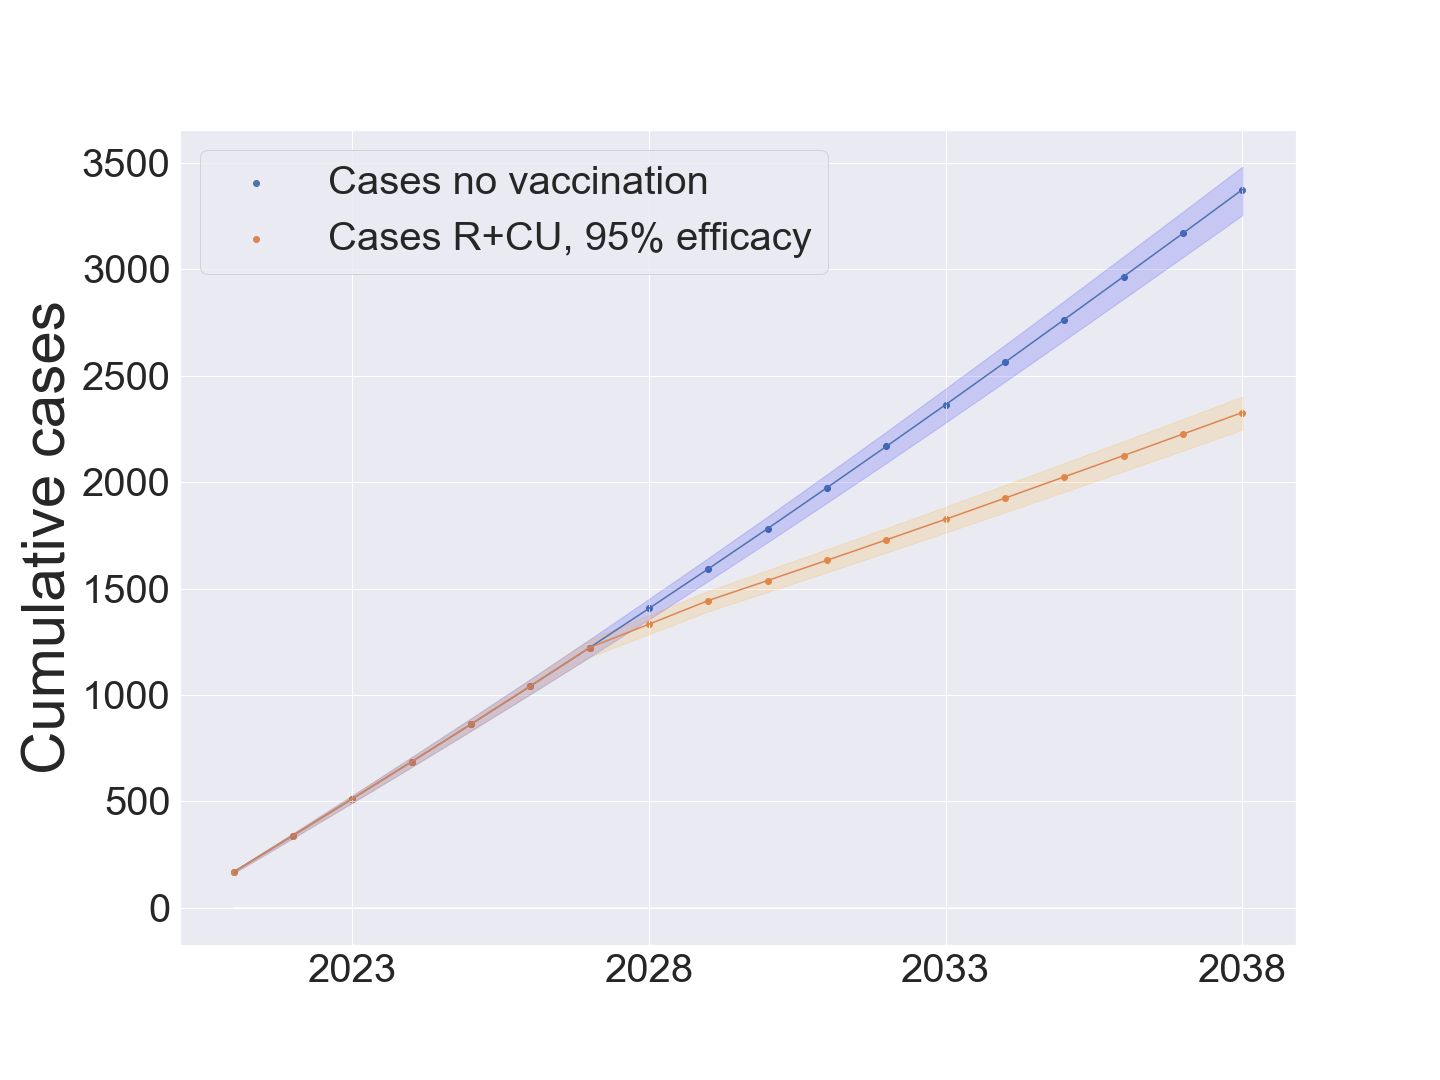
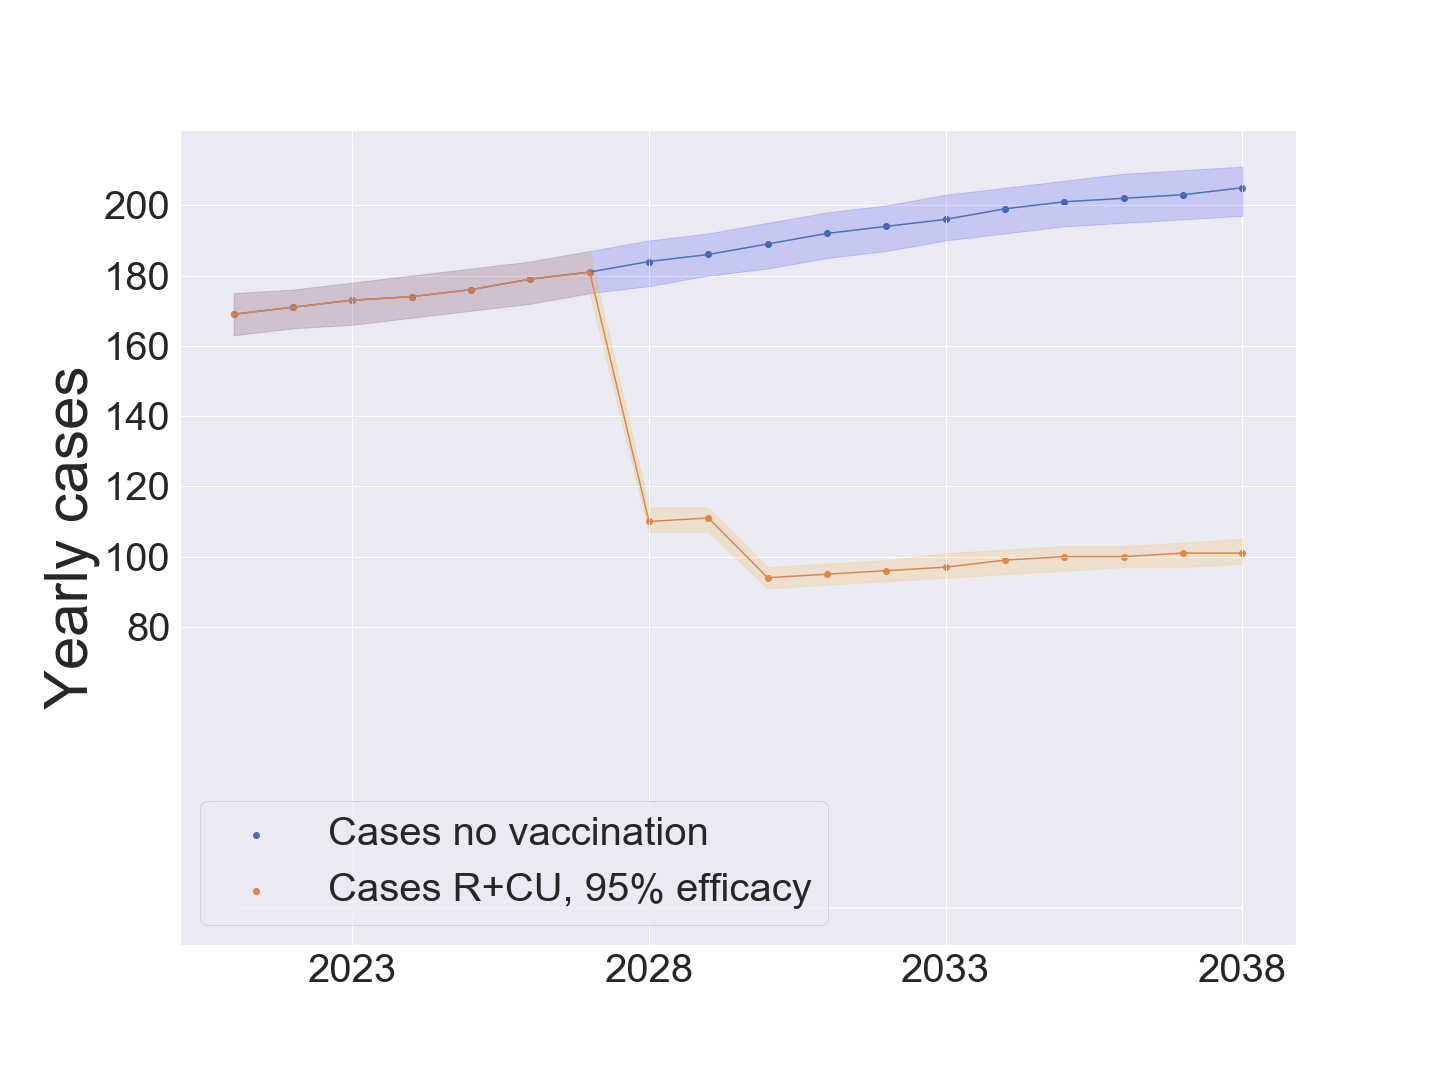
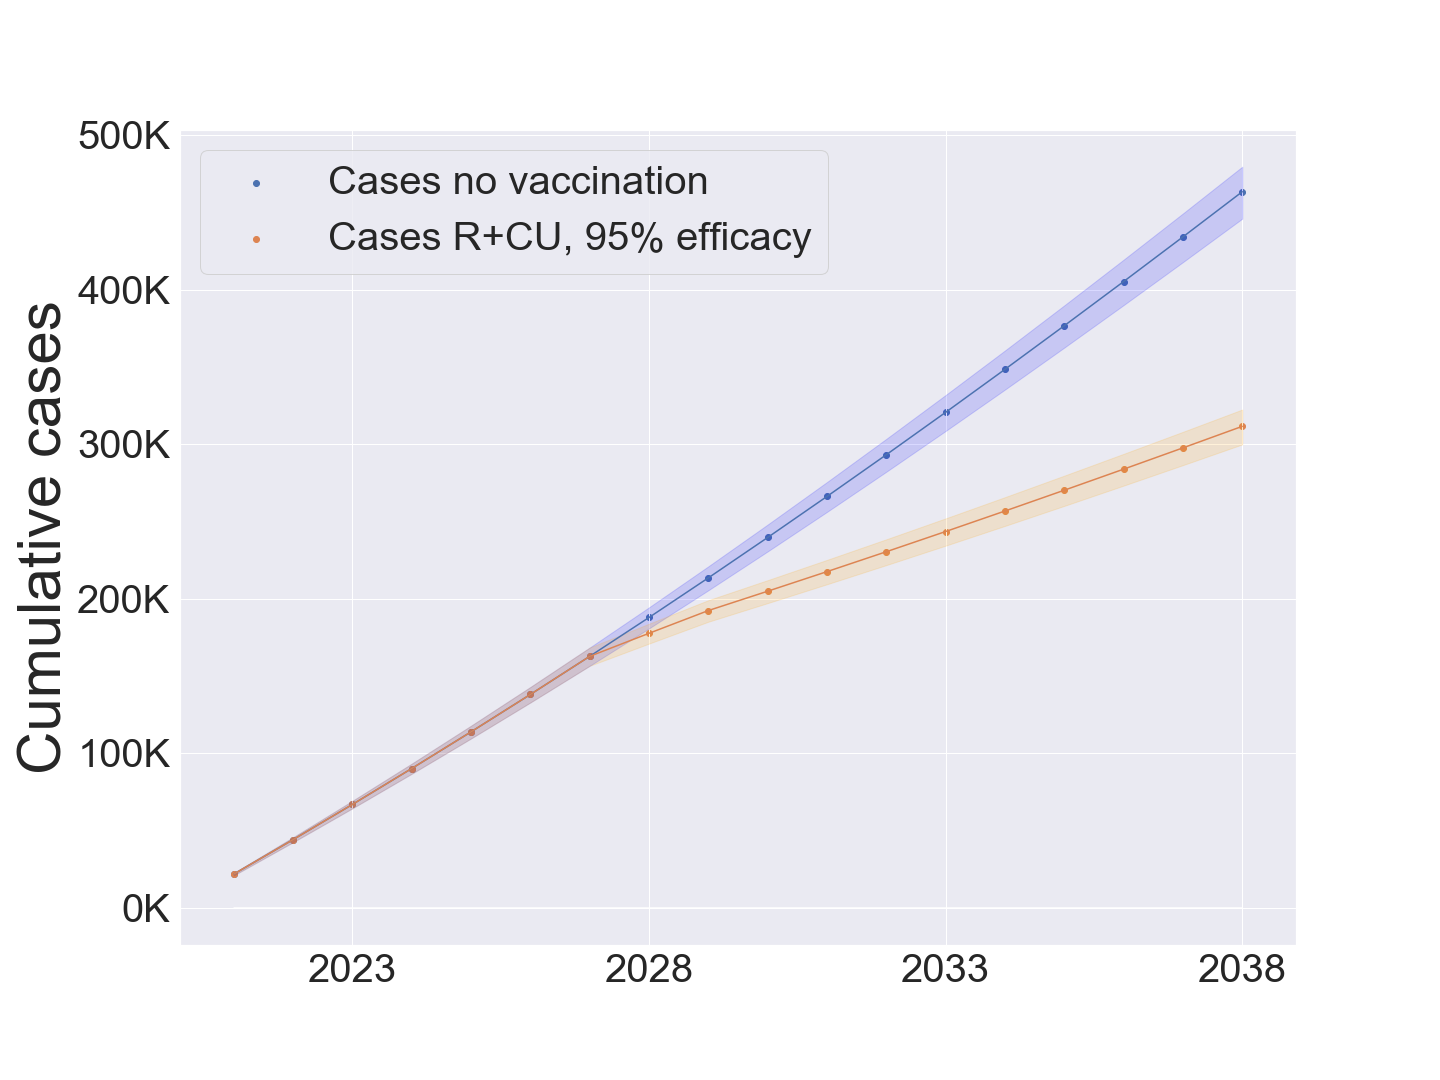
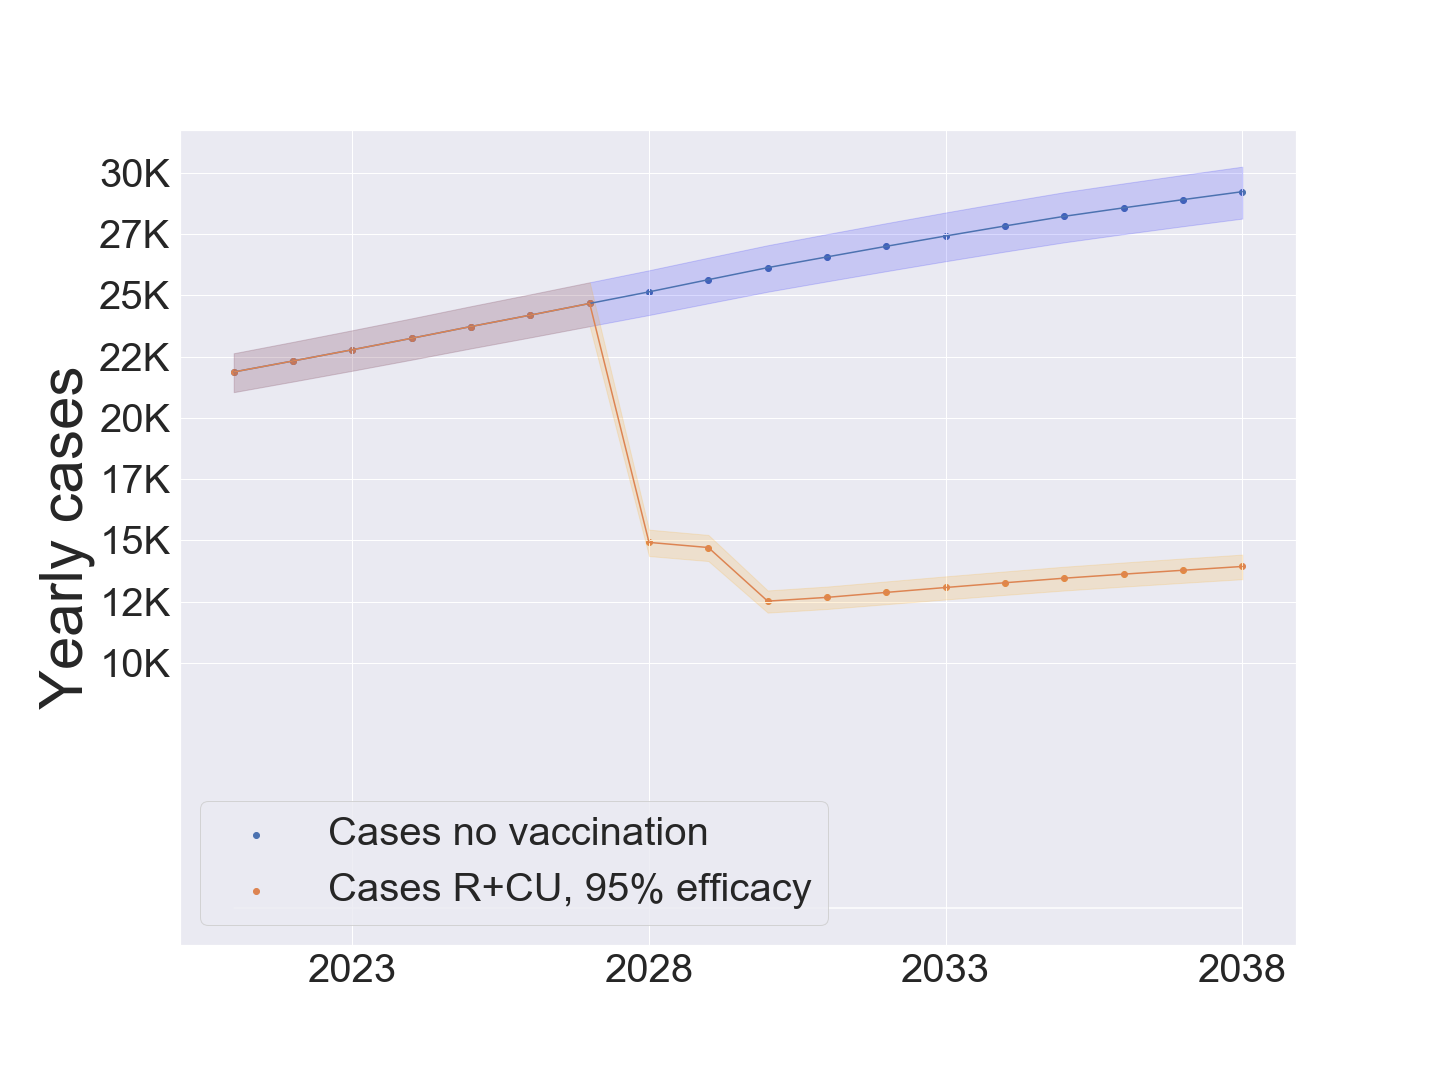
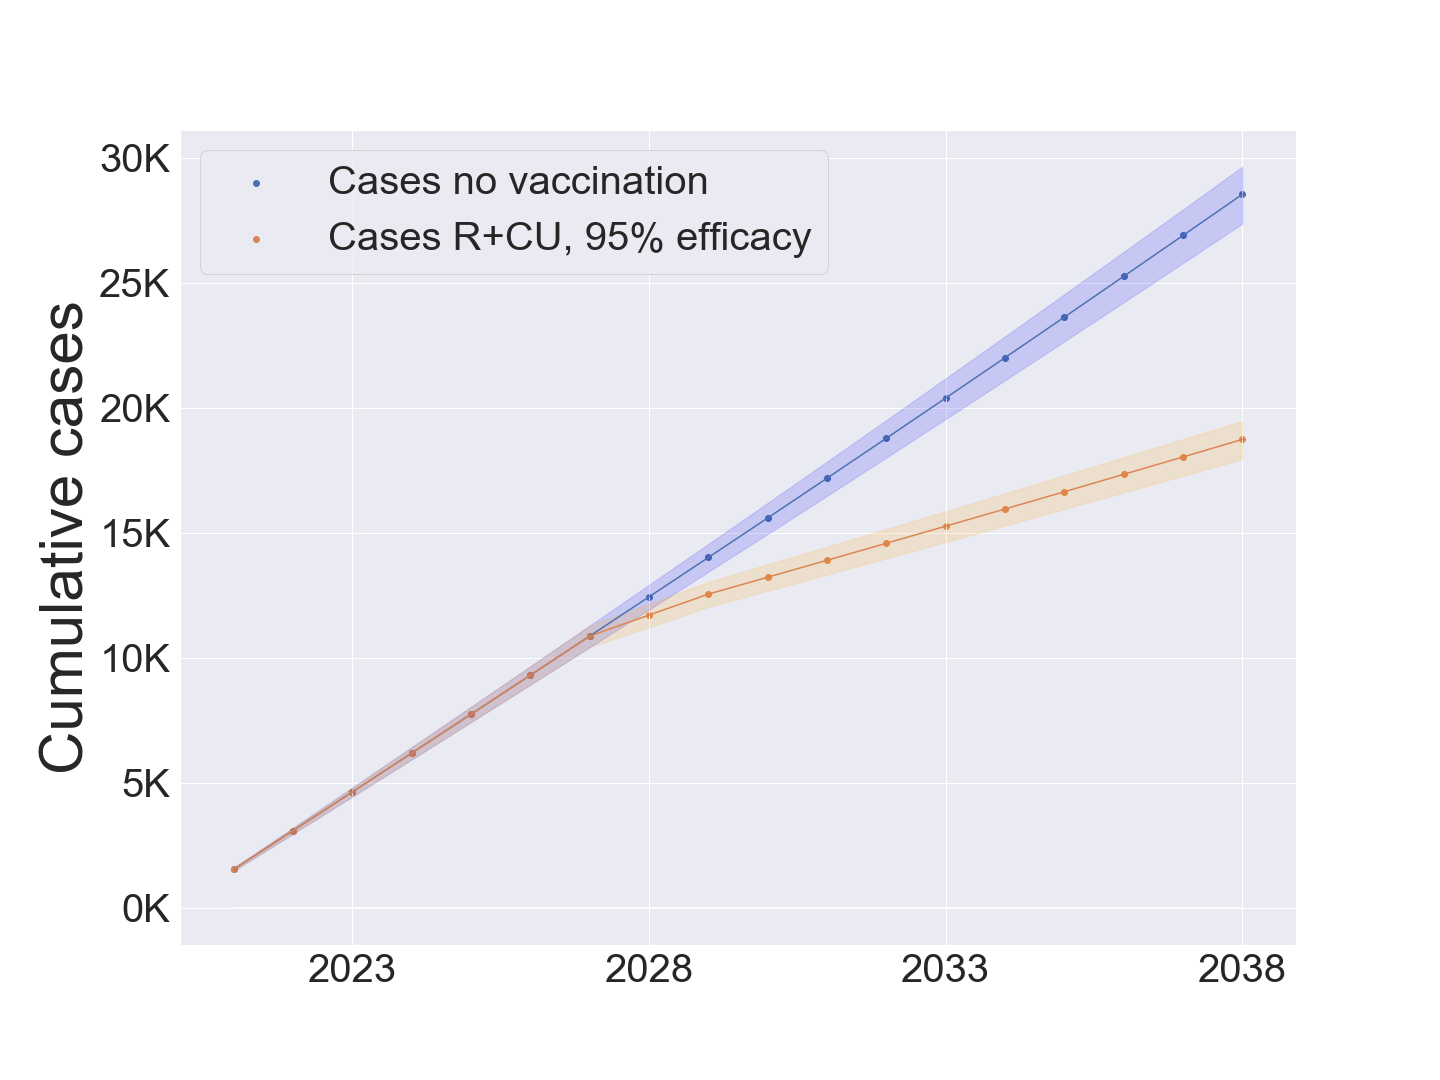
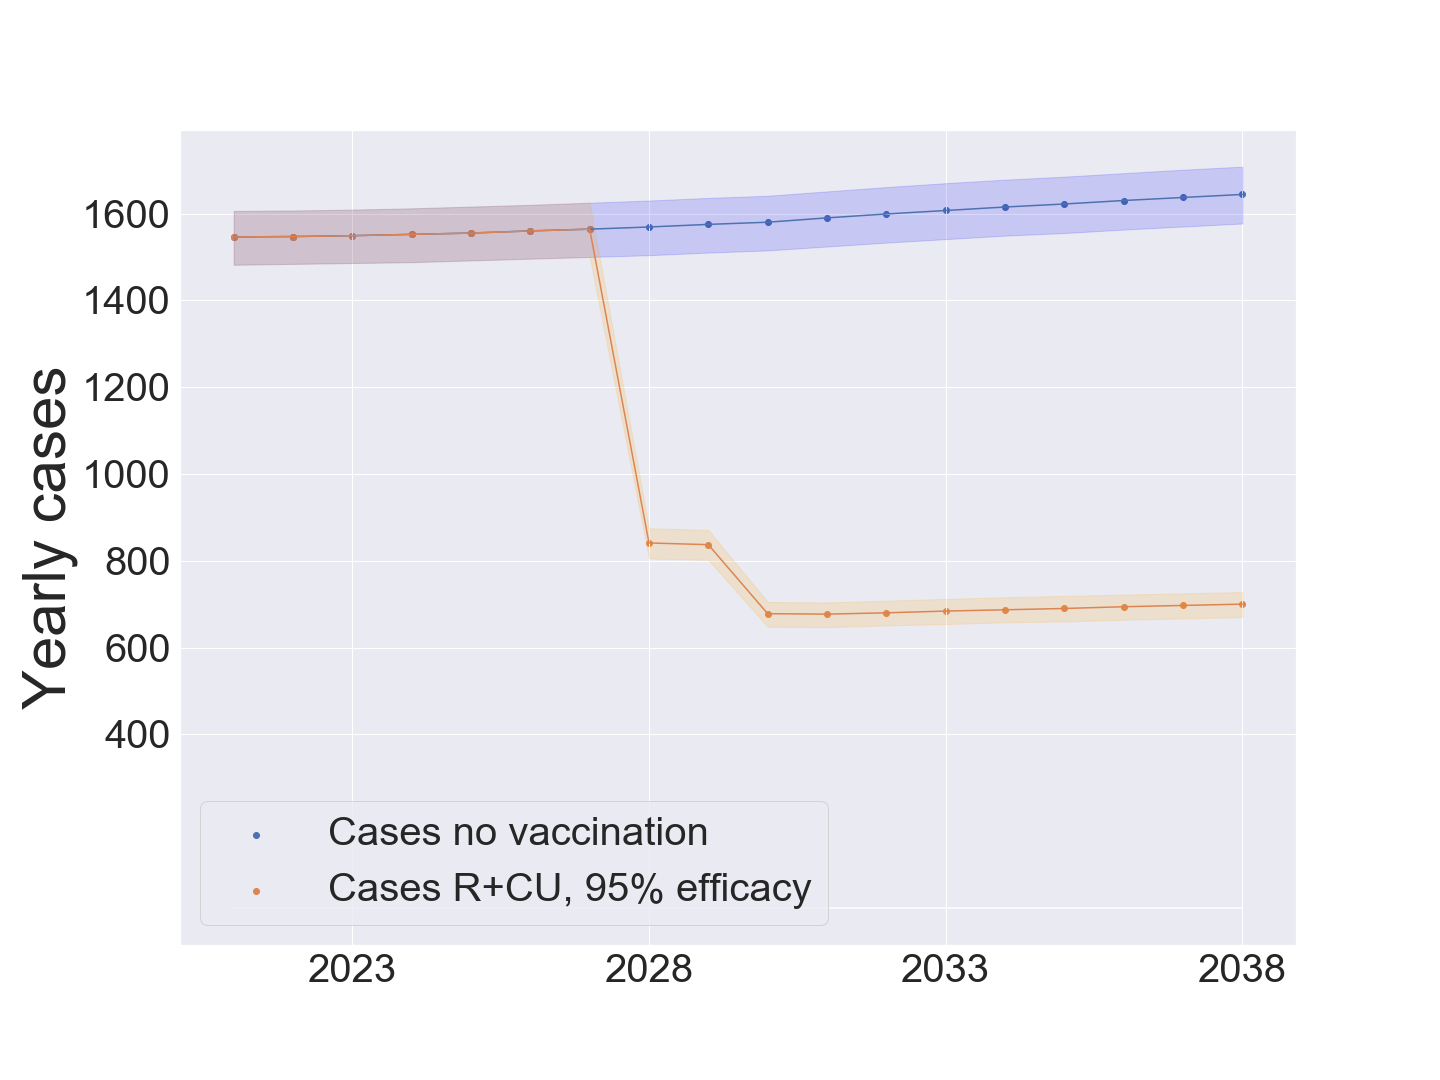
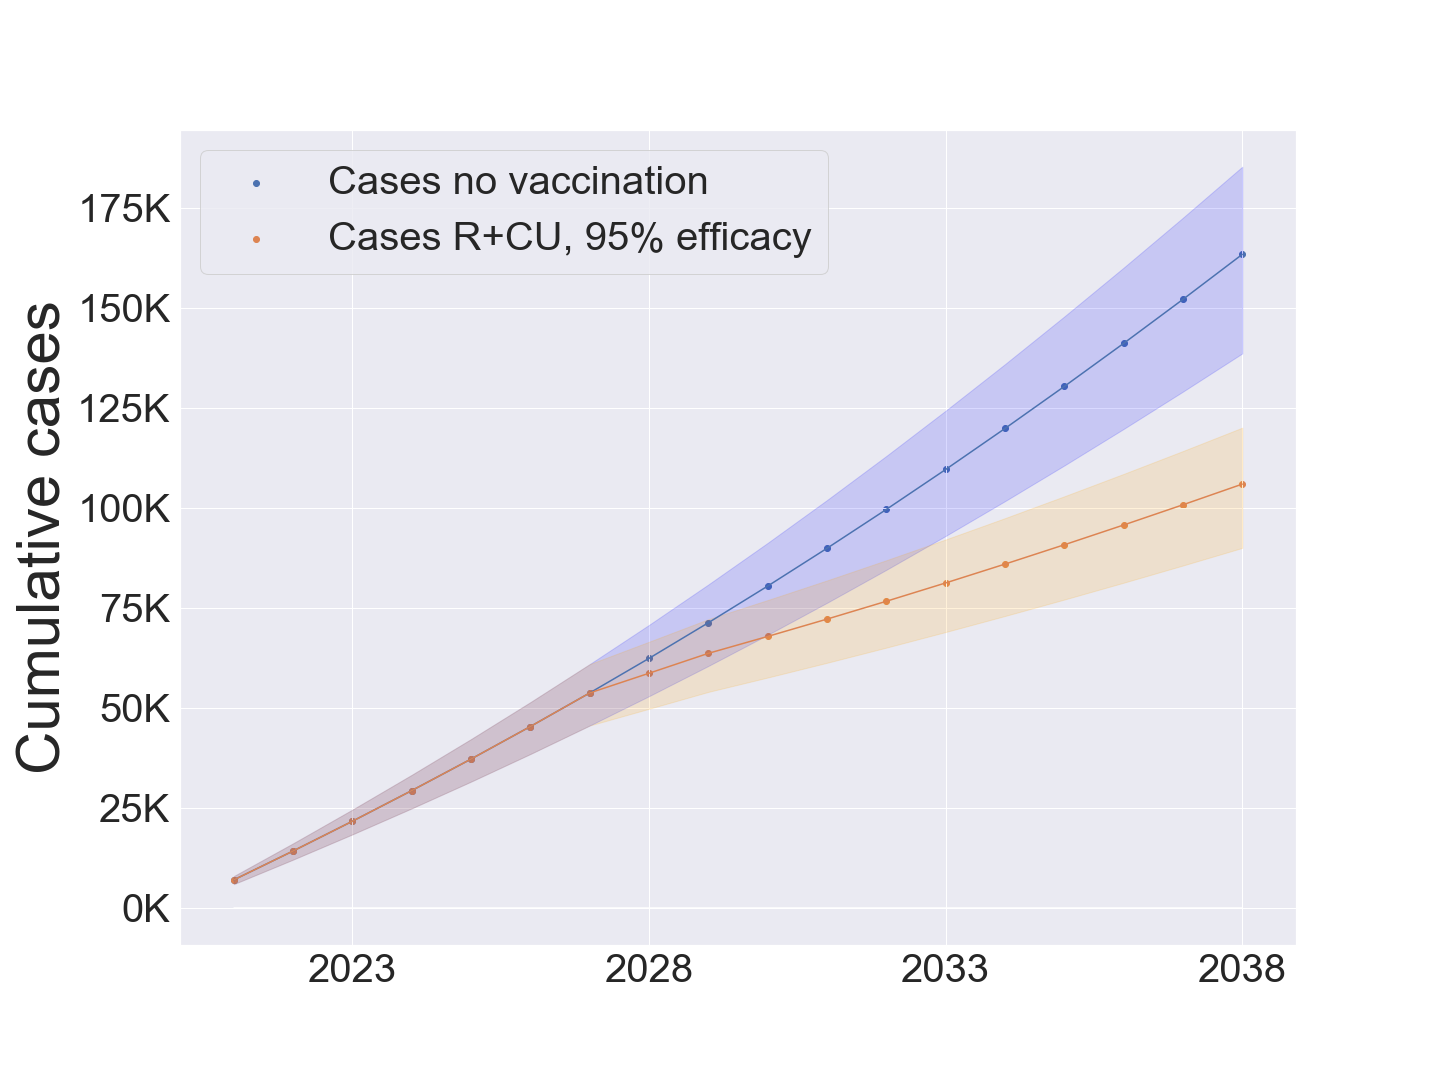
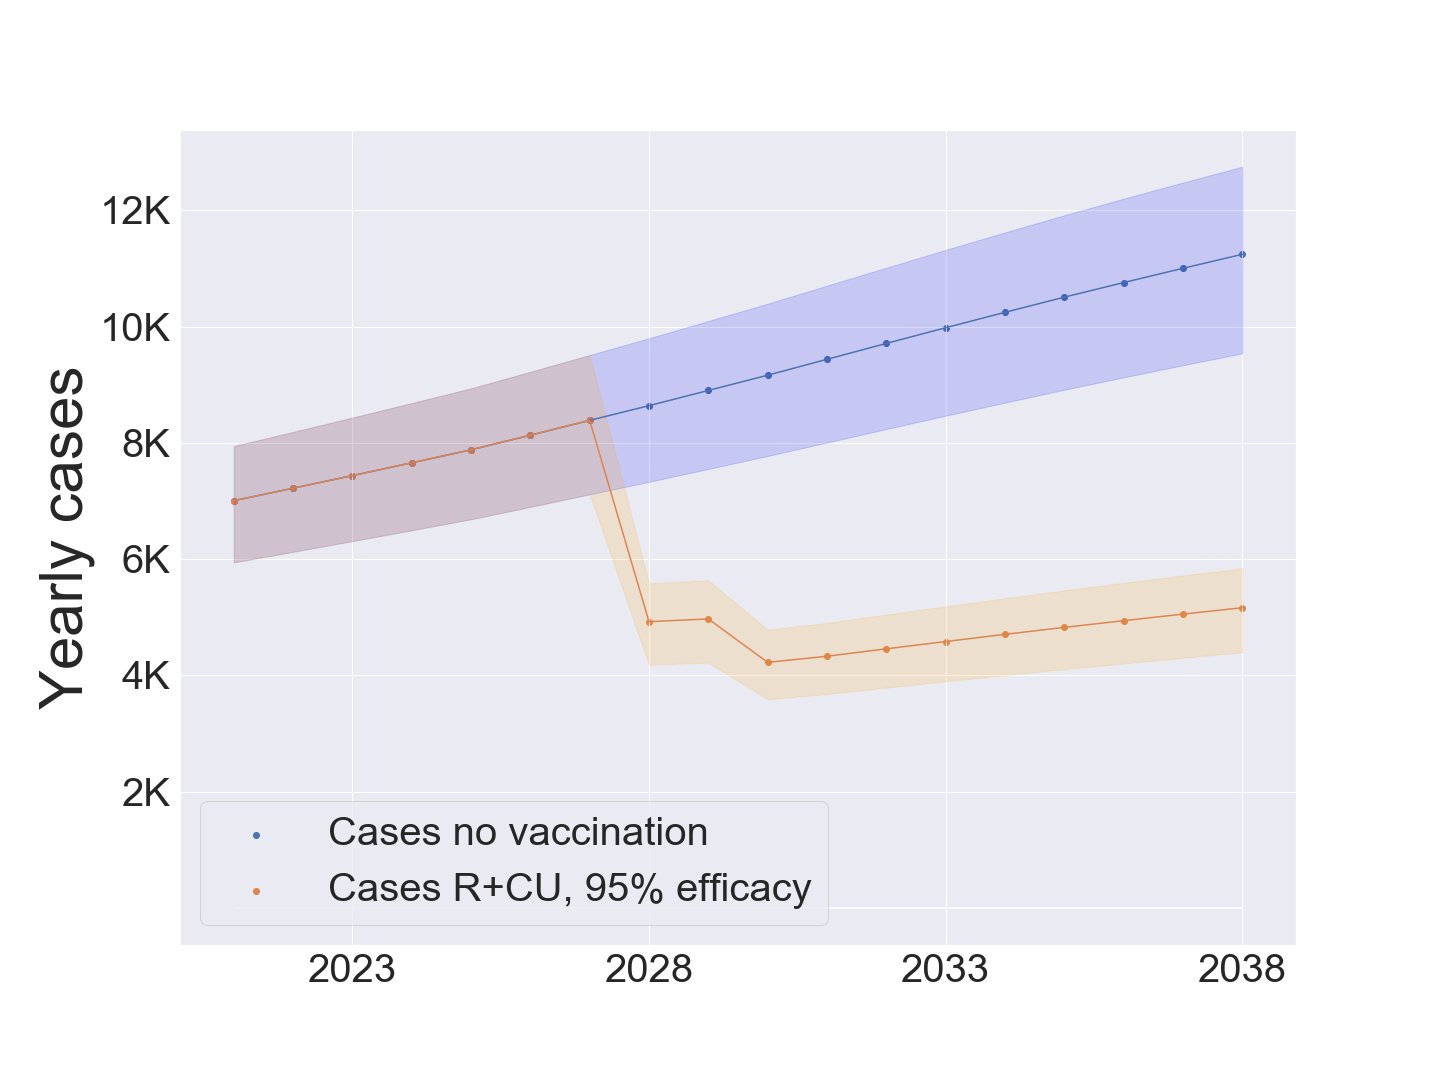
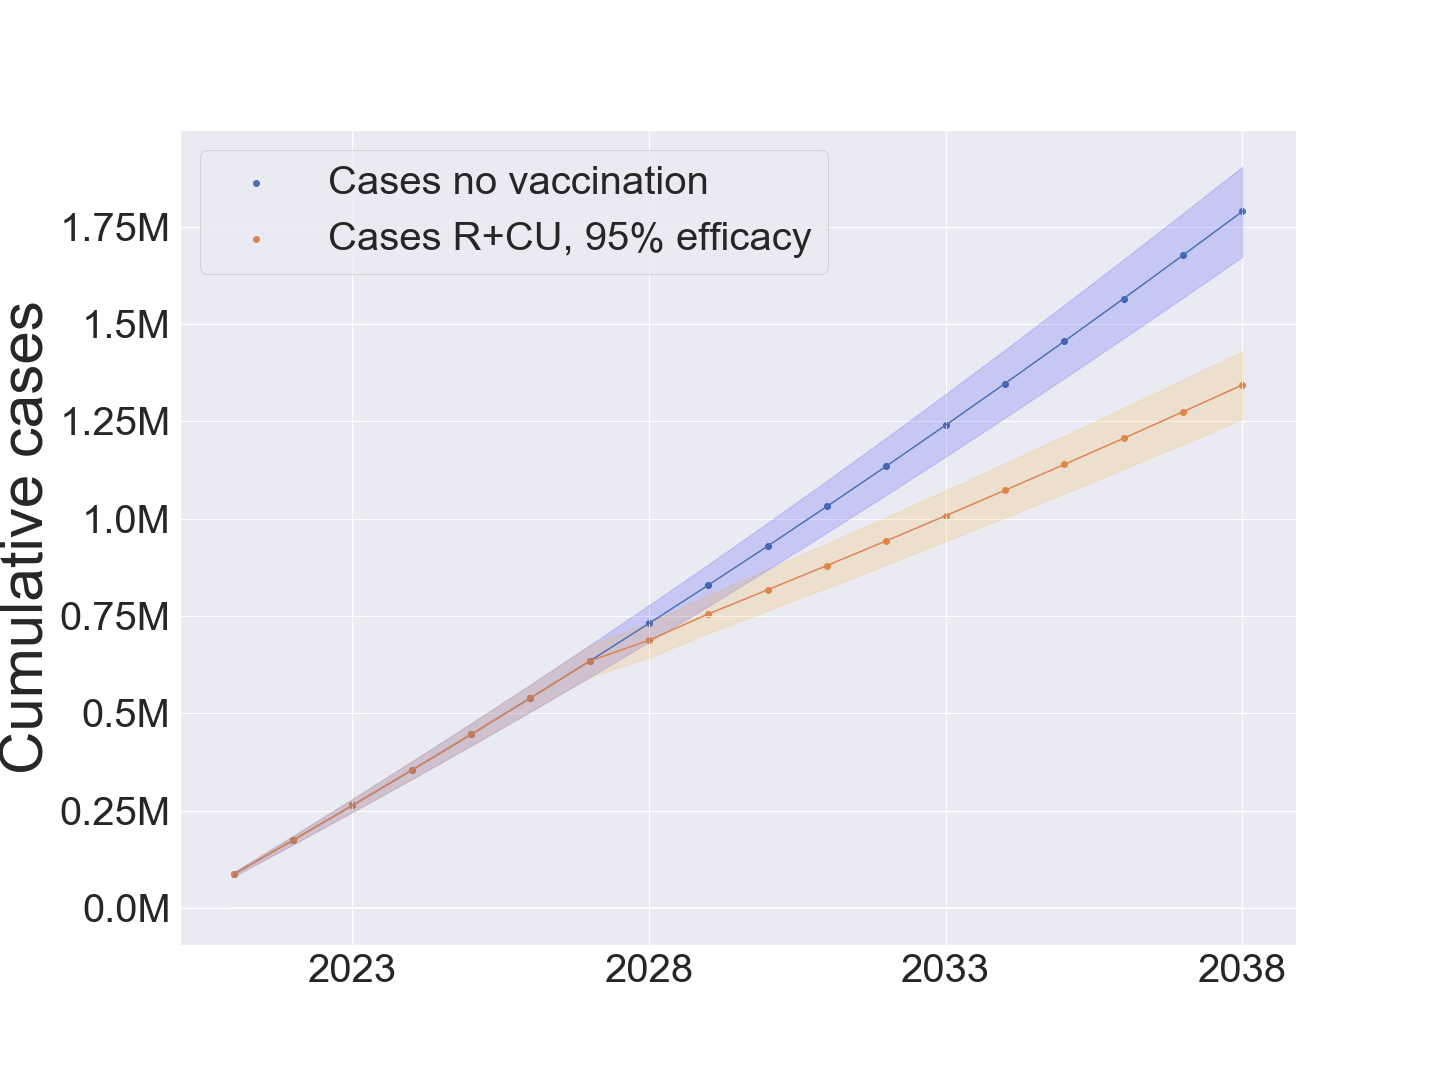
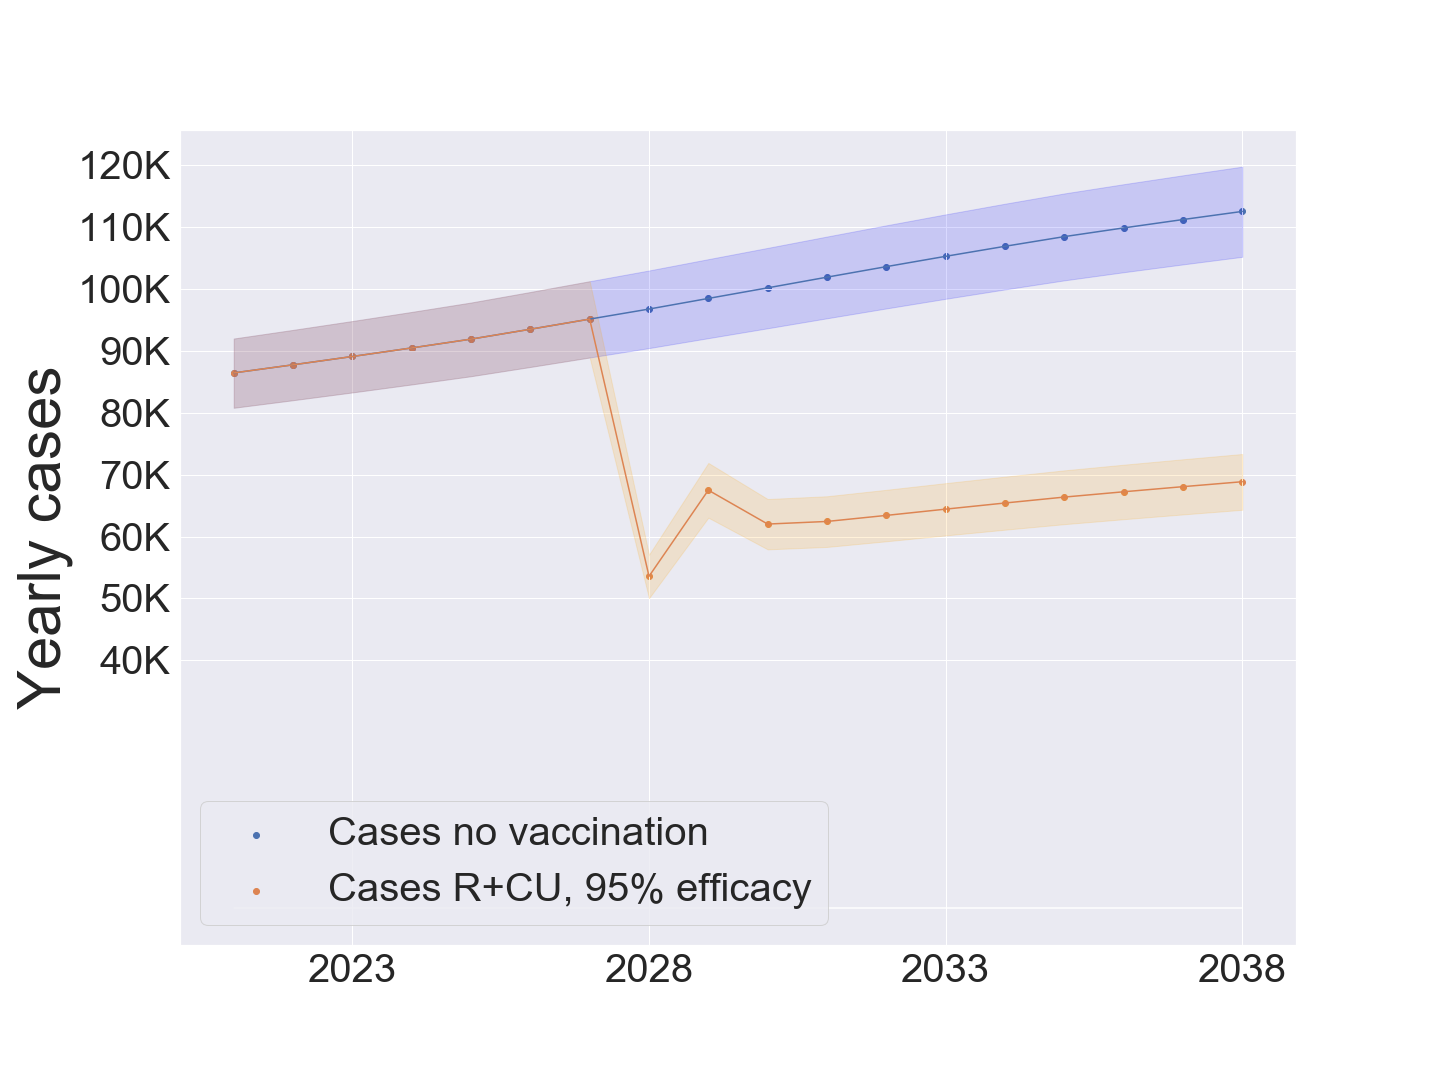
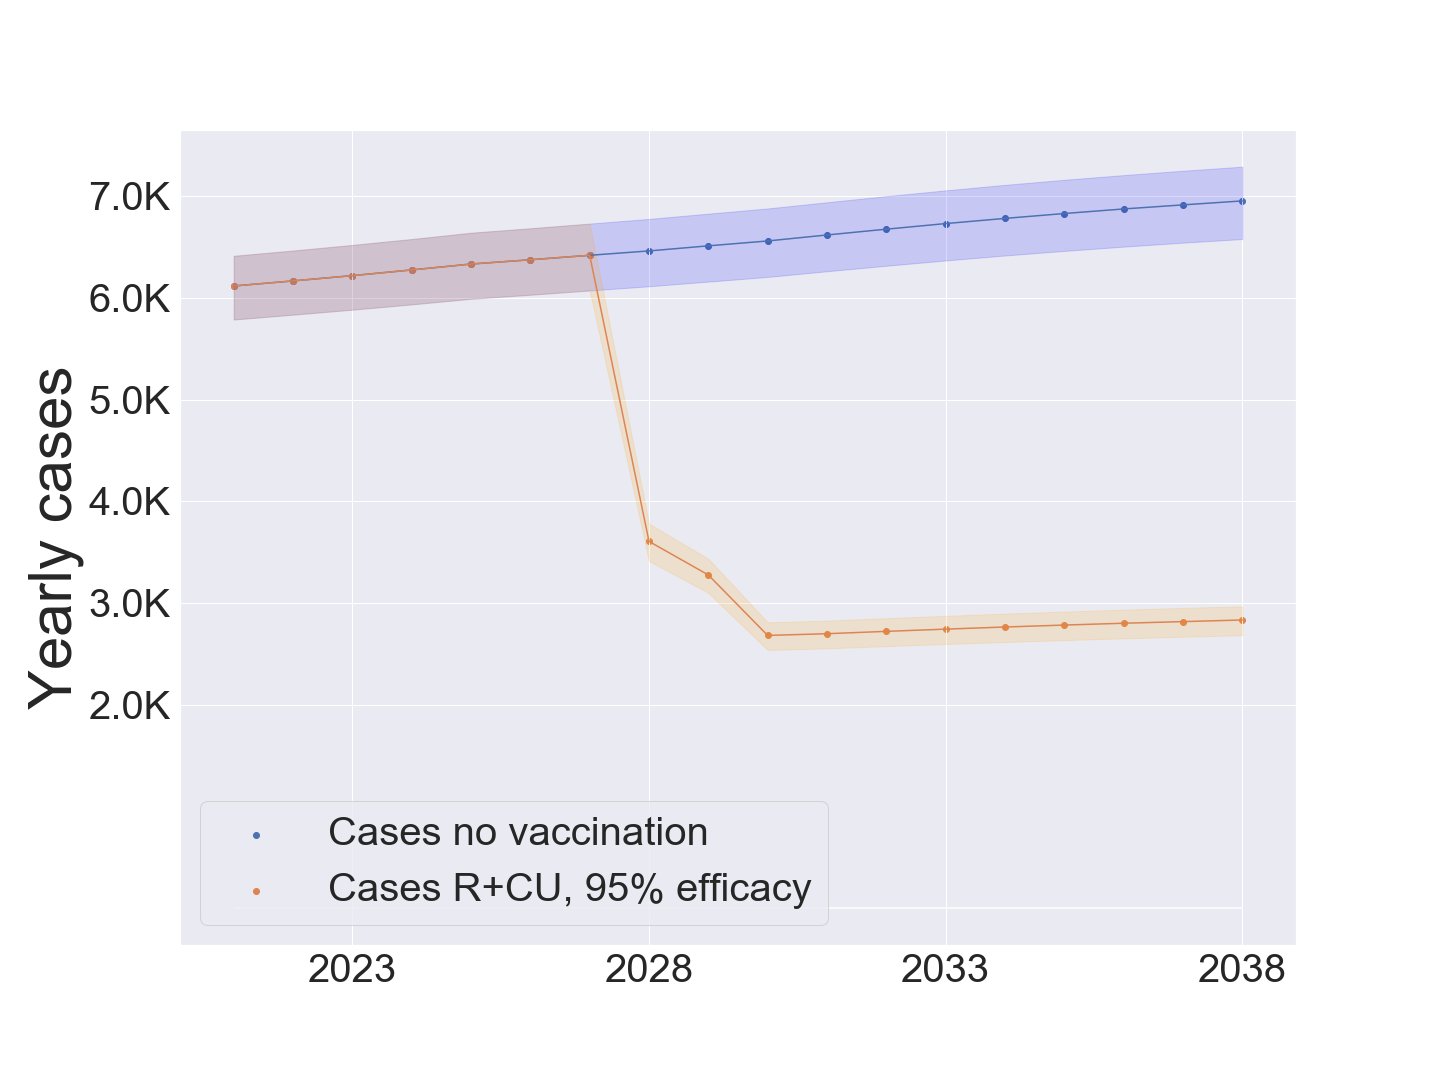
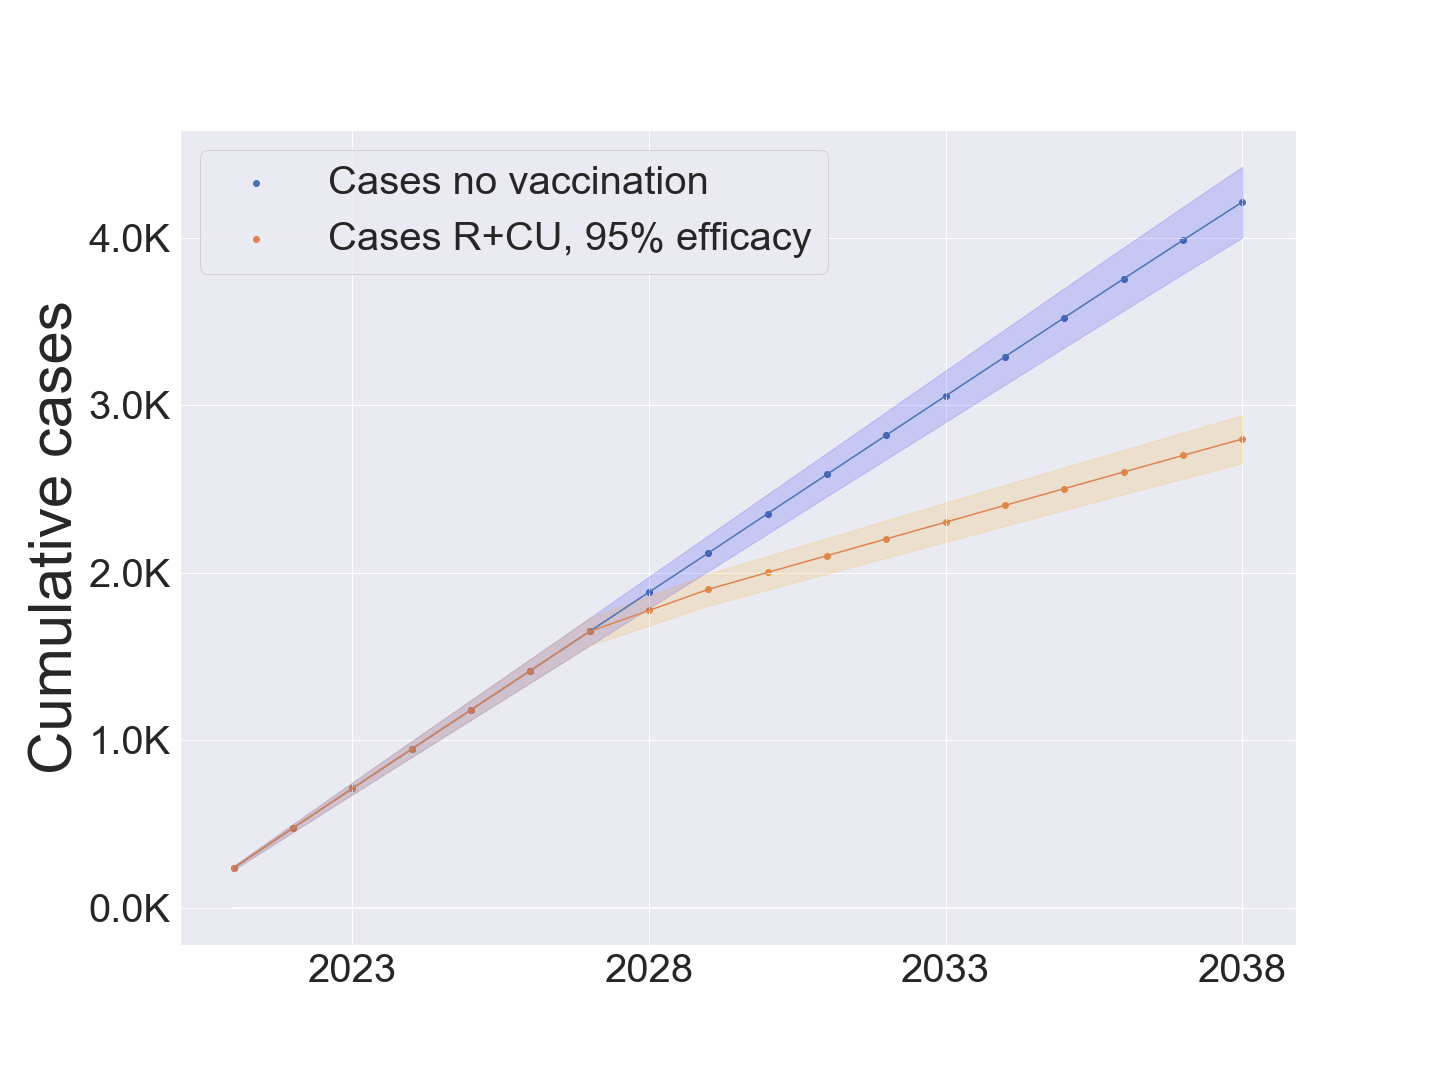
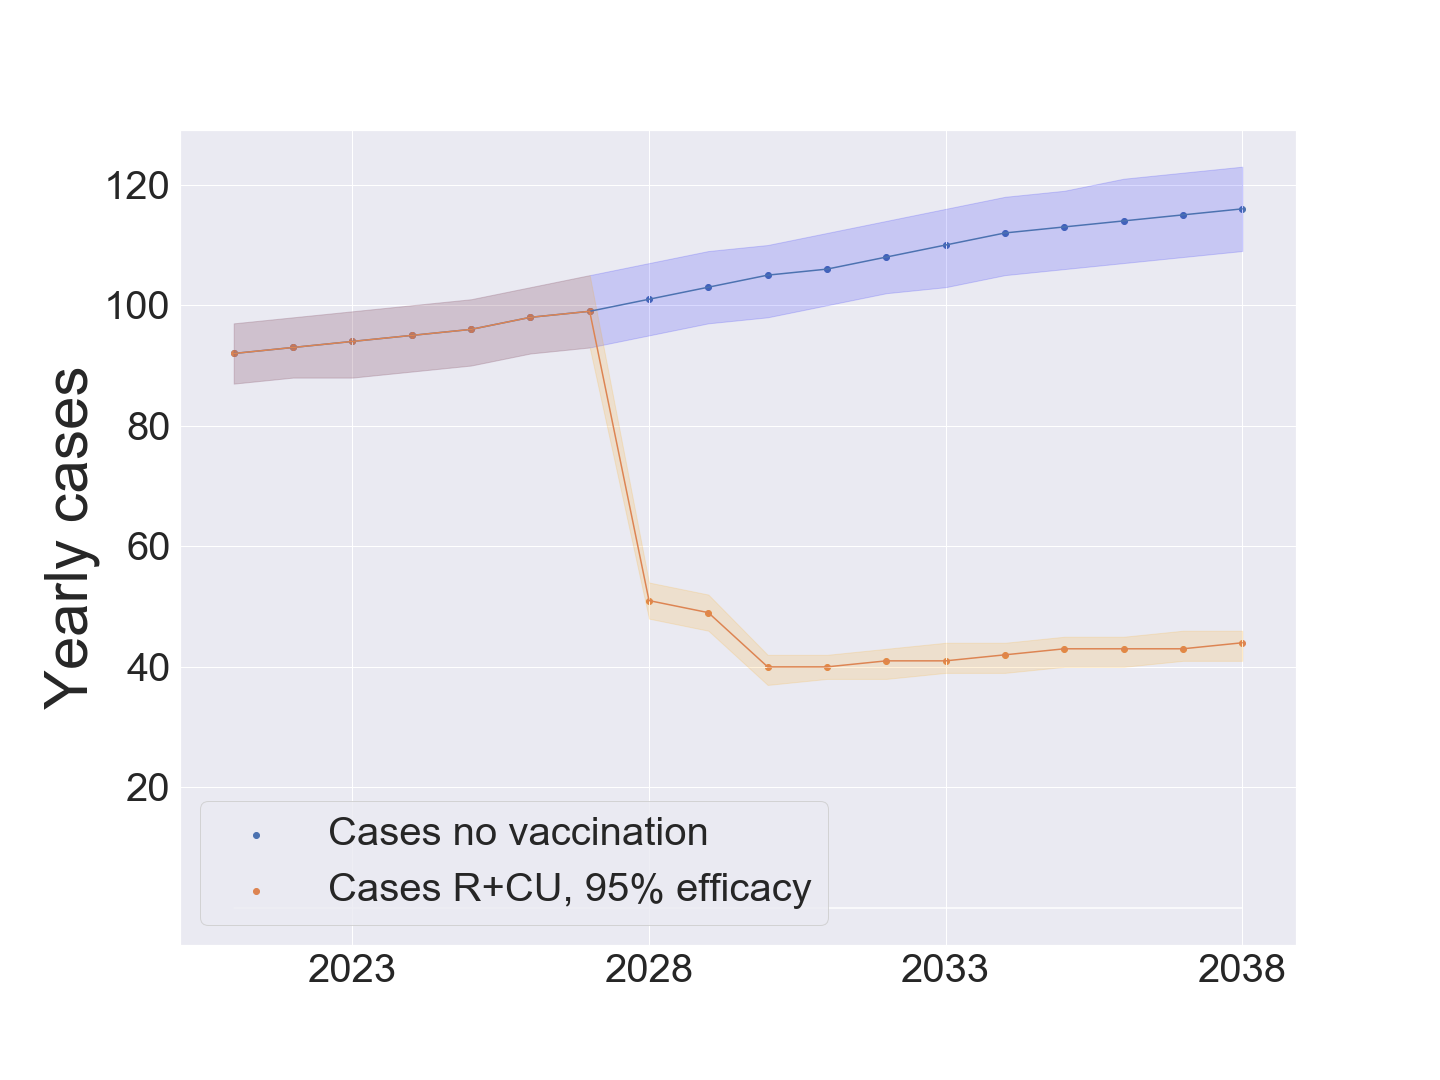
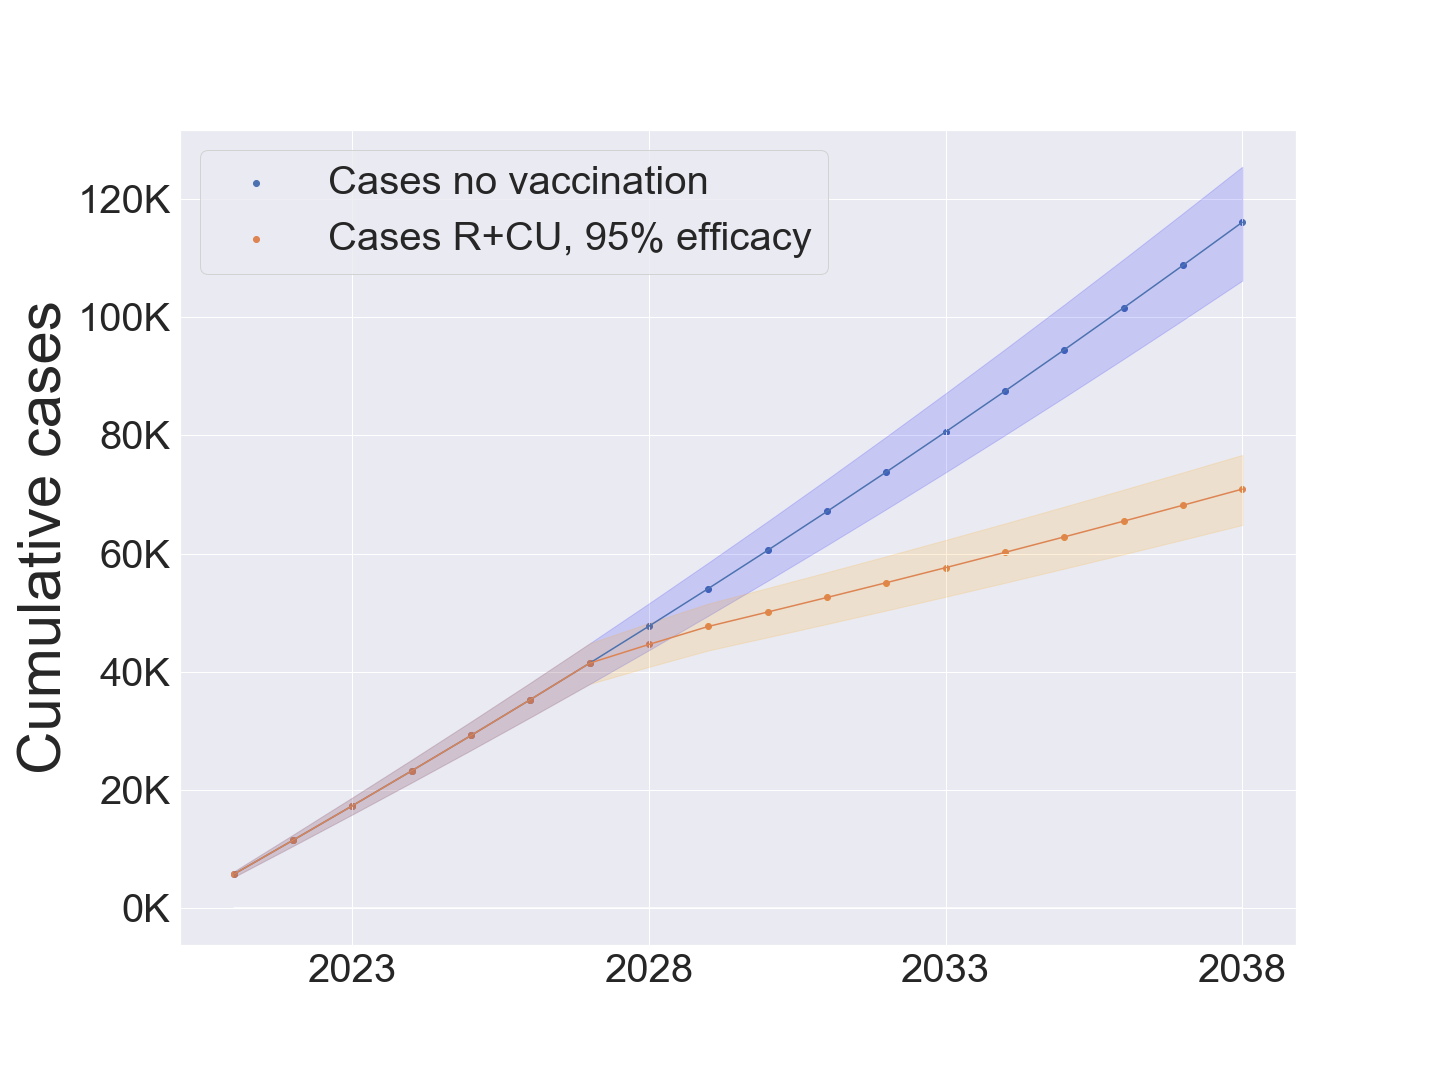
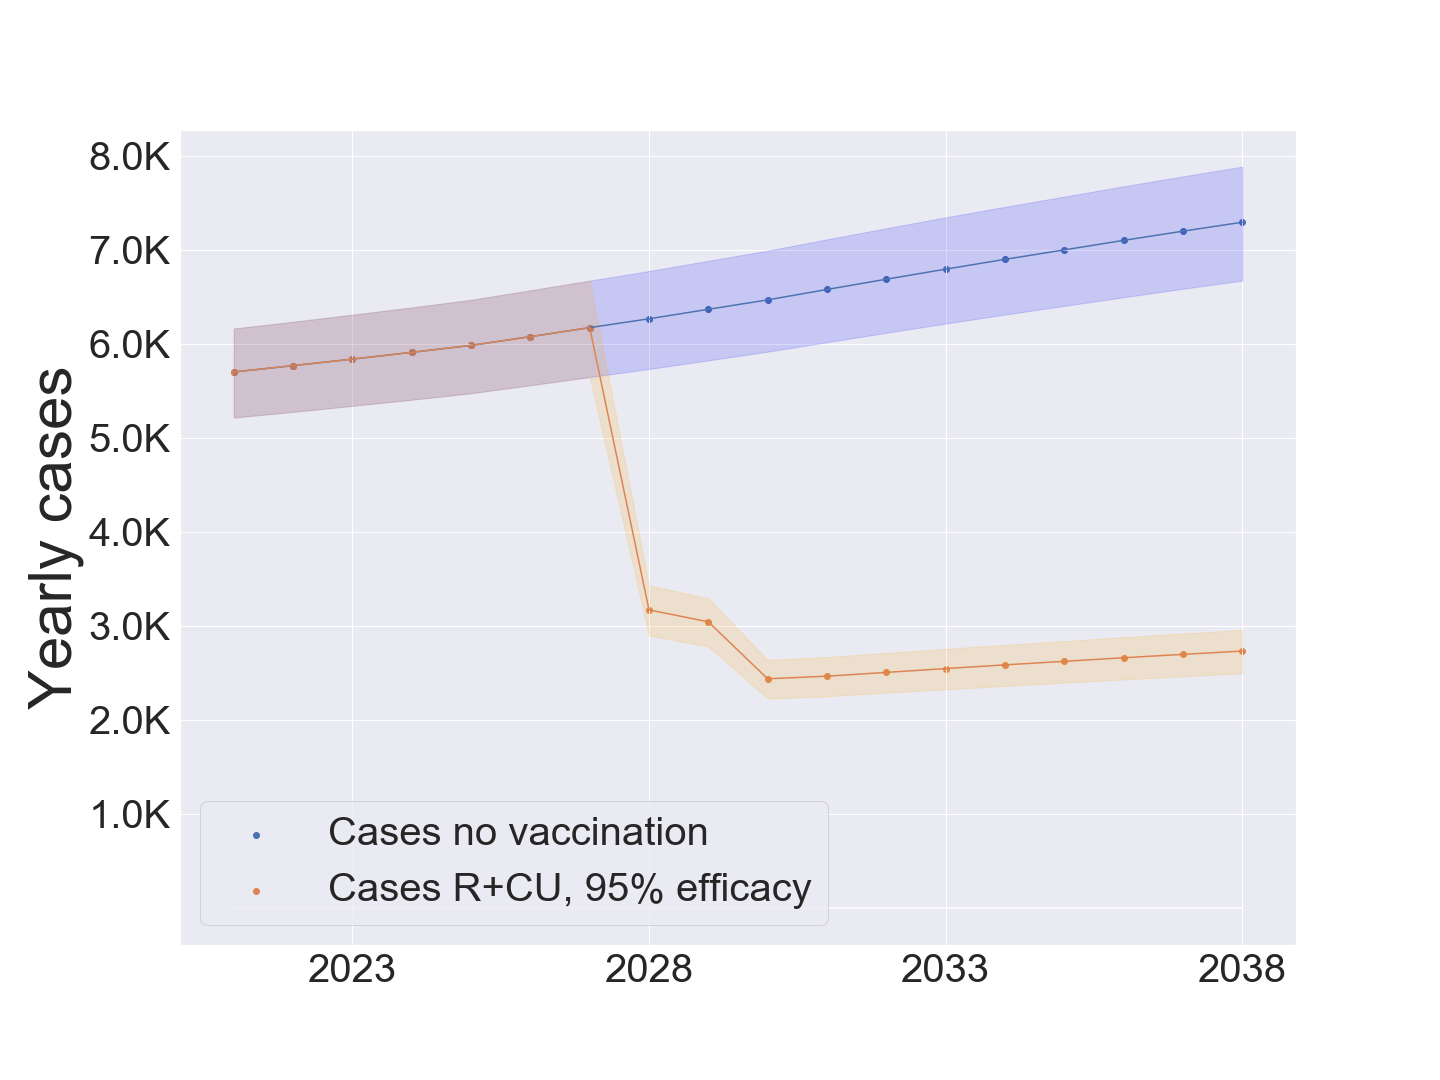
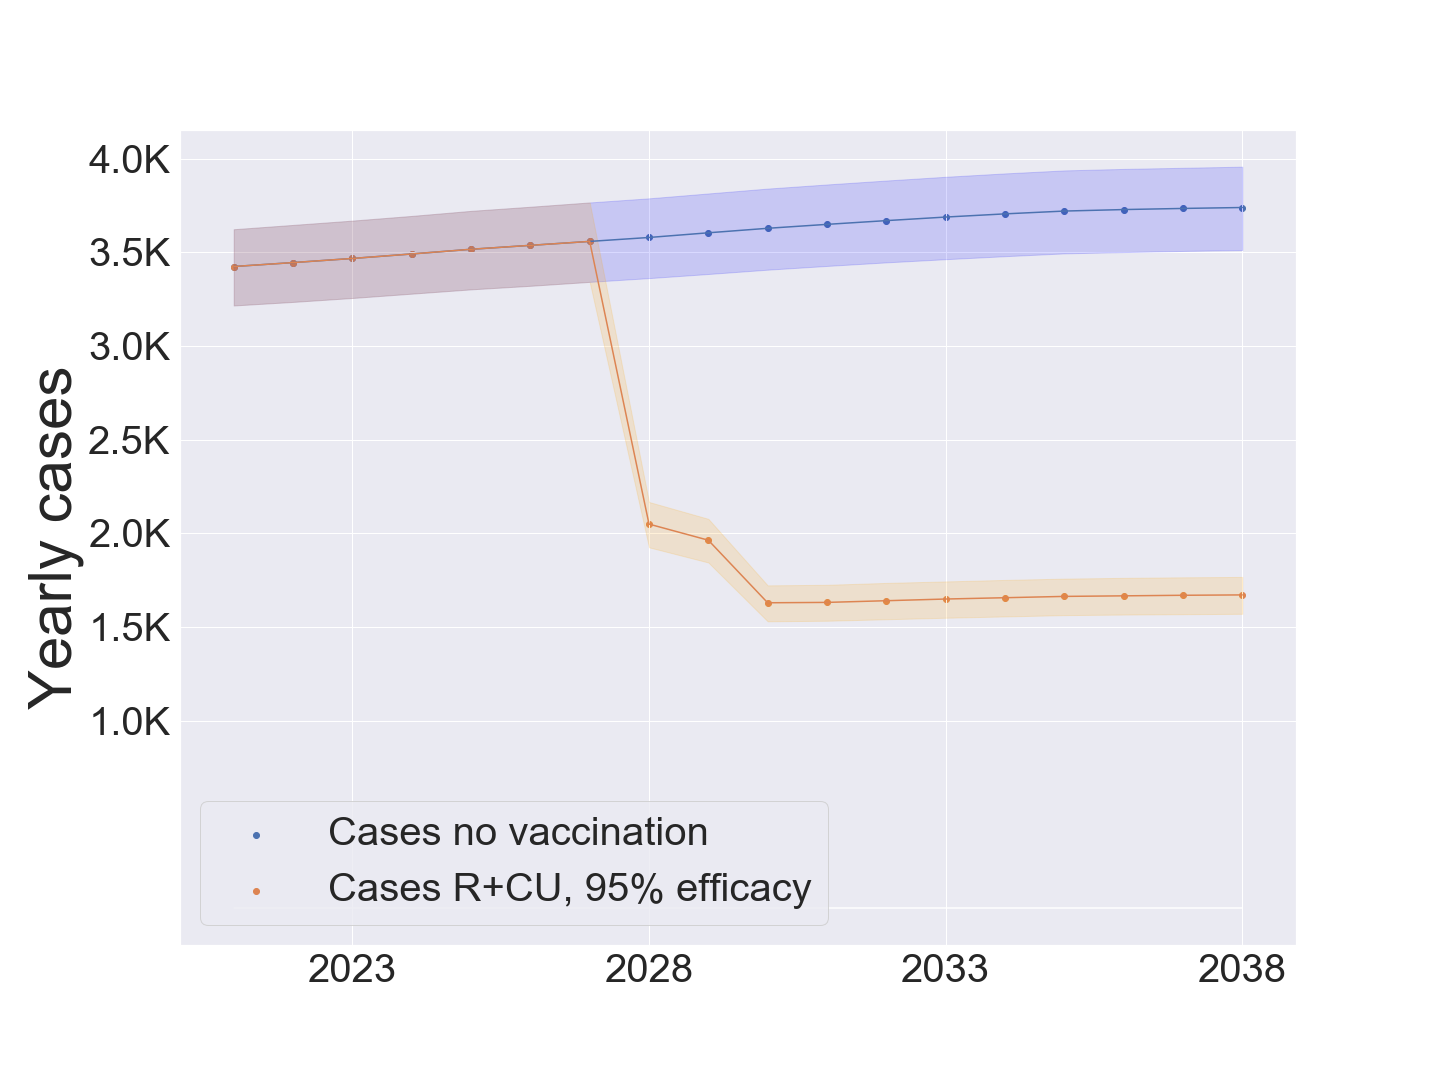
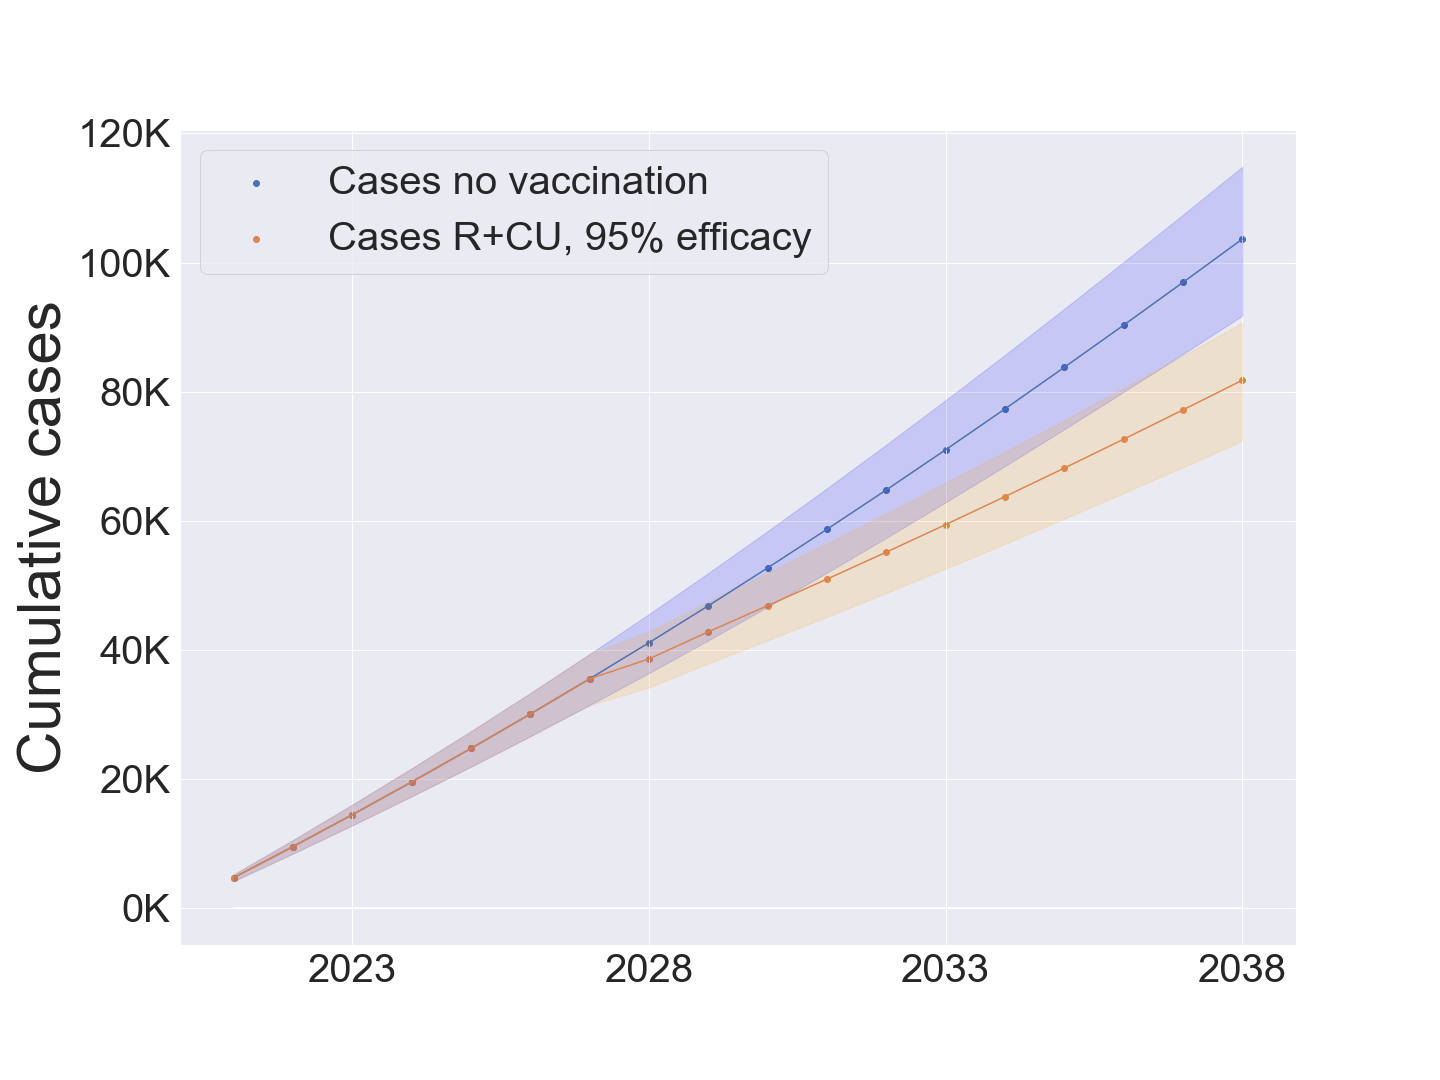
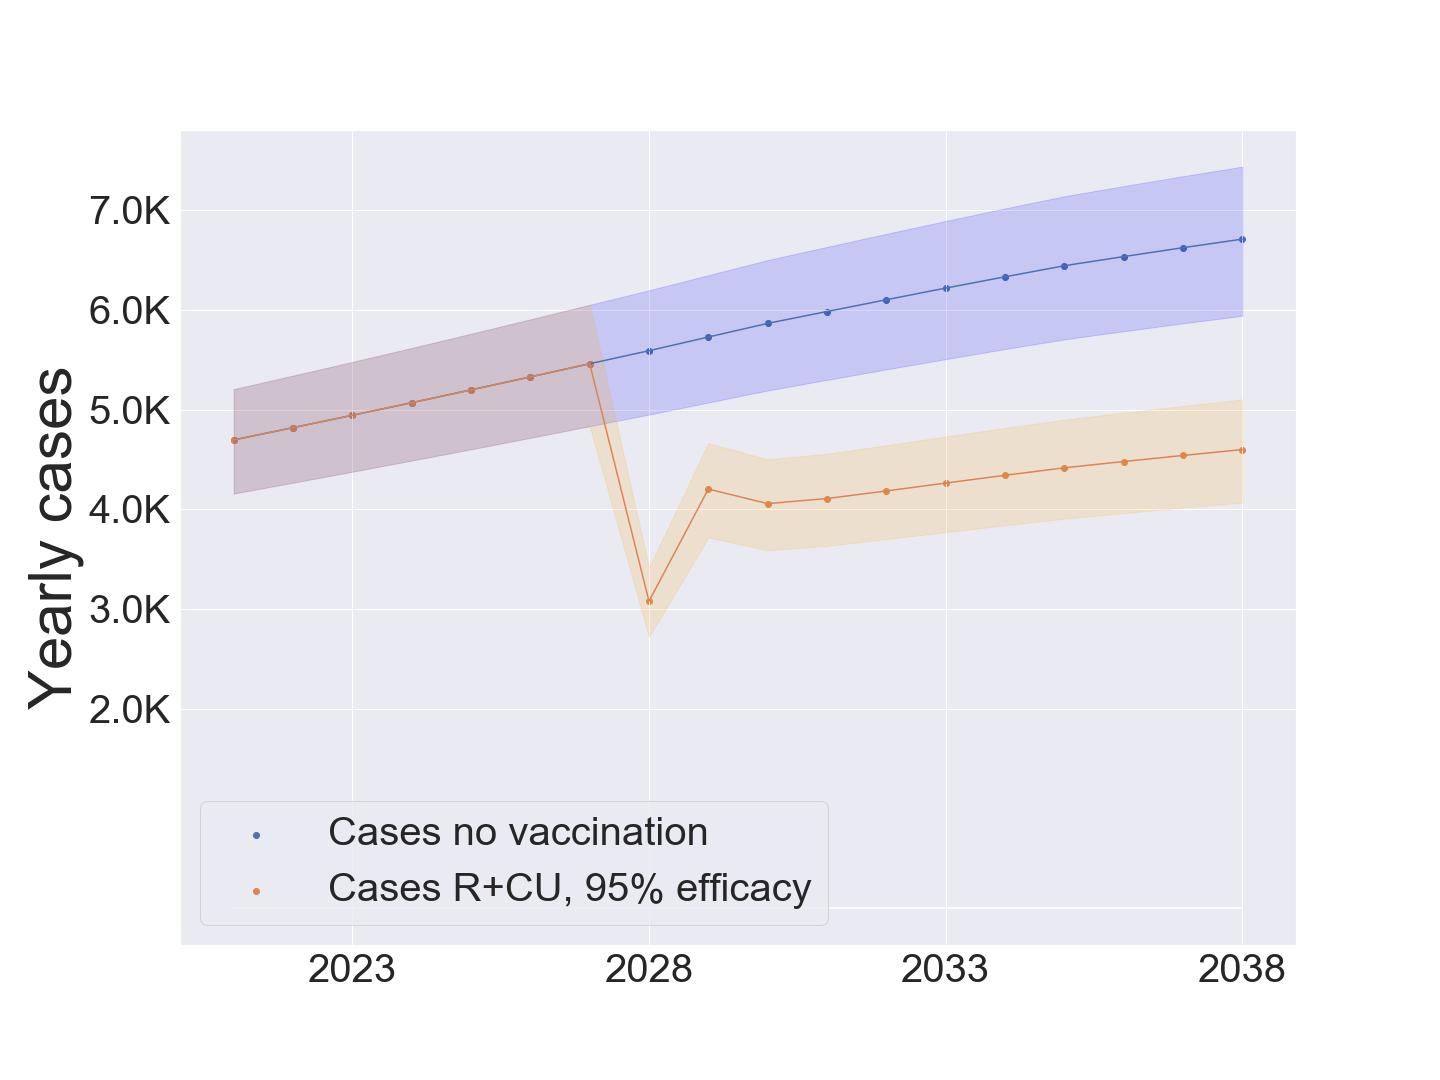
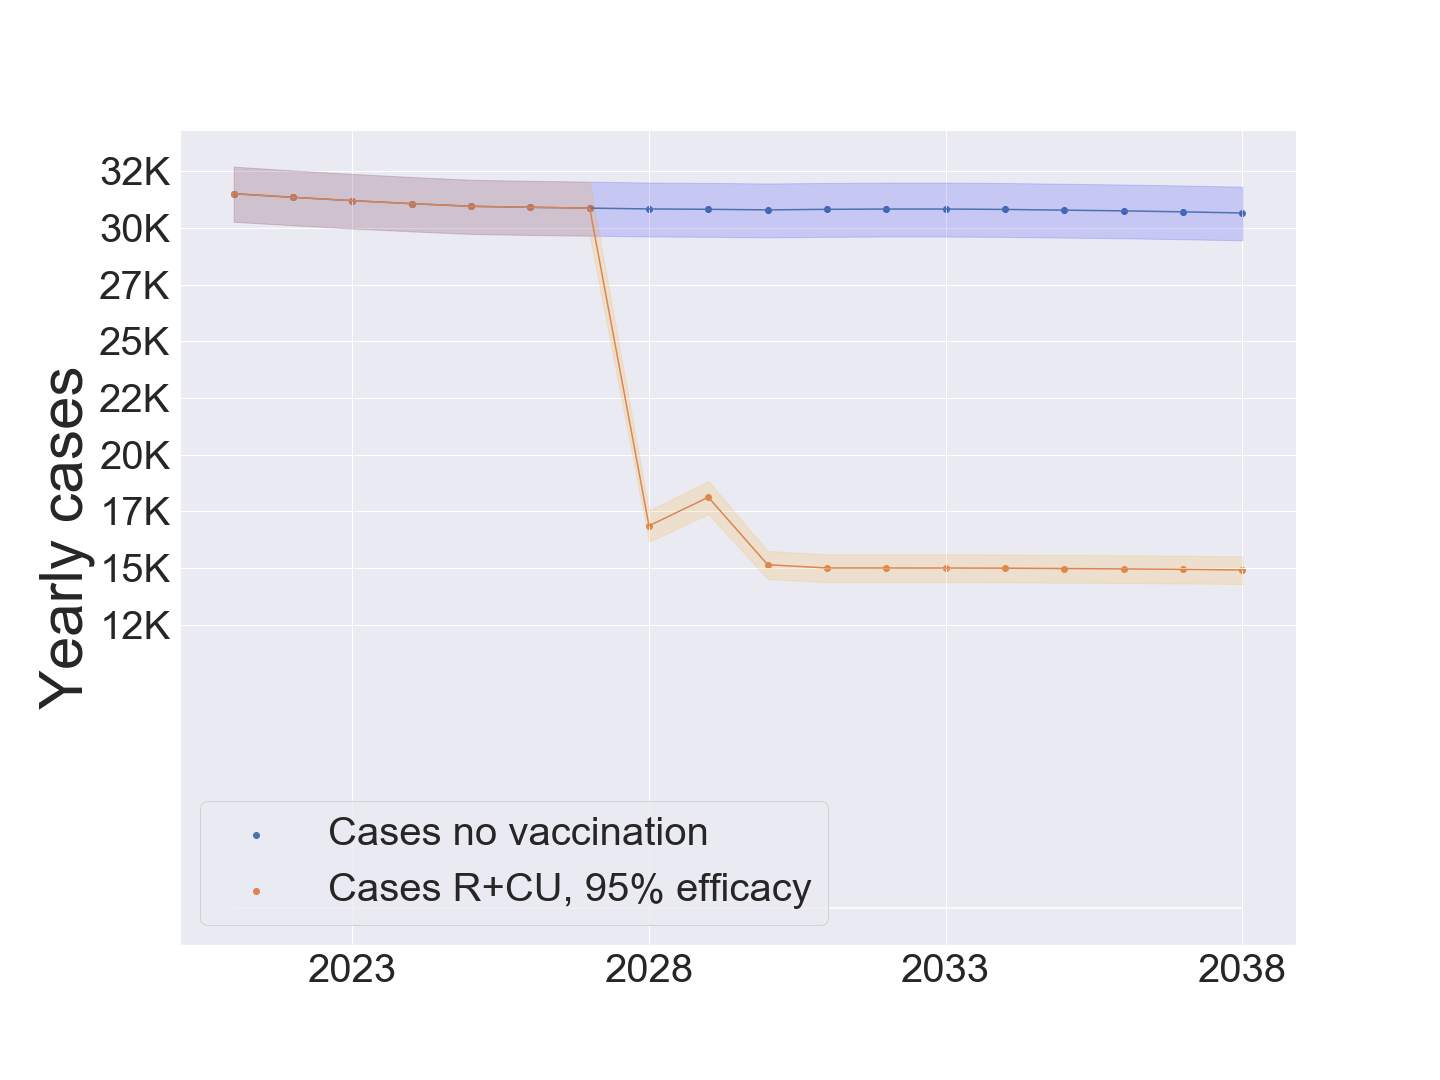
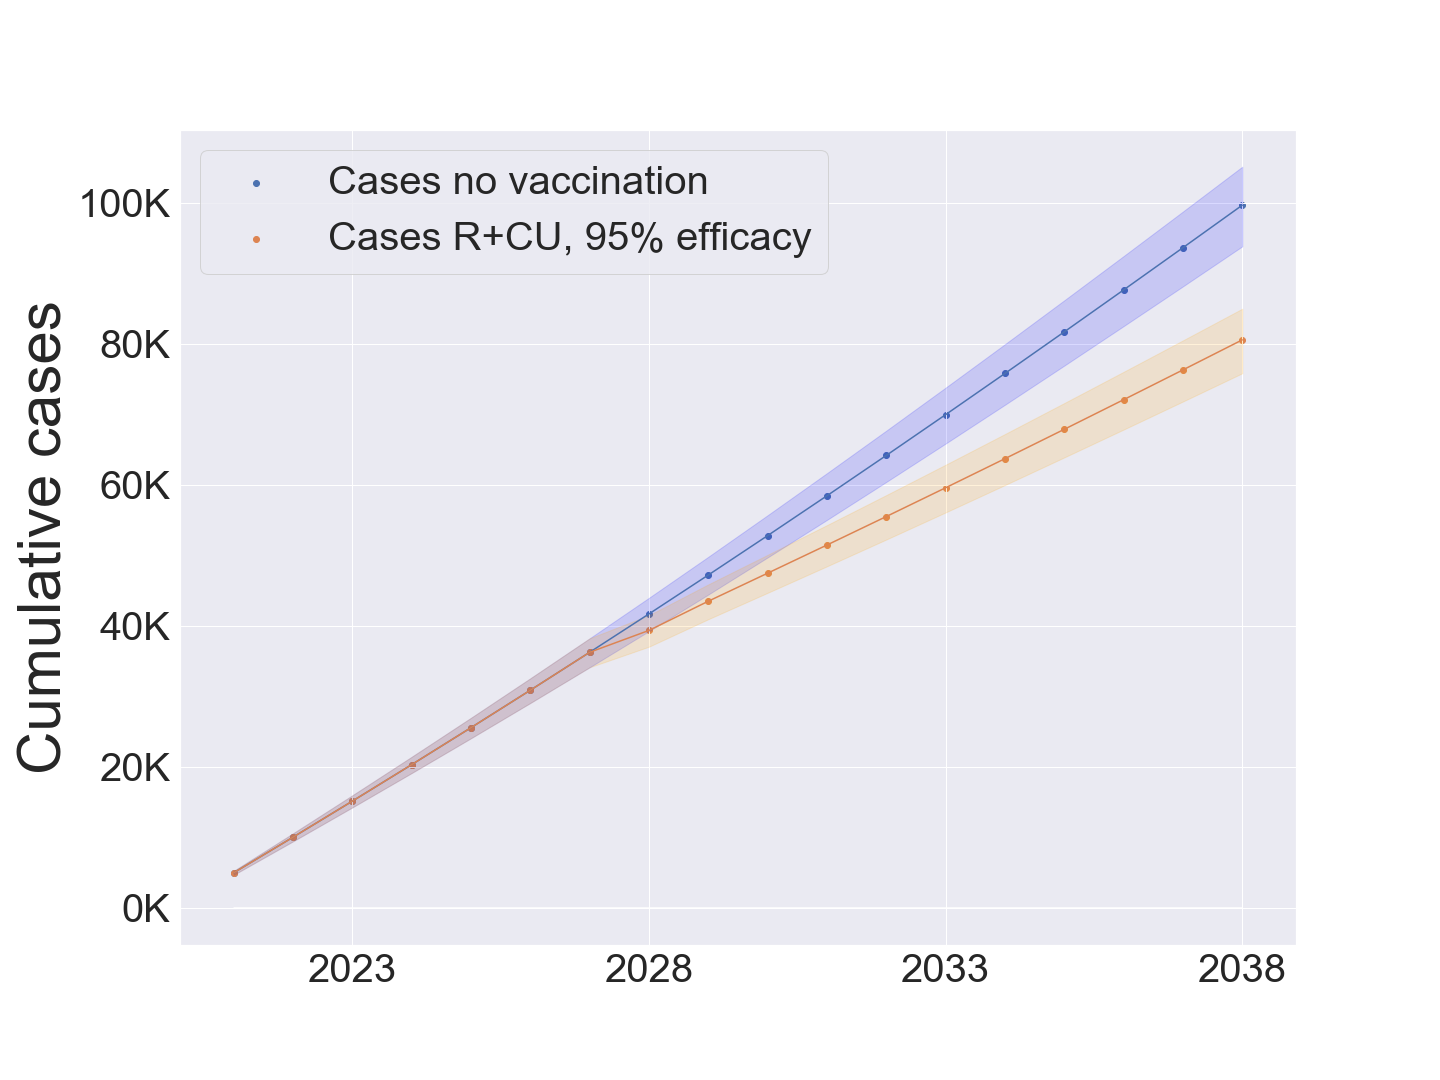
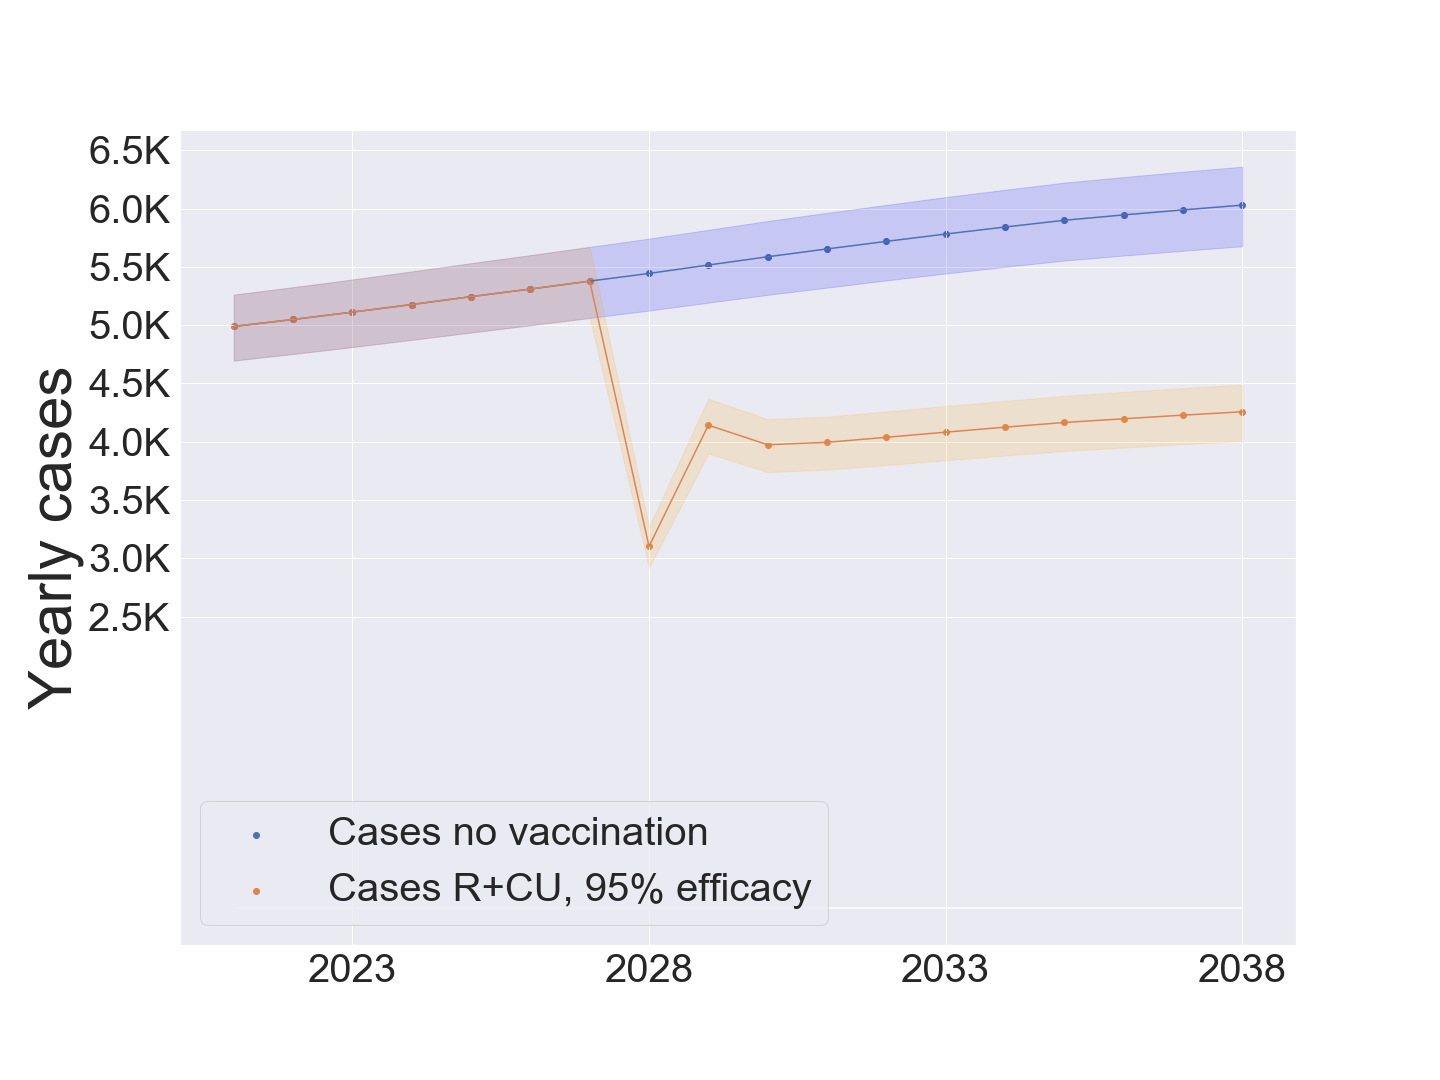
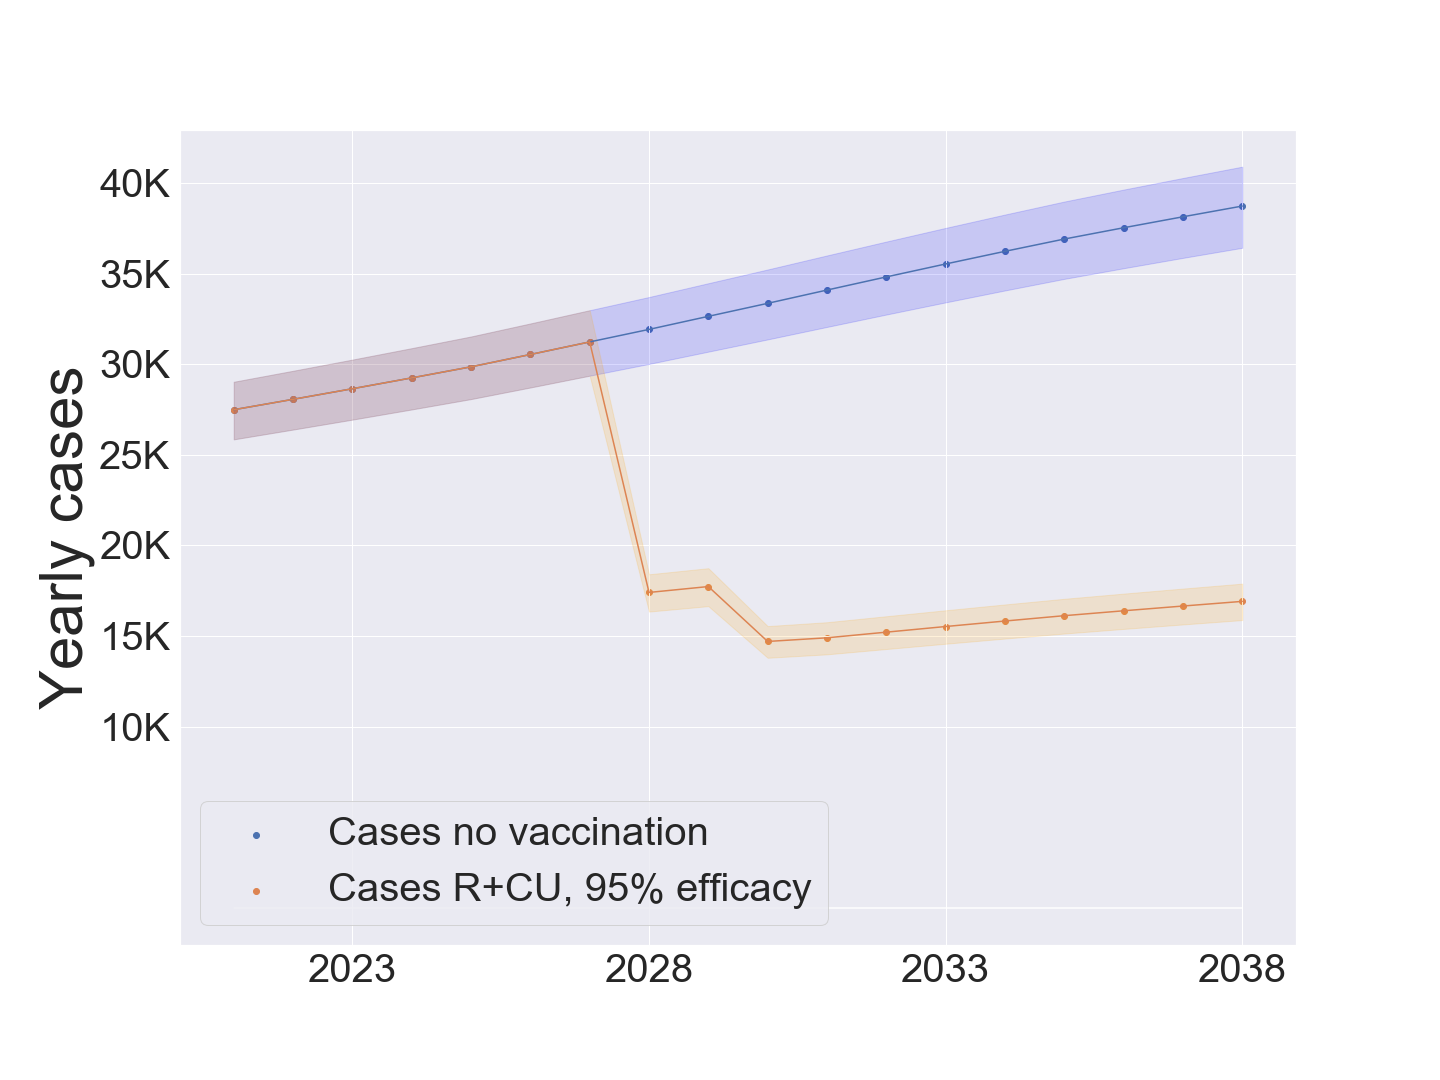
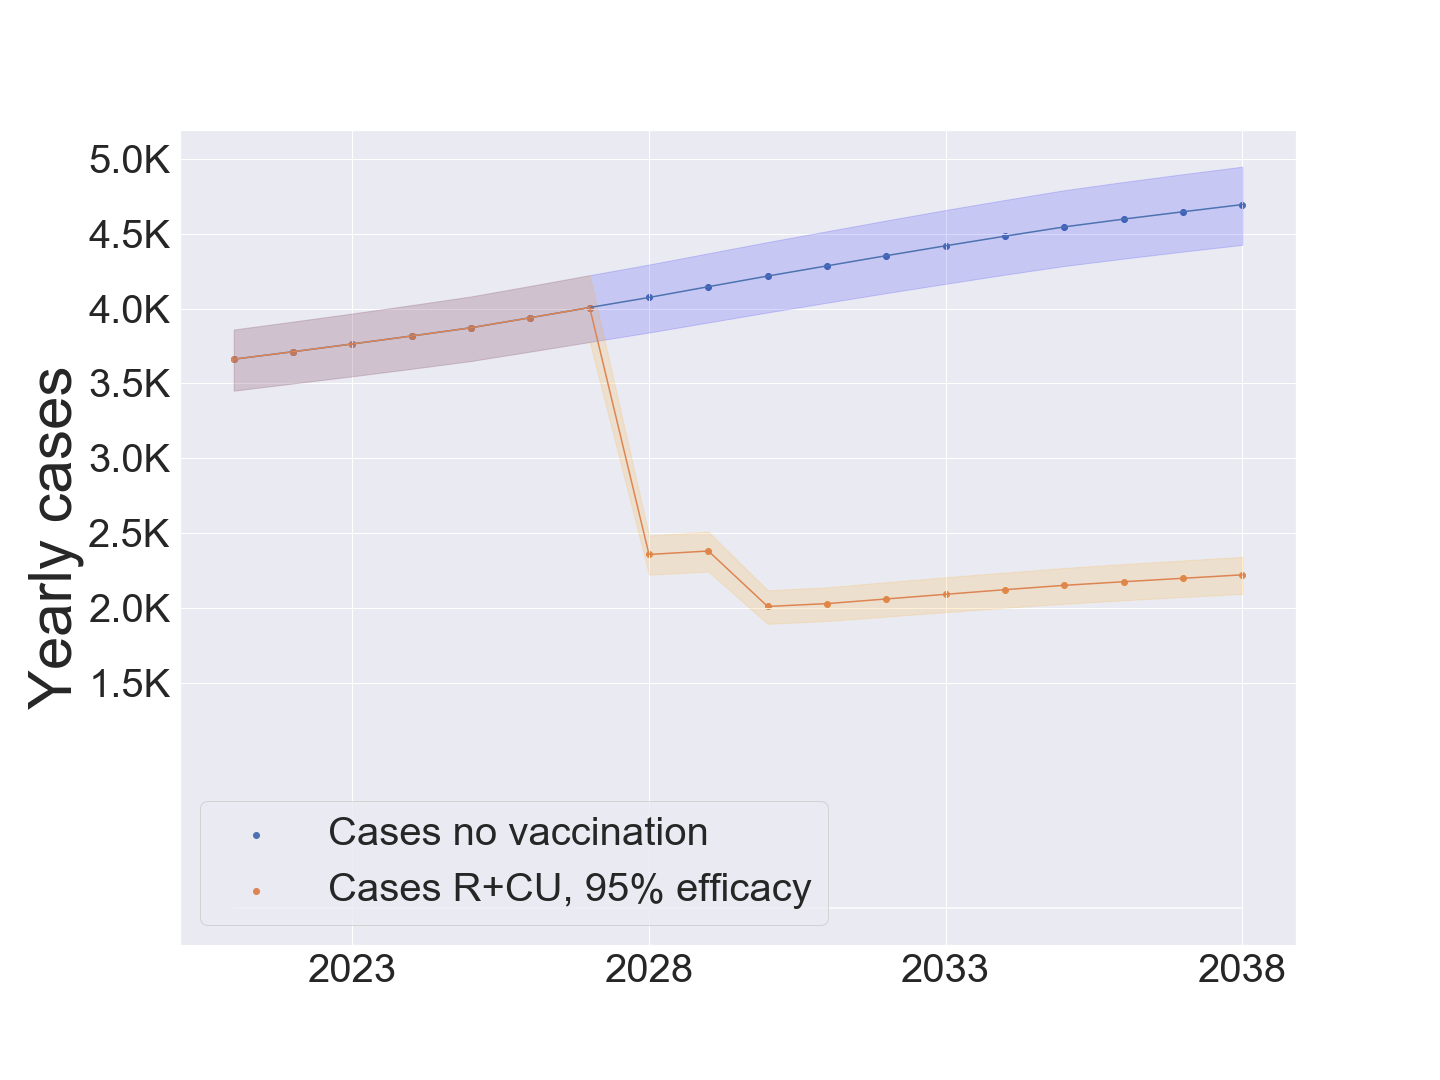
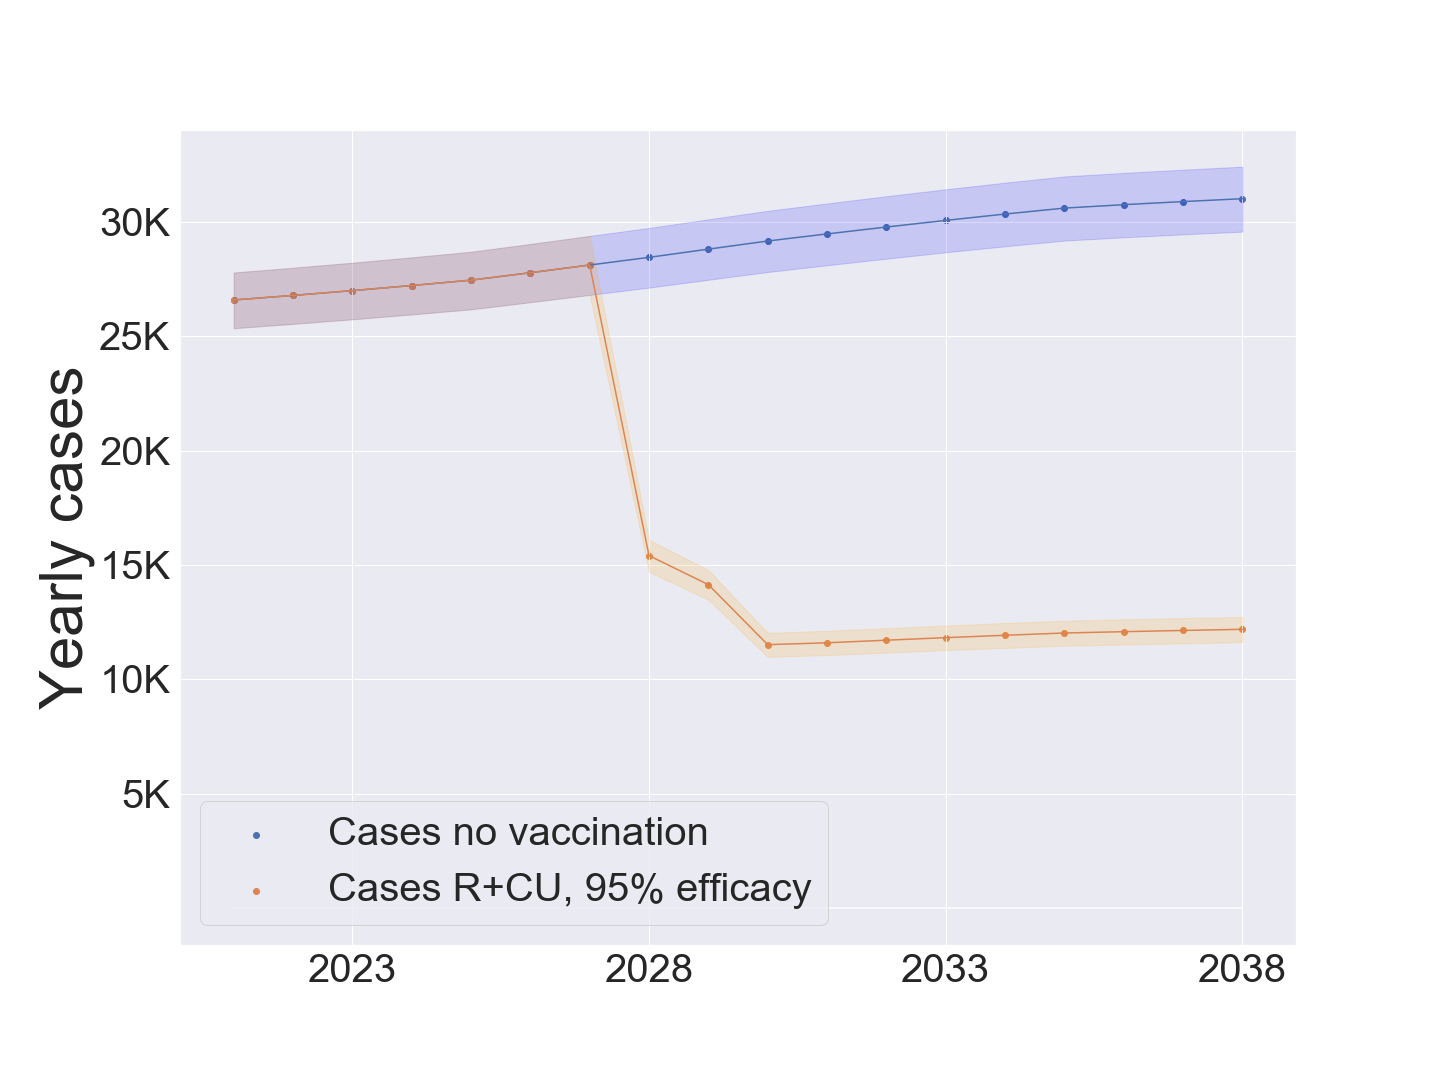
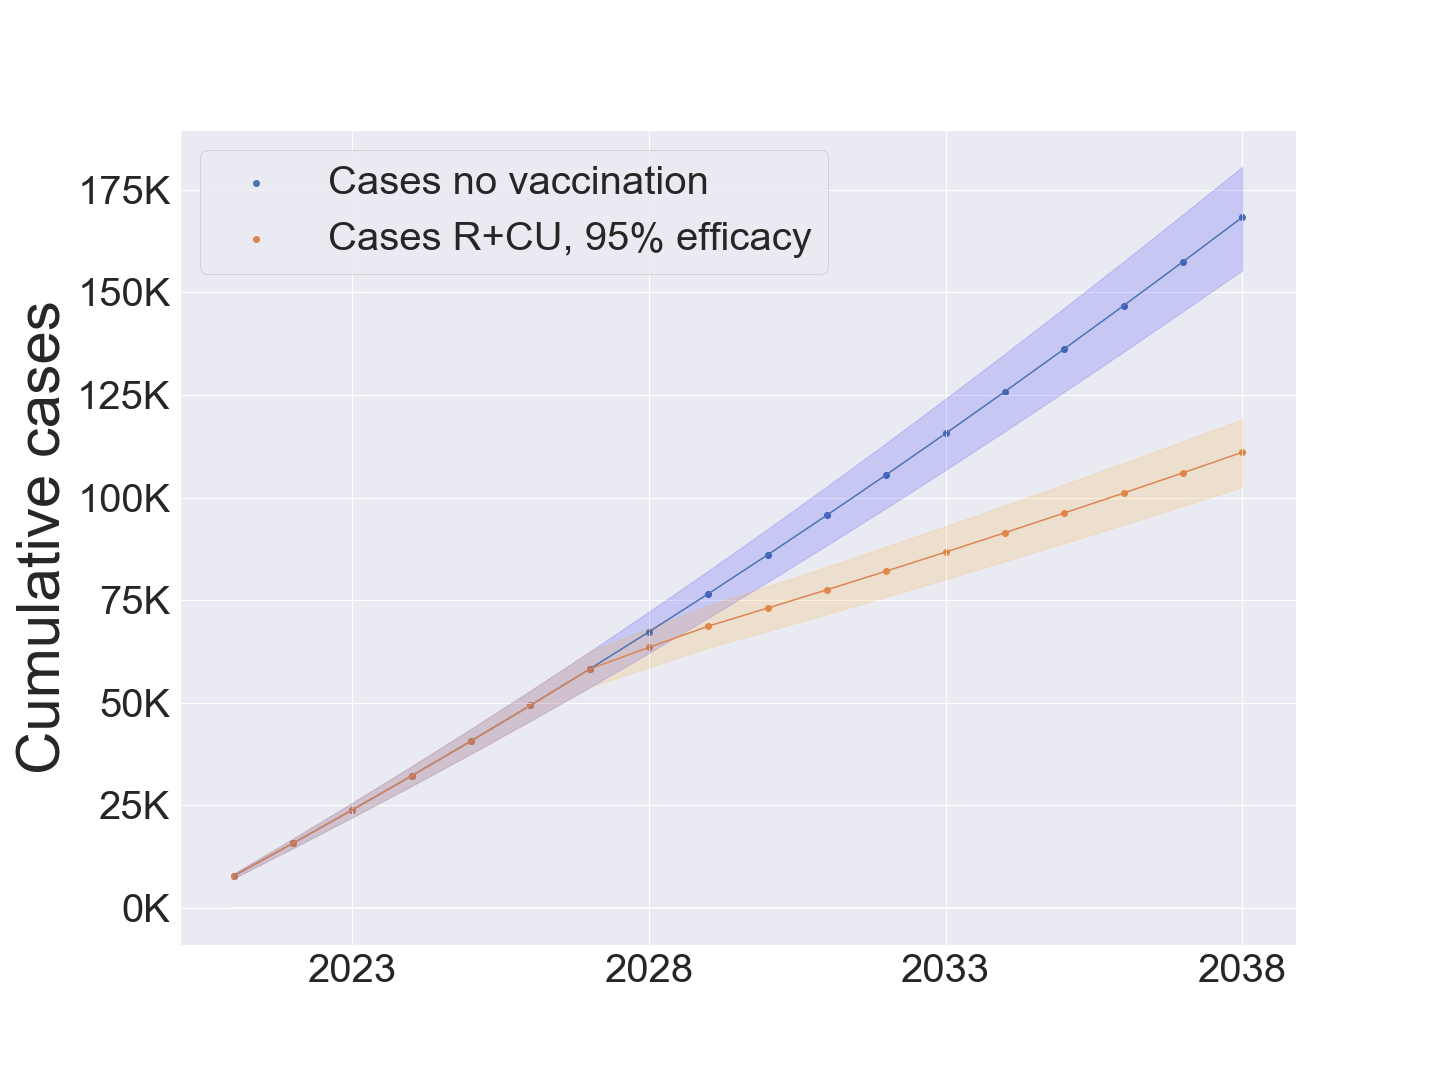
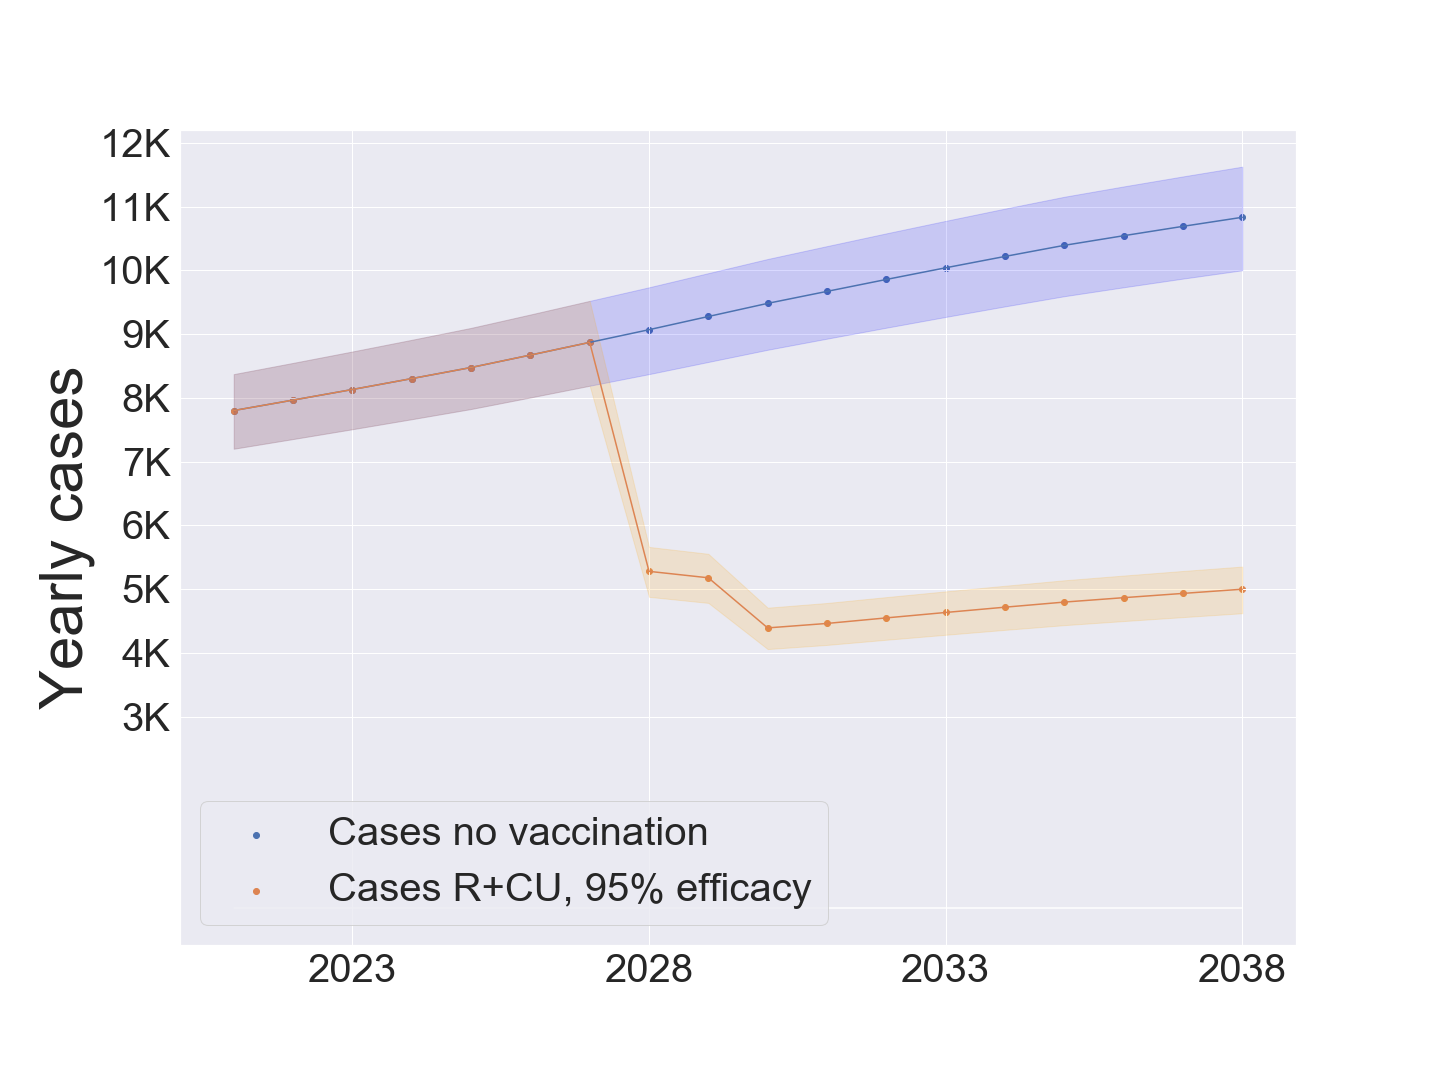
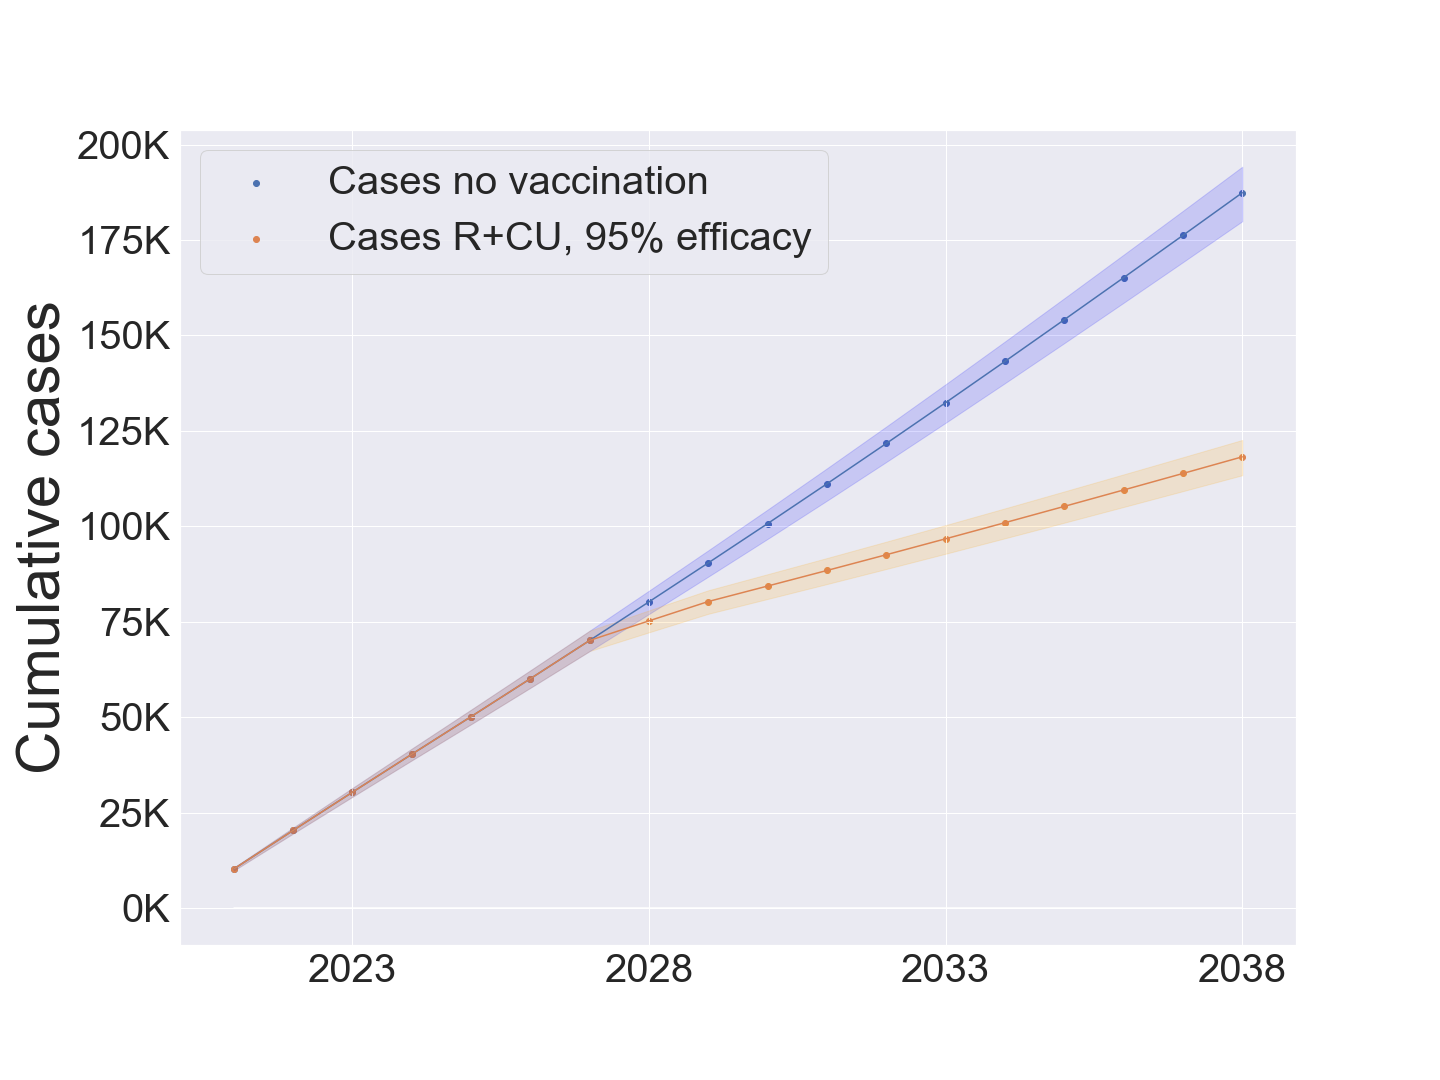
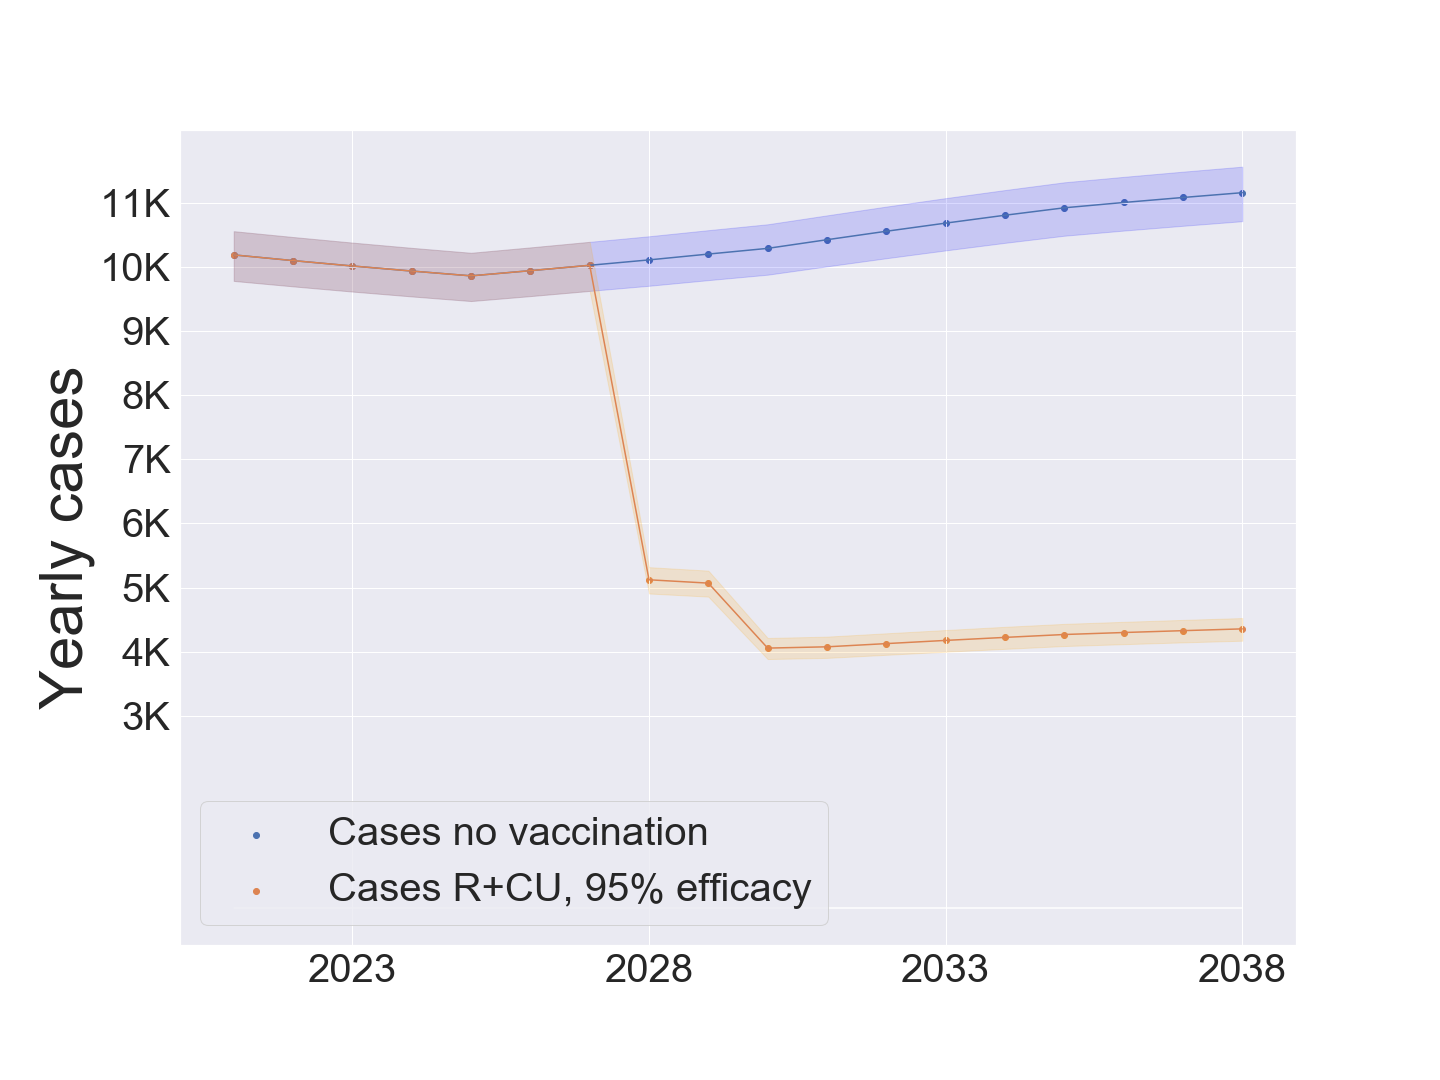
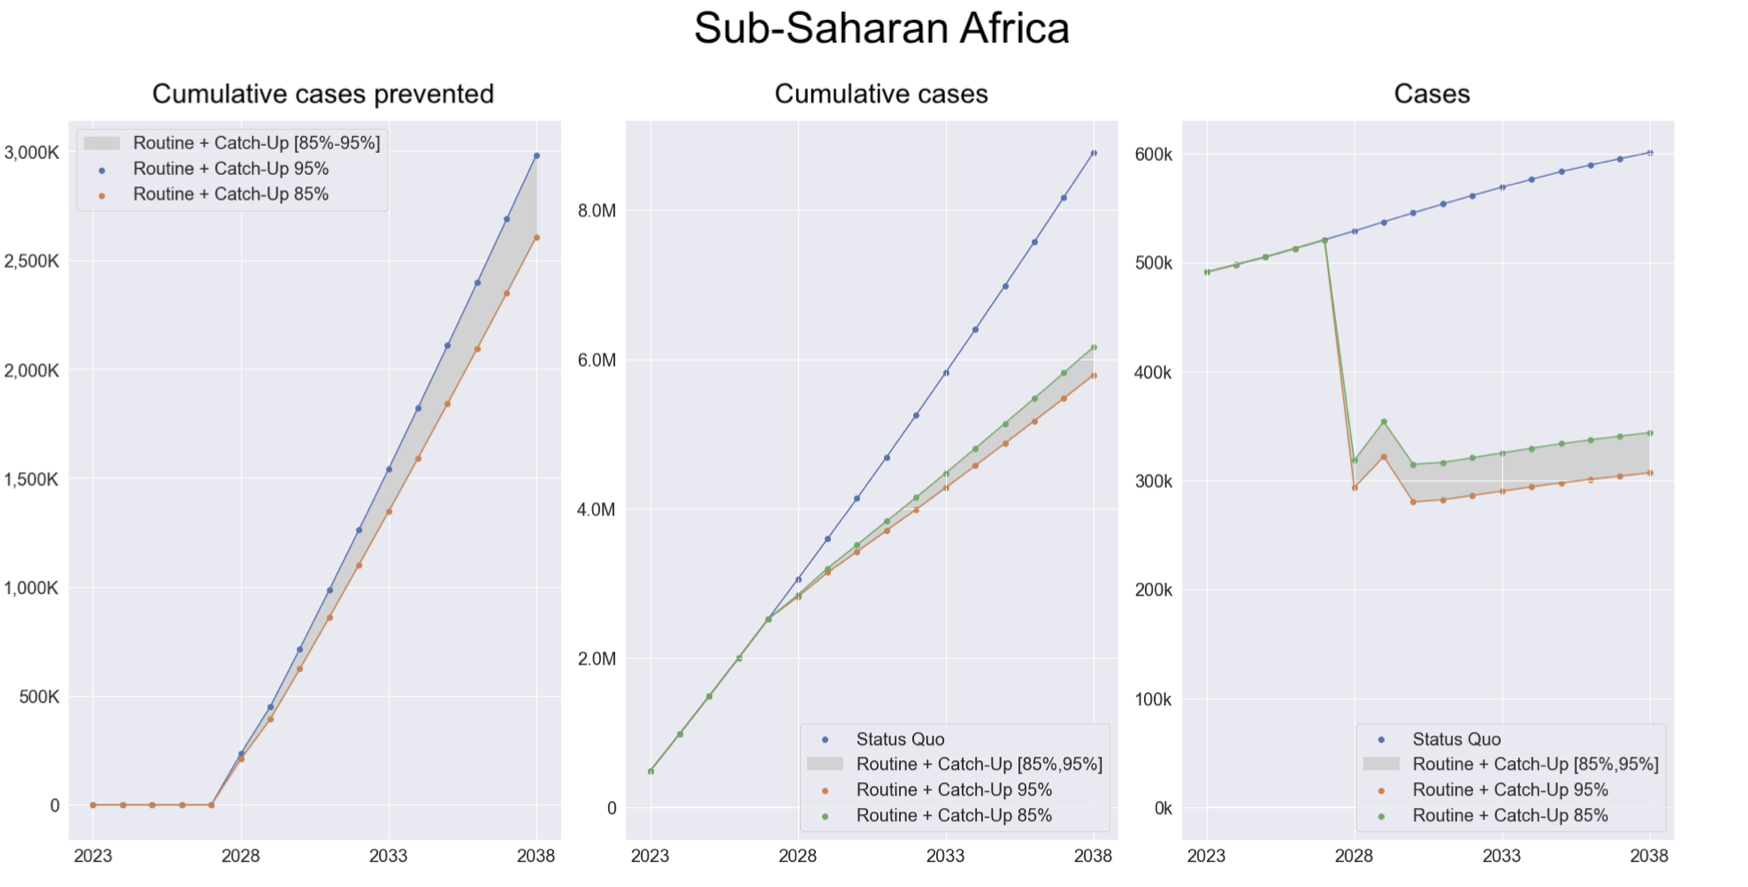
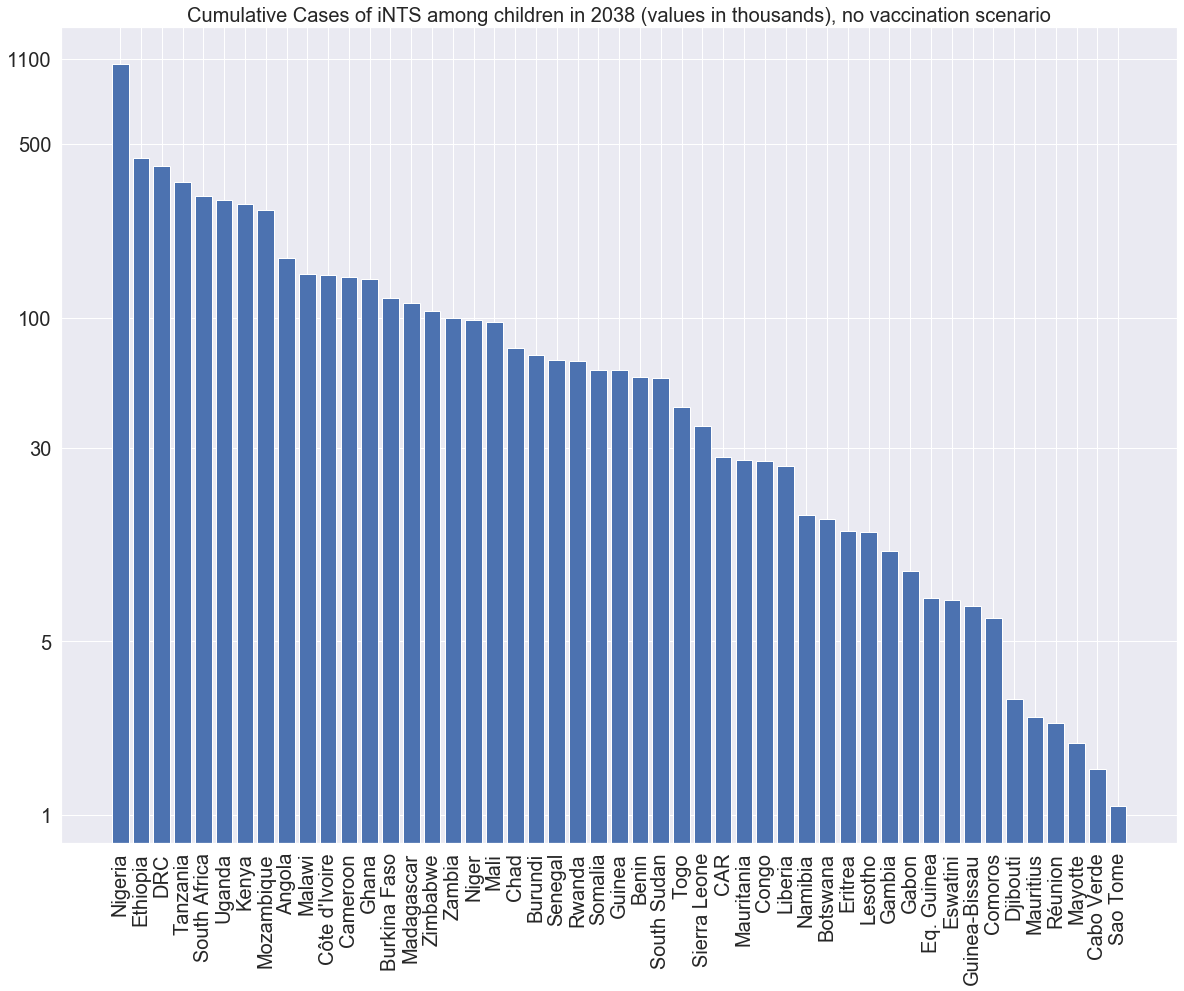
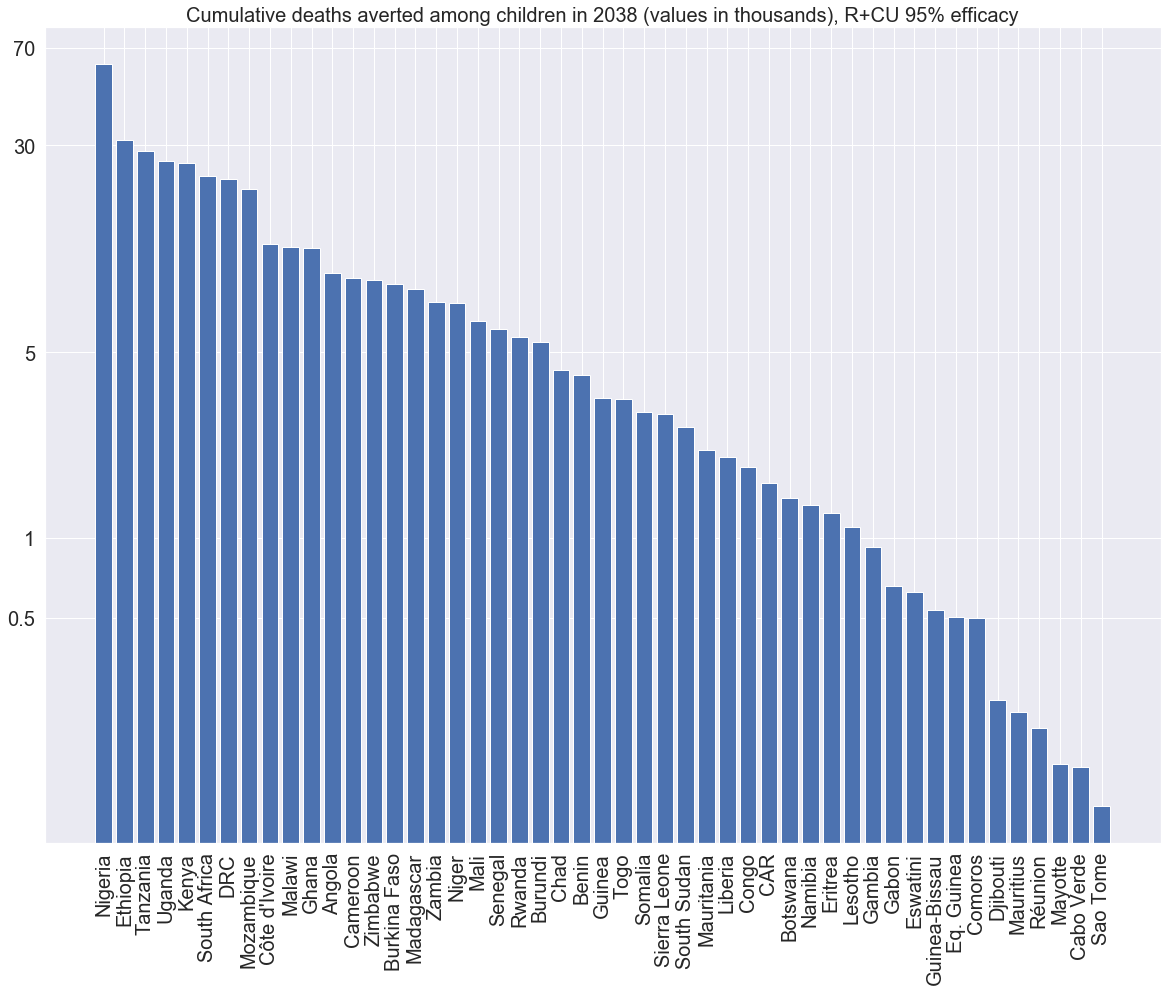
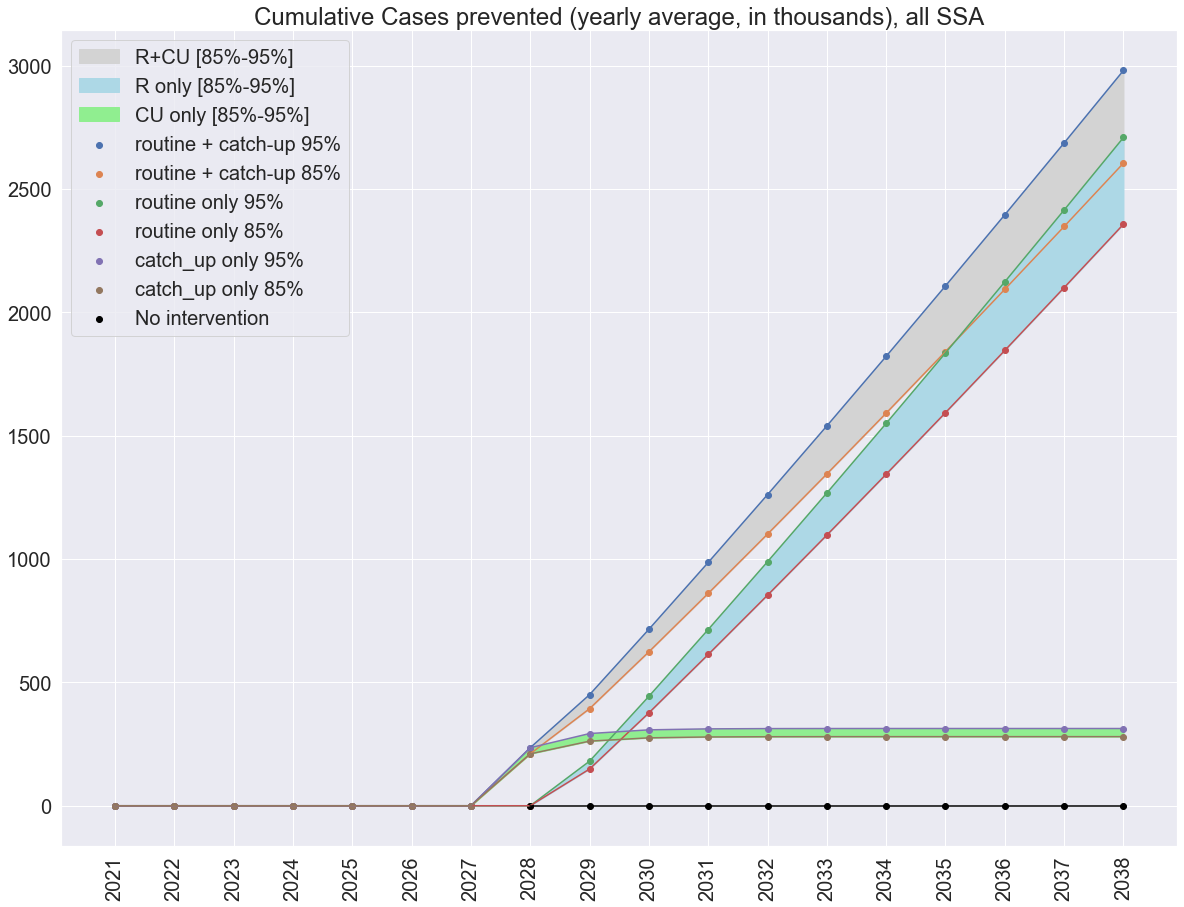
Our model estimates 478,000 iNTS cases for the year 2021 in all sSA, and under the status quo scenario the cumulated number of cases estimated from 2021 to 2038 is 9,733,000 (6,242,000 of which in the period 2028-2038). The 10 years Routine + Catch-Up (RCU) campaign between 2028 and 2038 could prevent between 2,605,000 and 2,981,000 cases when the vaccine efficacy is between 85 and 95 (Fig. Fig. 4 Cumulative cases prevented, cumulative cases and yearly cases for sSA. and Supplementary Fig. 9). This means that the model estimates a reduction of iNTS cases between 41.7 and 47.8 among children below 5 years old in all sSA. If we assume a CFR of the vaccine would avert between 391,000 and 447,000 deaths over the 10 years considered. Based on the model projections, the 10-year vaccination campaign would reduce the burden of the disease by 34,187,000-39,117,000 DALYs for all sSA (Table LABEL:dalys).
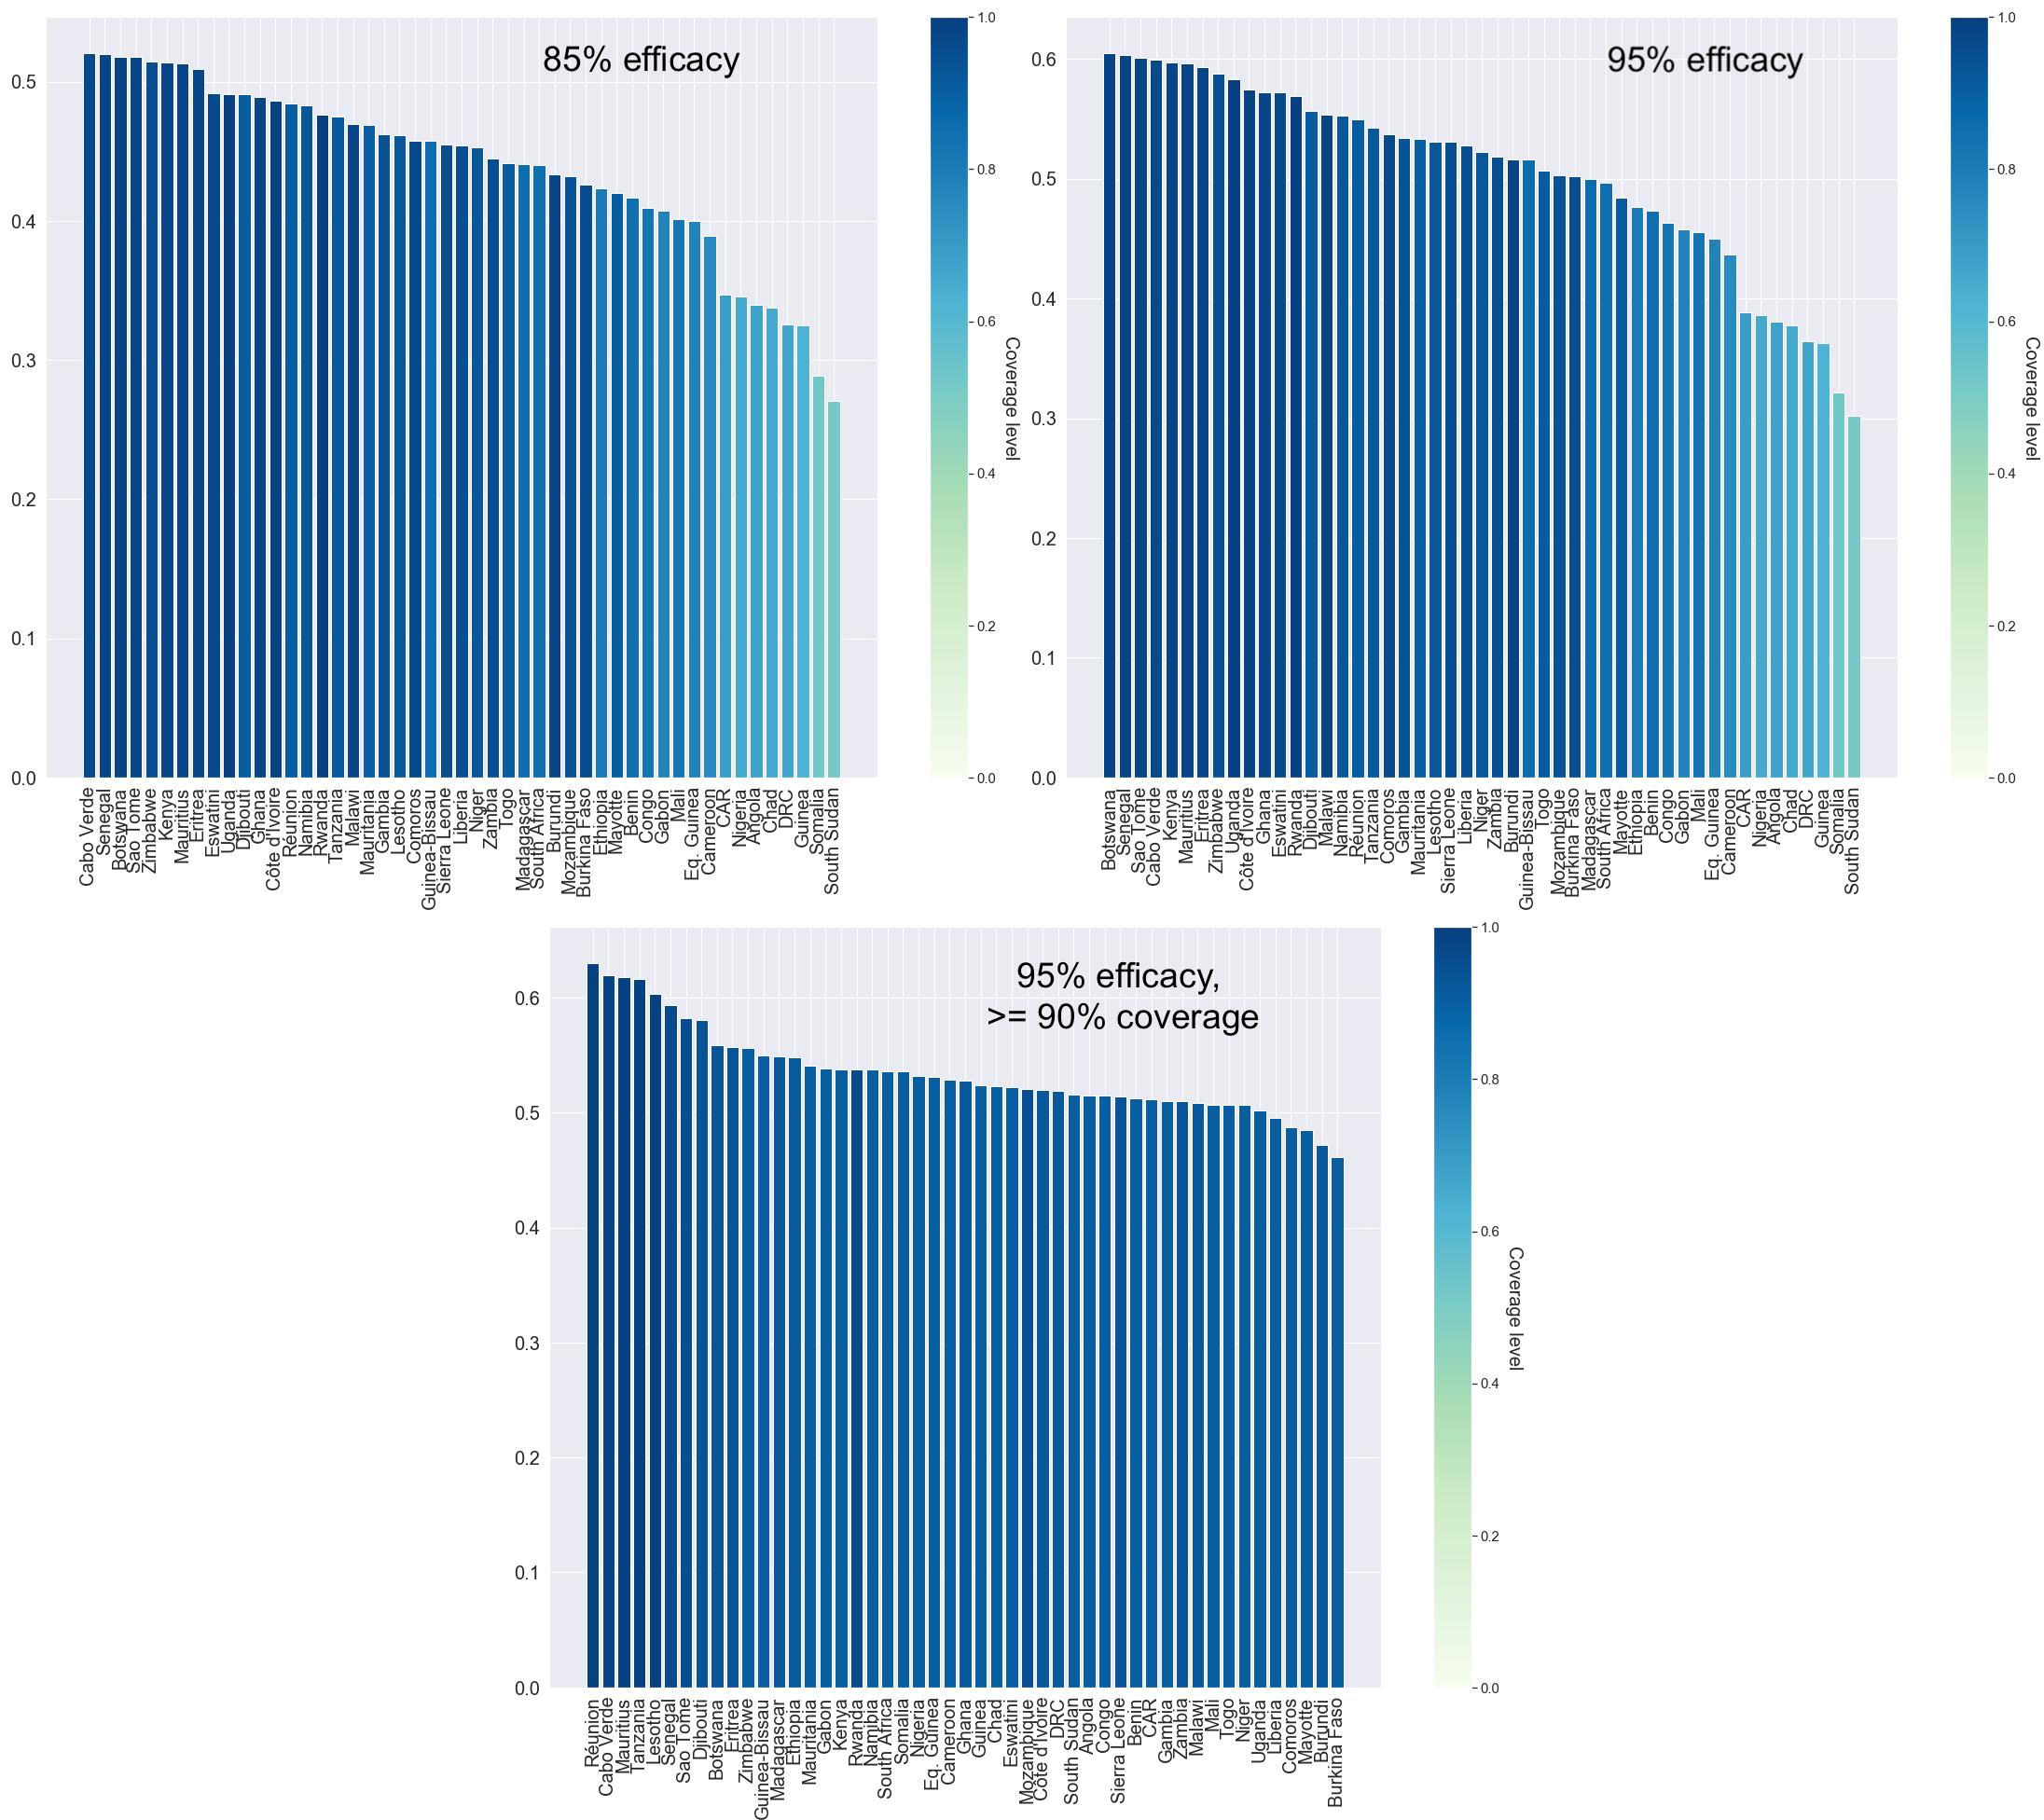
There are considerable differences in cases prevented across countries, due to their differences in the prevalence of comorbidities among children below 5 years old and EPI vaccination coverage levels (Fig. Fig. 1 Vaccine efficacy as percentage of prevented infections per country and Supplementary Figs. 4-8). For countries where EPI coverage levels are below , the reduction in iNTS cases reaches at most - ( and efficacy respectively). For countries that have a coverage at least of , the model predicts that the reduction in cases can go above - ( and efficacy respectively). Countries where the prevalence of comorbidities is higher (especially Malaria among children) present smaller reduction in cases given their coverage levels (Supplementary Fig. 8).
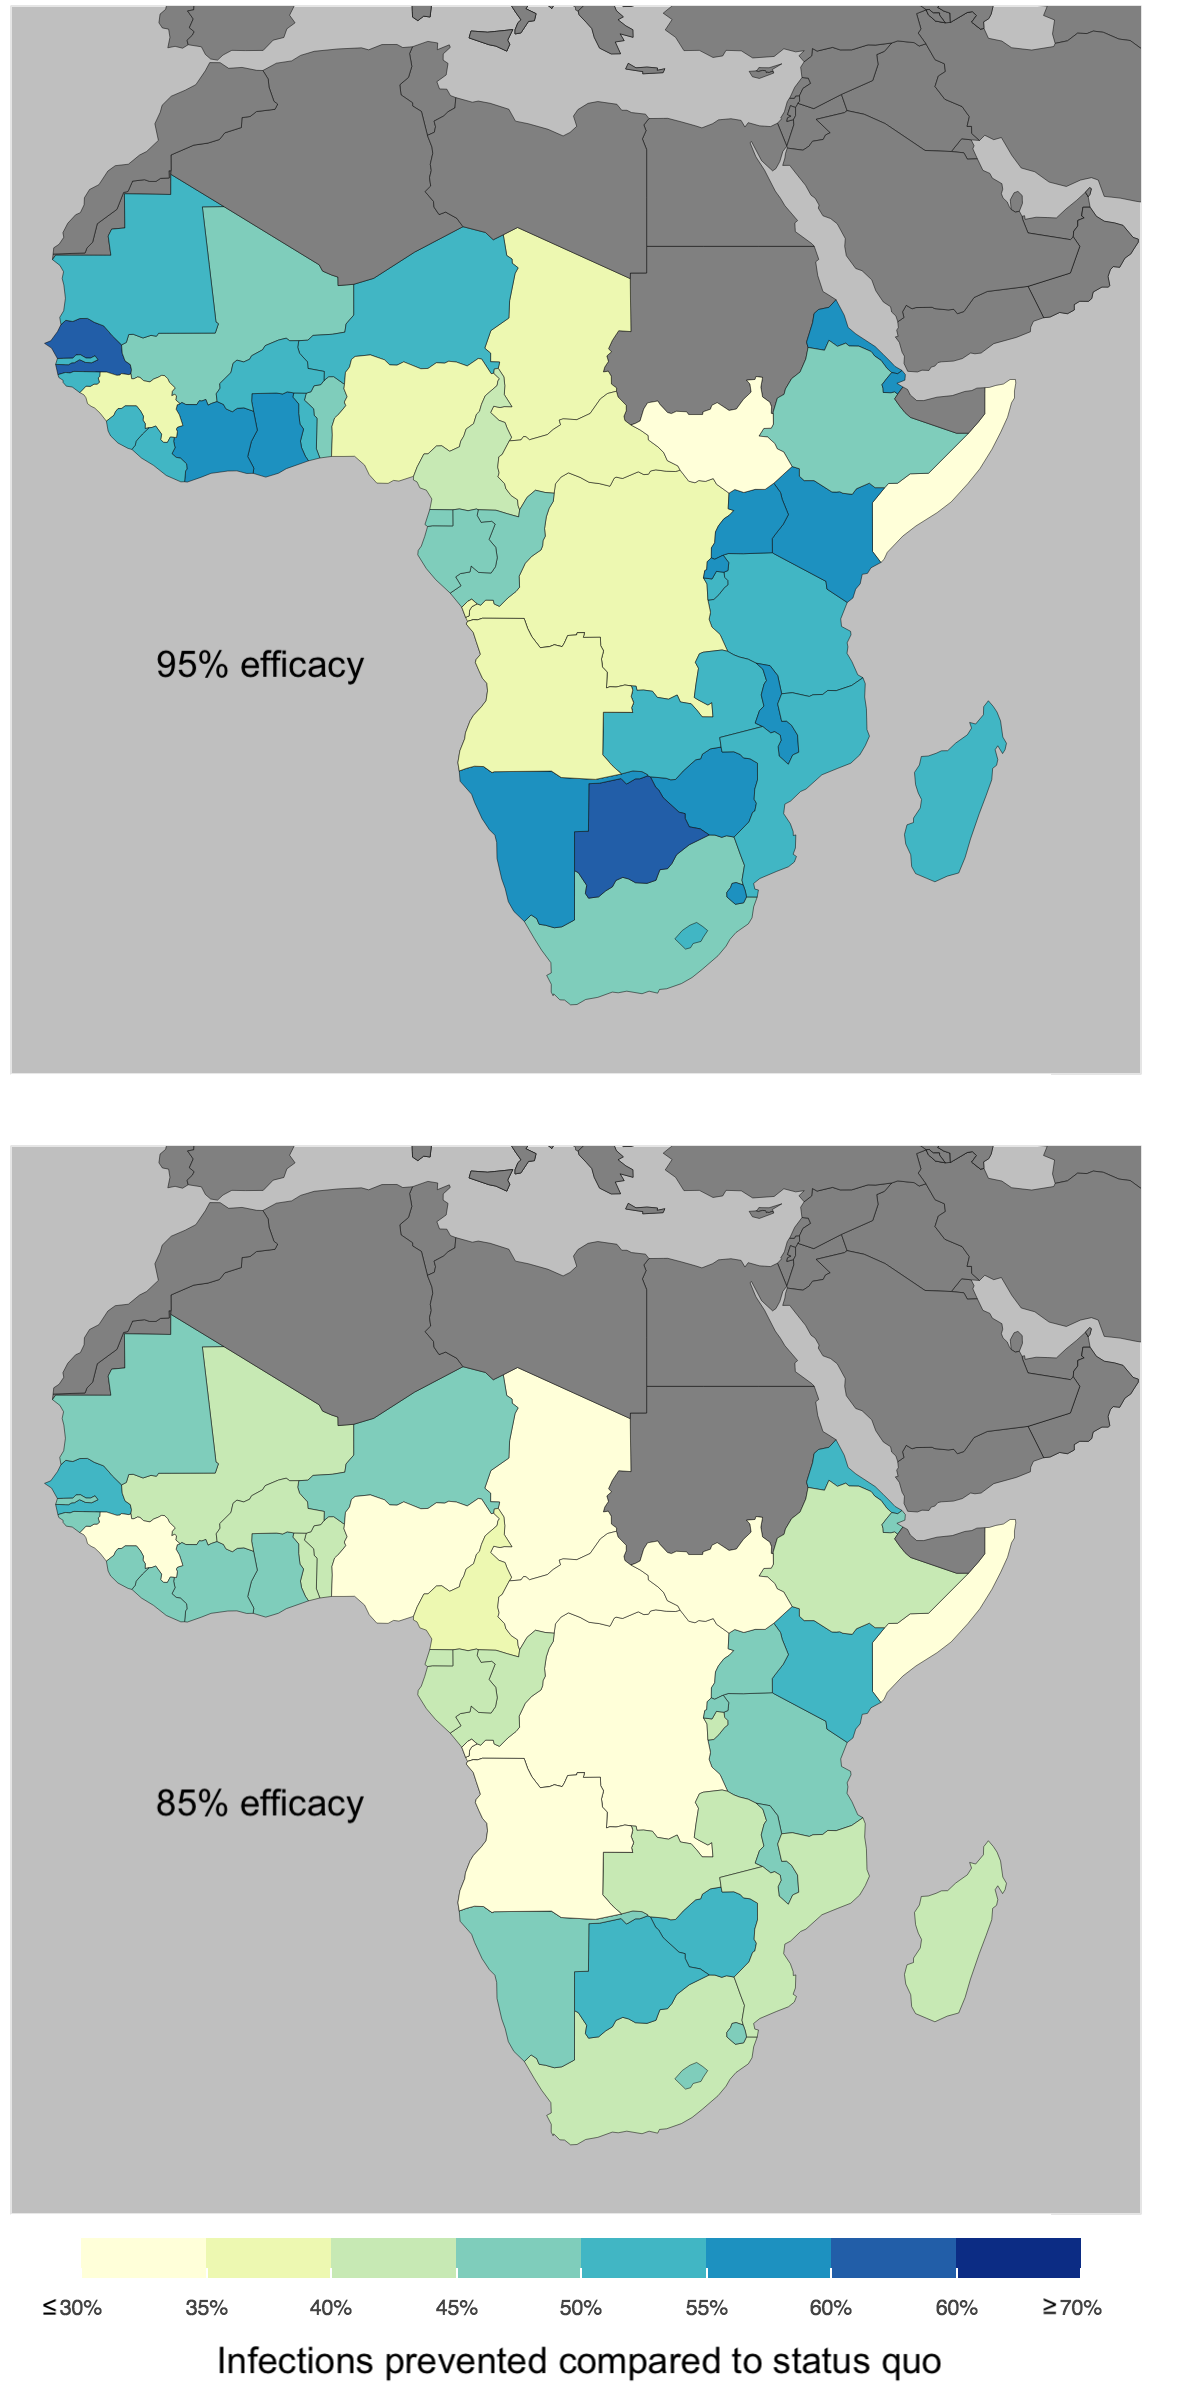
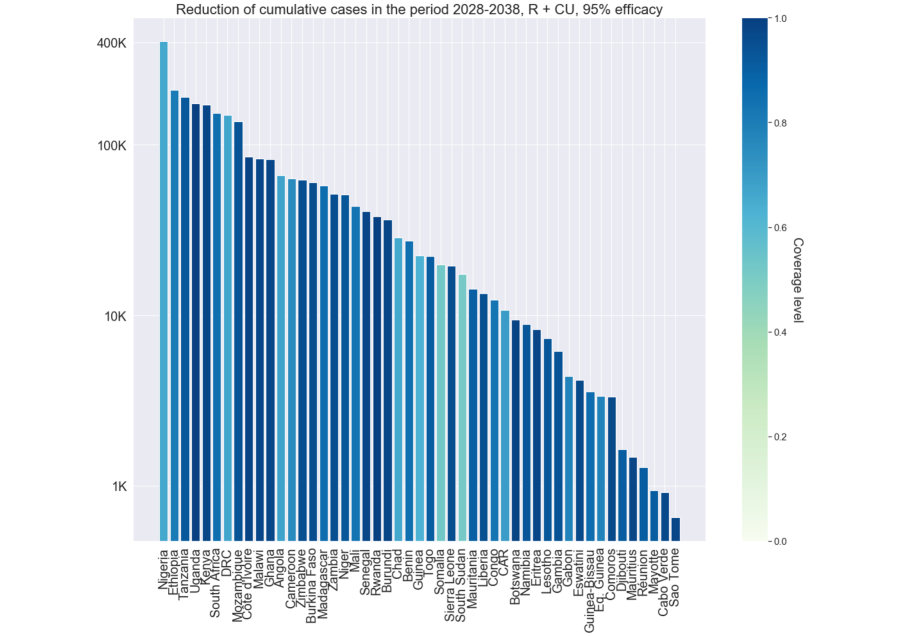
Nigeria and Ethiopia account for the highest number of cases prevented among children below 5 years old over the considered period [362,000 - 404,000] (35-38) and [186,000-210,000] (42-48) respectively, being among the most populous countries together with the Democratic Republic of the Congo (DRC) which accounts for [133,000-150,000] (32-36) cases prevented. Both Nigeria and DRC present low levels of coverage (65 and 66 respectively, against 80 for Ethiopia) and this explains the relatively lower reduction in cases following vaccination. Assuming a coverage of 90 for the routine vaccination the number of prevented cases would substantially increase: our model predicts [487,000-556,000] (47-53) cases prevented for Nigeria, [179,000-206,000] (44-50) for DRC and [209,000-238,000] (47-54) for Ethiopia. Tanzania and Uganda are less populous than the three countries mentioned, but thanks to higher coverage levels (91 and 99 respectively) they count for a large share of infections prevented, at [167,000-191,000] (47-54) and [147,000-174,000] (49-58). Our results show that increasing EPI vaccination coverages across countries would induce a considerable reduction in the burden of iNTS: by assuming an EPI coverage of at least 90 in each country the aggregate number of cases prevented over the period goes up to 2,996,000-3,373,000, (47-54).
| Country |
|
|
|
|
|
|
||||||||||||
| Angola | 193.409 | 43.847 | 2538 | (65.795, 73.659) | (9.869, 11.049) | (863, 967) | ||||||||||||
| Benin | 64.274 | 14.879 | 844 | (26.886, 30.499) | (4.033, 4.575) | (353, 401) | ||||||||||||
| Botswana | 17.168 | 4.194 | 225 | (8.924, 10.42) | (1.339, 1.563) | (117, 137) | ||||||||||||
| Burkina Faso | 133.042 | 30.748 | 1746 | (56.911, 67.085) | (8.537, 10.063) | (747, 880) | ||||||||||||
| Burundi | 78.375 | 18.243 | 1028 | (34.077, 40.63) | (5.112, 6.094) | (447, 533) | ||||||||||||
| Cabo Verde | 1.671 | 0.426 | 22 | (0.872, 1.005) | (0.131, 0.151) | (11, 13) | ||||||||||||
| Cameroon | 161.300 | 37.731 | 2117 | (62.883, 70.574) | (9.432, 10.586) | (825, 926) | ||||||||||||
| Central African Republic | 30.435 | 7.133 | 399 | (10.566, 11.844) | (1.585, 1.777) | (139, 155) | ||||||||||||
| Chad | 83.618 | 19.419 | 1097 | (28.265, 31.601) | (4.24, 4.74) | (371, 415) | ||||||||||||
| Comoros | 6.872 | 1.634 | 90 | (3.158, 3.706) | (0.474, 0.556) | (41, 49) | ||||||||||||
| Congo | 29.459 | 6.806 | 386 | (12.098, 13.68) | (1.815, 2.052) | (158, 179) | ||||||||||||
| Côte d’Ivoire | 164.364 | 38.204 | 2157 | (80.289, 94.726) | (12.043, 14.209) | (1053, 1243) | ||||||||||||
| Democratic Republic of the Congo | 453.291 | 104.500 | 5948 | (147.597, 165.409) | (22.14, 24.811) | (1937, 2170) | ||||||||||||
| Djibouti | 3.215 | 0.808 | 42 | (1.585, 1.797) | (0.238, 0.27) | (21, 24) | ||||||||||||
| Equatorial Guinea | 8.241 | 1.912 | 108 | (3.306, 3.715) | (0.496, 0.557) | (43, 48) | ||||||||||||
| Eritrea | 15.418 | 3.636 | 202 | (7.884, 9.183) | (1.183, 1.377) | (103, 120) | ||||||||||||
| Eswatini | 8.058 | 1.960 | 105 | (3.979, 4.628) | (0.597, 0.694) | (52, 60) | ||||||||||||
| Ethiopia | 486.369 | 116.275 | 6383 | (206.646, 232.389) | (30.997, 34.858) | (2712, 3050) | ||||||||||||
| Gabon | 10.591 | 2.570 | 139 | (4.327, 4.857) | (0.649, 0.729) | (57, 64) | ||||||||||||
| Gambia | 12.756 | 2.985 | 167 | (5.919, 6.834) | (0.888, 1.025) | (78, 90) | ||||||||||||
| Ghana | 158.806 | 37.742 | 2084 | (77.991, 91.232) | (11.699, 13.685) | (1024, 1197) | ||||||||||||
| Guinea | 68.041 | 15.883 | 893 | (22.118, 24.703) | (3.318, 3.705) | (291, 325) | ||||||||||||
| Guinea-Bissau | 7.643 | 1.811 | 100 | (3.508, 3.958) | (0.526, 0.594) | (46, 52) | ||||||||||||
| Kenya | 318.218 | 75.191 | 4176 | (164.178, 190.72) | (24.627, 28.608) | (2154, 2503) | ||||||||||||
| Lesotho | 15.160 | 3.753 | 199 | (7.024, 8.083) | (1.054, 1.212) | (92, 106) | ||||||||||||
| Liberia | 28.154 | 6.582 | 370 | (12.829, 14.912) | (1.924, 2.237) | (169, 196) | ||||||||||||
| Madagascar | 127.544 | 29.717 | 1674 | (56.444, 63.903) | (8.467, 9.585) | (741, 839) | ||||||||||||
| Malawi | 166.239 | 38.545 | 2181 | (78.392, 92.302) | (11.759, 13.845) | (1029, 1211) | ||||||||||||
| Mali | 106.669 | 24.532 | 1400 | (42.962, 48.675) | (6.444, 7.301) | (564, 639) | ||||||||||||
| Mauritania | 29.569 | 6.893 | 388 | (13.923, 15.83) | (2.088, 2.375) | (183, 208) | ||||||||||||
| Mauritius | 2.706 | 0.676 | 35 | (1.395, 1.62) | (0.209, 0.243) | (18, 21) | ||||||||||||
| Mayotte | 2.152 | 0.506 | 28 | (0.908, 1.046) | (0.136, 0.157) | (12, 13) | ||||||||||||
| Mozambique | 300.967 | 69.591 | 3949 | (130.585, 151.98) | (19.588, 22.797) | (1713, 1994) | ||||||||||||
| Namibia | 17.691 | 4.287 | 232 | (8.581, 9.816) | (1.287, 1.472) | (113, 129) | ||||||||||||
| Niger | 109.446 | 24.464 | 1436 | (49.729, 57.335) | (7.459, 8.6) | (652, 752) | ||||||||||||
| Nigeria | 1159.397 | 269.397 | 15215 | (400.67, 447.48) | (60.101, 67.122) | (5258, 5873) | ||||||||||||
| Rwanda | 74.075 | 17.711 | 972 | (35.425, 42.297) | (5.314, 6.345) | (464, 555) | ||||||||||||
| Réunion | 2.570 | 0.633 | 33 | (1.25, 1.419) | (0.188, 0.213) | (16, 18) | ||||||||||||
| Sao Tome and Principe | 1.206 | 0.281 | 16 | (0.626, 0.727) | (0.094, 0.109) | (9, 10) | ||||||||||||
| Senegal | 74.910 | 17.475 | 983 | (39.103, 45.341) | (5.865, 6.801) | (513, 595) | ||||||||||||
| Seychelles | 0.272 | 0.069 | 4 | (0.146, 0.171) | (0.022, 0.026) | (2, 2) | ||||||||||||
| Sierra Leone | 40.570 | 9.763 | 532 | (18.513, 21.626) | (2.777, 3.244) | (243, 284) | ||||||||||||
| Somalia | 68.344 | 15.595 | 897 | (19.689, 21.934) | (2.953, 3.29) | (258, 287) | ||||||||||||
| South Africa | 338.967 | 83.555 | 4448 | (149.607, 168.932) | (22.441, 25.34) | (1963, 2217) | ||||||||||||
| South Sudan | 63.586 | 14.992 | 835 | (17.184, 19.16) | (2.578, 2.874) | (226, 252) | ||||||||||||
| Tanzania (United Republic of) | 390.524 | 89.390 | 5124 | (186.192, 212.806) | (27.929, 31.921) | (2443, 2792) | ||||||||||||
| Togo | 48.580 | 11.313 | 638 | (21.538, 24.703) | (3.231, 3.705) | (283, 324) | ||||||||||||
| Uganda | 330.125 | 78.227 | 4332 | (162.81, 193.292) | (24.421, 28.994) | (2137, 2537) | ||||||||||||
| Zambia | 110.407 | 25.320 | 1449 | (49.302, 57.45) | (7.395, 8.618) | (647, 754) | ||||||||||||
| Zimbabwe | 117.331 | 28.117 | 1540 | (60.613, 69.218) | (9.092, 10.383) | (796, 908) |
3 Methods
3.1 Mathematical model
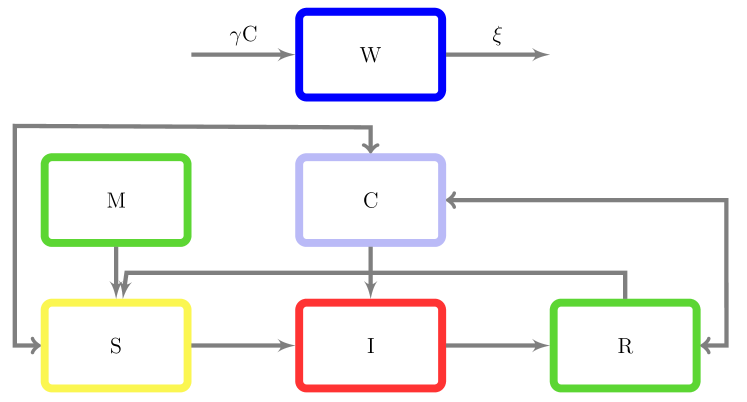
We developed an age and comorbidity structured model for the transmission of iNTS in sSA.Our model uses a susceptible-infected-recovered framework [27], where the population is divided in compartments depending on their age and health status, and transitions between compartments over time (Fig. Fig. 3 Diagram of the compartmental model.). As iNTS transmission is age-dependent [49, 9, 2, 3, 26, 6], we divide the population in age groups: 0-6 mos, 7-9 mos, 10-59 mos, mos. Individuals in the first age group are assumed to be maternal immune [32, 10, 30]. Consistent with the evidence that iNTS transmission depends on the presence of comorbidities [35, 10, 42, 39, 48, 13, 17, 33] each age group is stratified according to their comorbidity status. For children up to 59 mos we consider both Malaria and HIV, while after 59 mos we only consider immunocompromised as at high risk of developing iNTS disease [10, 7]. Carriers have an important role in the transmission of iNTS as they contribute to spread the bacteria despite not being affected by the invasive disease [46, 23, 29, 44]. We assume that only healthy individuals above 59 mos can become carriers, while children 7-59 mos (irrespective of their comorbidity status), and those older than 59 mos with HIV can get the invasive disease upon exposure [39, 31, 14, 15]. Model equations and parameters can be found in Supplementary Methods 1 and Supplementary Table 2.
3.2 Data and calibration
Population pyramids and population growth rates are taken from the United Nations Population Division [40]. We consider the medium fertility variant (median prediction interval) projections for the population growth. As population pyramids are structured in one year intervals, we use Sprague multipliers to estimate population pyramids structured in four age groups. Malaria reported confirmed cases are obtained from WHO Global Health Observatory Data Repository [57], and the number of children 0-14 y.o. and adults 15-49 y.o. living with HIV is based on UNAIDS estimates [54]. Comorbidity data refer to 2016, except a few cases where 2016 data were not available, for which we took the closest year available. For countries where data was not available we assumed they had the same comorbidity level of their most similar neighbour.
UN estimates reports the number of children 0-14 y.o. living with HIV, to compute the percentages of children living with HIV in age group 0-6 months, 7-9 months and 10-59 months, we assumed that the number of children living with HIV is uniformly distributed over age groups in the interval 0-14 years of age. Similarly we assume that Malaria cases are uniformly distributed among different age groups. For the routine vaccination scenario we use the WHO-UNICEF estimation of DTP1 vaccine coverage for each country, choosing as reference year 2019 [58]. For the catch-up vaccination scenario we use the same DTP1 coverage if this is greater than , otherwise we assume a coverage for the one-year campaign. Coverage data is summarised in Supplementary Table 1.
We calibrate the age and comorbidity specific transmission parameters to reach a yearly prevalence level of 0.3 among children age 0-5 years for the aggregate sub-Saharan Africa, using maximum likelihood estimation with normally distributed error. We then simulate the transmission model for each country, using country specific population pyramid, comorbidities and vaccine coverage. We assume that transmission rate in presence of comorbidities is 3.5 times the transmission rate without comorbidities for that age group. We estimate the rate of progression among age groups using mortality rates and annual population growth rate.
3.3 Intervention simulations
We simulate a one-year catch-up vaccination campaign among children between 9 months old and 5 years old, followed by a routine vaccination campaign at 9 months of age. We simulate vaccine efficacy between 85 and 95. We assume no waning of vaccine induced immunity as well as no protection against carriage, as currently there is no evidence regarding these two aspects. Furthermore, we assume that vaccine efficacy is not affected by Malaria or HIV status of the recipient.
4 Discussion
Without any health intervention in sSA our model calculated that the annual number of cases in children below 5 years of age will grow, resulting in an estimate cumulative number of cases in children below 5 years of age of 9.7 million by 2038. This huge number is partly due to the expected growth of the population below 5 years in sSA, this age group being the most affected by the disease. Vaccines are one of the most successful public health initiatives in eliminating or reducing the impact of infectious diseases [52], having a great impact on human health and contributing to increase life expectancy and quality [56, 5]. Our model computed the impact of different immunization strategies considering different levels of vaccine efficacy. We also show that in evaluating the impact of a large scale vaccination campaign against iNTS is of key importance to focus on a country-level analysis (Supplementary Figures 10-58). Our analyses indicate that vaccination of children below 5 years of age could effectively and efficiently reduce iNTS burden in sSA. Different levels of vaccine coverage are the main factor behind differences in the reduction of cases following vaccination. For example South Sudan and Somalia, which have the lowest coverage rate for routine vaccination (51 and 52 respectively), show the lowest reduction in cumulate infections (27-30 and 29-32 depending on vaccine efficacy). Increasing EPI coverage at 90 for both countries would reduce iNTS cases by (45-51) and (47-53) respectively. Differences in coverage are not the only factor determining reduction in cases following vaccination: consider Burundi and Senegal, they both have a coverage level of 97 (both for routine and catch-up) but the reduction in cumulate cases significantly less for Burundi [43 - 52] than for Senegal [52 - 60], difference that can be explained by the much higher number of Malaria cases among children in Burundi. This stresses the role of comorbidities in the diffusion of iNTS and consequently on the impact of vaccination (Supplemetary Table 3).A caveat must be raised when we compare different countries, given the uncertainty on country-specific incidence and given that our model does not take into account differences in water sanitation levels which can have a significant impact on the diffusion of the disease. Improving water sanitation would curb the diffusion of iNTS by reducing bacteria circulation, but implementing water sanitation improvement on a large scale is a more challenging goal, especially in the short-medium term, while a massive vaccination program could be more easily and quickly implemented and yet provide immediate and consistent benefits, as stressed by the reduction in DALYs. Furthermore the model does not take into account the effects that the COVID-19 pandemic might have had on the diffusion of iNTS in Africa, reducing personal contacts and improving life style, quality of sanitation and hygienic conditions. Although multidrug resistance is becoming a major concern for the epidemiology and treatment of Salmonella, possible modification in the iNTS disease transmission due to the Salmonella serovar antibiotic resistant were not taken in consideration in the model, most likely leading to a smaller estimate of the number of cases and deaths related to iNTS. Similarly, we also assumed no vaccine waning and no protection against carriage: currently information on the human responses to the vaccination are limited by availability, since the vaccine under study has been just launched in the clinical phases and study are currently in progress. In conclusion we evaluate the iNTS diffusion in sSA, by country and age class, considering endemic comorbidities, and highlight that the transmission of the iNTS disease among the most fragile age classes below 5 years of age in sSA will be increasing over the next 20 years without the introduction of a iNTS vaccine. By the simulation of different vaccination scenarios we identified the combination of immunization strategies needed to reduce as early as possible the burden of the iNTS disease reducing permanently its incidence. Strategies to address the iNTS burden in sSA include infection prevention, optimised use of antibiotics, improved capacity for microbiological analysis, and vaccine development. Our estimates can be used to help set priorities for vaccine need, demand and development. Overall, our findings bring to the conclusion that until safer sources of water and sanitization will not be widespread distributed and available for all population of sSA, number of cases and deaths will be increasing without the introduction of a vaccine. Vaccination against iNTS, being the faster prevention method and cost-effective medical measure, will be highly beneficial and should be prioritized as primary health intervention. Moreover, from a broader perspective our model offers a very useful tool to monitor the development of iNTS disease, to select the immunization strategies and to identify priority countries for vaccine introduction to adequately address iNTS disease. It also provides estimates on the impact of vaccine introduction at the country level and help us prioritize countries with high expected return on introduction of vaccines given the present prevalence of the disease and current vaccination coverage.
References
- [1] Akullian, A., Montgomery, J. M., John-Stewart, G., Miller, S. I., Hayden, H. S., Radey, M. C., Hager, K. R., Verani, J. R., Ochieng, J. B., Juma, J., Katieno, J., Fields, B., Bigogo, G., Audi, A., and Walson, J. Multi-drug resistant non-typhoidal salmonella associated with invasive disease in western kenya. PLOS Neglected Tropical Diseases 12, 1 (01 2018), 1–16.
- [2] Ao, T. T., et al. Global burden of invasive nontyphoidal salmonella disease, 2010. Emerg Infect Dis 21, 6 (2015), 941–9.
- [3] Balasubramanian, R., et al. The global burden and epidemiology of invasive non-typhoidal salmonella infections. Hum Vaccin Immunother 15, 6 (2019), 1421–1426.
- [4] Baliban, S. M., Lu, Y.-J., and Malley, R. Overview of the nontyphoidal and paratyphoidal salmonella vaccine pipeline: current status and future prospects. Clin Infect Dis 71 (2020), 151–154.
- [5] Black, S. The role of health economic analyses in vaccine decision making. Vaccine 31, 51 (2013), 6046–6049.
- [6] Bornstein, K., et al. Modeling the potential for vaccination to diminish the burden of invasive non-typhoidal salmonella disease in young children in mali, west africa. PLOS Neglected Tropical Diseases 11, 2 (02 2017), 1–19.
- [7] Crump, J. A., et al. Epidemiology, clinical presentation, laboratory diagnosis, antimicrobial resistance, and antimicrobial management of invasive salmonella infections. Clinical Microbiology Reviews 28, 4 (2015), 901–937.
- [8] Crump, J. A., and S, H. R. A perspective on invasive salmonella disease in africa. Clin Infect Dis. 61, 4 (2015), S235–40.
- [9] Feasey, N. A., et al. Typhoid fever and invasive nontyphoid salmonellosis, malawi and south africa. Emerg Infect Dis 16, 9 (2010), 1448–51.
- [10] Feasey, N. A., et al. Invasive non-typhoidal salmonella disease: an emerging and neglected tropical disease in africa. The Lancet 379, 9835 (2012), 2489–2499.
- [11] Feasey, N. A., et al. Three epidemics of invasive multidrug-resistant salmonella bloodstream infection in blantyre, malawi, 1998-2014. Clin Infect Dis. 61, 4 (2015), S363–71.
- [12] Gilchrist, J. J., and MacLennan, C. A. Invasive nontyphoidal ¡i¿salmonella¡/i¿ disease in africa. EcoSal Plus 8, 2 (2019).
- [13] Gordon, M. A. Invasive nontyphoidal salmonella disease: epidemiology, pathogenesis and diagnosis. Current Opinion in Infectious Diseases 24, 5 (2011).
- [14] Gordon, M. A., et al. Bacteraemia and mortality among adult medical admissions in malawi - predominance of non-typhi salmonellae and streptococcus pneumoniae. Journal of Infection 42, 1 (Jan 2001), 44–49.
- [15] Gordon, M. A., et al. Non-typhoidal salmonella bacteraemia among hiv-infected malawian adults: high mortality and frequent recrudescence. AIDS 16, 12 (2002).
- [16] Gordon, M. A., et al. Epidemics of invasive salmonella enterica serovar enteritidis and s. enterica serovar typhimurium infection associated with multidrug resistance among adults and children in malawi. Clinical Infectious Diseases 46, 7 (2008), 963–69.
- [17] Greenwood, B. M., et al. Immunosuppression in children with malaria. The Lancet 299, 7743 (Jan 1972), 169–172.
- [18] Hansen-Wester, I., Stecher, B., and Hensel, M. Type iii secretion of ¡i¿salmonella enterica¡/i¿ serovar typhimurium translocated effectors and ssefg. Infection and Immunity 70, 3 (2002), 1403–1409.
- [19] Herman, J., and Usher, W. SALib: An open-source python library for sensitivity analysis. The Journal of Open Source Software 2, 9 (jan 2017).
- [20] Ikuta, K. S., et al. Global mortality associated with 33 bacterial pathogens in 2019: a systematic analysis for the global burden of disease study 2019. The Lancet (11 2022).
- [21] Kalonji, L. M., et al. Invasive salmonella infections at multiple surveillance sites in the democratic republic of the congo, 2011-2014. Clin Infect Dis. 61, 4 (2015), S363–71.
- [22] Karachaliou, A., Conlan, A. J. K., Preziosi, M.-P., and Trotter, C. L. Modeling Long-term Vaccination Strategies With MenAfriVac in the African Meningitis Belt. Clinical Infectious Diseases 61, 5 (11 2015), S594–S600.
- [23] Kariuki, S., et al. Invasive multidrug-resistant non-typhoidal salmonella infections in africa: zoonotic or anthroponotic transmission? Journal of Medical Microbiology 55, 5 (2006), 585–591.
- [24] Kariuki, S., et al. Multidrug-resistant nontyphoidal salmonella hotspots as targets for vaccine use in management of infections in endemic settings. Clin Infect Dis. 68, 1 (2019), S10–15.
- [25] Kariuki, S., Gordon, M. A., Feasey, N., and Parry, C. M. Antimicrobial resistance and management of invasive salmonella disease. Vaccine 33 (2015), C21–C29. Global Progress on use of Vaccines for Invasive Salmonella Infections.
- [26] Keddy, K. H., et al. Clinical and microbiological features of invasive nontyphoidal salmonella associated with hiv-infected patients, gauteng province, south africa. Medicine (Baltimore) 96, 13 (2017).
- [27] Keeling, M. J., and Rohani, P. Modeling Infectious Diseases in Humans and Animals. Princeton University Press, 2011.
- [28] Kingsley, R. A., Msefula, C. L., Thomson, N. R., Kariuki, S., Holt, K. E., Gordon, M. A., Harris, D., Clarke, L., Whitehead, S., Sangal, V., Marsh, K., Achtman, M., Molyneux, M. E., Cormican, M., Parkhill, J., MacLennan, C. A., Heyderman, R. S., and Dougan, G. Epidemic multiple drug resistant salmonella typhimurium causing invasive disease in sub-saharan africa have a distinct genotype. Genome Res 19, 12 (2009), 2279–87.
- [29] Koolman, L., et al. Case-control investigation of invasive salmonella disease in africa reveals no evidence of environmental or animal reservoirs of invasive strains. medRxiv (2022).
- [30] Lepage, P., et al. Severe multiresistant Salmonella typhimurium systemic infections in Central Africa ? clinical features and treatment in a paediatric department . Journal of Antimicrobial Chemotherapy 14, B (1984), 153–159.
- [31] Levine, W. C., et al. Epidemiology of Nontyphoidal Salmonella Bacteremia during the Human Immunodeficiency Virus Epidemic. The Journal of Infectious Diseases 164, 1 (1991), 81–87.
- [32] MacLennan, C. A., et al. The neglected role of antibody in protection against bacteremia caused by nontyphoidal strains of salmonella in african children. J Clin Invest 118, 4 (2008), 1553–62.
- [33] MacLennan, C. A., et al. Dysregulated humoral immunity to nontyphoidal ¡i¿salmonella¡/i¿ in hiv-infected african adults. Science 328, 5977 (2010), 508–512.
- [34] Marchello, C. S., Fiorino, F., Pettini, E., and Crump, J. A. Incidence of non-typhoidal salmonella invasive disease: A systematic review and meta-analysis. Journal of Infection 83, 5 (2021), 523–532.
- [35] Marchello CS, Birkhold M, C. J. Complications and mortality of non-typhoidal salmonella invasive disease: a global systematic review and meta-analysis. The Lancet Infectious Diseases 22, 5 (2022), 692–705.
- [36] Marino, S., Hogue, I. B., Ray, C. J., and Kirschner, D. E. A methodology for performing global uncertainty and sensitivity analysis in systems biology. Journal of Theoretical Biology 254, 1 (2008), 178–196.
- [37] Marks, F., et al. Incidence of invasive Salmonella disease in sub-saharan africa: a multicentre population-based surveillance study. The Lancet Global Health 5, 3 (2017). e310-e323.
- [38] Moore, B. C. e. a. Survival of salmonella enterica in freshwater and sediments and transmission by the aquatic midge chironomus tentans (chironomidae: Diptera). Applied and environmental microbiology 69, 8 (2003).
- [39] Muthumbi, E., et al. Invasive Salmonellosis in Kilifi, Kenya. Clinical Infectious Diseases 61, 4 (2015), S290–S301.
- [40] Nations, U. World population prospects 2019, 2020. Accessed October 2021.
- [41] Okoro, C. K., et al. Intracontinental spread of human invasive salmonella typhimurium pathovariants in sub-saharan africa. Nature Genetics 44, 11 (Nov 2012), 1215–1221.
- [42] Park, S. E., et al. The Relationship Between Invasive Nontyphoidal Salmonella Disease, Other Bacterial Bloodstream Infections, and Malaria in Sub-Saharan Africa . Clinical Infectious Diseases 62, 1 (2016), S23–S31.
- [43] Park, S. E., et al. The genomic epidemiology of multi-drug resistant invasive non-typhoidal salmonella in selected sub-saharan african countries. BMJ Global Health 6, 8 (2021).
- [44] Parsons, B. N., et al. Invasive non-typhoidal salmonella typhimurium st313 are not host-restricted and have an invasive phenotype in experimentally infected chickens. PLOS Neglected Tropical Diseases 7, 10 (10 2013), 1–8.
- [45] Piccini, G., and Montomoli, E. Pathogenic signature of invasive non-typhoidal salmonella in africa: implications for vaccine development. Human Vaccines & Immunotherapeutics 16, 9 (2020), 2056–2071.
- [46] Post, A. S., et al. Supporting evidence for a human reservoir of invasive non-typhoidal salmonella from household samples in burkina faso. 1–18.
- [47] Saltelli, A., et al. Global Sensitivity Analysis. The Primer. John Wiley & Sons, Ltd, 2008.
- [48] Scott, J. A. G., et al. Relation between falciparum malaria and bacteraemia in kenyan children: a population-based, case-control study and a longitudinal study. The Lancet 378, 9799 (Oct 2011), 1316–1323.
- [49] Stanaway, J. D., et al. The global burden of non-typhoidal salmonella invasive disease: a systematic analysis for the global burden of disease study 2017. The Lancet Infectious Diseases 19, 12 (Dec 2019), 1312–1324.
- [50] Tacconelli, E., et al. Discovery, research, and development of new antibiotics: the who priority list of antibiotic-resistant bacteria and tuberculosis. The Lancet Infectious Diseases 18, 3 (Mar 2018), 318–327.
- [51] Tennant, S. M., et al. Nontyphoidal salmonella disease: Current status of vaccine research and development. Vaccine 34, 26 (2016), 2907–2910.
- [52] Timmis, J. K., Rigat, F., and Rappuoli, R. Core values for vaccine evaluation. Vaccine 35, 1 (2017), A57–A62.
- [53] Uche, V. I., MacLennan, C. A., and Saul, A. A Systematic Review of the Incidence, Risk Factors and Case Fatality Rates of Invasive Nontyphoidal Salmonella (iNTS) Disease in Africa (1966 to 2014). PLoS Neglected Tropical Diseases 11, 1 (2017), 1–28.
- [54] UNAIDS. Unaids countries, 2016. Accessed January 2018.
- [55] Van Puyvelde, S., et al. An african salmonella typhimurium st313 sublineage with extensive drug-resistance and signatures of host adaptation. Nature Communications 10, 1 (Sep 2019), 4280.
- [56] WHO. Global vaccine action plan. World Health Organization (2013).
- [57] WHO. Global health observatory, 2016. Accessed June 2020.
- [58] WHO-UNICEF. Who-unicef estimates of dpt1 coverage, 2019. Accessed October 2021.
Supplementary Methods 1: Model specification
The model stratifies the population of each country in 4 age groups: (1) 0-6 months, (2) 7-9 months, (3) 10-59 months, (4) months and 5 compartments according to the disease status: maternal immune (), susceptible (), infected by the invasive disease (), carrier of the disease () and recovered (). All compartments except carriers are further stratified according to comorbidity status. Carriers are individuals who can get infected upon exposure and contribute to spread the bacteria but who will not get the invasive disease [12, 18, 41]. We assume that only individuals older than 59 months without comorbidities can be carriers, while individuals in the first three age groups, both with and without comorbidities, and individuals older than 59 months with HIV can get the invasive disease upon exposure. This is consistent with evidence that children are the most at risk to get iNTS.
We do not model the transmission dynamics of comorbidities (Malaria and HIV), instead we estimate the fraction of people with comorbidities in each age group and we assume it constant. Individuals are born maternally immune, so they enter the model in compartment M where they stay for their first 6 months of life, then transition into the susceptible compartment. The susceptible compartment is stratified in age groups (first age group not included because of maternal immunity) and in comorbidity status , where stands for no comorbidity and for with comorbidity. Susceptible individuals below 5 years old (both with or without comorbidities) and above 5 years old with comorbidities can become infected with force of infection depending on their age group and comorbidity status. Once infected, individuals remain in the corresponding infected compartment for 14 days, then transition into the recovered compartment . Following natural immunity waning, individuals will transition from to the susceptible compartment at a rate . Susceptible individuals older than 5 years of age and without comorbidities will transition to the carrier compartment at a rate . We assume that infected individuals do not transmit the infection while carrier individuals both transmit the infection and shed the bacteria at a rate in the water supply. We allow both recovered and vaccinated individuals, with and without comorbidities, to become carriers upon exposure, which corresponds to assuming that both natural immunity and vaccine induced immunity protects from the invasive disease, but do not prevent becoming carrier. The demographic of the population is modelled letting individual transition within their compartment from age group to age group at rate and die at rate where is comorbidity status, such that total population, age structure and comorbidity status remain constant [22]. The transition between compartments is captured by a system of differential equations, that in the case without vaccination read as follows (where ):
| (1) |
represents the contamination of the water supply due to the shedding of carriers, is birth rate for comorbidity status (we are assuming that individuals are born with or without comorbidities, as we do not explicitly model the dynamics of Malaria and HIV), are age and comorbidity specific death rates, transition rates between age classes, the natural recovery rate, rate of natural immunity loss. Finally is the rate at which bacteria are eliminated from the water supply.
The force of infection for iNTS depends on seasonality, age and comorbidity status according to the equation:
| (2) |
Where and are adult susceptible and recovered individuals respectively who became carriers. The transmission rates capture that susceptibility differs because of age and comorbidities, and the term in brackets before captures seasonal variation: is a cosine scaling, is a seasonal offset and the seasonal amplitude. Note that we assume homogeneous mixing between age groups.
In the model with vaccination the population is further stratified to include vaccine related compartments. In our simulation scenario we vaccinate either at 9 months (in the routine scenario), or between 9 months and 5 years (in the catch-up scenario), hence both the maternally immune and carrier do not have their corresponding vaccinated compartment, even if we do keep track of vaccinated susceptibles and vaccinated recovered that become carriers. Supplementary Fig. 1 Model Compartments shows the compartments and the transition between them.
When we introduce vaccination, the transmission model is governed by the following set of differential equations:
| (3) |
where captures country-specific coverage rates. and are adult vaccinated susceptible (recovered) individuals who become carriers: they are immune to the invasive disease but not to carriage. and are vaccinated susceptible and recovered individuals respectively. We model two vaccination scenarios, routine and catch-up. In the routine scenario we assume that iNTS vaccination follows the EPI schedule set by WHO, with the first vaccination either at week 6, 10 or 14 and the second vaccination at 9 months. For simplicity we assume that the first vaccination does not induce any immunity, so it is only the second dose at 9 months gives coverage: as soon as individuals enter age group 3 they are vaccinated, and so removed from the susceptible compartment. For the catch-up scenario, we assumed one dose only, vaccinating children below 5 years of age.
Country Coverage DTP1 Coverage catch-up Angola 67 90 Benin 84 90 Botswana 98 98 Burkina Faso 95 95 Burundi 97 97 Cabo Verde 96 96 Cameroon 75 90 CAR 69 90 Chad 65 90 Comoros 96 96 Congo 82 90 Côte d’Ivoire 98 98 DRC 66 90 Djibouti 90 90 Equatorial Guinea 77 90 Eritrea 97 97 Eswatini 96 96 Ethiopia 80 90 Gabon 77 90 Gambia 93 93 Ghana 97 97 Guinea 62 90 Guinea-Bissau 85 90 Kenya 97 97 Lesotho 92 92 Liberia 94 94 Country Coverage DTP1 Coverage catch-up Madagascar 85 90 Malawi 97 97 Mali 82 90 Mauritania 89 90 Mauritius 97 97 Mayotte 90 90 Mozambique 93 93 Namibia 92 92 Niger 92 92 Réunion 90 90 Nigeria 65 90 Rwanda 99 99 Sao Tome 97 97 Senegal 97 97 Seychelles 99 99 Sierra Leone 95 95 Somalia 52 90 South Africa 84 90 South Sudan 51 90 Togo 90 90 Uganda 99 99 UR of Tanzania 91 91 Zambia 94 94 Zimbabwe 94 94 SUB-SAHARAN AFRICA 92 92
| Description | Value | Justification |
|---|---|---|
| Transmission rate months, no comorbidity | Assumption | |
| Transmission rate months, comorbidity | Assumption | |
| Transmission rate months, no comorbidity | Calibrated | |
| Transmission rate months, comorbidity | Assumption | |
| Transmission rate months, no comorbidity | Calibrated | |
| Transmission rate months, comorbidity | Assumption | |
| Transmission rate months, no comorbidity | Calibrated | |
| Transmission rate months, comorbidity | 0.0290 | Assumption |
| Duration of infection for Carrier | days | Assumption |
| Duration of invasive infection, all ages | days | Assumption |
| Duration of natural immunity | years | Assumption |
| Waning rate of vaccine induced immunity | No waning | Assumption |
| Survival time of bacteria in water | days | [38] |
| Rate of shedding of bacteria into water supply | infectious unit p.w. | Assumption |
| Birth rate | yearly | Data [40] |
| Peak of seasonal forcing | weeks | Assumption |
| Seasonal forcing | Assumption | |
| Cos scaling | Assumption | |
| Rate of progression between age groups | Age-specific | Calibrated |
Supplementary Methods 2: Sensitivity Analysis
To assess the impact of the main parameters on the model output (the yearly number of infected children below 5 y.o.) we conducted global sensitivity analysis using two methods: the extended Fourier amplitude sensitivity test (eFAST) [47], which decomposes the variance of the output into the contribution of each parameter, and the partial rank correlation coefficient (PRCC) [36], a sampling method that measures the independent effect of each parameter on the number of cases. We implement eFAST sensitivity analysis using SALib library [19], generating parameters’ samples using a revised Saltelli sampling [47]. We run 16.366 experiments for the aggregate sub-Saharan Africa and compute the first order index (S1), which captures the contribution to the variance of the output of each parameter averaged over variation of the other parameters and the total order index (ST), which captures the contribution of a parameter and of its interactions with other parameters to the variance of the output. We choose to perform sensitivity analysis on 7 parameters: the transmission rates of children and adult without comorbidities, seasonal forcing, the carrier and infected recovery rates, the waning rate of bacteria from water and the waning rate of natural immunity. Samples are drawn from the uniform distributions over (0.00020,0.00024) for , (0.0080,0.00084) for , (0.05,0.1) for , (0.0485, 0.055) for , (0.018,0.022) for , (0.00027, 0.00054) for and (0.088,0.12) for .
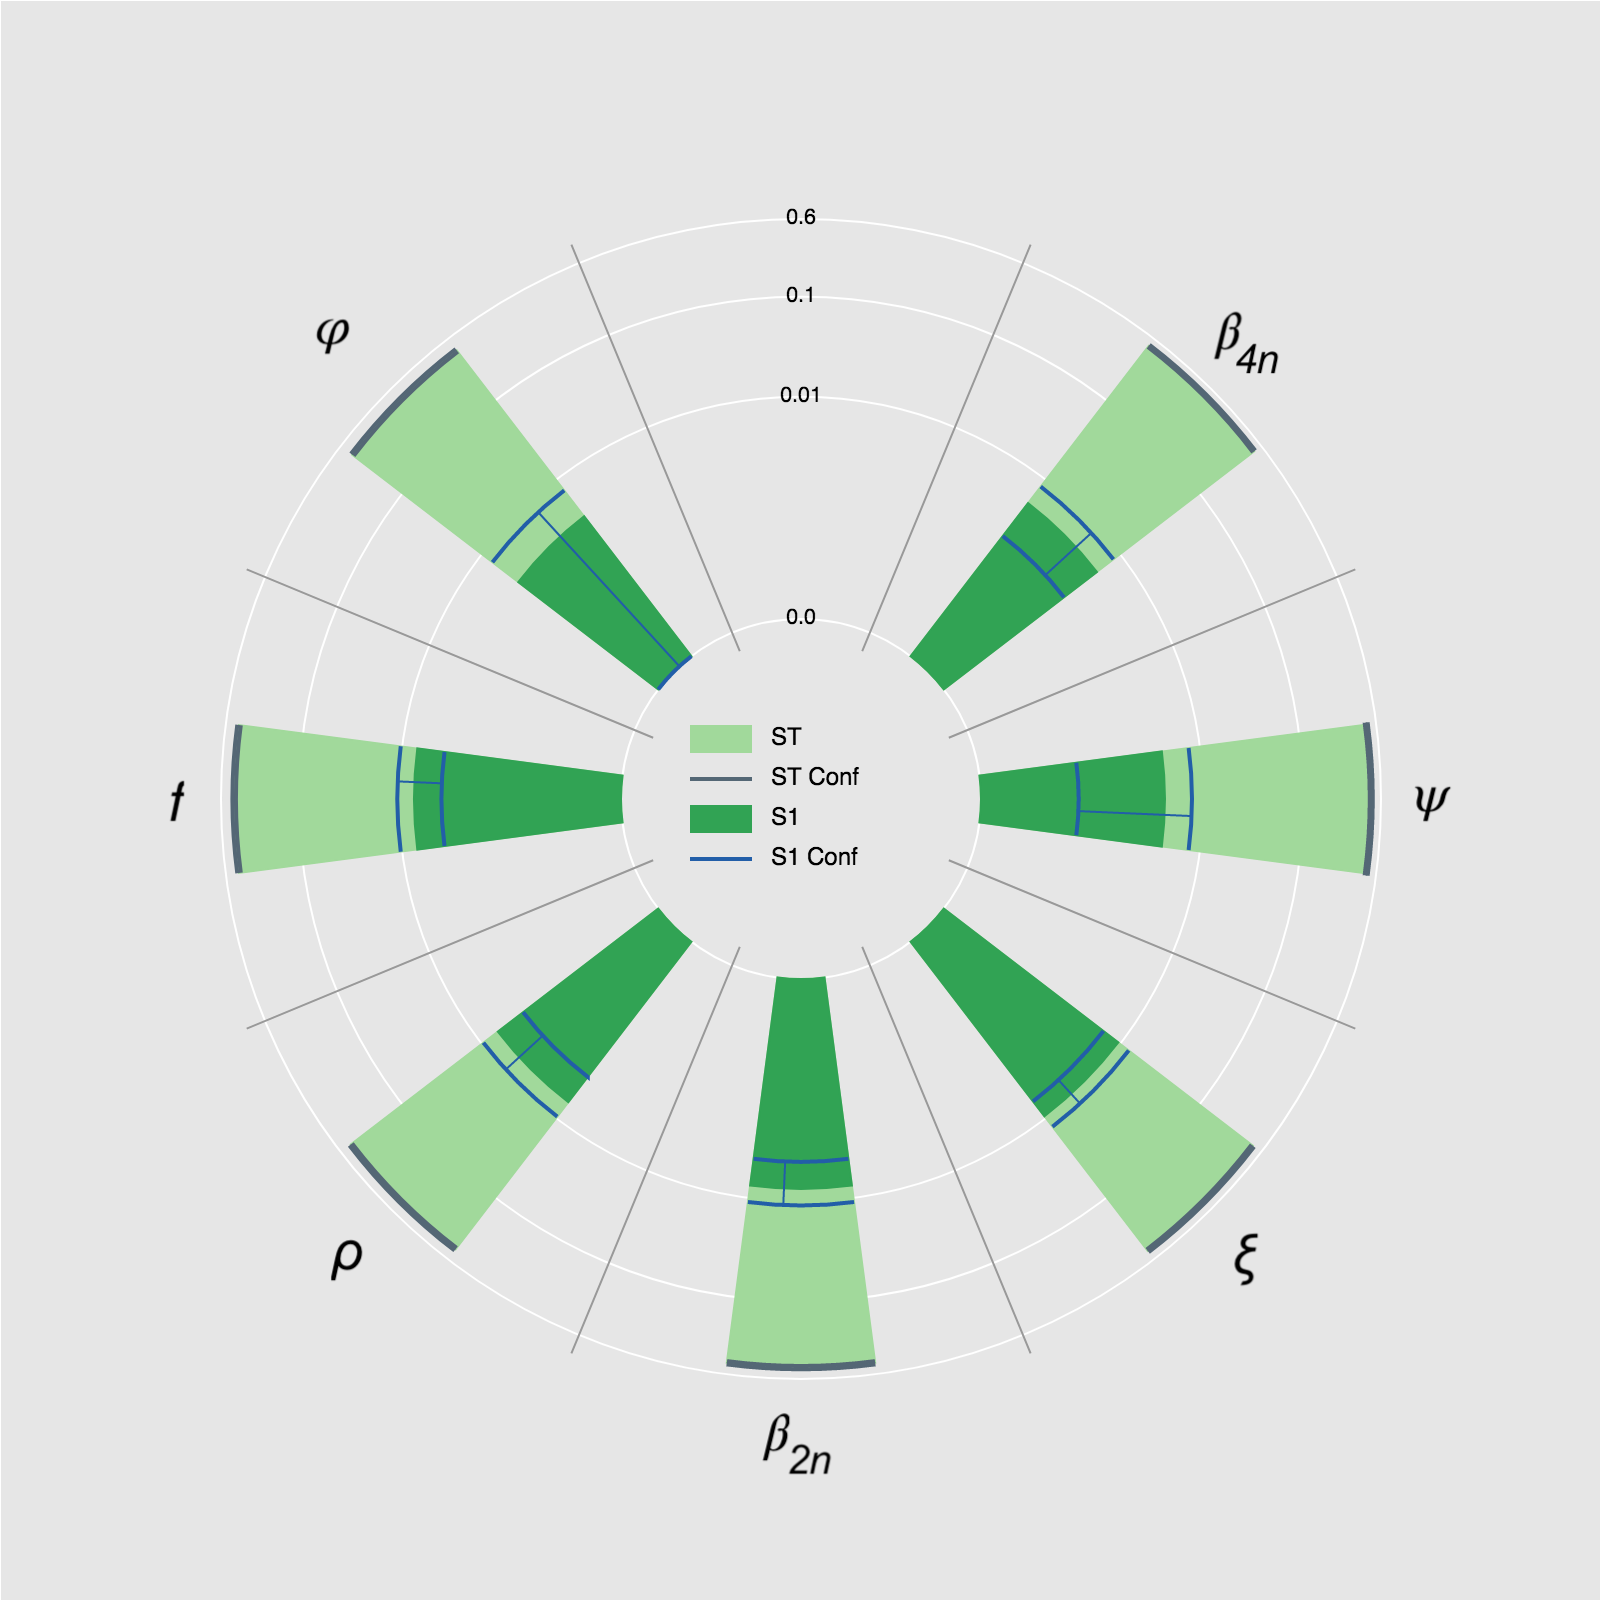
The parameters showing highest first order index are the time it takes for bacteria to decay in the water supply and the below 5 y.o. transmission parameter , followed by forcing and over 5 y.o. transmission parameter , with the latter showing slightly larger confidence bounds. Each parameter, when considered together with all others, contributes significantly to the output variance as can be seen by the high total order indices and the narrow confidence bounds.
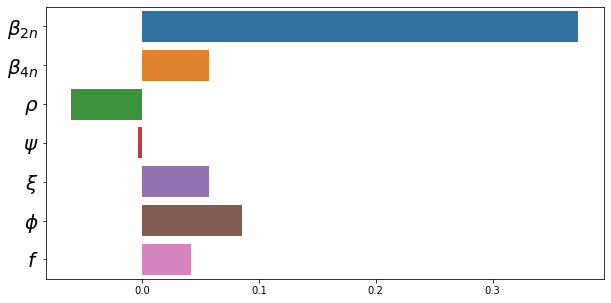
PRCC helps giving a clearer picture of the role of parameters in the model. The graph in Supplementary Fig. 2 eFAST sensitivity analysis shows that the most important parameter in determining the number of infected is , while forcing is less important than the eFAST analysis would suggest: this tells us that the high impact of on the output is explained mostly through its role in directly increasing children infections, as it acts as a rescaling factor for , more than through its impact on the number of carriers. This is confirmed by a high interaction between and , and a weak interaction between and as captured by second order Sobol indices (not reported here). The parameters that follows in order of importance are and : a shorter duration of natural immunity (higher ) increases the number of paediatric infections and a shorter duration of the infection period (higher ) decreases them. Finally and show roughly the same effect on the output.
Supplementary Results 1 Different vaccination scenarios and factors driving cases reduction
Supplementary Fig. 6 Cumulative cases prevented 2028-2038 and Supplementary Fig. 7 Cumulative deaths averted 2028-2038 illustrate the reduction in cases and deaths respectively for each country, under the scenario of a routine and catch-up campaign with vaccine efficacy. There are considerable differences across countries, mostly attributable to their different EPI vaccine coverage levels. This is better captured in Supplementary Fig. 8 Importance of vaccine coverage, which reports the reduction in cumulative iNTS cases in the period 2028-2038 in percentage terms, to make it independent of the population size. The colour of each bar corresponds to a coverage level in that country, as captured by the colormap on the righthand side of the graph. There is a clear correspondence between low EPI coverage (below 60) and lower reduction in cases prevented. To clarify this point even further, we simulate what would happen if the routine coverage level would be at least in any country. The bottom graph in Supplementary Fig. 8 Importance of vaccine coverage shows how in almost all countries there is a reduction in cases of at least 50%. Differences among countries in this scenario are then due to differences in population pyramids and comorbidities, and marginally to residual difference in catch-up coverage levels. Supplementary Table 3 Vaccine efficacy causes reports the dependence (simple OLS regression) of cumulate percentual reduction in cases (status quo versus routine + catch up vaccination with efficacy) over malaria incidence, percentage of children below 5 years old, percentages of children with HIV and routine coverage: once controlling for coverage, a younger population and higher levels of comorbidities explain lower percentual reduction in cases post vaccination.
| Percentage reduction in cases | ||
|---|---|---|
| Intercept | (0.018) | |
| Malaria | *** | (0.017) |
| Children below 5 y.o. | * | (0.067) |
| Children with HIV | ** | (0.155) |
| Coverage DTP1 | *** | (0.014) |
| Observations | 49 | |
| R-squared | ||
| Joint significance (p-value F-statistics) | ||
standard error in parentheses
-
*
,
-
**
,
-
***
We also simulated a vaccination scenario with only a catch-up campaign, and one with only a routine campaign, and both prove to be less effective than a catch-up plus routine campaign, as shown in Supplementary Fig. 9 Cumulative cases prevented in the three vaccination scenarios and LABEL:allsSA, which report the cumulative cases prevented for the entire sSA under each scenarios, for vaccine efficacy between 85% and 95%. A catch-up only campaign is clearly the least effective, confirming that in absence of other interventions, like water sanitation, the only way to keep paediatric cases and deaths under control is through sustained routine vaccination.


| Year | No vac | CU + R | R only | CU only |
|---|---|---|---|---|
| 2021 | 478.152 | - | - | - |
| 2022 | 484.596 | - | - | - |
| 2023 | 491.225 | - | - | - |
| 2024 | 498.071 | - | - | - |
| 2025 | 505.150 | - | - | - |
| 2026 | 512.928 | - | - | - |
| 2027 | 520.900 | - | - | - |
| 2028 | 528.813 | [318.455, 293.699] | [528.813, 528.813] | [318.455, 293.699] |
| 2029 | 537.225 | [354.151, 322.101] | [388.426, 356.546] | [485.705, 479.643] |
| 2030 | 545.568 | [315.018, 280.579] | [317.84, 282.759] | [532.167, 530.589] |
| 2031 | 553.562 | [316.668, 282.525] | [316.918, 282.687] | [549.99, 549.568] |
| 2032 | 561.419 | [320.999, 286.475] | [321.008, 286.476] | [560.462, 560.353] |
| 2033 | 569.080 | [325.438, 290.464] | [325.424, 290.456] | [568.833, 568.802] |
| 2034 | 576.480 | [329.737, 294.325] | [329.726, 294.317] | [576.419, 576.413] |
| 2035 | 583.579 | [333.863, 298.034] | [333.855, 298.026] | [583.572, 583.569] |
| 2036 | 589.632 | [337.409, 301.218] | [337.4, 301.207] | [589.638, 589.637] |
| 2037 | 595.429 | [340.79, 304.263] | [340.783, 304.255] | [595.436, 595.438] |
| 2038 | 601.016 | [344.061, 307.202] | [344.057, 307.201] | [601.024, 601.025] |
| Total 2021-2038 | 9732.825 | |||
| Total 2028-2038 | 6241.803 | [3636.589, 3260.885] | [3636.589, 3532.743] | [5928.736, 5961.701] |
Supplementary Result 2: Per-country vaccine effectiveness