WebQAmGaze: A Multilingual Webcam Eye-Tracking-While-Reading Dataset
Abstract
We create WebQAmGaze, a multilingual low-cost eye-tracking-while-reading dataset, designed to support the development of fair and transparent NLP models. WebQAmGaze includes webcam eye-tracking data from 332 participants naturally reading English, Spanish and German texts. Each participant performs two reading tasks composed of five texts, a normal reading and an information-seeking task. After preprocessing the data, we find that fixations on relevant spans seem to indicate correctness when answering the comprehension questions. Additionally, we perform a comparative analysis of the data collected to high-quality eye-tracking data. The results show a moderate correlation between the features obtained with the webcam-ET compared to those of a commercial ET device. We believe this data can advance webcam-based reading studies and open a way to cheaper and more accessible data collection. WebQAmGaze is useful to learn about the cognitive processes behind question answering (QA) and to apply these insights to computational models of language understanding.
1 Introduction
Eye movement data is useful for natural language processing (NLP) models since it provides direct access to human language processing signals (Mishra and Bhattacharyya, 2018). Eye-tracking (ET) recordings can therefore be leveraged to augment NLP models by providing a human inductive bias (Hollenstein et al., 2020a) or to evaluate and analyze the inner workings of the models and increase their explainability (Sood et al., 2020). Eye movement data recorded from natural reading has been used to improve models for various NLP tasks such as document summarizing tasks (Xu et al., 2009), part of speech tagging (Barrett et al., 2016), and named-entity recognition (Hollenstein and Zhang, 2019), among others. The gaze points from reading patterns are translated into engineered features, such as the number of fixations, duration of fixations, and number of saccades, which reflect the various stages of linguistic processing during language comprehension.
However, these machine learning approaches rely on large text datasets and are thus often limited by the size and availability of existing eye-tracking datasets, which require expensive equipment and participants to be present in a lab to be collected. Dataset availability is also sparse, with most reading stimuli being in English. It is also common for datasets to provide a specific reading task since different gaze patterns are produced depending on the task participants are primed on, e.g. linguistic annotation or information-seeking (Hollenstein et al., 2020b; Malmaud et al., 2020). This means that features from specific datasets might be hard to transfer to a different domain or task. Moreover, it opens the question of whether eye movement data from normal reading or task-specific reading is more beneficial for NLP models.
In light of these challenges, in this work, we present WebQAmGaze, a multilingual webcam eye-tracking-while-reading dataset tailored to be used not only for reading research and comparisons between high and low-quality gaze recordings but also in machine learning-based NLP applications. To enable a large-scale experiment setup, the data is collected through the crowd-sourcing platform Amazon Mechanical Turk paired with open-source libraries such as jsPsych (de Leeuw, 2015) and WebGazer (Papoutsaki et al., 2016). To ensure the adequacy of the text stimuli for their use for downstream NLP applications, we select texts in multiple languages (English, Spanish, and German) from an open-source question answering dataset. The WebQAmGaze data used and related experiment and analysis code are available online.111https://github.com/tfnribeiro/WebQAmGaze
For the data collection, we employ two experiment paradigms, a normal reading (NR) task, where participants read a continuous text and answer a comprehension question on the next screen, and an information-seeking (IS) task, where participants are presented with the question they have to answer before reading the text, followed by the text itself and the question again. Previous work has shown that information-seeking reading results in faster reading speed and higher omission rates, i.e., fewer words are fixated during such a search task when compared to normal reading (Hollenstein et al., 2020b) which also leads to less alignment with NLP models (Eberle et al., 2022). By collecting eye-tracking data from both tasks, we provide the possibility to analyze this behavior also in webcam-quality recordings. We hypothesize that a higher number of fixations on the relevant target spans in the text will result in participants answering correctly to the questions.
With the WebQAmGaze dataset we introduce the first corpus of webcam eye-tracking for reading studies. The objectives of this new data collection are two-fold: First, we aim to investigate to what extent can webcam-ET be used for reading studies. To the best of our knowledge, we are the first to provide word-level gaze features for a webcam reading dataset. Second, we explore how this dataset can be leveraged for explainability in NLP models.
2 Related Work
In this section, we discuss previous work in this area. We focus on the usage of eye-tracking data in natural language processing and recent progress in webcam-based eye-tracking, especially with respect to reading research.
2.1 Eye Movement Data for NLP
When looking at ET collected in reading tasks, one can observe that readers move their eyes rapidly across the text and fixate on different words, often skipping words entirely, other times fixating them for longer and sometimes returning to previous words. These behaviors seem to be linked with cognitive-linguistic processes and reveal insight not only into the reader’s comprehension of the text but also highlight some linguistic properties of the words that are fixated on. For these reasons, a variety of datasets have been created to study different properties (Mathias et al., 2021), such as ZuCo (Hollenstein et al., 2020b), GECO (Cop et al., 2017) or PROVO (Luke and Christianson, 2018), each introducing different tasks and texts, which usually are decided based on the research question being answered. Tasks can range from self-paced reading of novels to existing NLP task-specific corpora, such as sentiment banks or questioning-answering datasets, where ET patterns might highlight certain linguistic patterns.
In NLP tasks, ET has been successfully used in tasks such as part-of-speech tag (Barrett et al., 2016), readability (González-Garduño and Søgaard, 2017), sentiment analysis (Mishra et al., 2016; Barrett et al., 2018), named-entity-recognition (NER) (Hollenstein and Zhang, 2019), among others, and they all report significant statistical improvement over baselines without gaze features (Mathias et al., 2021).
Nevertheless, Hollenstein et al. (2020a) highlight the importance of high precision and accuracy for ET features in an NLP context. In addition, it advises against low-cost models, such as webcam ET, due to low sampling rates and degradation in precision, which would propagate to all downstream tasks performed. Moreover, it is still unclear what best way to employ the extracted features (e.g., as attention proxies or text features), and to which granularity (e.g., word or sentence level features) they should be used to obtain the best results given a task.
2.2 Webcam-Based Eye-Tracking
Low-cost video-based eye-tracking has been investigated for some time now (Ferhat and Vilariño, 2016; Papoutsaki, 2015), with libraries being publicly available such as TurkerGaze (Xu et al., 2015), implemented in Javascript, which allows it to run independently of any platform and to be easily incorporated into a webpage. Turkergaze, for example, aimed to explore using Amazon Mechanical Turk to determine the saliency of objects in images and showed promising results already in 2015. WebGazer (Papoutsaki et al., 2016), was our chosen library, while similar to TurkerGaze, it is focused on providing real-time gaze prediction and is actively maintained with the latest release on the 28th of March 2022.
More recent approaches include SearchGazer (Papoutsaki et al., 2017), which was developed for information retrieval and does not require any calibration, as it would automatically tune itself by using clicks from users. A few years later, it has been used for personalized text summarization (Dubey et al., 2020), where gaze point density was used as a metric for sentence saliency. These approaches, however, focus on extracting heatmaps, which are then used as features for a model to help reduce the search space. These advances show promise in the technology with models achieving better performance than the base models lacking these features.
2.3 Webcam-Based Eye-Tracking-While-Reading
More particularly for webcam-eye-tracking in NLP, a recent study (Lin et al., 2022) performs a direct comparison of data collected from a commercial eye-tracker to that of a webcam-based eye-tracking in a reading task and an accuracy task. For the latter, results showed that the webcam ET distinguishes movements on the horizontal axis (right/left) more clearly, as opposed to vertical ones. This can be a challenge to overcome, especially if text lines are close together. Nevertheless, the preliminary results are encouraging showing that differences between age groups can be identified by the webcam setup. Guan et al. (2022) use WebGazer to perform a study on L2 English speakers () reading and investigate reading comprehension based on some engineered features, such as fixation counts on page and lines and regressions (going to a previous page). Their results show that these features were indicative of participants responding correctly.
To the best of our knowledge, there is yet to be an extensive study of webcam eye-tracking in a natural reading setting, in order to extract linguistic features on the word level. For this reason, we hope to contribute to the research by comparing our results to those of datasets compiled using eye-tracking equipment at a lab, such as MECO (Siegelman et al., 2022), and provide recommendations on how to collect data in such a setting. We also have a methodology similar to that employed in Malmaud et al. (2020), which we will describe and compare in the next section and in Section 5.3.
3 The WebQAmGaze Dataset
In this section, we describe the process of compiling WebQAmGaze, a data resource that provides both raw eye movement recordings as well as pre-processed gaze fixations across 332 participants reading texts in 3 different languages: English (EN), Spanish (ES) and German (DE).
| Language | Origin Dataset | Texts | Tokens | Tokens per Sent. | ||
|---|---|---|---|---|---|---|
| English | MECO | 4 | 184 | 218 | 203.5 | 24.70 |
| XQuAD | 97 | 31 | 130 | 97.2 | 32.60 | |
| German | MECO | 2 | 178 | 192 | 185.0 | 20.73 |
| XQuAD | 36 | 26 | 115 | 83.6 | 28.88 | |
| Spanish | MECO | 1 | 195 | 195 | 195.0 | 24.38 |
| XQuAD | 64 | 35 | 131 | 98.7 | 34.47 | |
3.1 Experiment Design
Our dataset is divided into two types of reading scenarios following the approach in Malmaud et al. (2020): A normal reading task (NR), and an information-seeking reading task (IS). In the NR task, the participants are instructed to read a text carefully at their own speed and to press the spacebar to proceed to the next screen where they are asked a comprehension question about the text. The question can be either True/False or an open question. In the IS task, the participants are first presented with the question they will need to find an answer to in the text. The text is then presented on the next screen and the participants are instructed to press the spacebar as soon as they find the answer in the text. Then they are shown the question once again and they have to type their answer into a free text field. There is no time control for reading the texts in either scenario.
3.2 Reading Materials
For the construction of this corpus, we use the freely available texts from the multilingual XQuAD dataset (Artetxe et al., 2020) that can be used to test machine text comprehension models, meaning that the texts are accompanied by human annotations for question-answering.
XQuaD is a subset of the SQuAD question-answering dataset (Rajpurkar et al., 2016) that has been translated into other languages. It contains pairs of texts and questions, annotated with target spans and correct answers. We include these texts as they already contain a relevant span that can be comparable to a human rationale and allows us to compare the data we collect to investigate if the gaze information also reflects the spans that are annotated when the questions are responded to correctly. The data we collect can be used in the existing state-of-the-art approaches and compared directly and investigate how good the gaze data is in reflecting the human-rationales.
We also include texts from the MECO corpus (Siegelman et al., 2022). This dataset contains NR ET data coupled with reading comprehension questions for 13 different languages. Including texts from this dataset, will allow us to compare directly the features we extract to those collected by a commercial ET and reason about the quality of webcam-ET. We go into more detail in the approach used in Section 5.2. We collect data for languages in which the two datasets overlap: English, Spanish, German, Turkish, Greek, and Russian.
3.3 Text Selection Criteria
We include texts from both datasets according to the following criteria:
XQuAD Texts: We select texts from the XQuAD question answering dataset that are at most 650 characters long. We do this to allow for fitting text into smaller screens and to avoid the experiment taking too long to complete.
MECO Texts: The texts in the MECO corpus are significantly longer than those present in XQuAD and in order to include them in the experiment, we extend the total character limit to 1300. This results in the MECO texts having a slightly smaller font and spacing compared to the texts in XQuAD.
We report the statistics along with some linguistic properties of the subsets of texts included in the WebQAmGaze dataset in Table 1. The number of tokens and sentence lengths are obtained by using spaCy’s222https://spacy.io/api/tokenizer/ tokenizer.
3.4 Crowd-Sourcing Setting
To allow for the collection of data in the crowd-sourcing platform of Amazon Mechanical Turk333https://www.mturk.com/ we set up a stack that consists of using Heroku444https://www.heroku.com/ to host our jsPsych (de Leeuw, 2015) experiment and psiTurk555https://github.com/NYUCCL/psiTurk (Gureckis et al., 2016), to handle the payment and posting of the experiment on the Amazon Mechanical Turk website. The code can be found online.666https://github.com/tfnribeiro/WebQAmGaze The experiment sets are generated offline, consisting of a combination of existing plugins offered by jsPsych extended with WebGazer when needed. They are then hosted online on a Heroku server. We then share this link with the workers from Amazon Mechanical Turk so they can complete the experiment. For each batch, containing 10 texts, we collect up to 9 unique responses. The batches are then downloaded to a local machine to allow for data processing.
To participate in the experiment, the participants need to have the following characteristics: (1) are fluent in the language in which the texts are written; (2) are at least 18 years old; (3) can read English; (4) need to be on a Laptop/Desktop device with a webcam available; (5) cannot have completed the same experiment before; (6) the screen needs to at least have a reported resolution of to ensure the stimuli are presented in a consistent way.
Additionally, we have extra requirements in place to dissuade participants from not completing the task correctly: (1) we only accept HITs that have a correct response rate ; (2) have a HIT approval rate of at least 95% (this is only valid when workers have more than 100 HITs completed); (3) have at least 5 HITs approved in their account and (4) need to complete the task in less than 45 minutes. We offer bonuses based on the number of correct answers as a further incentive to pay attention during the task. These bonuses are offered in the following criteria: 1.00$, in case they have at least 60% correct answers, or 2.00$, in case they have at least 75% correct answers.
We restrict the regions to locations where the official language corresponds to the data being collected, to ensure the likelihood of getting native speakers to countries where the language of the experiment is the primary language: US and Great Britain (for English); Spain, Mexico, Argentina, Colombia, Chile, Ecuador, Guatemala, Peru, and Venezuela (for Spanish); Germany and Austria (for German).
The sets are corrected manually, with the exception of the MECO texts, where the procedure is automatic since there is a binary choice. For XQuAD, answers are corrected based on how close to the original span they are. For some questions, we considered other responses due to the question being ambiguous/unclear. We ignore typos, as long as they are interpretable to the original question.
3.5 Experiment Structure
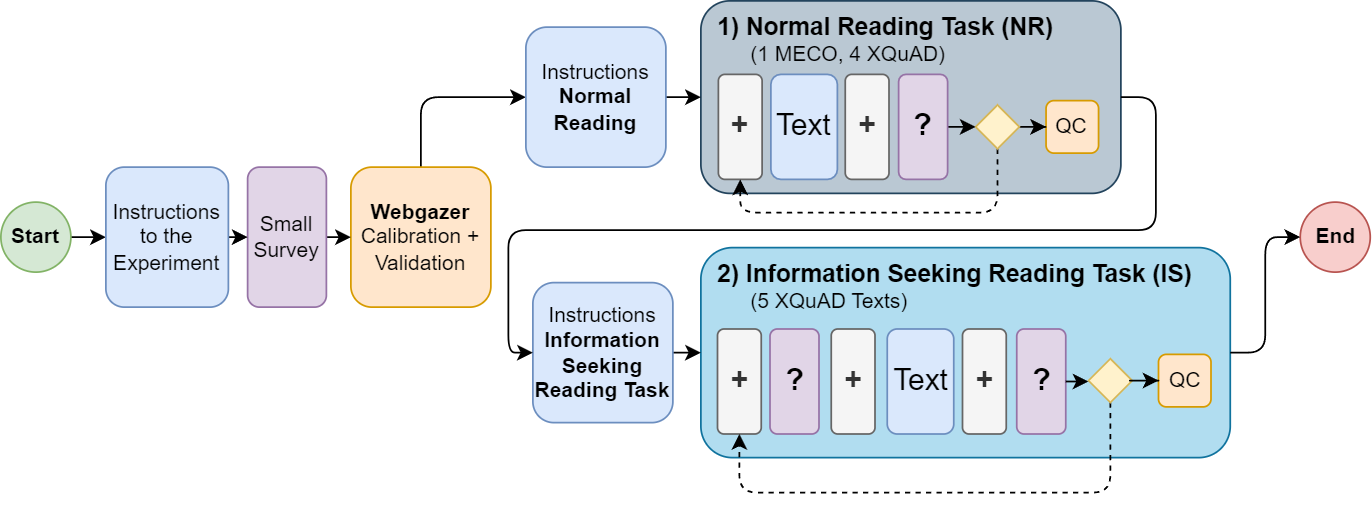
The experiment follows the procedure illustrated in Figure 1. Before the participants start, they are asked to accept a consent form informing them of the requirements of the experiment described above. They are then introduced to the two reading contexts and are asked to fill out a survey where they are asked about their age, mother tongue, and fluency in the set’s language. They are then told to close any unnecessary applications and are shown how to set up their screen to allow the best lighting conditions for WebGazer. In the next screen, WebGazer asks permission to access the webcam and start collecting data, further instructions are provided on how to use the eye-tracker via an image with the instructions: (1) Make sure your face is centered and nothing is obstructing the camera. (2) Do not move or tilt your head. Use only your eye movements to perform the task. (3) Do not sit too far or too close to the screen. (4) The image cannot be too dark.
The participants are then prompted to set their browser to full-screen to allow better calibration of WebGazer, they are also asked to keep their browsers in this mode until the end of the experiment. They then proceed to perform an 11-point calibration followed by a 5-point validation step. Here, the accuracy score is calculated based on how many gaze points fall inside a radius for each point, and if the average accuracy is lower than we ask participants to repeat the calibration step once more. The reported accuracy is the last average obtained from validation.
The participants then start with the NR task, where they first read instructions and then complete 5 texts (1 MECO, 4 XQuAD) followed by the IS task, where first instructions and then 5 texts (5 XQuAD) are shown. We decide to perform the NR task first, as it is the most cognitively demanding task, followed by the easier IS task. A quick calibration (QC) step (5-point calibration) is done every 2nd trial. This means a QC is performed after the 2nd and 4th trial in the NR task and the 1st and 3rd trials in the IS task. The experiment then terminates by quitting full-screen mode and asking participants to submit the HIT on the Amazon Mechanical Turk platform.
3.6 Stimulus Presentation Settings
The stimuli are constructed through HTML and CSS. The CSS is different based on the dataset of origin for the text. We decided to use a common online font "Open Sans" and use a word-spacing of 25 px and a text-alignment to the left. They differ in font-size 24 px/22 px and line-height 3 em/1.9 em for XQuAD and MECO, respectively. This difference is due to MECO containing larger texts in comparison to those present in XQuAD.
To generate the stimuli we take screenshots of each of the texts for the resolution of 1 which are then shown on the participant’s screen. We pick this resolution for two reasons: (1) looking at online statistics on the number of screen sizes, according to a survey777https://gs.statcounter.com/screen-resolution-stats/desktop/worldwide around of users have the same or larger resolutions than the one specified, and (2) smaller resolutions would become too small to allow for the stimuli to be presented. This way, we can use the resolution to generate the stimuli and we present the same resolution (and consequently the same spacing) to all participants. The image may be scaled in case the user contains a scaling factor in their browser or OS. However, as long as the "projected" resolution is above the target, the image should be comparable. If smaller than the participant will not be allowed to continue.
4 Data Processing
We first filter out participants who did not get approved based on their number of correct questions, which were of the total data collected. Out of these, we filter who experience an error with WebGazer, resulting in either the targets or the gaze points not being stored correctly. We further remove based on a sample rate , which is too low for linguistic processing and due to their avg. accuracy being . One participant is dropped due to low screen resolution. After filtering with these criteria we obtain data from participants out of the initial . All following experiments and analyses in this work are performed on this filtered dataset.
4.1 Fixation Detection and Gaze Point Filtering
We perform the following preprocessing steps on the gaze points obtained to transform them into fixation points.
First, we subtract the image coordinates , and for each gaze point we perform the following to transform it into a resolution-independent gaze point :
| (1) |
Where are the coordinates of the top-left corner of image and is the estimation of the gaze location at time in . Before all coordinates are referring to a location in the participant’s screen. The set of all resolution-independent gaze points is defined as .
Second, we define/merge the data points into fixations related to the reading process by defining a time window and a radius . For every point , we perform:
| (2) |
| (3) |
Where is the new fixation point created and is the total number of points summed. Both and are empirically defined parameters. We then calculate the fixation duration to be the difference between the fixation time of two consecutive points so that and set the first gaze point to have . Additionally, we remove any data points which are outside the text target area, in this case, the borders of the image containing the text with a tolerance threshold of , to allow for fixations related to reading that fall outside of the text box due to lower accuracy.
As a final step, we also remove any fixations which are shorter than , which will remove points that the participants did not fixate, except the first gaze point . We pick this value as it seems to provide a good balance between filtering non-fixation points and not removing too much data. Lower values result in very little filtering due to the low frequency of Webgazer and higher values can result in over-filtering. It is important to note that both of these steps will significantly impact all the downstream tasks with features derived from these fixations.
We pick this method as a simple initial approach that does not make strong assumptions about the quality of the gaze data collected and provides a good starting point for analysis.
4.2 Word Boundary Detection
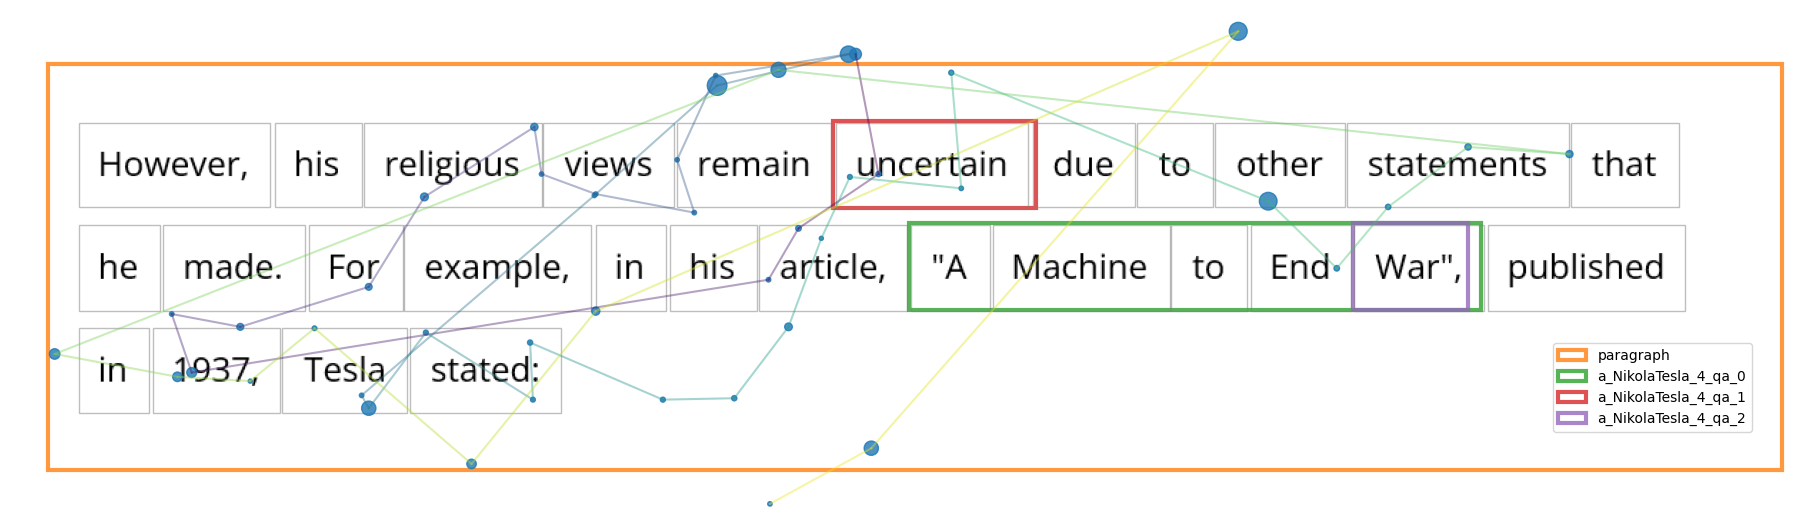
No software is available to automatically generate word boundaries in conjunction with WebGazer experiments. For this reason, we have also included automatic word boundary detection to retrieve the individual word positions from the image file presented during the experiment. We use pytesseract888https://pypi.org/project/pytesseract/, a python wrapper for the OCR engine (libtesseract), to retrieve word boundaries given the images used as stimuli for the experiment. Based on the bounding boxes detected we create targets for each of the words, by taking the original bounding boxes and expanding them to ensure that they provide some margin of error, but without overlapping with other words. These values were tuned empirically based on the values set in the CSS when creating the images. The results can be seen in Figure 2.


5 Data Analysis
5.1 Dataset Statistics
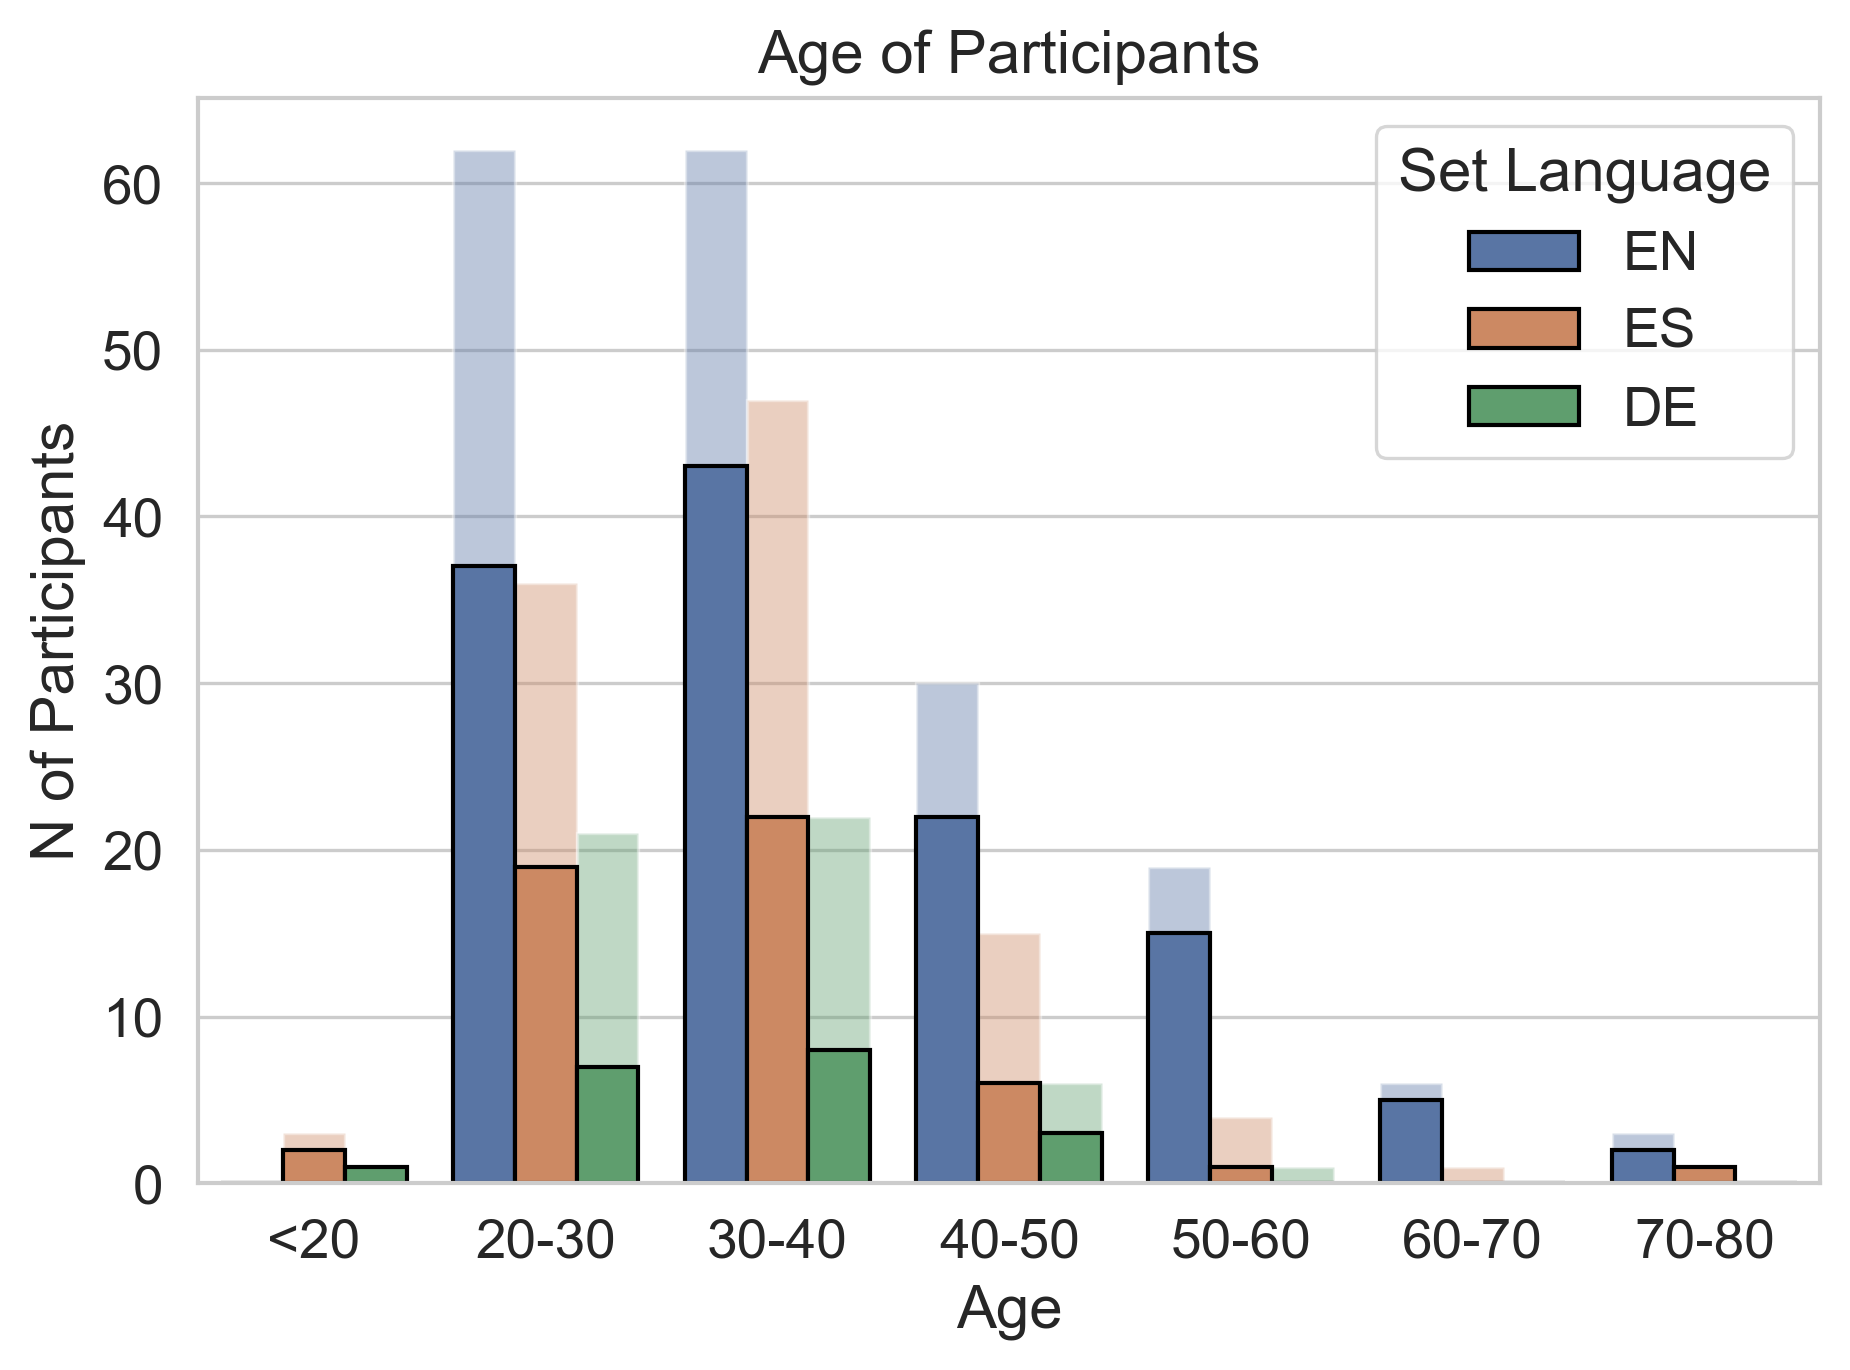
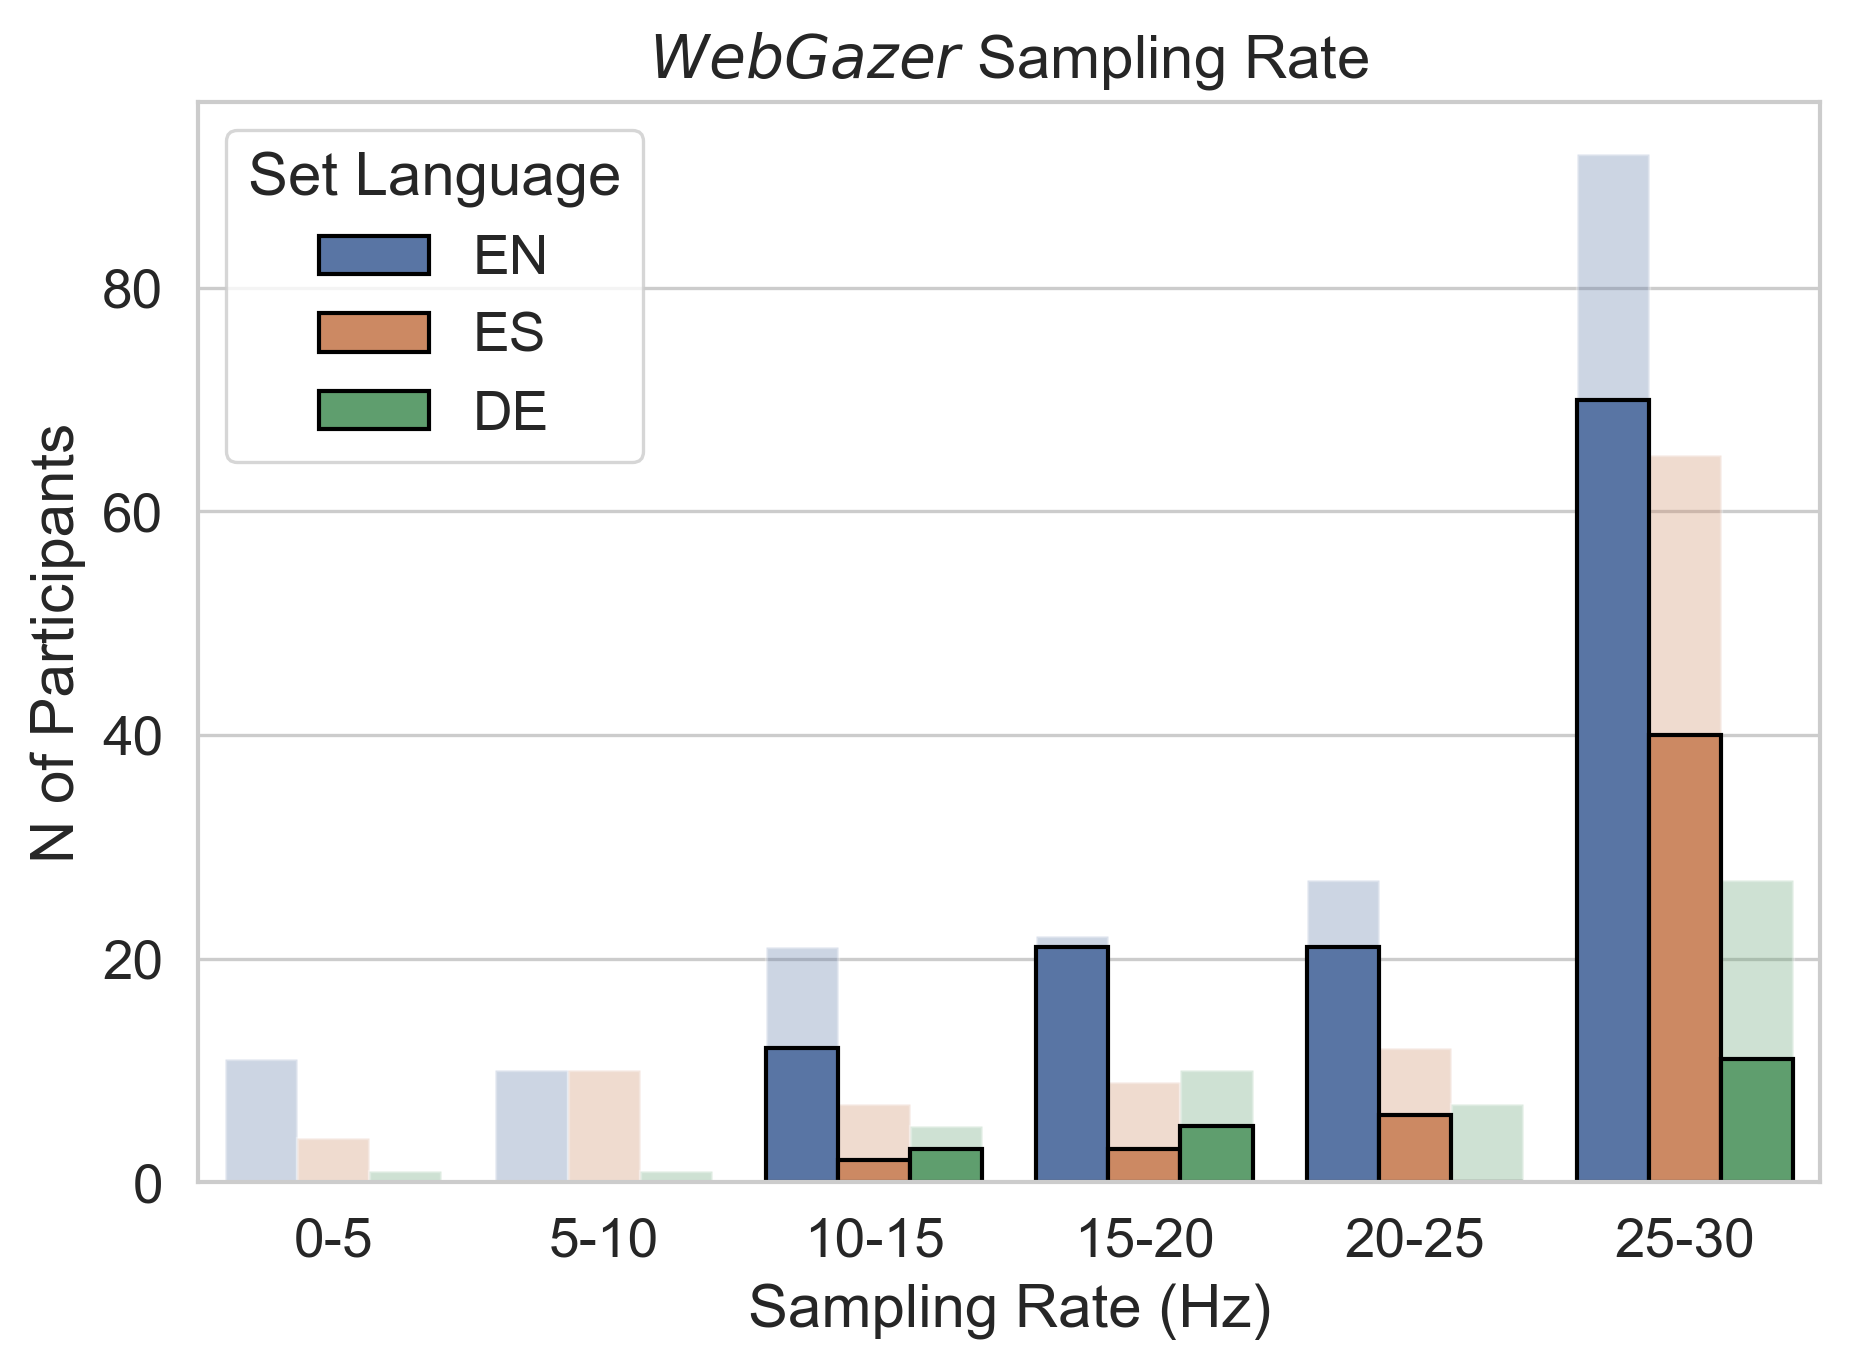
We collected data from a total of 332 participants. After performing the filtering steps described in Section 4, we obtain data from 194 participants, 124 from the English data, 51 from the Spanish data, and 19 from the German data. We report the participants’ age distribution () and the sampling rate of WebGazer () in Figure 3. We also visualize through box plots the WebGazer’s average accuracy after the last validation step and the time taken to complete the experiment in Figure 4.
5.2 Comparison to High-Quality Recordings

We further compare the recordings for the MECO texts with the original MECO eye-tracking data. The MECO dataset has been recorded in 13 different laboratories (one per language) around the world using EyeLink trackers with a sampling rate of 1000 Hz. Participants used a chin rest and a head restraint to minimize head movements. Thus the data is expected to be of much higher quality than WebQAmGaze with respect to comparability between participants and accuracy.
We compute the total reading time (TRT, the sum of all fixations on a word) and the number of fixations (nfix) both averaged across all participants and words. Note that for TRT we only include the words that have been fixated whereas for the nfix we include all words, starting with a count of . Results can be found in Table 2.
We also compute the Spearman correlation coefficients between relative fixations of both datasets. Total fixation time (TRT) per word is divided by the sum of all TRTs in the respective sentence to compute relative fixation duration for individual participants for each text, similar to Hollenstein and Beinborn (2021). Here, we also omit NaN values, i.e., words that have not been fixated in the entire dataset.
In comparison to MECO, we see an increase in TRT of ms and a slight increase in the number of fixations in particular for English and Spanish. We assume this is caused by an overall lower accuracy when assigning fixations to individual words as some fixations are aggregated to one word instead of being split across neighboring words. We see correlation values between both datasets mostly around which is substantially higher than the correlation between MECO and first attention as shown in Brandl and Hollenstein (2022). Correlation for text in German is lower than the other values, here only 19 participants have been recorded.
In Figure 5, we also show relative fixation patterns of two-handpicked English sentences for WebQAmGaze and MECO where relative fixation has been averaged across participants. Both follow a similar pattern where WebQAmGaze show much higher deviations than MECO. The sentence on the right shows a high relative fixation for such which might actually correspond to the prior word vehicle.
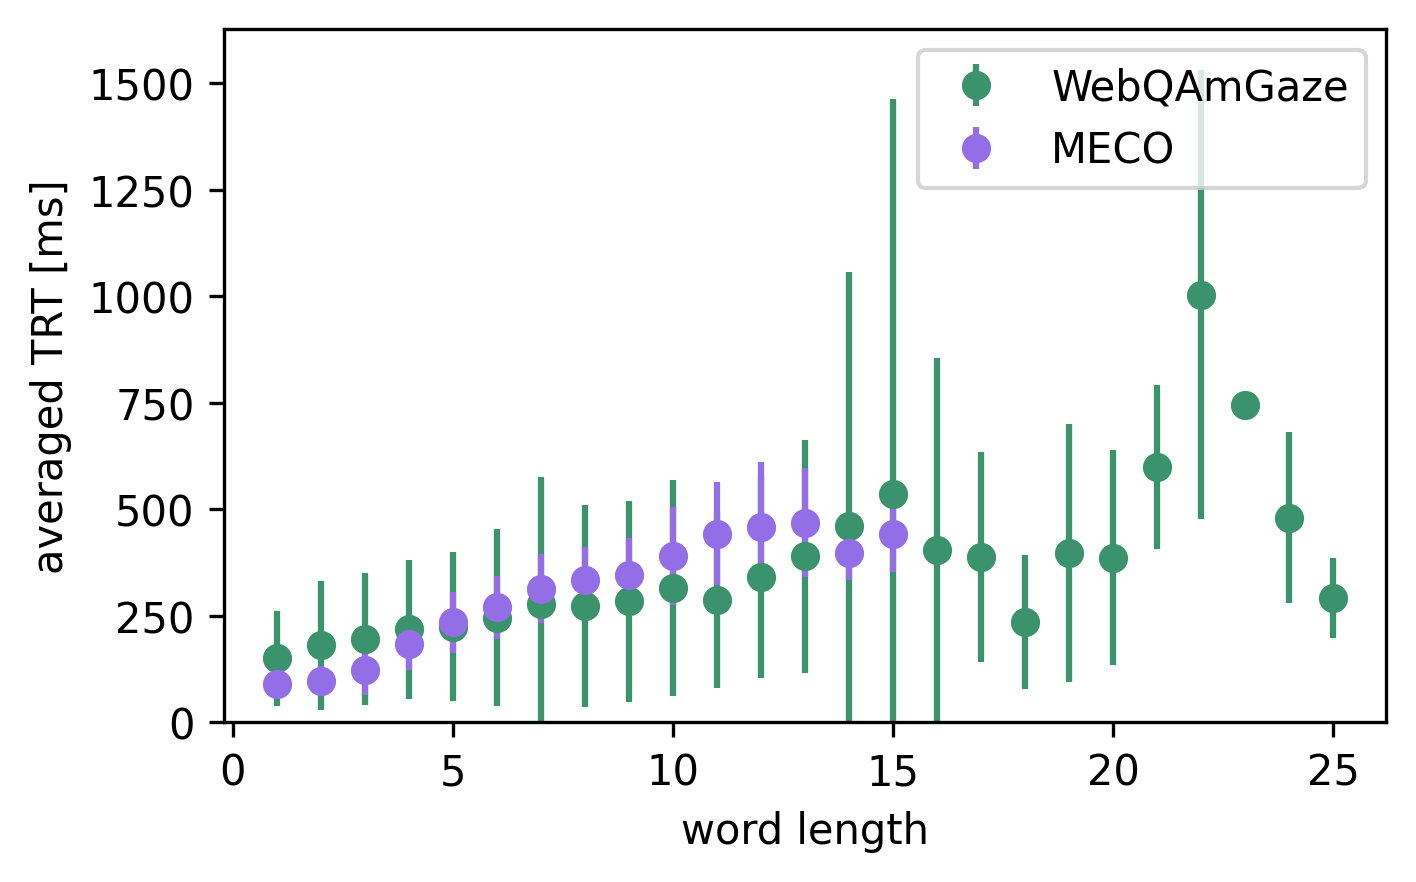
In Figure 6, we further show TRT averaged across participants and tokens based on their word length for all English words in WebQAmGaze and corresponding MECO texts 3, 7, 11, and 12. We overall see an expected increase in TRT for longer words, which is in line with the well-studied word length effect in reading (Just and Carpenter, 1980).
| MECO | WebQAmGaze | |||||
| ID | TRT [ms] | nfix | TRT [ms] | nfix | ||
| EN | 3 | 244 | 1.18 | 411 | 2.17 | 0.52 |
| 7 | 226 | 1.09 | 304 | 0.92 | 0.60 | |
| 11 | 260 | 1.22 | 340 | 1.50 | 0.55 | |
| 12 | 210 | 1.02 | 337 | 1.43 | 0.56 | |
| ES | 12 | 245 | 1.22 | 333 | 1.30 | 0.53 |
| DE | 1 | 313 | 1.49 | 282 | 1.31 | 0.31 |
| 12 | 301 | 1.46 | 298 | 1.18 | 0.55 | |
5.3 Towards Eye Movement Rationales for Explainable AI
Current state-of-the-art machine learning models for language processing are still mostly black boxes. A rationale can be defined as a justification for a particular decision by a model. For example, in a question answering system, a rationale is the target text span relevant for finding the correct answer to a question. Explainable AI models aim to provide justifications for the decisions made by a model, often based on human annotations. Datasets such as ERASER (DeYoung et al., 2020) provide a methodology that can be used to compare and evaluate how explainable different rationales are by introducing metrics that are comparable across different approaches. However, these rationale annotations are time-consuming and involve conscious task-solving. Therefore, they include human subjectiveness and biases (Chiang and Lee, 2022).
We hypothesize that eye-tracking information can be used to extract rationales without the need for annotators manually denoting which spans are relevant. The conscious, time-consuming process can be replaced by gaze information while reading, a more efficient process grounded in human attention. As an initial validation for this hypothesis, we show that, in information-seeking reading, the fixations of a participant are more indicative of the correctness of their answers than in normal reading.
5.3.1 Significance Testing
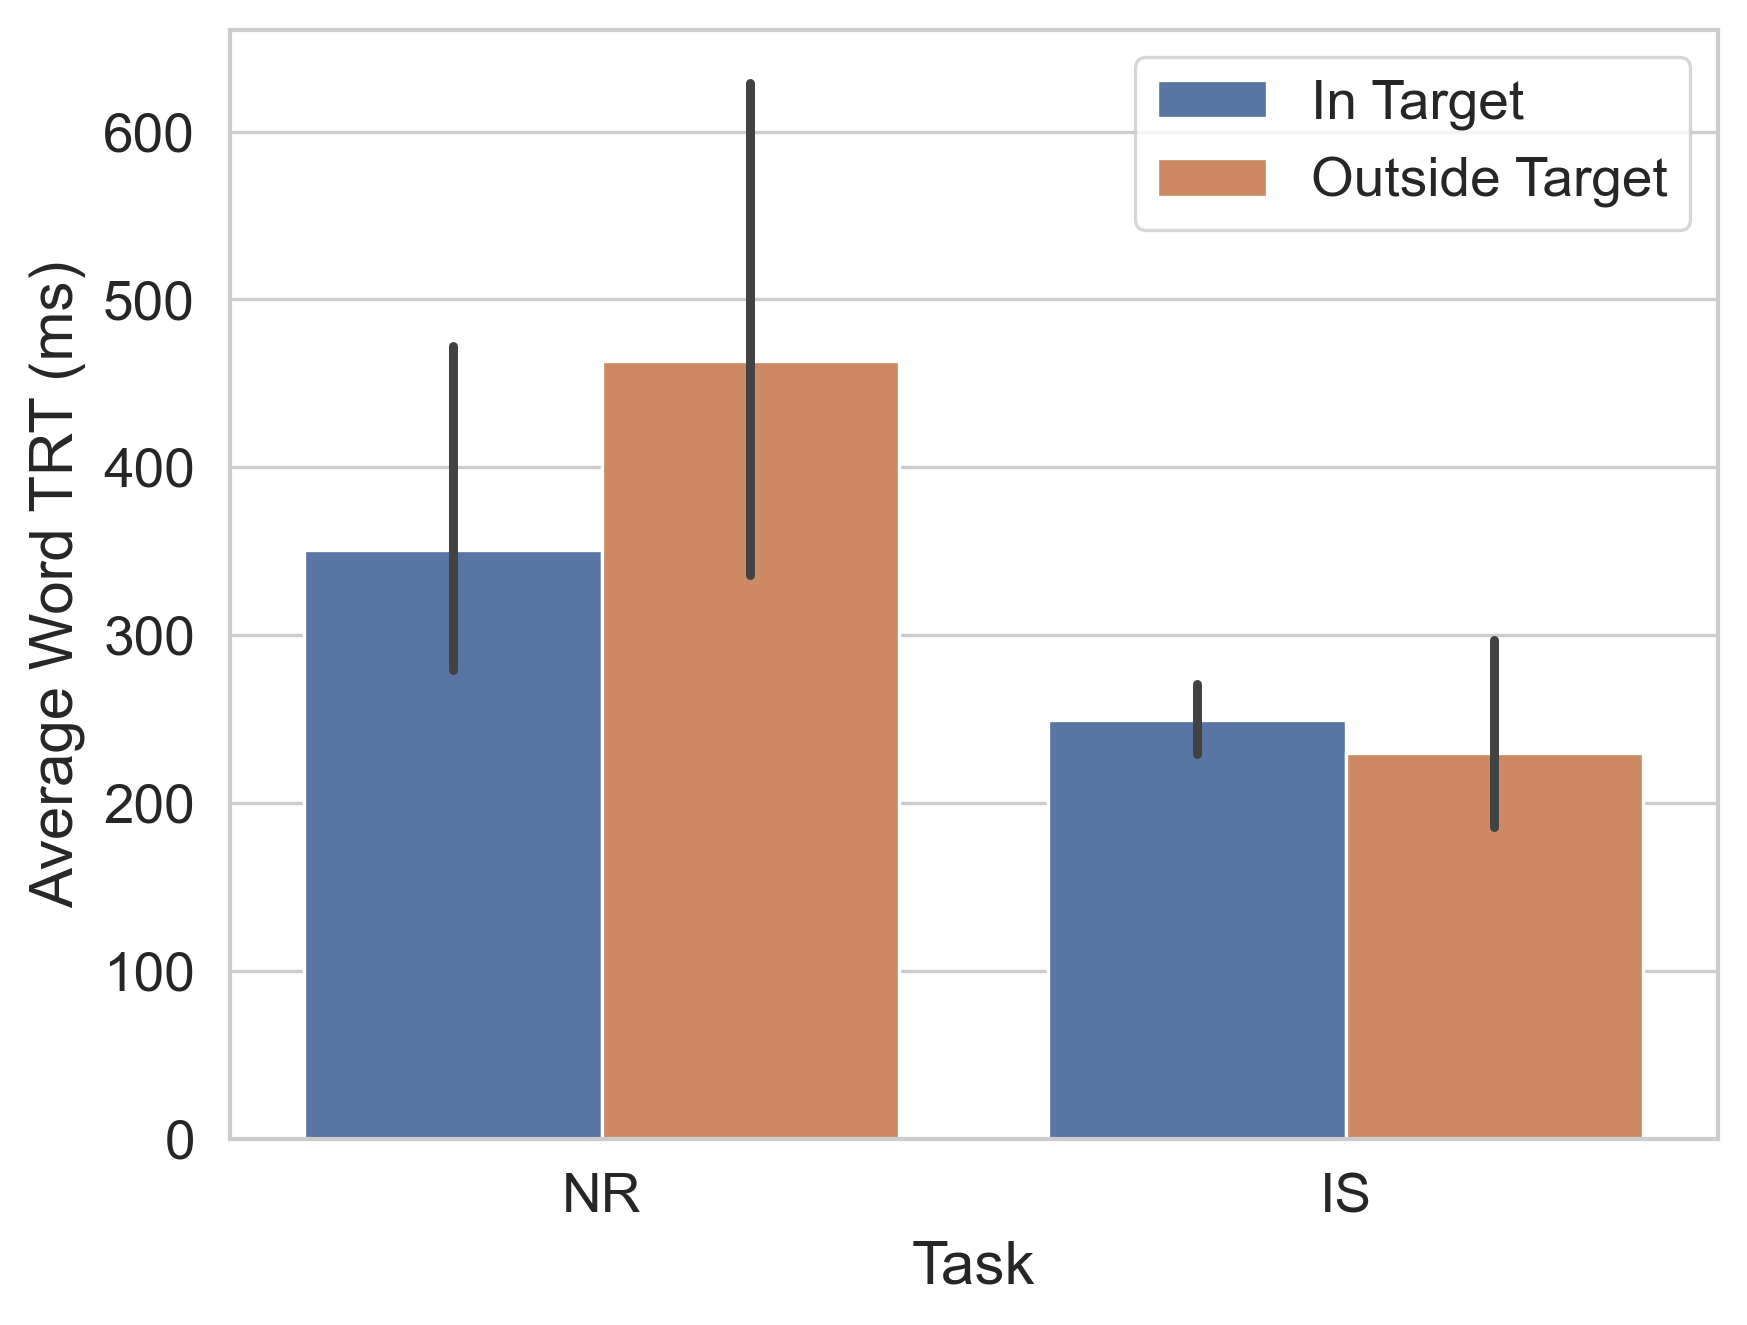
To test this hypothesis, we perform independent t-tests for each task (NR, IR) grouping participants by whether they responded correctly or incorrectly to the trial. We evaluate if there is a significant difference for various eye-tracking metrics namely, (1) fixations on target, (2) total fixations (the number of fixation points during the trial, not necessarily in the text), (3) target/total fixation ratio (ratio between fixations on target and total fixations), (4) TRT on the full text, (5) TRT on the target span, (6) TRT target/TRT text ratio (ratio between the TRT spent on target span over the total TRT on text), and (7) total trial time (the full time spent on a trial screen). The results are shown in Table 3. We obtain significant values for (2), (4), and (7) for IS. No significant differences are seen in NR for fixation features, where only (7) is significant. Since NR did not guide participants in any way, it matches our expectations. For the IS task, we see that the features pertaining to the total time, also show significance meaning that in this task the eye-tracking features still show a significant difference between the correct and wrong groups. This finding is further confirmed by analyzing the averaged word TRT over all the trials and grouping them by task (Figure 7). Not only do participants spend less time on each word on average in the IS task over the NR task, but they seem to spend slightly more time looking at words in the target region rather than on the rest of the text. This is in line with the results from Malmaud et al. (2020), demonstrated using a commercial eye-tracker in a lab setup.
Interestingly, in our dataset, it does appear that total trial time is a significant effect on both tasks. Looking at the total trial time means of the two groups in NR, the group that has correct answers takes longer to respond (incorrect answer: vs correct answer: , while in IS the reverse is true (Wrong Group: vs Correct Group: ), shorter total trial time times affects the correctness of the answers. This lines up with our hypothesis, as in the NR task, participants need to read attentively as they are not aware which question is asked, while in the IS task participants are incentivized to find only the relevant information.
| NR | IS | |
|---|---|---|
| (1) Fixation on target | 0.84 | 0.14 |
| (2) Total fixations | 0.15 | 0.02 |
| (3) Target/total fixation ratio | 0.59 | 0.48 |
| (4) TRT on text | 0.11 | 0.04 |
| (5) TRT on target | 0.81 | 0.12 |
| (6) TRT target/TRT text | 0.70 | 0.72 |
| (7) Total trial time | 0.001 | 9.46e-05 |
| Model | IS | NR | ||||||
|---|---|---|---|---|---|---|---|---|
| Only ET Features | With Text Features | Only ET Features | With Text Features | |||||
| Acc | F1 | Acc | F1 | Acc | F1 | Acc | F1 | |
| Random | 49.5 (03.9) | 54.9 (03.9) | 49.5 (3.9) | 54.9 (3.9) | 49.7 (2.8) | 50.0 (2.6) | 49.7 (2.8) | 50.0 (2.6) |
| SVM | 53.5 (11.2) | 56.7 (10.3) | 57.2 (8.9) | 60.9 (7.8) | 50.6 (2.8) | 47.4 (3.5) | 55.5 (2.3) | 54.0 (2.3) |
| Log. Reg. | 55.8 (07.1) | 60.3 (06.4) | 53.6 (4.5) | 58.6 (4.5) | 52.1 (2.0) | 51.8 (1.8) | 55.1 (3.2) | 54.4 (3.4) |
| Rand. Forest | 70.3 (03.8) | 70.4 (02.8) | 73.4 (2.7) | 72.5 (2.3) | 49.6 (3.1) | 49.8 (3.1) | 59.2 (2.4) | 59.3 (2.4) |
5.3.2 Correctness Classification
With these findings, we train a binary classifier to predict whether a correct answer has been given to a task, taking the features (1), (2), (3), (4), (5), (6) and average word TRT in and out of target span. For training the classifier, trials without any fixations on the text are removed ( of total data, ). We then test three different classifiers from sklearn999https://scikit-learn.org/stable/: (i) SVC, a support vector machine classifier, (ii) Logistic Regression and (iii) Random Forests. We also provide a random baseline classifier, which outputs the labels in the training data (0=incorrect answer, 1=correct answer) in a uniform manner. The parameters for all these classifiers are left to their defaults from sklearn. We split the data by task, NR (, , ) and IS (, , ), and use a shuffled train/test split of . As there are substantially more positive labels, especially for the IS task, we decide to balance the labels by artificially up-sample negative examples from the training split to augment the data, resulting in a balanced training set.
We then train each of the classifiers on this augmented training set and classify on the test set. We repeat this procedure times with different seeds. We report the averaged results in Table 4. For the IS task, random forests yield and , while the other classifiers perform slightly above the random baseline, they are considerably worse than random forests. However, for the NR task, while Log. Reg. obtains higher Acc and F1, all perform very similarly to the baseline. This indicates that the features used are insufficient to discriminate whether a participant would answer correctly in this task. This might be due to the quality and selection of the features or due to the nature of the NR task. We experiment with adding some text features token count and average token length for each text, and we see that these improve most results, and improve the random forest performance by in NR. Returning to our hypothesis, our results indicate that while information-seeking reading seems to provide reasonable proxies for human rationales, this does not seem to be the case for NR scenarios, where only with the addition of text features can classifiers perform better than a baseline.
6 Discussion
We compile and share a new webcam eye-tracking dataset including reading data from 332 participants in three languages. The results obtained on the WebQAmGaze dataset reveal similar trends to what has been previously considered to be only possible with a commercial eye-tracker in a lab environment. We show promising results when comparing our data to that of a commercial setup and gaze patterns in task-specific reading seem to align with relevant passages. In this section, we highlight some of the methodological challenges encountered with WebQAmGaze as well as potential directions for future work.
6.1 Methodological Challenges
With the proposed WebQAmGaze data collection process, we describe a solution to how to present the text stimulus in a way that maintains consistency across the diverse landscape of possible computer setups. However, other factors reveal to be more difficult to control. First of all, WebGazer requires a combination of a good webcam and a computer with a good CPU and RAM, which is hard to control in our current setting. We attempt to counteract this challenge by using the reported sampling rate, which seems to be a good indicator of how well WebGazer is functioning.
Furthermore, we face the issue that while we perform multiple calibration steps throughout the experiment to ensure that we correct for possible head movements by participants, we are unable to validate the accuracy of the eye-tracking throughout the experiment, as this would add a considerable amount of time to the total experiment time and possible loss of interest or focus from the participants. It is also worth mentioning that WebGazer itself might crash or run into issues while the experiment is ongoing. This can result in loss of data for certain trials or worse by crashing the page where the participants are performing the experiment.
Finally, and most importantly, it is difficult to know how engaged the participants are when performing the task. Furthermore, nothing stops them from getting distracted by their own surroundings or how closely they follow the instructions given. The minimum number of correct answers required for payment is the only controlling factor. Nevertheless, observing our results, we can see that following the proposed filtering steps yields cleaner data as shown in our analysis.
6.2 Data Quality Challenges
The texts and questions we are using come from existing datasets, which have their own limitations. Namely, XQuAD (Artetxe et al., 2020) contains open-field questions, which are sometimes formulated in an unclear manner. Furthermore, as these texts are originally collected from Wikipedia, they can contain typos or other text marks, which may cause distraction or confusion. The annotations of the target spans may be ambiguous or only partially correct, which sets an upper bound for human rationale prediction or the correctness classification presented in Section 5.3.2. On the other hand, these texts represent naturally-occurring language, which increases the ecological validity of the experiment. Further, the MECO (Siegelman et al., 2022) corpus contains simple true/false comprehension questions, which in some cases can be answered relying on common sense rather than knowledge acquired by carefully reading the text.
6.3 Future Work
A potential path for improvement is the inclusion of better algorithms to estimate the fixation data. Our proposed approach is simple and performs well when compared to high-quality eye-tracking data. However, it can be improved further with more complex methods, such as correcting the gaze points by taking the line height, the distributions of existing gaze data, or the accuracy and sampling rate of WebGazer into account when performing the fixation cleaning and merging. Finally, as described by Malmaud et al. (2020), the extracted gaze data could be converted into features that can be used in combination with language models, such as BERT (Devlin et al., 2019), to investigate if that leads to more human-like reasoning. Given that our data is collected on texts which contain annotated spans, is it possible to analyze if WebQAmGaze improves the performance and explainability of these models in a QA setting.
7 Conclusion
We present a novel approach to collecting low-cost eye-tracking data while reading from webcam recordings. We compile the WebQAmGaze dataset, which is the first of its kind to include word-level eye movement features. We demonstrate that the data collected reflects linguistic patterns that have been corroborated by previous studies, namely in our comparison with high-quality eye-tracking recordings. We show that webcam eye-tracking can be used to predict the correctness of participants’ responses in a task-specific context, paving the way to a more efficient collection of human rationales for explainable AI. Knowing where readers look can help to explain machine behavior in terms of human cognitive processes (Ikhwantri et al., 2023). Lastly, the online crowd-sourcing approach presents added benefits from a wider population range and ease of access, both physical and in terms of hardware.
References
- Artetxe et al. (2020) Mikel Artetxe, Sebastian Ruder, and Dani Yogatama. 2020. On the cross-lingual transferability of monolingual representations. In Proceedings of the 58th Annual Meeting of the Association for Computational Linguistics, pages 4623–4637.
- Barrett et al. (2018) Maria Barrett, Joachim Bingel, Nora Hollenstein, Marek Rei, and Anders Søgaard. 2018. Sequence Classification with Human Attention. In Proceedings of the 22nd Conference on Computational Natural Language Learning, pages 302–312, Brussels, Belgium. Association for Computational Linguistics.
- Barrett et al. (2016) Maria Barrett, Joachim Bingel, Frank Keller, and Anders Søgaard. 2016. Weakly Supervised Part-of-speech Tagging Using Eye-tracking Data. In Proceedings of the 54th Annual Meeting of the Association for Computational Linguistics (Volume 2: Short Papers), pages 579–584, Berlin, Germany. Association for Computational Linguistics.
- Brandl and Hollenstein (2022) Stephanie Brandl and Nora Hollenstein. 2022. Every word counts: A multilingual analysis of individual human alignment with model attention. In Proceedings of the 2nd Conference of the Asia-Pacific Chapter of the Association for Computational Linguistics and the 12th International Joint Conference on Natural Language Processing (Volume 2: Short Papers), pages 72–77, Online only. Association for Computational Linguistics.
- Chiang and Lee (2022) Cheng-Han Chiang and Hung-Yi Lee. 2022. Re-examining human annotations for interpretable NLP.
- Cop et al. (2017) Uschi Cop, Nicolas Dirix, Denis Drieghe, and Wouter Duyck. 2017. Presenting GECO: An eyetracking corpus of monolingual and bilingual sentence reading. Behavior Research Methods, 49(2):602–615.
- de Leeuw (2015) Joshua R. de Leeuw. 2015. jsPsych: A JavaScript library for creating behavioral experiments in a Web browser. Behavior Research Methods, 47(1):1–12.
- Devlin et al. (2019) Jacob Devlin, Ming-Wei Chang, Kenton Lee, and Kristina Toutanova. 2019. Bert: Pre-training of deep bidirectional transformers for language understanding. In Proceedings of the 2019 Conference of the North American Chapter of the Association for Computational Linguistics: Human Language Technologies, Volume 1 (Long and Short Papers), pages 4171–4186.
- DeYoung et al. (2020) Jay DeYoung, Sarthak Jain, Nazneen Fatema Rajani, Eric Lehman, Caiming Xiong, Richard Socher, and Byron C Wallace. 2020. Eraser: A benchmark to evaluate rationalized nlp models. In Proceedings of the 58th Annual Meeting of the Association for Computational Linguistics, pages 4443–4458.
- Dubey et al. (2020) Neeru Dubey, Simran Setia, Amit Arjun Verma, and S. R.S. Iyengar. 2020. WikiGaze: Gaze-Based Personalized Summarization of Wikipedia Reading Session. In Proceedings of the 3rd Workshop on Human Factors in Hypertext, HUMAN’20, New York, NY, USA. Association for Computing Machinery.
- Eberle et al. (2022) Oliver Eberle, Stephanie Brandl, Jonas Pilot, and Anders Søgaard. 2022. Do transformer models show similar attention patterns to task-specific human gaze? In Proceedings of the 60th Annual Meeting of the Association for Computational Linguistics (Volume 1: Long Papers), pages 4295–4309, Dublin, Ireland. Association for Computational Linguistics.
- Ferhat and Vilariño (2016) Onur Ferhat and Fernando Vilariño. 2016. Low Cost Eye Tracking: The Current Panorama. Computational Intelligence and Neuroscience, 2016:8680541. Publisher: Hindawi Publishing Corporation.
- González-Garduño and Søgaard (2017) Ana Valeria González-Garduño and Anders Søgaard. 2017. Using Gaze to Predict Text Readability. In Proceedings of the 12th Workshop on Innovative Use of NLP for Building Educational Applications, pages 438–443, Copenhagen, Denmark. Association for Computational Linguistics.
- Guan et al. (2022) Xiu Guan, Chaojing Lei, Yingfen Huang, Yu Chen, Hanyue Du, Shuowen Zhang, and Xiang Feng. 2022. An analysis of reading process based on real-time eye-tracking data with web-camera——Focus on English reading at higher education level. In Proceedings of the 4th Workshop on Predicting Performance Based on the Analysis of Reading Behavior.
- Gureckis et al. (2016) Todd M. Gureckis, Jay Martin, John McDonnell, Alexander S. Rich, Doug Markant, Anna Coenen, David Halpern, Jessica B. Hamrick, and Patricia Chan. 2016. psiTurk: An open-source framework for conducting replicable behavioral experiments online. Behavior Research Methods, 48(3):829–842.
- Hollenstein et al. (2020a) Nora Hollenstein, Maria Barrett, and Lisa Beinborn. 2020a. Towards best practices for leveraging human language processing signals for natural language processing. In Proceedings of the Second Workshop on Linguistic and Neurocognitive Resources, pages 15–27, Marseille, France. European Language Resources Association.
- Hollenstein and Beinborn (2021) Nora Hollenstein and Lisa Beinborn. 2021. Relative importance in sentence processing. In Proceedings of the 59th Annual Meeting of the Association for Computational Linguistics and the 11th International Joint Conference on Natural Language Processing (Volume 2: Short Papers), pages 141–150, Online. Association for Computational Linguistics.
- Hollenstein et al. (2020b) Nora Hollenstein, Marius Troendle, Ce Zhang, and Nicolas Langer. 2020b. ZuCo 2.0: A dataset of physiological recordings during natural reading and annotation. In Proceedings of the 12th Language Resources and Evaluation Conference, pages 138–146.
- Hollenstein and Zhang (2019) Nora Hollenstein and Ce Zhang. 2019. Entity recognition at first sight: Improving NER with eye movement information. In Proceedings of the 2019 Conference of the North American Chapter of the Association for Computational Linguistics: Human Language Technologies, Volume 1 (Long and Short Papers), pages 1–10.
- Ikhwantri et al. (2023) Fariz Ikhwantri, Jan Wira Gotama Putra, Hiroaki Yamada, and Takenobu Tokunaga. 2023. Looking deep in the eyes: Investigating interpretation methods for neural models on reading tasks using human eye-movement behaviour. Information Processing & Management, 60(2):103195.
- Just and Carpenter (1980) Marcel A Just and Patricia A Carpenter. 1980. A theory of reading: from eye fixations to comprehension. Psychological review, 87(4):329.
- Lin et al. (2022) Zhongjun Lin, Yinghua Liu, Hui Wang, Zhengji Liu, Sijin Cai, Zhicheng Zheng, Yongjin Zhou, and Xinyu Zhang. 2022. An eye tracker based on webcam and its preliminary application evaluation in Chinese reading tests. Biomedical Signal Processing and Control, 74:103521.
- Luke and Christianson (2018) Steven G. Luke and Kiel Christianson. 2018. The Provo Corpus: A large eye-tracking corpus with predictability norms. Behavior Research Methods, 50(2):826–833.
- Malmaud et al. (2020) Jonathan Malmaud, Roger Levy, and Yevgeni Berzak. 2020. Bridging information-seeking human gaze and machine reading comprehension. In Proceedings of the 24th Conference on Computational Natural Language Learning, pages 142–152.
- Mathias et al. (2021) Sandeep Mathias, Diptesh Kanojia, Abhijit Mishra, and Pushpak Bhattacharyya. 2021. A survey on using gaze behaviour for natural language processing.
- Mishra and Bhattacharyya (2018) Abhijit Mishra and Pushpak Bhattacharyya. 2018. Cognitively inspired natural language processing: An investigation based on eye-tracking. Springer.
- Mishra et al. (2016) Abhijit Mishra, Diptesh Kanojia, Seema Nagar, Kuntal Dey, and Pushpak Bhattacharyya. 2016. Leveraging cognitive features for sentiment analysis. In Proceedings of The 20th SIGNLL Conference on Computational Natural Language Learning, pages 156–166.
- Papoutsaki (2015) Alexandra Papoutsaki. 2015. Scalable Webcam Eye Tracking by Learning from User Interactions. In Proceedings of the 33rd Annual ACM Conference Extended Abstracts on Human Factors in Computing Systems, CHI EA ’15, pages 219–222, New York, NY, USA. Association for Computing Machinery.
- Papoutsaki et al. (2017) Alexandra Papoutsaki, James Laskey, and Jeff Huang. 2017. SearchGazer: Webcam Eye Tracking for Remote Studies of Web Search. In Proceedings of the 2017 Conference on Conference Human Information Interaction and Retrieval, CHIIR ’17, pages 17–26, New York, NY, USA. Association for Computing Machinery.
- Papoutsaki et al. (2016) Alexandra Papoutsaki, Patsorn Sangkloy, James Laskey, Nediyana Daskalova, Jeff Huang, and James Hays. 2016. WebGazer: Scalable Webcam Eye Tracking Using User Interactions. In Proceedings of the 25th International Joint Conference on Artificial Intelligence (IJCAI), pages 3839–3845. AAAI.
- Rajpurkar et al. (2016) Pranav Rajpurkar, Jian Zhang, Konstantin Lopyrev, and Percy Liang. 2016. Squad: 100,000+ questions for machine comprehension of text. In Proceedings of the 2016 Conference on Empirical Methods in Natural Language Processing, pages 2383–2392.
- Siegelman et al. (2022) Noam Siegelman, Sascha Schroeder, Cengiz Acartürk, Hee-Don Ahn, Svetlana Alexeeva, Simona Amenta, Raymond Bertram, Rolando Bonandrini, Marc Brysbaert, Daria Chernova, and others. 2022. Expanding horizons of cross-linguistic research on reading: The Multilingual Eye-movement Corpus (MECO). Behavior research methods, pages 1–21. Publisher: Springer.
- Sood et al. (2020) Ekta Sood, Simon Tannert, Diego Frassinelli, Andreas Bulling, and Ngoc Thang Vu. 2020. Interpreting attention models with human visual attention in machine reading comprehension. In Proceedings of the 24th Conference on Computational Natural Language Learning, pages 12–25.
- Xu et al. (2015) Pingmei Xu, Krista A Ehinger, Yinda Zhang, Adam Finkelstein, Sanjeev R Kulkarni, and Jianxiong Xiao. 2015. Turkergaze: Crowdsourcing saliency with webcam based eye tracking. arXiv preprint arXiv:1504.06755.
- Xu et al. (2009) Songhua Xu, Hao Jiang, and Francis C.M. Lau. 2009. User-Oriented Document Summarization through Vision-Based Eye-Tracking. In Proceedings of the 14th International Conference on Intelligent User Interfaces, IUI ’09, pages 7–16, New York, NY, USA. Association for Computing Machinery.