Classical Novae in the ASKAP Pilot Surveys
Abstract
We present a systematic search for radio counterparts of novae using the Australian Square Kilometer Array Pathfinder (ASKAP). Our search used the Rapid ASKAP Continuum Survey, which covered the entire sky south of declination ( square degrees) at a central frequency of 887.5 MHz, the Variables and Slow Transients Pilot Survey, which covered square degrees per epoch (887.5 MHz), and other ASKAP pilot surveys, which covered square degrees with 2–12 hour integration times. We crossmatched radio sources found in these surveys over a two-year period, from April 2019 to August 2021, with 440 previously identified optical novae, and found radio counterparts for four novae: V5668 Sgr, V1369 Cen, YZ Ret, and RR Tel. Follow-up observations with the Australian Telescope Compact Array confirm the ejecta thinning across all observed bands with spectral analysis indicative of synchrotron emission in V1369 Cen and YZ Ret. Our light-curve fit with the Hubble Flow model yields a value of for the mass ejected in V1369 Cen. We also derive a peak surface brightness temperature of K for YZ Ret. Using Hubble Flow model simulated radio lightcurves for novae, we demonstrate that with a 5 sensitivity limit of 1.5 mJy in 15-min survey observations, we can detect radio emission up to a distance of 4 kpc if ejecta mass is in the range , and upto 1 kpc if ejecta mass is in the range . Our study highlights ASKAP’s ability to contribute to future radio observations for novae within a distance of 1 kpc hosted on white dwarfs with masses , and within a distance of 4 kpc hosted on white dwarfs with masses .
doi:
10.1017/pasa.2020.32ARC Centre of Excellence for Gravitational Wave Discovery (OzGrav), Hawthorn, VIC 3122, Australia \alsoaffiliationARC Centre of Excellence for Gravitational Wave Discovery (OzGrav), Hawthorn, VIC 3122, Australia \alsoaffiliationINAF-Osservatorio Astrofisico di Torino, Strada Osservatorio 20, 10025, Pino Torinese, Italy \alsoaffiliationCollege of Astronomy and Space Sciences, University of the Chinese Academy of Sciences, Beijing 100049, China \alsoaffiliationARC Centre of Excellence for Gravitational Wave Discovery (OzGrav), Hawthorn, VIC 3122, Australia \alsoaffiliationCSIRO Space and Astronomy, PO Box 76, Epping, NSW 1710, Australia \alsoaffiliationARC Centre of Excellence for Gravitational Wave Discovery (OzGrav), Hawthorn, VIC 3122, Australia \alsoaffiliationCSIRO Space and Astronomy, PO Box 76, Epping, NSW 1710, Australia \alsoaffiliationARC Centre of Excellence for Gravitational Wave Discovery (OzGrav), Hawthorn, VIC 3122, Australia \alsoaffiliationCSIRO Space and Astronomy, PO Box 76, Epping, NSW 1710, Australia \publisheddd Mmm YYYY
1 INTRODUCTION
Classical novae are eruption events on the surfaces of accreting white dwarf (WD) binaries (Gallagher & Starrfield, 1978; Bode & Evans, 2012; Warner, 1995). In a semi-detached binary system, Roche lobe overflow from a late type main sequence star accumulates on the WD surface, igniting a thermonuclear fusion reaction (see reviews by Starrfield et al., 1978; Wolf et al., 2013). As a result, the temperature and density at the base of the accreted envelope rise, leading to a thermonuclear runaway that causes of the accreted mass to be ejected along with heavier materials dredged up in the deeper layers of the WD (Gehrz et al., 1998; José & Hernanz, 2007). The ejecta flows out at velocities ranging from 500 to 5000 from the WD surface (Gallagher & Starrfield, 1978; Aydi et al., 2020a) in a roughly spherical shell (Seaquist & Palimaka, 1977) with accompanied asymmetries such as jets, rings, clumping, bipolarities (e.g., Sokoloski et al., 2008; O’Brien et al., 2001; Weston et al., 2016). This eruption event enriches the interstellar medium (Romano et al., 2017) and has a typical energy of – .
From weeks to years post initial optical brightening at mass ejection (Knigge et al., 2011; Shafter, 2017), the remnants of the accreted envelope on the WD surface undergo nuclear burning (Shara et al., 1977). As the resulting luminous ionising radiation from the WD diffuses through the expanding ejecta, the peak of the spectral energy distribution of this photospheric emission from within the envelope shifts to shorter wavelengths (Gallagher & Code, 1974), upto the supersoft X-ray regime through UV (see reviews by Chomiuk et al., 2021b; Della Valle & Izzo, 2020; Poggiani, 2018). Non-thermal GeV gamma ray emission is produced due to relativistic acceleration of charged particles in hadronic or leptonic scenarios that play out between the primary and hypothesised delayed mass ejection in novae (see discussion by Chomiuk et al., 2014; Metzger et al., 2015; Vurm & Metzger, 2018; Acciari et al., 2022). Gamma-ray emission begins hours to days post-eruption and declines on a time-scale of days to weeks.
Radio emission from novae is produced by either free-free thermal radiation powered by the central WD (Seaquist & Palimaka, 1977; Hjellming et al., 1979; Taylor & Seaquist, 1984; Bode & Evans, 2012), or non-thermal radiation from additional emission sources such as shocks (Kantharia, 2012). At first, the dense ejecta stay optically thick at all radio frequencies, and we detect optically thick thermal emission from the shell’s surface, resulting in a radio emission peak. As the ejecta density falls, the radio photosphere recedes through the nova shell, and we detect a mix of optically thick and optically thin thermal emission from deeper layers of the shell. When the photosphere within the envelope begins to shrink due to decreasing ejecta density, the lightcurve turns over and drops until the ejecta become optically thin throughout, resulting in relatively brighter emission at lower frequencies (Bode & Evans, 2012). Thermal emission traces the warm, ionised, expanding ejecta as it remains optically thick to thermal emission at radio frequencies over days to years. Non thermal emission is produced by electron acceleration at shock fronts that emit synchrotron radiation (Vlasov et al., 2016; Weston et al., 2016). Shock heated thermal gas also contributes to thermal emission, although likely in a negligible way (Metzger et al., 2014; Sokolovsky et al., 2023).
Radio lightcurves of novae typically brighten after the optical peak on timescales ranging from a few weeks to a few years, with single or double peaks following from high to low frequencies (Chomiuk et al., 2021b). Following the spectral development of novae at high (Bode & Evans, 2012; Ribeiro et al., 2014) and low frequencies (Kantharia, 2012) shows that the radio emission from novae is consistent with multi-component emission mechanisms: with a free-free thermal component dominant at higher frequencies and a non-thermal synchrotron component, subject to variable absorption dominant at lower frequencies (Steinberg & Metzger, 2020; de Ruiter et al., 2023). This multi-component emission mechanism is also supported in the population study of brightness temperatures in radio detected novae by Chomiuk et al. (2021b).
Radio studies of novae have helped to model the expanding ejecta and its morphology (e.g., Hjellming et al., 1979; Weston, 2016; Taylor et al., 1988), yielding measurements for distances (e.g., V959 Mon; Linford et al., 2015), shell masses (e.g., T Pyx; Nelson et al., 2014) and kinetic energies (e.g., Nova Aquilae; Snijders et al., 1987). Following the discovery of GeV gamma-ray emission from novae (e.g., Abdo et al., 2010; Ackermann et al., 2014; Gordon et al., 2021a; Franckowiak et al., 2018), an increasing number are being targeted at radio wavelengths in large-scale (e.g., Chomiuk et al., 2021b; Bode et al., 1987) and individual follow-up campaigns focused on novae with high optical brightness (e.g., V1500 Cyg; Hjellming et al., 1979), gamma-ray observations (Chomiuk et al., 2014, e.g., V959 Mon;, Finzell et al., 2018, V1324 Sco;), and recurrent nova status (e.g., U Sco; Chomiuk et al., 2021b).
There is still a gap between nova theory (Yaron et al., 2005) and observation (see review by Roy et al., 2012), particularly in terms of the observed and theoretical ejecta masses in different novae sub-types. Similarly, the mechanism of mass ejection is not completely understood, and often models assuming a single impulsive burst (Prialnik, 1986) in a spherical outflow is too simple a geometry to explain observed asymmetries (Weston et al., 2016). Radio observations are ideal tracers of the ejecta mass because the receding radio photospere through the expanding ejecta samples the entire ejecta mass profile by interacting with it. The main reason for the uncertainty in predicting accurate ejecta masses is that the observed population of novae is biased towards the optically brightest, and, recently, gamma-ray loud novae, hence, not representative of the whole population. Furthermore, only a small subset of novae have been observed in the radio bands, mostly as multi-wavelength follow-up. To increase the accuracy of ejecta mass prediction and comparison with theoretical estimates, we need unbiased radio observations.
The Australian Square Kilometre Array Pathfinder (ASKAP) is a widefield radio telescope that images large areas of the radio sky at frequencies between 0.8 and 1.7 GHz (Hotan et al., 2021a). The surveying capability of ASKAP allows for unbiased high cadence radio observations of novae at currently undersampled, lower radio frequencies. In this paper, we use the datasets from multi-epoch widefield surveys, such as the Variable and Slow Transients Pilot Survey (VAST; Murphy et al., 2021) and Rapid ASKAP Continuum survey (RACS; McConnell et al., 2020), to investigate the utility of ASKAP for detecting novae. In Section 2, we describe the nova sample, data acquisition, relevant methodology, and search methods. In Section 3, we report the four novae detected in our search. In Section 4, we discuss the novae detectability in current and future ASKAP surveys; and conclude in Section 5.
| Survey | |||
|---|---|---|---|
|
min | ||
| Rapid ASKAP Continuum survey (RACS)b | min | ||
|
hrs | ||
| Evolutionary Map of the Universe (EMU)d | hrs | ||
|
hrs | ||
| Galactic ASKAP survey (GASKAP)f |
|
||
|
hrs | ||
|
hrs 00footnotetext: aMurphy et al. (2021) bMcConnell et al. (2020) cMeyer (2009) dNorris et al. (2021) eAllison et al. (2021) fDickey et al. (2013) gGaensler et al. (2010) hKoribalski et al. (2020) i15 observation epochs from the VAST survey have been included in this search. |
2 DATA AND METHODOLOGY
2.1 ASKAP data
ASKAP is a widefield radio survey instrument made up of an array of 36 prime focus antennas, located at the CSIRO Murchison Radio-astronomy Observatory in Western Australia (Johnston et al., 2007; Hotan et al., 2021b). Over 2020 – 2022 a number of pilot surveys were carried out with ASKAP, and we have used these as the basis of the work presented here. From 2023, these surveys will continue as ASKAP commences full operations.
We searched for novae radio counterparts in ASKAP data from RACS, VAST, and other surveys listed in Table 1. Except for RACS, all surveys listed in Table 1 have been in the pilot phase so far, and will be continued and expanded in ASKAP’s full surveying mode starting in 2023. RACS covers the entire sky south of declination (McConnell et al., 2020). In this search, we used the first epoch of RACS at 0.888 GHz, RACS-low, conducted in 2019 (declination of to ; McConnell et al., 2020). We also used the second epoch of RACS at 1.367 GHz, RACS-mid, conducted in 2021 (declination of to ; Duchesne et al. submitted) to get an additional measurement for two of our candidates – V1369 Cen and YZ Ret. The VAST project conducted hours of observations in its pilot survey phase. These were spread over multiple epochs, with the goal of detecting transient astronomical phenomena on timescales ranging from 10 seconds to several years (Murphy et al., 2013). We used data from 13 epochs of the VAST pilot survey Phase 1 (VAST-P1) and two epochs of the Phase 2 (VAST-P2 (low)) observations at 0.888 GHz from August 2019 to August 2021 (Murphy et al., 2021). The VAST and RACS surveys have integration times of 12-15 minutes over a total field of view of 5,000 and 34,000 respectively. All the other pilot surveys listed in Table 1 have much longer integration times, , for each field over smaller regions.
2.2 Sample selection
We constructed two samples of novae to search for in the ASKAP surveys. For our first sample, we selected novae from the list maintained by Bill Gray under Project Pluto111https://projectpluto.com/galnovae/galnovae.htm. We included classical novae; objects that were classified as fast novae (NA), slow novae (NB), extremely slow novae (NC), recurrent novae (NR), and those that have not yet been assigned a confirmed classification (for example, NC/ZAND, UG/N?). We excluded objects classified as symbiotic Z Andromedae systems (Z And class), U Gem variables or dwarf novae, X-ray nova systems and variable star types – Mira, UV Ceti, FU Ori and S Dor class. As of July 2021, there are 470 identified classical novae, recurrent novae, and previously unclassified candidate novae systems discovered at optical wavelengths in the Milky Way. Four hundred and forty of those 470 sources occured within the region covered by one or more ASKAP surveys. These 440 objects constitute Sample 1 of our targeted search.
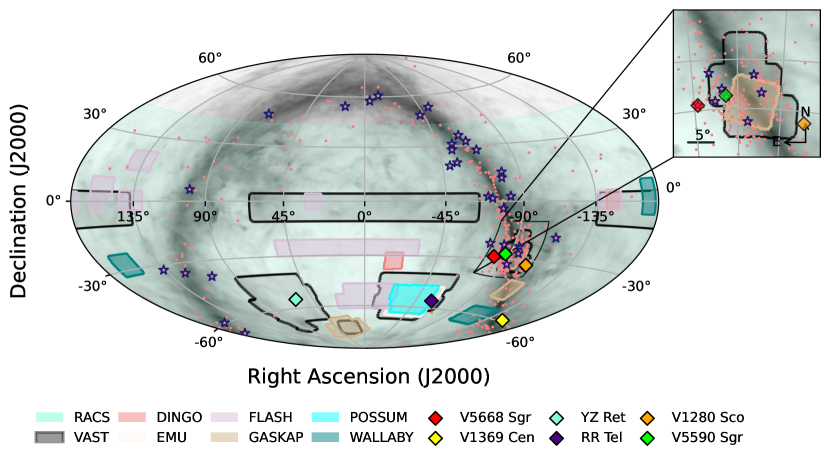
For our second sample we used the dataset of radio observations compiled by Chomiuk et al. (2021b, 2022). This consists of 36 classical or not yet confirmed recurrent novae discovered after 1980, and well-sampled at radio wavelengths. Most of the data is from published and archival unpublished Very Large Array (VLA) datasets, as well as new observations made with the Australian Telescope Compact Array (ATCA). Fig. 1 shows the positions of novae from Samples 1 and 2 in relation to the ASKAP pilot survey footprints222ASKAP pilot survey footprints available at: https://github.com/askap-vast/askap_surveys. For each nova in the samples above, we recorded the discovery date from literature as (refer to Table 2), and plot all times relative to that as in Fig. 2. We additionally recorded the distances, optical variability type and previous multi-wavelength observations from relevant literature for each nova in Section 3.2.
GCVS ID GCVS class RA (J2000) Dec (J2000) (UTC) Observation Date (UTC) (days) Telescope/ Survey (GHz) (mJy) V5668 Sgr N 18:36:56.83 28:55:39.98 2015 Mar 15 2019-04-28 1505 ASKAP/RACS-low 0.9 V1369 Cen NA 13:54:45.35 59:09:04.09 2013 Dec 2 2019-05-06 1981 ASKAP/RACS-low 0.9 2021-02-01 2615 ASKAP/RACS-mid 1.4 2022-02-06 2985 ATCA 2.9 5.5 9.0 16.7 21.2 YZ Ret 03:58:29.55 54:46:41.23 2020 July 15 2020-08-29 45 ASKAP/VAST-P1 0.9 2021-01-24 193 ASKAP/RACS-mid 1.4 2021-07-24 374 ASKAP/VAST-P2 (low) 0.9 2021-08-22 403 0.9 2022-02-06 568 ATCA 2.9 5.5 9.0 2022-03-10 603 5.5 9.0 16.7 21.2 2022-03-18 611 5.5 9.0 16.7 21.2 RR Tel NC/ZAND 20:04:18.54 55:43:33.15 1898 2019-05-06 44168 ASKAP/RACS-low 0.9 2019-08-28 44282 ASKAP/VAST-P1 0.9 2019-10-30 44345 2020-02-01 44439 2020-02-02 44440 2020-08-29 44649 2021-07-22 44976 ASKAP/VAST-P2 (low) 0.9 2021-08-24 45009
2.3 Search method
We searched for radio counterparts by crossmatching (search radius ) the proper motion corrected optical positions from SIMBAD (corrected to date: 2020 July 1) for novae in the two samples with sources catalogued in the surveys in Table 1. We extracted radio data, images, and flux density estimations at the optical nova positions for VAST using VAST Tools333VAST Tools (https://www.vast-survey.org/vast-tools/) is a python module customized to interact with and obtain the VAST Pilot Survey data (Murphy et al., 2021).. We obtained the source finder output catalogues for the other surveys from the CSIRO ASKAP Science Data Archive (CASDA)444https://research.csiro.au/casda/. The signal to noise ratio for detections in the main catalogues is . We also searched for radio counterparts at a lower signal to noise ratio of by measuring the flux density and background noise at each nova position in the extracted image cutouts.
We examined the positional offsets between our candidate radio counterparts and their matched proper-motion-corrected optical progenitor positions to determine whether our potential candidates were genuine counterparts. We also looked for previous radio emission in surveys such as the Very Large Array Sky Survey (Gordon et al., 2021b; Lacy et al., 2020), the National Radio Astronomy Observatory VLA Sky Survey (Condon et al., 1998), the Sydney University Molonglo Sky Survey (Mauch et al., 2003), the second epoch Molonglo Galactic Plane Survey (Murphy et al., 2007), The GMRT 150 MHz All-Sky Radio Survey alternative data release 1 (Intema et al., 2017) and The Galactic and Extra-Galactic All-Sky MWA (Hurley-Walker et al., 2017). Where radio data were available, we checked to see if the potential candidate’s radio flux density in the ASKAP observations was consistent with expected nova evolution (i) in time, i.e., radio lightcurves from earlier radio observations, and (ii) in frequency, i.e., spectral energy distributions from concurrent multi-frequency observations per the evolution of the radio spectral index, (defined as ). Bode & Evans (2012) suggests a spectral index, , approaching 2 for rising optically thick thermal bremsstrahlung and for declining optically thin thermal emission. A steep spectrum of is typical for optically thin synchrotron emission (observed in for example, V3885 Sgr; Körding et al. (2011), GK Persei; Reynolds & Chevalier (1984), RS Oph; Kantharia et al. (2007) and V1723 Aql; Weston et al. (2016)). The late-time transition from rising to a falling spectrum is characterised by one or two spectral breaks (Weston et al., 2016).
We quantified the false-positive rate for chance alignment between optical nova positions and unrelated sources using a Monte Carlo analysis. We took the sample of 470 novae described in §2.2 and offset their positions by a random angle and a random distance between - and calculated the number of detections within a crossmatch radius of for each random offset of the original nova distribution in the RACS survey. Unlike the original distribution, each of the 100 offset distributions with 470 sources produced match (22 distributions had 0 matches, 78 distributions had 1 match) to the 2.1 million radio sources, and no distribution had five positive matches in RACS. This implies a false positive rate of , indicating that the majority of the novae we detected in RACS are real.
3 RESULTS
We found candidate radio counterparts for six novae from Sample 1. All of these were detected in RACS, and two (RR Tel and V5590 Sgr) were also detected in VAST. Two of these six novae (V1369 Cen and V5668 Sgr) are also in Sample 2. We found no detections in the WALLABY, GASKAP, FLASH, DINGO, EMU, and POSSUM surveys.
After further investigation we confirmed radio counterparts for four objects: the extremely slow symbiotic nova RR Tel and the classical novae V1369 Cen, V5668 Sgr, and YZ Ret. All confirmed radio counterparts were spatially consistent with their proper-motion-corrected optical progenitor positions within astrometric errors. The conservative astrometric error for a weak source () in RACS is of the order (see McConnell et al., 2020). Two of the counterparts — those for V1280 Sco and V5590 Sgr — are uncertain, pending further multi-frequency radio observations. These are discussed in A.
Our ASKAP and ATCA observations are summarised in Table 2, and discussed below.
3.1 Follow-up ATCA observations
We observed the radio counterpart of ASKAP-detected nova V1369 Cen on 2022 February 6, with the ATCA (Project code C3363; PI T. Murphy), measuring the flux density at a wide range of frequencies to determine its evolution phase. In addition, based on a tentative detection (Lenc, private communication) in preliminary RACS-mid data, we observed YZ Ret on 2022 February 6, March 10, and March 18 to confirm the ASKAP detection. All our observations used 2048 MHz-wide bands centered on 2.1, 5.5, 9.0, 16.7, and 21.2 GHz, except the last epoch that had a zoom mode observation bandwidth of 58 MHz in the L-band.
We reduced the visibility data using standard routines in MIRIAD (Sault et al., 1995). We used a combination of manual and automatic RFI flagging before calibration, conducted with MIRIAD tasks uvflag and pgflag, respectively. We used PKS 193463 to determine the bandpass response for all frequency bands in all epochs, except the 16.7/21.2 GHz bands. For these two exceptions, we used PKS 0727115 as the bandpass calibrator for the first epoch and PKS 1921293 for the second epoch. We used PKS 193463 to calibrate the flux density scale for all epochs and frequency bands for both sources. For YZ Ret, we used PKS 0334546 to calibrate the time-variable complex gains for all epochs and frequency bands. For V1369 Cen, we used IVS B1338582 to calibrate the gains for the 2.9/5.5/9.0-GHz bands and IVS B1325558 for the 16.7/21.2-GHz bands. After calibration, we inverted the visibilities using a robust weighting of 0.5 and then used the CLEAN algorithm (Clark, 1980) with 250 iterations to the target source field using standard MIRIAD tasks INVERT, CLEAN and RESTOR to obtain the final images.
3.2 Notes on Individual Objects
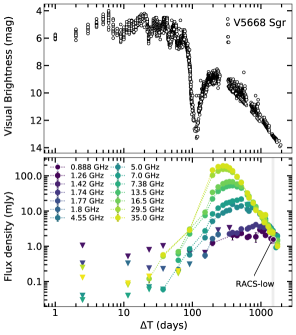
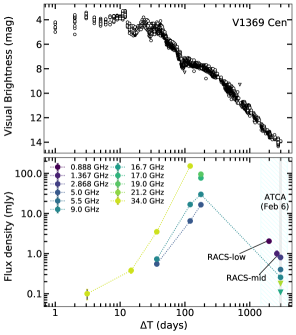
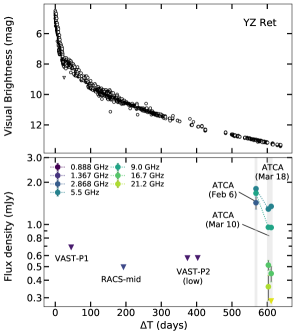
We discuss each source briefly below. Fig. 2, shows the lightcurve for each object, with all available radio data.
3.2.1 V5668 Sgr
V5668 Sgr is a slow-evolving dust-forming classical nova (Harvey et al., 2018; Chomiuk et al., 2021b) discovered by J. Seach on 2015 March 15.634 UT, at a distance of kpc (Gordon et al., 2021a). It is well-sampled at centimetre radio wavelengths with the VLA and ATCA (Chomiuk et al., 2021b), and has near-simultaneous detections in the RACS survey with ASKAP (see Fig. 2 top panel left image). Ejecta morphology and dust formation have been studied for V5668 Sgr at mid- (Gehrz et al., 2015) and near-infrared (Banerjee et al., 2016), X-ray (Gehrz et al., 2018) and millimetre wavelengths (Diaz et al., 2018). The radio counterpart of V5668 Sgr in RACS is offset by .8 from its optical position.
We measured a 0.888 GHz flux density of mJy for V5668 Sgr (1505 days post-discovery in optical). This value agrees with the unbroken power-law extrapolation of flux densities measured in near-simultaneous, higher frequency radio observations with the ATCA at 1500.5 days by Chomiuk et al. (2021b). For the near-simultaneous multi-frequency ASKAP and ATCA detections at this epoch, the peak radio flux density is somewhere between 1.26 and 5 GHz (; ), which indicates that the emission is a mix of optically thick and optically thin thermal emission and at the point of spectral turnover optical depth, . This characteristic indicates that the classical nova V5668 Sgr was in its declining radio evolution phase at the time of our observations.
3.2.2 V1369 Cen
V1369 Cen was discovered in an eruption on 2013 December 2.69 UT by J. Seach at a distance of kpc (Gordon et al., 2021a). It was detected with the ATCA between 2013 Dec 5 and 2014 May 27 in multi-frequency observations (5.5 - 34 GHz) by Bannister et al. (2014); Chomiuk et al. (2021b). It is characterised as a fast radio classical nova by Chomiuk et al. (2021b). Despite multiwavelength studies of the object at near-IR (Mason et al., 2021), UV (Shore et al., 2014), gamma-ray (Cheung et al., 2016), and X-ray wavelengths (Gordon et al., 2021a), radio observations of V1369 Cen around its thermal maximum are limited. The radio counterpart of V1369 Cen in RACS is offset by .9 from its optical position.
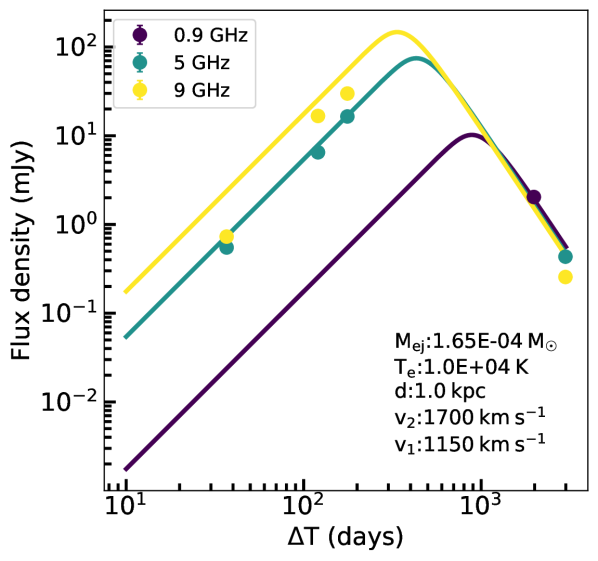
We measured a 0.888 GHz flux density of mJy for V1369 Cen. We also measured a detection for the source in the RACS-mid survey (1.36 GHz). For our 2022 Feb 6 ATCA follow-up observation, we measured a detection at 2.1/5.5/9 GHz and non-detections at 16.7/21.2 GHz (Gulati et al., 2022a). In this epoch, the steep spectral index, , is indicative of synchrotron emission. Peaking of synchrotron radiation, dominant at lower frequencies due to decreasing free-free emission, suggests that the ejecta are optically thin across the observed bands. These characteristics indicate that classical nova V1369 Cen was in its declining radio evolution phase at the time of our observations (see Fig. 2 top panel right image).
We fit a Hubble Flow model555Hubble Flow model available at: https://github.com/askap-vast/source_models (described in Hjellming et al., 1979; Hjellming, 1996; Seaquist & Palimaka, 1977; Seaquist et al., 1980) to multi-frequency radio detections (0.9, 5 and 9 GHz) for V1369 Cen obtained in this work as well as previous works via 666, where is the measured flux density, is the model-fitted flux density at the same observation epoch, and is the measurement error. minimisation between the data and models with ejecta masses ranging between and (see Fig. 3). We assumed that the mass was ejected at the time of the optical discovery. We used model parameters previously derived in literature for V1369 Cen, such as velocities of the inner edge, , and outer edge, , of the expanding shell (Chomiuk et al., 2021b), a constant electron temperature K (Osterbrock, 1974), and assumed pure hydrogen composition (/ = g). The best fit ejecta mass was derived from this fit (, DOF=8) is . When compared to theoretical predictions by Yaron et al. (2005), our derived ejecta mass places the mass of the WD that hosts V1369 Cen’s explosion in the range 1–1.25 .
3.2.3 YZ Ret
YZ Ret is one of the brightest classical novae ( mag), identified by R. H. McNaught (McNaught, 2020) on 2020 July 15.590 UT at a distance of kpc (Bailer-Jones et al., 2018). It is associated with known cataclysmic variable MGAB-V207 and had not been reported as radio-loud until this search.
Following previous multi-wavelength observations (Aydi et al., 2020b; Li et al., 2020; Drake et al., 2020; Sokolovsky et al., 2020; Izzo et al., 2020), we measured a detection for YZ Ret on 2022 Feb 6 at frequencies 2.9/5.5/9 GHz with the ATCA (Gulati et al., 2022b). In this epoch, the peak radio flux density is somewhere between 2.9 and 9 GHz (; ), which indicates that the emission is a mix of optically thick and optically thin thermal emission. Using relations derived by Chomiuk et al. (2021b), we calculated the size of the radio photosphere to be and the corresponding surface brightness temperature to be K. The surface brightness temperature was calculated at the peak of the 5 GHz observations and an outer edge expanding ejecta velocity, , of 2700 (Aydi et al., 2020b). YZ Ret’s surface brightness temperature is within the conservative temperature range for thermal radio emission ( K), supporting the presence of optically thick thermal emission suggested in the spectral analysis of multi-frequency observations in this epoch. However, due to a lack of radio observations prior to our observations, this surface brightness temperature is not calculated at a known thermal maximum, and is insufficient to rule out the presence of non-thermal radio emission from YZ Ret. Thermal emission mechanisms are also suggested for YZ Ret in its study at X-ray wavelengths (Sokolovsky et al., 2022).
For our 2022 Mar 10 follow-up observation, we measured a detection at 5.5/9 GHz and a detection at 16.7/21.2 GHz; for our 2022 Mar 18 observation, we measured a detection at 5.5/9 GHz, a detection at 16.7 GHz, and no detection at 21.2 GHz (Gulati et al., 2022c). We measured steep spectral indices of and for the second and third epochs respectively. The fading of emission at higher frequencies, and the steep spectral index observed at lower frequencies indicates that free-free thermal emission component dominant at higher frequencies has decayed and only the synchrotron emission dominant at lower frequencies is being detected. This suggests that the ejecta are optically thin across the observed bands. Furthermore, the steepening of the spectral index from the second to third epoch suggests energy losses by the synchrotron (Pacholczyk, 1973). These characteristics indicate that the classical nova YZ Ret was in its declining radio evolution phase at the time of our observations (see Fig. 2 bottom panel left image).
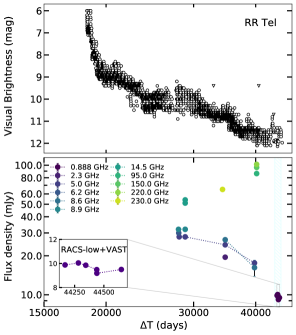
3.2.4 RR Tel
RR Tel is a symbiotic nova that evolves at an extremely slow rate (Nussbaumer & Dumm, 1997) over a period of years to centuries. The analysis of X-ray observations for the nova by González-Riestra et al. (2013) also suggest slow evolution, with the outflow from the WD being a direct result of the eruption even 65 years after the burst in 1944. The radio counterparts of RR Tel in VAST and RACS are offset by .6.1 from its optical position.
Over a year of ASKAP radio observations, RR Tel does not show any significant increase or decrease, as shown by the measured 0.888 GHz flux densities ranging from to mJy (see Fig. 2 bottom panel right image). Nonetheless, when compared to RR Tel detections with the ATCA in 2007 at a 8.6 GHz flux density of mJy and a 4.8 GHz flux density of mJy (Dickey et al., 2021), and previous radio observations at frequencies ranging from 5.0 to 8.9 GHz (Seaquist, 1977; Wright & Allen, 1978; Purton et al., 1982; Ivison et al., 1995; Mocanu et al., 2013), there is a visible trend of prolonged fading in the radio band.
4 DETECTABILITY OF CLASSICAL NOVAE WITH ASKAP
Our results from a targeted search demonstrated we can detect novae in a single epoch of the RACS survey, and in the VAST pilot surveys. In this section, we use previous novae radio studies in conjunction with ASKAP data to investigate the detectability of classical novae in ASKAP’s full surveying mode (across a frequency range of 0.888–1.65 GHz).
GCVS ID T (days) (days) SA (mJy) Sest (mJy) Evolution Phase V357 Mus 478 21.4 Second Peak V906 Car 413 25.4 Rise V5855 Sgr 917 -26.5 Decline V5856 Sgr 915 -29.5 Post Peak V5667 Sgr 1533 -1.5 Post Peak V5668 Sgr 1505 -4.5 ; Decline 66footnotetext: aATCA/VLA data available in Chomiuk et al. (2022). b The spectral indices for V5668 Sgr correspond to 1.26–1.74 and 1.74–7 GHz respectively.
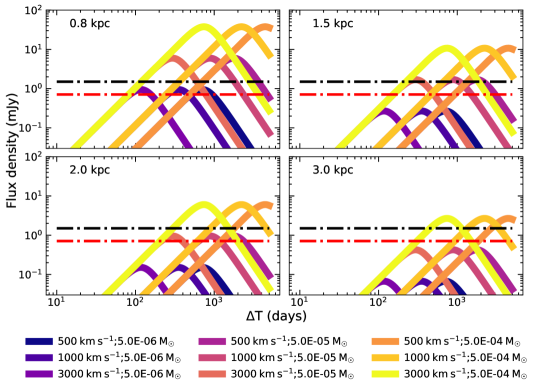
We selected six novae from Sample 2 that had near-simultaneous ASKAP and ATCA/VLA multi-frequency observations. Five of the six novae detected in radio at higher frequencies – V357 Mus, V906 Car, V5855 Sgr, V5856 Sgr, and V5667 Sgr – were undetected with ASKAP at 0.888 GHz (see Table 3). The spectral index scaling of near-simultaneous multi-frequency observations yields flux density estimates, , in the range mJy at 0.888 GHz, which are below ASKAP’s VAST/RACS sensitivity threshold of 1.5 mJy (median RMS 0.326 mJy ). Due to lack of flux-density sensitivity for the limited radio observations at ASKAP frequencies, we simulated radio lightcurves for novae at 1 GHz using average parameters for ejected mass and velocity from Chomiuk et al. (2021a) in the Hubble Flow model. These simulated curves are presented in Fig. 4 in relation with RACS/VAST and a deeper Galactic survey, GASKAP’s 5 sensitivity limits.
As shown in the plots, the greater the mass ejected, the longer the nova eruption would be visible above the VAST or GASKAP 5 sensitivity limits. At 0.8 kpc, novae with in the range are not visible above the VAST detection limit. As the distance of the explosion increases to 3 kpc, only explosions with are detectable above the VAST sensitivity limit. With a 5 sensitivity limit of 1.5 mJy in 15 minute survey observations (RACS and VAST), we can detect radio emission up to a distance of 4 kpc if the ejecta mass is in the range , and upto 1 kpc if ejecta mass is in the range . Since, the mass ejected is inversely proportional to the mass of the WD hosting the explosion, the detectability limit on the ejecta mass puts an upper limit of and on the masses of the white dwarfs that host ASKAP detectable novae explosions at 1 and 4 kpc respectively (Yaron et al., 2005). YZ Ret’s inferred WD mass of in König et al. (2022) at 2.7 kpc is consistent with this ASKAP detectability limit. A higher 5 sensitivity limit of 0.7 mJy in the GASKAP survey, focused on the Galactic plane, will be useful for detecting radio emission from nova explosions hosted on higher mass host white dwarfs () that eject material .
Fig. 4 also shows that as ejecta velocity, , increases, the radio thermal maximum peaks earlier and spends less time above the 5 sensitivity limits (see Table LABEL:simsimchar). At 0.8 kpc, novae with in the range spend days above the RACS/VAST 5 limit where the greater number of days correspond to lower velocities (). As the distance of explosion increases to 3 kpc, for the same , the time spent above the RACS/VAST 5 limit is days. For faster novae (), we would need one epoch of radio sky surveying per 2 months since the minimum time detectable above the higher sensitivity GASKAP 5 limit in the curves simulated for the lowest is 72 days (see Table LABEL:simsimchar). VAST surveys, with their multi-epoch surveying strategy covering 265 on the Galactic centre, would be the best ASKAP survey to capture fast novae. The Galactic centre has high dust concentration along its line of sight (see Fig. 1), implying pronounced reddening and higher optical extinction (Planck Collaboration et al., 2014). This region is, therefore, particularly suited for radio searches of novae with VAST.
Along with nova ejecta characteristics, and survey sensitivities, novae will of course only be detectable if they are within the sky coverage of a given survey. From the current pilot surveys listed in Table 1, the three surveys that cover the highest percentage of all previous nova eruptions are RACS (93.6%), VAST (31.9%) and GASKAP (14.1%). Single epoch ASKAP detections, from all-sky surveys such as RACS, will be useful for multi-frequency radio follow-up observations with other telescopes such as the ATCA, as demonstrated for the case of YZ Ret in Section 3.
Because of the irregular cadence for pilot survey observations used in this work, multiwavelength data was required to determine radio counterparts. Future ASKAP surveys will increase the number of novae with radio lightcurves, allowing spectral and temporal modeling. Radio detections could also overcome extinction effects and gaps in optical novae monitoring, which account for a large discrepancy of novae between observed and theoretical discovery rates per year (Shafter, 2017; De et al., 2021). For example, VVV-WIT-01 was classified as a classical nova using only radio and IR multiwavelength analysis, with no detection in optical (Lucas et al., 2020). The availability of a statistically robust sample of novae observed in radio would also aid in more accurate ejecta mass predictions. While our targeted search did not uncover radio rebrightening from recurrent novae, data from routine ASKAP surveys will allow these experiments to enable insights about their ejecta masses and spectral signatures (for e.g., RS Oph; Cheung et al., 2022).
We have primarily considered the discovery rate of novae due to thermal emission, which can be faint at low radio frequencies ( GHz) even when not absorbed, as evidenced by the ASKAP non-detections for all novae in their optically thick thermal emission phase in Table 3. Furthermore, spectral index analysis for our detected novae in Section 3 reveals that when the ejecta is optically thin, we identify non-thermal synchrotron emission for V1369 Cen and YZ Ret. This is consistent with previous observations of novae systems at low frequencies (Kantharia, 2012; Weston et al., 2016; de Ruiter et al., 2023). As long as the thermally-emitting material is not optically thick, synchrotron emission can be brighter at lower frequencies, and is present in 25% of the radio novae examined in Chomiuk et al. (2021b), with a hypothesised upper limit of 100%. ASKAP observations of radio emission from novae at lower frequencies could help place strict limitations on the fraction of novae that generate synchrotron radiation. This will advance our understanding of the luminosity and timing of non-thermal components in novae explosions and aid in understanding how frequently these contribute to the observed diversity in radio lightcurves and, thereby, reflect the shock energetics of novae. Low-frequency VAST lightcurves, combined with high-frequency observations, could prove useful for studying different regions and physics of the nova system (see review by Kantharia, 2012).
5 CONCLUSIONS
We have completed the first systematic search for radio counterparts of 440 classical novae previously identified in optical at centimetre wavelengths using RACS, VAST and other ASKAP pilot surveys. We identified three known radio classical novae, and one with no previous radio detection. The detection of V1369 Cen, V5668 Sgr, and YZ Ret, all in their declining optically thin phase, and RR Tel in its ongoing slow variability phase, demonstrates ASKAP’s sensitivity to classical nova detection. We conducted ATCA observations of V1369 Cen and YZ Ret which indicate the presence of optically thin synchrotron component dominant at lower frequencies from the computed spectral indices. The multi-frequency observations also helped fit an ejecta mass of for V1369 Cen; and strengthen the hypothesis for optically thick thermal radio emission from YZ Ret in the first observed epoch.
The surveying nature of ASKAP observations eliminate the need for large-scale radio campaigns across decades as follow-up observations can be conducted for those detectable with ASKAP, for example, monitoring detections for novae with host WD masses in the range , that erupt within a distance of 1 kpc in 1.5 mJy (5) flux density sensitivity surveys. Single-epoch detections of previously identified optical novae with observed false-positive rates of , combined with multi-frequency follow-up strategy using other radio telescopes, could enable observations of novae near thermal radio maximum, as well as potential easier discovery of recurrent novae. Multi epoch VAST surveys with a region covering the optically extinct Galactic centre line of sight is well suited for radio searches of highly reddened novae with ASKAP. Detection and classification of the radio emission mechanism at ASKAP frequencies could aid the study of relative timing and luminosity of the components in the multi-component emission mechanism in novae and help understand underlying shock energetics.
The extension and application of this search method to surveys conducted at higher ASKAP frequencies of 1.36 and 1.65 GHz with a more complete novae list that includes progenitors discovered in UV/IR searches (De et al., 2021) and from space based optical telescopes (Mandel et al., 2023) will help better understand the scope of novae detectability with ASKAP. The position of the survey region on the sky, survey cadence, and survey flux density sensitivity are essential factors to consider when designing campaigns for targeting novae in the future. These observations will provide an opportunity to improve nova population statistics and study associated nova physics. To better understand the implications of these results, an unbiased search for a year’s worth of ASKAP data can be conducted when the full surveys begin.
We thank the referee for their helpful comments. AG, JL and JP are supported by Australian Government Research Training Program Scholarships. DK is supported by NSF grant AST-1816492. RS acknowledges grant number 12073029 from the National Natural Science Foundation of China (NSFC). Parts of this research were conducted by the Australian Research Council Centre of Excellence for Gravitational Wave Discovery (OzGrav), project number CE170100004.
This scientific work uses data obtained from Inyarrimanha Ilgari Bundara / the Murchison Radio-astronomy Observatory. We acknowledge the Wajarri Yamaji People as the Traditional Owners and native title holders of the Observatory site. CSIRO’s Australian Square Kilometre Array Pathfinder radio telescope is part of the Australia Telescope National Facility. Operation of ASKAP is funded by the Australian Government with support from the National Collaborative Research Infrastructure Strategy. ASKAP uses the resources of the Pawsey Supercomputing Research Centre. Establishment of ASKAP, Inyarrimanha Ilgari Bundara, the CSIRO Murchison Radio-astronomy Observatory and the Pawsey Supercomputing Research Centre are initiatives of the Australian Government, with support from the Government of Western Australia and the Science and Industry Endowment Fund. The Australia Telescope Compact Array is part of the Australia Telescope National Facility which is funded by the Australian Government for operation as a National Facility managed by CSIRO. We acknowledge the Gomeroi people as the Traditional Owners of the Observatory site.
References
- Abdo et al. (2010) Abdo, A. A., Ackermann, M., Ajello, M., et al. 2010, Science, 329, 817
- Acciari et al. (2022) Acciari, V. A., Ansoldi, S., Antonelli, L. A., et al. 2022, Nature Astronomy, 6, 689
- Ackermann et al. (2014) Ackermann, M., Ajello, M., Albert, A., et al. 2014, Science, 345, 554
- Allison et al. (2021) Allison, J. R., Sadler, E. M., Amaral, A. D., et al. 2021, arXiv e-prints, arXiv:2110.00469
- Astropy Collaboration et al. (2013) Astropy Collaboration, Robitaille, T. P., Tollerud, E. J., et al. 2013, A&A, 558, A33
- Ayani et al. (2012) Ayani, K., Fujii, M., & Maeno, S. 2012, Central Bureau Electronic Telegrams, 3140, 2
- Aydi et al. (2020a) Aydi, E., Chomiuk, L., Izzo, L., et al. 2020a, ApJ, 905, 62
- Aydi et al. (2020b) Aydi, E., Buckley, D. A. H., Chomiuk, L., et al. 2020b, The Astronomer’s Telegram, 13867, 1
- Bailer-Jones et al. (2018) Bailer-Jones, C. A. L., Rybizki, J., Fouesneau, M., Mantelet, G., & Andrae, R. 2018, AJ, 156, 58
- Banerjee et al. (2016) Banerjee, D. P. K., Srivastava, M. K., Ashok, N. M., & Venkataraman, V. 2016, MNRAS, 455, L109
- Bannister et al. (2014) Bannister, K. W., Chomiuk, L., Rupen, M., & Sokoloski, J. 2014, The Astronomer’s Telegram, 6058, 1
- Bode & Evans (2012) Bode, M. F., & Evans, A. 2012, Classical Novae
- Bode et al. (1987) Bode, M. F., Seaquist, E. R., & Evans, A. 1987, MNRAS, 228, 217
- Chesneau et al. (2012) Chesneau, O., Lagadec, E., Otulakowska-Hypka, M., et al. 2012, A&A, 545, A63
- Cheung et al. (2016) Cheung, C. C., Jean, P., Shore, S. N., et al. 2016, ApJ, 826, 142
- Cheung et al. (2022) Cheung, C. C., Johnson, T. J., Jean, P., et al. 2022, ApJ, 935, 44
- Chomiuk et al. (2021a) Chomiuk, L., Metzger, B. D., & Shen, K. J. 2021a, ARA&A, 59, arXiv:2011.08751
- Chomiuk et al. (2014) Chomiuk, L., Linford, J. D., Yang, J., et al. 2014, Nature, 514, 339
- Chomiuk et al. (2021b) Chomiuk, L., Linford, J. D., Aydi, E., et al. 2021b, ApJS, 257, 49
- Chomiuk et al. (2022) —. 2022, VizieR Online Data Catalog, J/ApJS/257/49
- Clark (1980) Clark, B. G. 1980, A&A, 89, 377
- Condon et al. (1998) Condon, J. J., Cotton, W. D., Greisen, E. W., et al. 1998, AJ, 115, 1693
- De et al. (2021) De, K., Kasliwal, M. M., Hankins, M. J., et al. 2021, ApJ, 912, 19
- de Ruiter et al. (2023) de Ruiter, I., Nyamai, M. M., Rowlinson, A., et al. 2023, arXiv e-prints, arXiv:2301.10552
- Della Valle & Izzo (2020) Della Valle, M., & Izzo, L. 2020, A&A Rev., 28, 3
- Diaz et al. (2018) Diaz, M. P., Abraham, Z., Ribeiro, V. A. R. M., Beaklini, P. P. B., & Takeda, L. 2018, MNRAS, 480, L54
- Dickey et al. (2021) Dickey, J. M., Weston, J. H. S., Sokoloski, J. L., Vrtilek, S. D., & McCollough, M. 2021, ApJ, 911, 30
- Dickey et al. (2013) Dickey, J. M., McClure-Griffiths, N., Gibson, S. J., et al. 2013, PASA, 30, e003
- Drake et al. (2020) Drake, J. J., Orio, M., Bearmore, A., et al. 2020, The Astronomer’s Telegram, 14214, 1
- Duerbeck (1981) Duerbeck, H. W. 1981, PASP, 93, 165
- Finzell et al. (2018) Finzell, T., Chomiuk, L., Metzger, B. D., et al. 2018, ApJ, 852, 108
- Franckowiak et al. (2018) Franckowiak, A., Jean, P., Wood, M., Cheung, C. C., & Buson, S. 2018, A&A, 609, A120
- Gaensler et al. (2010) Gaensler, B. M., Landecker, T. L., Taylor, A. R., & POSSUM Collaboration. 2010, in American Astronomical Society Meeting Abstracts, Vol. 215, American Astronomical Society Meeting Abstracts #215, 470.13
- Gallagher & Code (1974) Gallagher, J. S., I., & Code, A. D. 1974, ApJ, 189, 303
- Gallagher & Starrfield (1978) Gallagher, J. S., & Starrfield, S. 1978, ARA&A, 16, 171
- Gehrz et al. (1998) Gehrz, R. D., Truran, J. W., Williams, R. E., & Starrfield, S. 1998, PASP, 110, 3
- Gehrz et al. (2015) Gehrz, R. D., Evans, A., Woodward, C. E., et al. 2015, The Astronomer’s Telegram, 7862, 1
- Gehrz et al. (2018) —. 2018, ApJ, 858, 78
- González-Riestra et al. (2013) González-Riestra, R., Selvelli, P., & Cassatella, A. 2013, A&A, 556, A85
- Gordon et al. (2021a) Gordon, A. C., Aydi, E., Page, K. L., et al. 2021a, ApJ, 910, 134
- Gordon et al. (2021b) Gordon, Y. A., Boyce, M. M., O’Dea, C. P., et al. 2021b, ApJS, 255, 30
- Gulati et al. (2022a) Gulati, A., Murphy, T., Wang, Y., Leung, J., & Lenc, E. 2022a, The Astronomer’s Telegram, 15310, 1
- Gulati et al. (2022b) Gulati, A., Murphy, T., Wang, Y., et al. 2022b, The Astronomer’s Telegram, 15264, 1
- Gulati et al. (2022c) —. 2022c, The Astronomer’s Telegram, 15301, 1
- Harris et al. (2020) Harris, C. R., Millman, K. J., van der Walt, S. J., et al. 2020, Nature, 585, 357
- Harvey et al. (2018) Harvey, E. J., Redman, M. P., Darnley, M. J., et al. 2018, A&A, 611, A3
- Hjellming (1996) Hjellming, R. M. 1996, in Astronomical Society of the Pacific Conference Series, Vol. 93, Radio Emission from the Stars and the Sun, ed. A. R. Taylor & J. M. Paredes, 174
- Hjellming et al. (1979) Hjellming, R. M., Wade, C. M., Vandenberg, N. R., & Newell, R. T. 1979, AJ, 84, 1619
- Hotan et al. (2021a) Hotan, A. W., Bunton, J. D., Chippendale, A. P., et al. 2021a, PASA, 38, e009
- Hotan et al. (2021b) Hotan, A. W., et al. 2021b, PASA, 38, e009
- Hunter (2007) Hunter, J. D. 2007, Computing in Science and Engineering, 9, 90
- Hurley-Walker et al. (2017) Hurley-Walker, N., Callingham, J. R., Hancock, P. J., et al. 2017, MNRAS, 464, 1146
- Intema et al. (2017) Intema, H. T., Jagannathan, P., Mooley, K. P., & Frail, D. A. 2017, A&A, 598, A78
- Ivison et al. (1995) Ivison, R. J., Seaquist, E. R., Schwarz, H. E., Hughes, D. H., & Bode, M. F. 1995, MNRAS, 273, 517
- Izzo et al. (2020) Izzo, L., Molaro, P., Aydi, E., et al. 2020, The Astronomer’s Telegram, 14048, 1
- Johnston et al. (2007) Johnston, S., Bailes, M., Bartel, N., et al. 2007, PASA, 24, 174
- José & Hernanz (2007) José, J., & Hernanz, M. 2007, Journal of Physics G Nuclear Physics, 34, R431
- Kafka (2021) Kafka, S. 2021, Observations from the AAVSO International Database
- Kantharia (2012) Kantharia, N. G. 2012, Bulletin of the Astronomical Society of India, 40, 311
- Kantharia et al. (2007) Kantharia, N. G., Anupama, G. C., Prabhu, T. P., et al. 2007, ApJ, 667, L171
- Knigge et al. (2011) Knigge, C., Baraffe, I., & Patterson, J. 2011, ApJS, 194, 28
- König et al. (2022) König, O., Wilms, J., Arcodia, R., et al. 2022, Nature, 605, 248
- Körding et al. (2011) Körding, E. G., Knigge, C., Tzioumis, T., & Fender, R. 2011, MNRAS, 418, L129
- Koribalski et al. (2020) Koribalski, B. S., Staveley-Smith, L., Westmeier, T., et al. 2020, Ap&SS, 365, 118
- Lacy et al. (2020) Lacy, M., et al. 2020, PASP, 132, 035001
- Li et al. (2020) Li, K.-L., Kong, A., Aydi, E., et al. 2020, The Astronomer’s Telegram, 13868, 1
- Linford et al. (2015) Linford, J. D., Ribeiro, V. A. R. M., Chomiuk, L., et al. 2015, ApJ, 805, 136
- Lucas et al. (2020) Lucas, P. W., Minniti, D., Kamble, A., et al. 2020, MNRAS, 492, 4847
- Mandel et al. (2023) Mandel, S., Shara, M. M., Zurek, D., Conroy, C., & van Dokkum, P. 2023, MNRAS, 518, 5279
- Mason et al. (2021) Mason, E., Shore, S. N., Drake, J., et al. 2021, A&A, 649, A28
- Mauch et al. (2003) Mauch, T., Murphy, T., Buttery, H. J., et al. 2003, MNRAS, 342, 1117
- McConnell et al. (2020) McConnell, D., Hale, C. L., Lenc, E., et al. 2020, PASA, 37, e048
- McNaught (2020) McNaught, R. H. 2020, Central Bureau Electronic Telegrams, 4811,1
- Metzger et al. (2015) Metzger, B. D., Finzell, T., Vurm, I., et al. 2015, MNRAS, 450, 2739
- Metzger et al. (2014) Metzger, B. D., Hascoët, R., Vurm, I., et al. 2014, MNRAS, 442, 713
- Meyer (2009) Meyer, M. 2009, in Panoramic Radio Astronomy: Wide-field 1-2 GHz Research on Galaxy Evolution, 15
- Mocanu et al. (2013) Mocanu, L. M., Crawford, T. M., Vieira, J. D., et al. 2013, ApJ, 779, 61
- Mróz et al. (2014) Mróz, P., Poleski, R., Udalski, A., et al. 2014, MNRAS, 443, 784
- Murphy et al. (2007) Murphy, T., Mauch, T., Green, A., et al. 2007, MNRAS, 382, 382
- Murphy et al. (2013) Murphy, T., et al. 2013, PASA, 30, e006
- Murphy et al. (2021) Murphy, T., Kaplan, D. L., Stewart, A. J., et al. 2021, PASA, 38, e054
- Nakano et al. (2012) Nakano, S., Itagaki, K., Kaneda, H., et al. 2012, Central Bureau Electronic Telegrams, 3140, 1
- Nelson et al. (2014) Nelson, T., Chomiuk, L., Roy, N., et al. 2014, ApJ, 785, 78
- Ness et al. (2009) Ness, J. U., Schwarz, G., Woodward, C. E., et al. 2009, The Astronomer’s Telegram, 2063, 1
- Norris et al. (2021) Norris, R. P., Marvil, J., Collier, J. D., et al. 2021, PASA, 38, e046
- Nussbaumer & Dumm (1997) Nussbaumer, H., & Dumm, T. 1997, A&A, 323, 387
- O’Brien et al. (2001) O’Brien, T. J., Davis, R. J., Bode, M. F., Eyres, S. P. S., & Porter, J. M. 2001, in Galaxies and their Constituents at the Highest Angular Resolutions, ed. R. T. Schilizzi, Vol. 205, 260
- Osterbrock (1974) Osterbrock, D. E. 1974, Astrophysics of gaseous nebulae
- Pacholczyk (1973) Pacholczyk, A. G. 1973, Radio astrophysics. Non-thermal processes in galactic and extragalactic sources.
- Planck Collaboration et al. (2014) Planck Collaboration, Abergel, A., Ade, P. A. R., et al. 2014, A&A, 571, A11
- Poggiani (2018) Poggiani, R. 2018, in Accretion Processes in Cosmic Sources - II, 57
- Prialnik (1986) Prialnik, D. 1986, ApJ, 310, 222
- Purton et al. (1982) Purton, C. R., Feldman, P. A., Marsh, K. A., Allen, D. A., & Wright, A. E. 1982, MNRAS, 198, 321
- Reynolds & Chevalier (1984) Reynolds, S. P., & Chevalier, R. A. 1984, ApJ, 281, L33
- Ribeiro et al. (2014) Ribeiro, V. A. R. M., Chomiuk, L., Munari, U., et al. 2014, ApJ, 792, 57
- Romano et al. (2017) Romano, D., Matteucci, F., Zhang, Z. Y., Papadopoulos, P. P., & Ivison, R. J. 2017, MNRAS, 470, 401
- Roy et al. (2012) Roy, N., Chomiuk, L., Sokoloski, J. L., et al. 2012, Bulletin of the Astronomical Society of India, 40, 293
- Sault et al. (1995) Sault, R. J., Teuben, P. J., & Wright, M. C. H. 1995, in Astronomical Society of the Pacific Conference Series, Vol. 77, Astronomical Data Analysis Software and Systems IV, ed. R. A. Shaw, H. E. Payne, & J. J. E. Hayes, 433
- Seaquist (1977) Seaquist, E. R. 1977, ApJ, 211, 547
- Seaquist et al. (1980) Seaquist, E. R., Duric, N., Israel, F. P., et al. 1980, AJ, 85, 283
- Seaquist & Palimaka (1977) Seaquist, E. R., & Palimaka, J. 1977, ApJ, 217, 781
- Shafter (2017) Shafter, A. W. 2017, ApJ, 834, 196
- Shara et al. (1977) Shara, M. M., Prialnik, D., & Shaviv, G. 1977, A&A, 61, 363
- Shore et al. (2014) Shore, S. N., Schwarz, G. J., Walter, F. M., et al. 2014, The Astronomer’s Telegram, 6413, 1
- Snijders et al. (1987) Snijders, M. A. J., Batt, T. J., Roche, P. F., et al. 1987, MNRAS, 228, 329
- Sokoloski et al. (2008) Sokoloski, J. L., Rupen, M. P., & Mioduszewski, A. J. 2008, ApJ, 685, L137
- Sokolovsky et al. (2020) Sokolovsky, K., Aydi, E., Chomiuk, L., et al. 2020, The Astronomer’s Telegram, 14043, 1
- Sokolovsky et al. (2022) Sokolovsky, K. V., Li, K.-L., Lopes de Oliveira, R., et al. 2022, MNRAS, 514, 2239
- Sokolovsky et al. (2023) Sokolovsky, K. V., Johnson, T. J., Buson, S., et al. 2023, arXiv e-prints, arXiv:2302.03043
- Starrfield et al. (1978) Starrfield, S., Truran, J. W., & Sparks, W. M. 1978, ApJ, 226, 186
- Steinberg & Metzger (2020) Steinberg, E., & Metzger, B. 2020, MNRAS, 491, 4232
- Taylor et al. (1988) Taylor, A. R., Hjellming, R. M., Seaquist, E. R., & Gehrz, R. D. 1988, Nature, 335, 235
- Taylor & Seaquist (1984) Taylor, A. R., & Seaquist, E. R. 1984, ApJ, 286, 263
- Vlasov et al. (2016) Vlasov, A., Vurm, I., & Metzger, B. D. 2016, MNRAS, 463, 394
- Vurm & Metzger (2018) Vurm, I., & Metzger, B. D. 2018, ApJ, 852, 62
- Warner (1995) Warner, B. 1995, Cataclysmic variable stars, Vol. 28
- Wenger et al. (2000) Wenger, M., Ochsenbein, F., Egret, D., et al. 2000, A&AS, 143, 9
- Weston (2016) Weston, J. H. S. 2016, PhD thesis, Columbia University, New York
- Weston et al. (2016) Weston, J. H. S., Sokoloski, J. L., Metzger, B. D., et al. 2016, MNRAS, 457, 887
- Wolf et al. (2013) Wolf, W. M., Bildsten, L., Brooks, J., & Paxton, B. 2013, ApJ, 777, 136
- Wright & Allen (1978) Wright, A. E., & Allen, D. A. 1978, MNRAS, 184, 893
- Yamaoka et al. (2007) Yamaoka, H., Nakamura, Y., Nakano, S., Sakurai, Y., & Kadota, K. 2007, IAU Circ., 8803, 1
- Yaron et al. (2005) Yaron, O., Prialnik, D., Shara, M. M., & Kovetz, A. 2005, ApJ, 623, 398
Appendix A Uncertain Nova Counterparts
In §3, we ruled two out of the six nova radio counterpart candidates as uncertain. For each candidate we provide an explanation; further observations would be required to confirm these as counterparts.
V1280 Sco is an extremely slow evolving classical nova that was discovered in an outburst on 2007 February 4.8 by Yamaoka et al. (2007) at a distance of kpc (Ness et al., 2009). Its matched radio source in RACS detected at a significance flux density of mJy is .3 offset from its optical position at 4,469 days post-discovery (). An ejecta expansion velocity of (Chesneau et al., 2012) gives an ejecta radius of . The lack of previously confirmed radio observations, a single epoch detection in RACS, inconsistency of ejecta radius with optical radio offset (.5 differential) make it difficult to assert whether V1280 Sco’s radio counterpart is related to it, hence, we ruled its radio counterpart as uncertain.
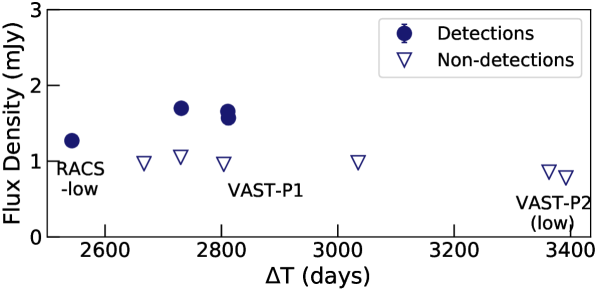
V5590 Sgr is a candidate Type D symbiotic nova candidate (Mróz et al., 2014) announced in 2012 (Ayani et al., 2012; Nakano et al., 2012). Its matched radio source in VAST and RACS was not detected in all epochs of our search (see Fig 5). Despite its spatial consistency with the nova optical position (.5 offset), the near-detection limit 35 detections, lack of previous multiwavelength observations and confirmed radio detections make it difficult to assert whether its radio counterpart is related to the nova or is some unrelated background source, hence, we ruled its radio counterpart as uncertain.
Appendix B Simulated Radio Lightcurve Charcteristics
In Table LABEL:simsimchar, we give the nova ejecta parameters from Fig 4 along with corresponding lightcurve characteristics.
(kpc) () () (mJy) (days) (days) (days) 0.8 5e-6 500.0 0.95 704.0 0.0 438.0 1000.0 0.95 352.0 0.0 219.0 3000.0 0.95 117.0 0.0 72.0 5e-5 500.0 5.98 1768.0 2920.0 4230.0 1000.0 5.98 884.0 1460.0 2115.0 3000.0 5.98 294.0 486.0 705.0 5e-4 500.0 37.71 4440.0 4286.0 4512.0 1000.0 37.71 2220.0 4643.0 4756.0 3000.0 37.71 740.0 2718.0 3578.0 1.5 5e-6 500.0 0.27 704.0 0.0 0.0 1000.0 0.27 352.0 0.0 0.0 3000.0 0.27 117.0 0.0 0.0 5e-5 500.0 1.7 1768.0 680.0 2122.0 1000.0 1.7 884.0 340.0 1061.0 3000.0 1.7 294.0 113.0 353.0 5e-4 500.0 10.73 4440.0 3661.0 4085.0 1000.0 10.73 2220.0 4330.0 4542.0 3000.0 10.73 740.0 1636.0 2252.0 2.0 5e-6 500.0 0.15 704.0 0.0 0.0 1000.0 0.15 352.0 0.0 0.0 3000.0 0.15 117.0 0.0 0.0 5e-5 500.0 0.96 1768.0 0.0 1121.0 1000.0 0.96 884.0 0.0 560.0 3000.0 0.96 294.0 0.0 187.0 5e-4 500.0 6.03 4440.0 3214.0 3780.0 1000.0 6.03 2220.0 3686.0 4390.0 3000.0 6.03 740.0 1228.0 1778.0 3.0 5e-6 500.0 0.07 704.0 0.0 0.0 1000.0 0.07 352.0 0.0 0.0 3000.0 0.07 117.0 0.0 0.0 5e-5 500.0 0.42 1768.0 0.0 0.0 1000.0 0.42 884.0 0.0 0.0 3000.0 0.42 294.0 0.0 0.0 5e-4 500.0 2.68 4440.0 2299.0 3170.0 1000.0 2.68 2220.0 2031.0 3587.0 3000.0 2.68 740.0 677.0 1195.0