Interplay of many-body interactions and quasiperiodic disorder in the all-band-flat diamond chain
Abstract
We study the effects of quasiperiodic Aubry-André (AA) disorder and interactions on a one-dimensional all-band-flat (ABF) diamond chain. We consider the application of disorder in two ways: a symmetric one, where the same disorder is applied to the top and bottom sites of a unit cell, and an antisymmetric one, where the disorder applied to the top and bottom sites are of equal magnitude but with opposite signs. The single-particle wave-packet dynamics for the clean system and when the disorder is applied symmetrically show quantum caging; in the antisymmetric case, the wave-packet spreads over the entire lattice. These results agree with our previous work, where compact localization was observed in the case of the clean system and for symmetrically disordered diamond lattices. In the presence of nearest-neighbour interactions, nonergodic phases are observed in the case of a clean system and symmetrical disorder; at higher disorder strengths, we find an MBL-like phase in the symmetric case. However, many-body non-equilibrium dynamics of the system from carefully engineered initial states exhibit quantum caging. In the antisymmetric case, a nonergodic mixed phase, a thermal phase and an MBL-like phases, respectively, are observed at low, intermediate and high disorder strengths. We observe an absence of caging and initial state dependence (except at the intermediate disorder strength) in the study of non-equilibrium dynamics.
I INTRODUCTION
Flat band (FB) systems, which are characterized by highly degenerate energy levels and support compact localized eigenstates (CLS) [1, 2], has been a subject of great interest over the last decade [3, 4, 5, 6, 7], although the concepts are older where the term Aharanov Bohm (AB) caging [8, 9, 10, 11] has been used. Compact localized states span strictly over a few unit cells, with zero probability amplitude elsewhere in contrast to Anderson localization [12], where the ‘spread’ of a state dies down exponentially. While Anderson localization observed in non-interacting disordered systems is now a mature topic with a large body of literature around it, the localization characteristics of quantum systems in the presence of both disorder and interactions [13, 14, 15, 16, 17, 43] is an actively evolving area of research. A prominent example is the phenomenon of many-body localization (MBL) [18, 19, 20, 21, 22, 23, 24] where the system fails to thermalize even in the presence of interactions. Translationally invariant single-particle flat band networks coupled with many-body interactions have also recently gained a lot of attention [25, 26, 27, 28, 29, 30]. These models exhibit nonergodic behaviour with a lack of transport of particles for any interaction strength exhibiting many-body flat band localization (MBFBL) [26, 30]. This naturally motivates the study of flat band systems subjected to both disorder and interactions [31, 32, 33].
In one of our previous works [31], we systematically investigated the effects of turning on interactions in the presence of uniform disorder on the all-band-flat (ABF) diamond chain. This model shows a nonergodic mixed phase at low disorder strength, separated from the MBL phase at high disorder strength by a thermal phase at intermediate disorder strength. The addition of disorder to flat-band systems is known to yield exotic behavior [34, 35, 36]. In our recent work [36], we investigated the effect of a quasiperiodic Aubry-André () on-site disorder [37, 38] on the ABF diamond chain. We found that the symmetry of the applied external potential plays a crucial role. With a symmetric disorder, it is possible to completely destroy the degeneracy and still preserve the compact localization of the eigenstates [39]. However, when the disorder is applied in an antisymmetric fashion, both the degeneracy and compact localization are destroyed and a robust flat-band-based multifractality(FBM) [40, 41, 42] is observed in an extensive region of the phase diagram. In the present work, we study the effects of interactions on the ABF diamond chain both in the absence and presence of quasiperiodic disorder.
We begin by exploring single-particle dynamics, which shows quantum caging in the long time limit for both the zero-disorder and symmetric disorder cases. However, when the disorder is applied in an antisymmetric manner since the compact localization of the eigenstates is destroyed [36], the time-evolved state also displays a spreading over all the lattice sites. We next investigate the properties of the clean system when interactions are turned on. The system manifests nonergodic phases at all interaction strengths in the zero-disorder case. However, from a study of non-equilibrium dynamics, we conclude that for some specially engineered initial states, many-body systems exhibit caging behaviour independent of the strength of the interaction.
In the simultaneous presence of disorder and interactions, the symmetry of the applied disorder is again crucial. A symmetric disorder coupled with interactions yields nonergodic phases in the low and intermediate disorder regimes and MBL-like behaviour in the high disorder regime. We find that the dynamics is dependent on the initial state; in particular, we observe quantum caging for specific engineered initial states. The antisymmetric application of disorder leads to a mixed nonergodic phase at low disorder strength, a thermal phase at intermediate disorder strength, and an MBL-like phase at high disorder strength. The mixed phase obtained at low disorder strength is attributed to the presence of multifractal states in the single particle limit. Although we find initial state dependence in the non-equilibrium dynamics (except for intermediate disorder strengths, which yield a thermal phase), no quantum caging behaviour is seen.
This paper is organized as follows. In Section II, we discuss the details of the model. In Section III, we discuss the effects of disorder on the single-particle dynamics in the disorder-free, symmetric and antisymmetric cases. Section IV discusses the effects of interactions on the clean ABF diamond chain. Section V explores the symmetric application of quasiperiodic disorder on the interacting system. Section VI discusses the interplay of antisymmetric application of disorder and interactions. We then summarize our results in Section VII.
II Model
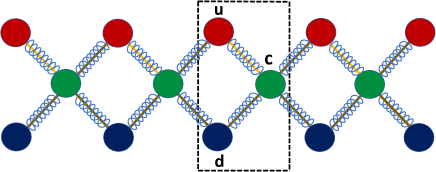
We study the ABF diamond lattice, where the unit cell consists of three sites (see Fig. 1). The fermionic creation operators acting at the (up), (center), and (down) sites respectively in the unit cell are , and and the Hamiltonian is:
| (1) |
where
| (2) |
The total number of lattice sites is denoted by , which should be a multiple of owing to the unit cell structure of the periodic lattice. The hopping amplitude is , which is taken to be for simplicity, and is the strength of the nearest neighbour interaction. For each site of the unit cell, we include independent on-site Aubry-André potentials
| (3) |
where the strength of the potential is and the quasi-periodicity parameter is taken to be the golden mean . The arbitrary global phase is chosen randomly from a uniform random distribution . Here we consider two types of correlations between the on-site energies on the up ‘’ and down ‘’ sites: a symmetric configuration in which and an antisymmetric configuration in which .
(a)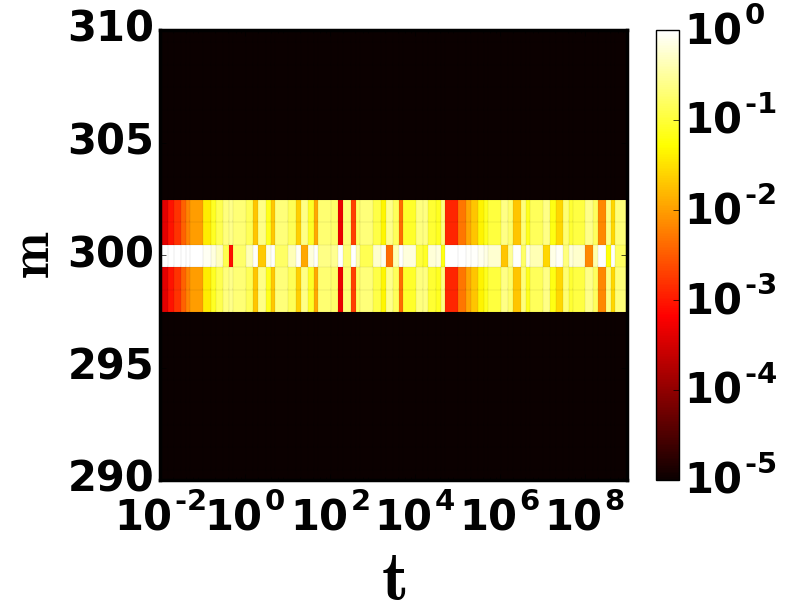 \stackunder(b)
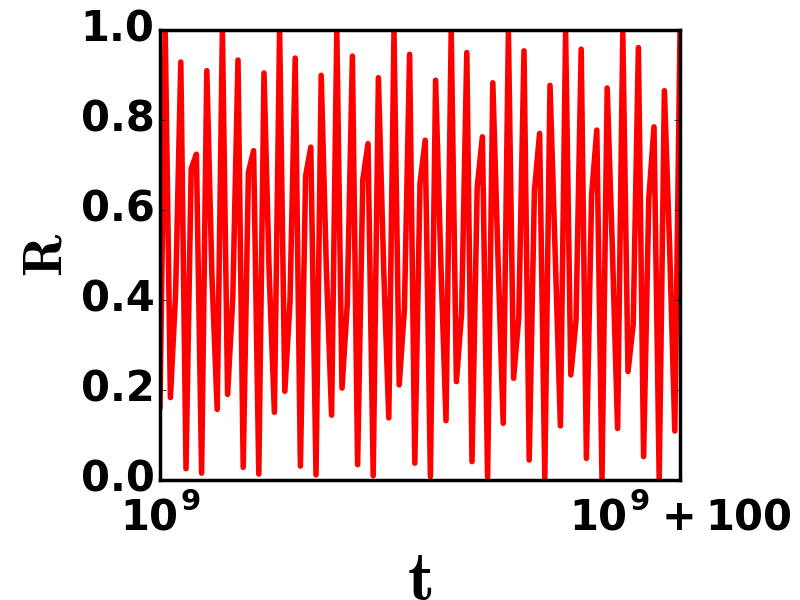
(c)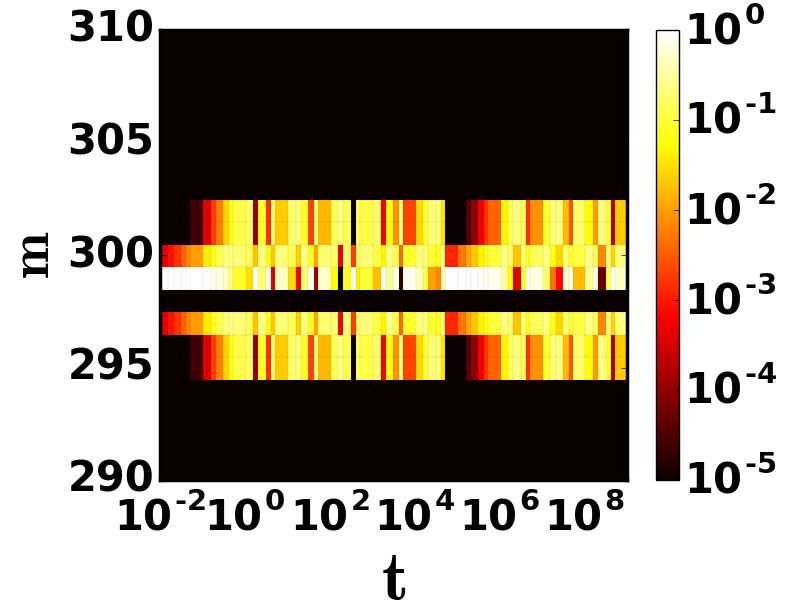 \stackunder(d)
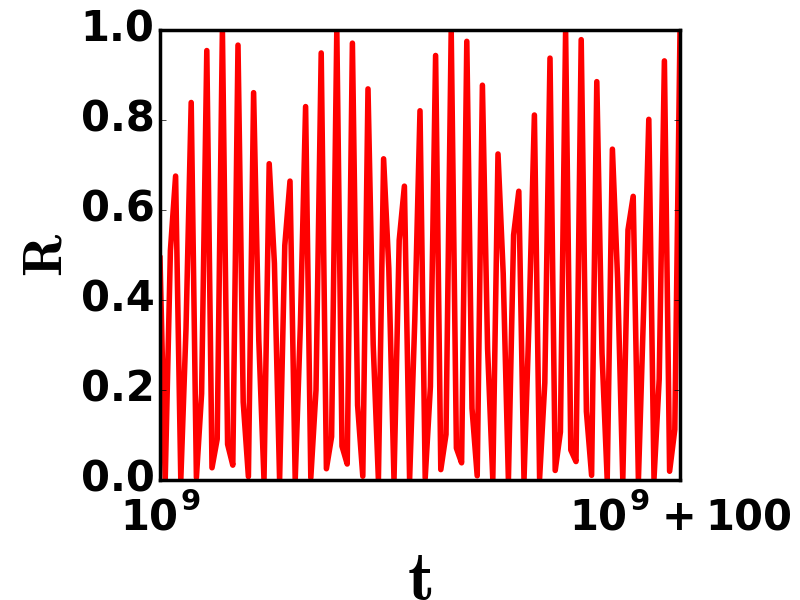
In the clean non-interacting limit, the ABF diamond chain possesses three flat bands at energies and no dispersive band. Consequently, the system is a good insulator, possessing only compact localized eigenstates. The system is highly degenerate, with the CLS occupying two unit cells. The other states corresponding to each flat band can be obtained by translating by an integer multiple of unit cells along the lattice. In the presence of symmetric disorder, remarkably, the eigenstates continue to be compactly localized in the original basis [36] although the translation symmetry and, thus, the flat band structure are broken. On the other hand, when the potential is applied in an antisymmetric manner, we find neither degeneracy nor compact localization [36], but a novel kind of flat-band-based multifractality.
 \stackunder
III SINGLE-PARTICLE DYNAMICS
In this section, we explore the single-particle properties with the help of non-equilibrium dynamics of the particle density and the return probability. We will see that these results are consistent with the static properties of the eigenstates we obtained in our earlier study [36]. We study the dynamics by considering two initial states, one where the single-particle occupies the lattice site ‘’ of the unit cell () and the other where it occupies the lattice site ‘’ of the unit cell (). We choose so as to focus on the sites of the central unit cell - the total number of unit cells is . Once the initial state is fixed, we obtain the time evolved state at time using the relation where denotes the site index that runs over all the sites i.e. . Also, selecting the ‘’ site yields similar results as the ‘’ site case; thus, we do not show the results here.
III.1 Zero disorder case
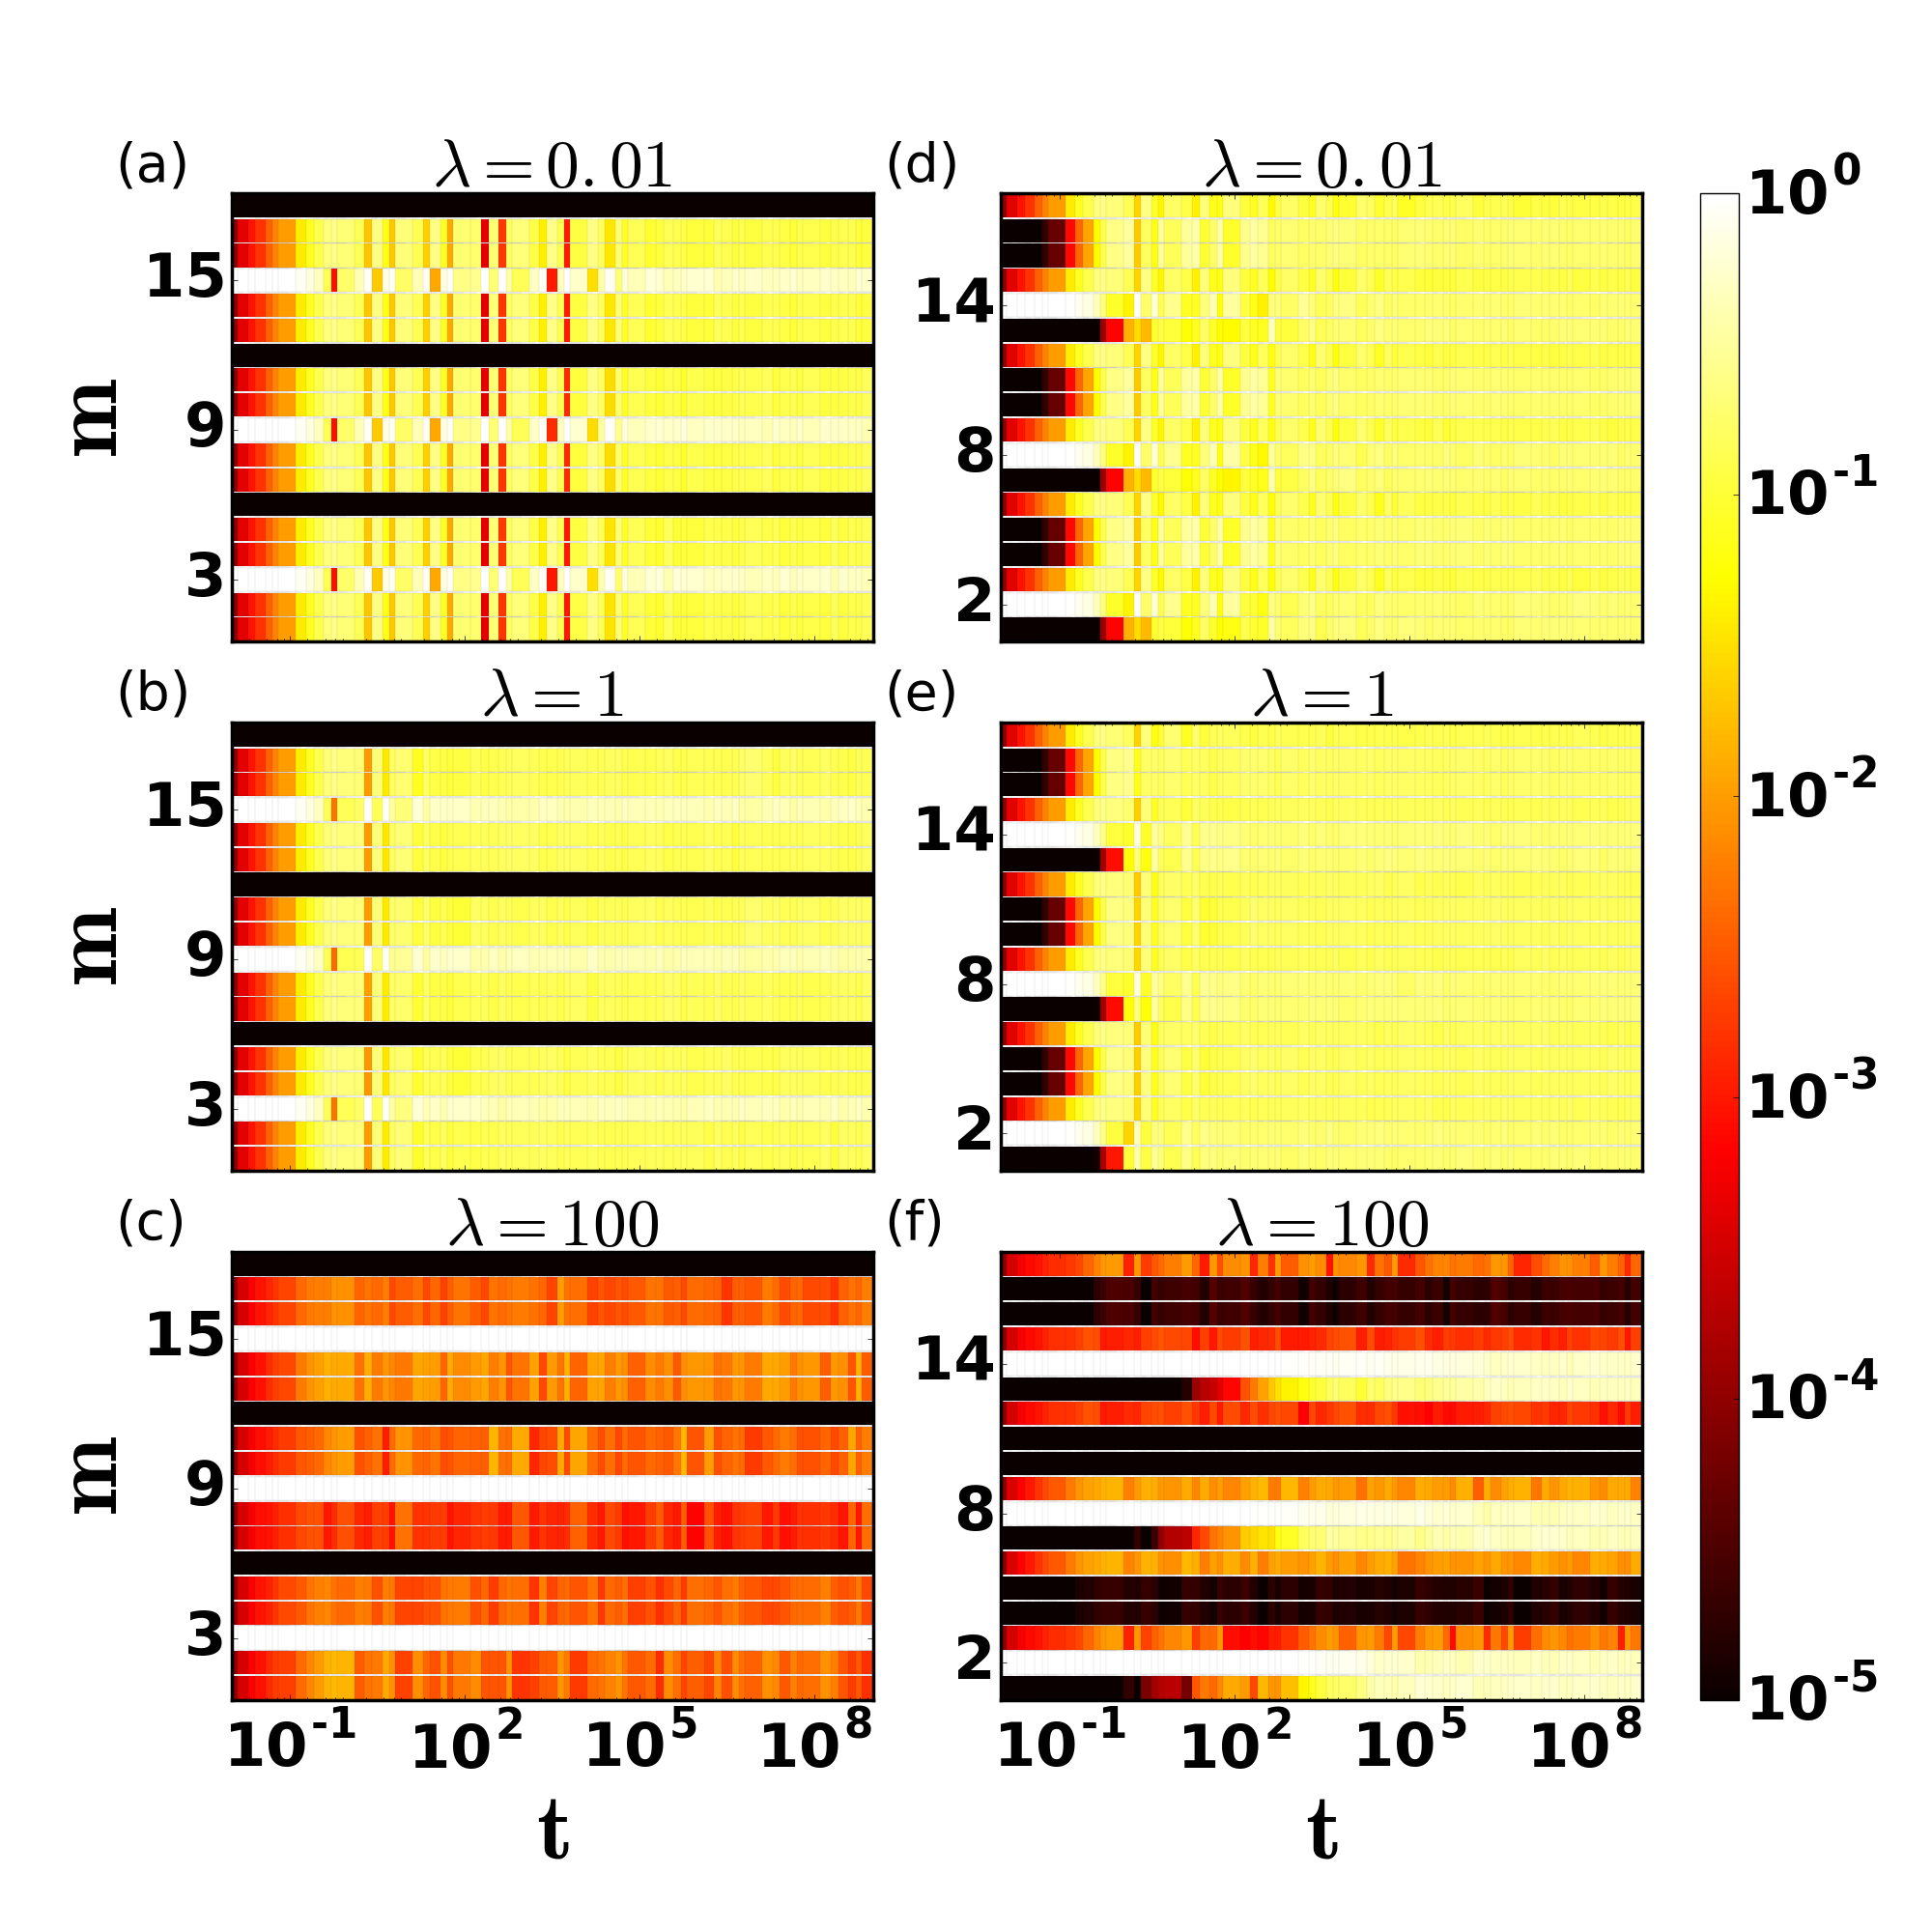
We first study the system in the clean limit. We begin by investigating the evolution of the particle density where is the probability of site being occupied at time . When the initial state is chosen to be , the particle remains compactly localized in two unit cells at all instances of time (see Fig. 2(a)). On the other hand, with the initial state taken to be , we observe that the particle becomes compactly localized in three unit cells at all instances of time (see Fig. 2(c)). Also, the number of unit cells in which the particle is compactly localized is robust with increasing system size.
We next calculate the return probability, which is defined as:
| (4) |
It is the probability of finding the particle in the initial state after a time . In the disorder-free limit, we have plotted the return probability starting from both the initial states in the long time limit in Fig. 2(b) and Fig. 2(d). The spectrum is highly degenerate in the disorder-free limit, yielding three energy levels, i.e. . Since the return probability is related to the level spacing of the energy levels, shows oscillatory behaviour [44, 45]. We conclude that the dynamics of the clean system is dependent on the initial state.
 \stackunder

III.2 Symmetric disorder case
We next consider the introduction of disorder in the symmetric configuration:
| (5) |
We have previously observed [36] that in the single particle limit, although the degeneracy of all the flat bands is lifted, the eigenstates are found to be compactly localized in two unit cells at all strengths of disorder.
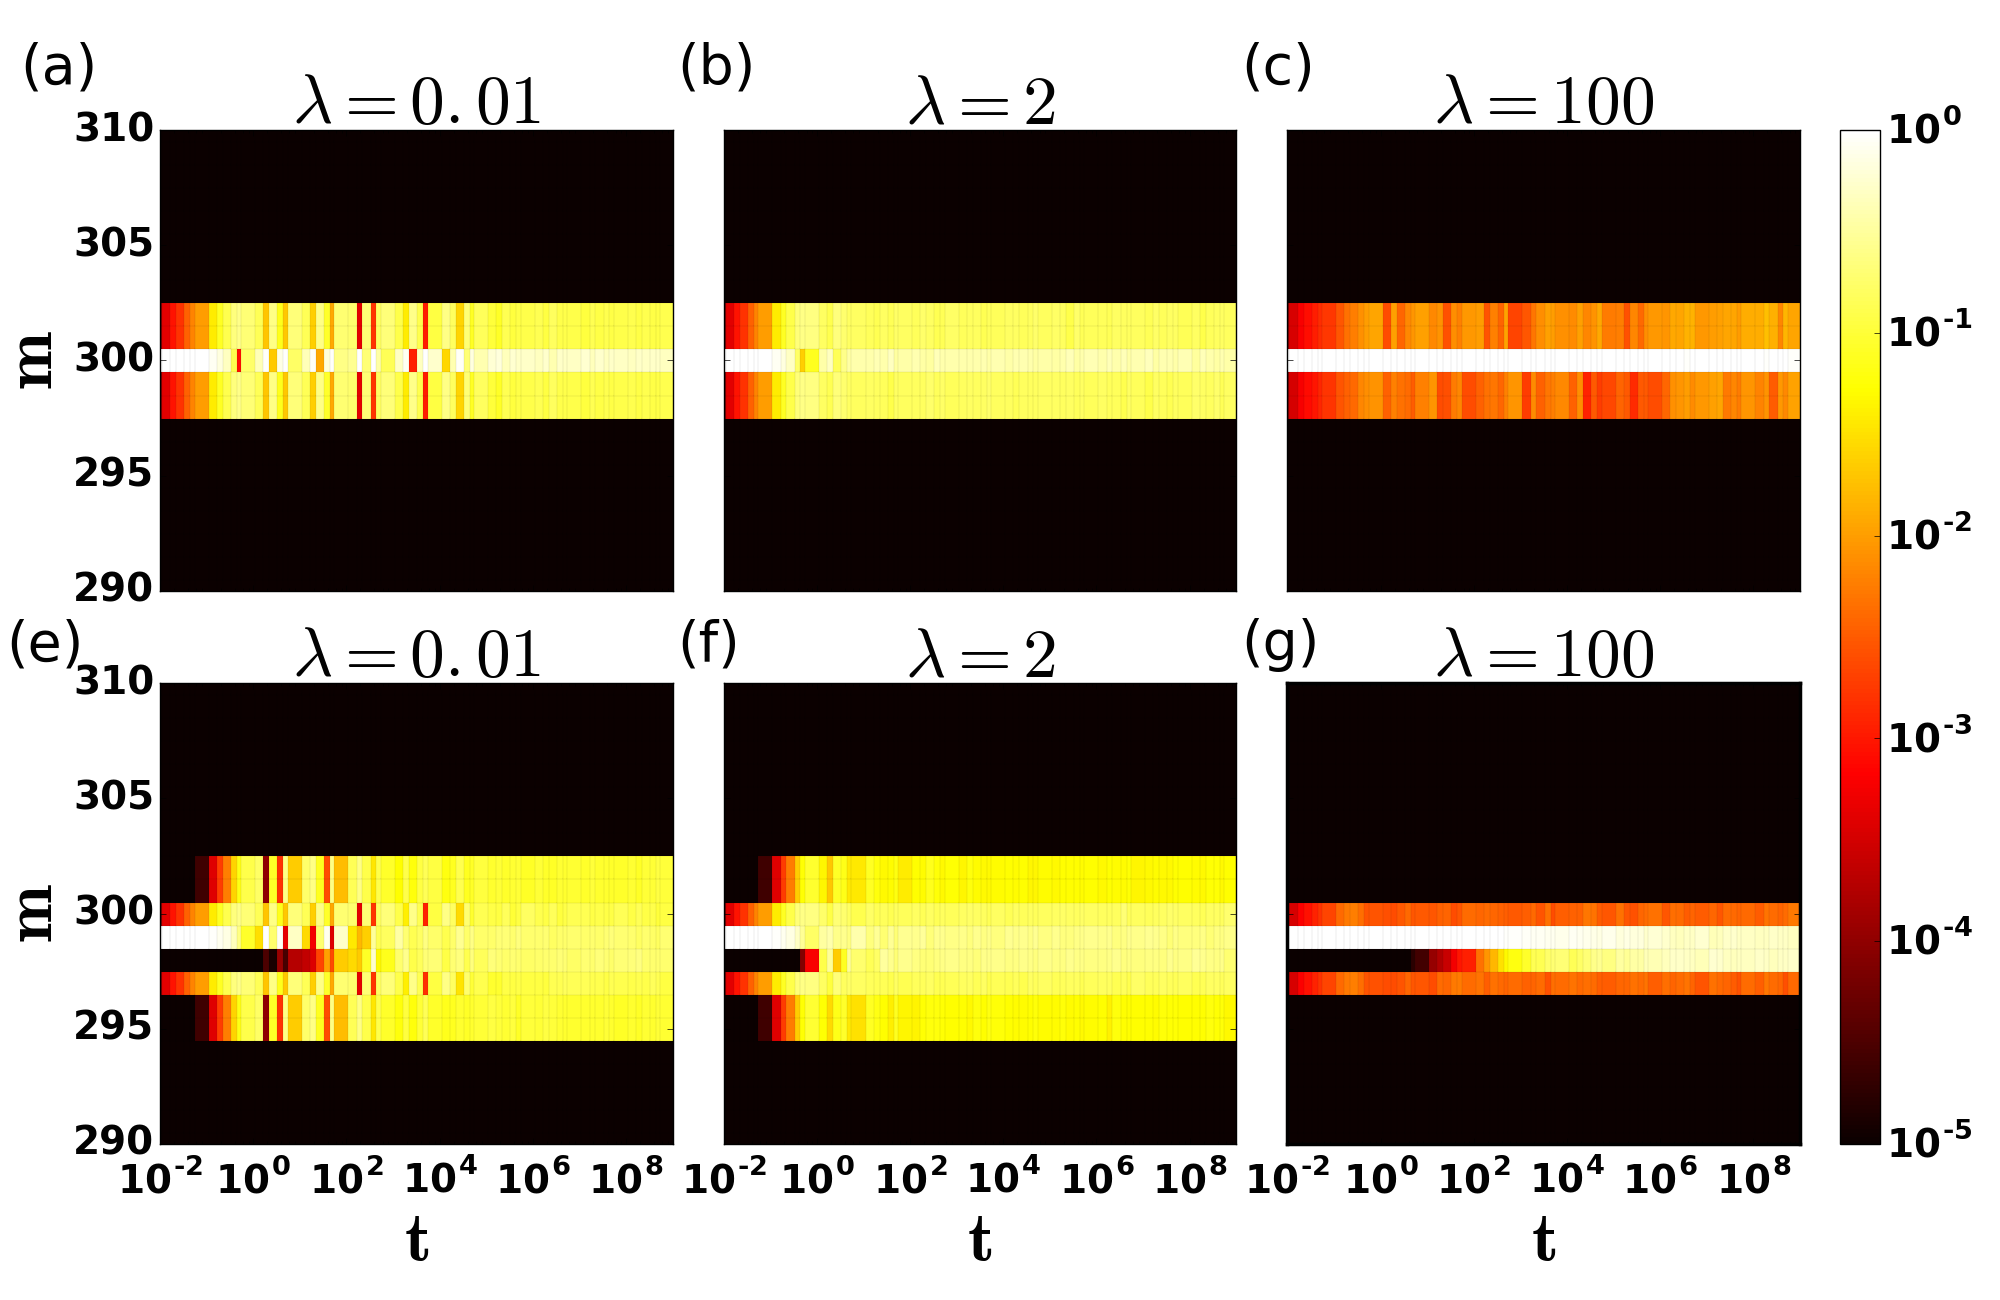
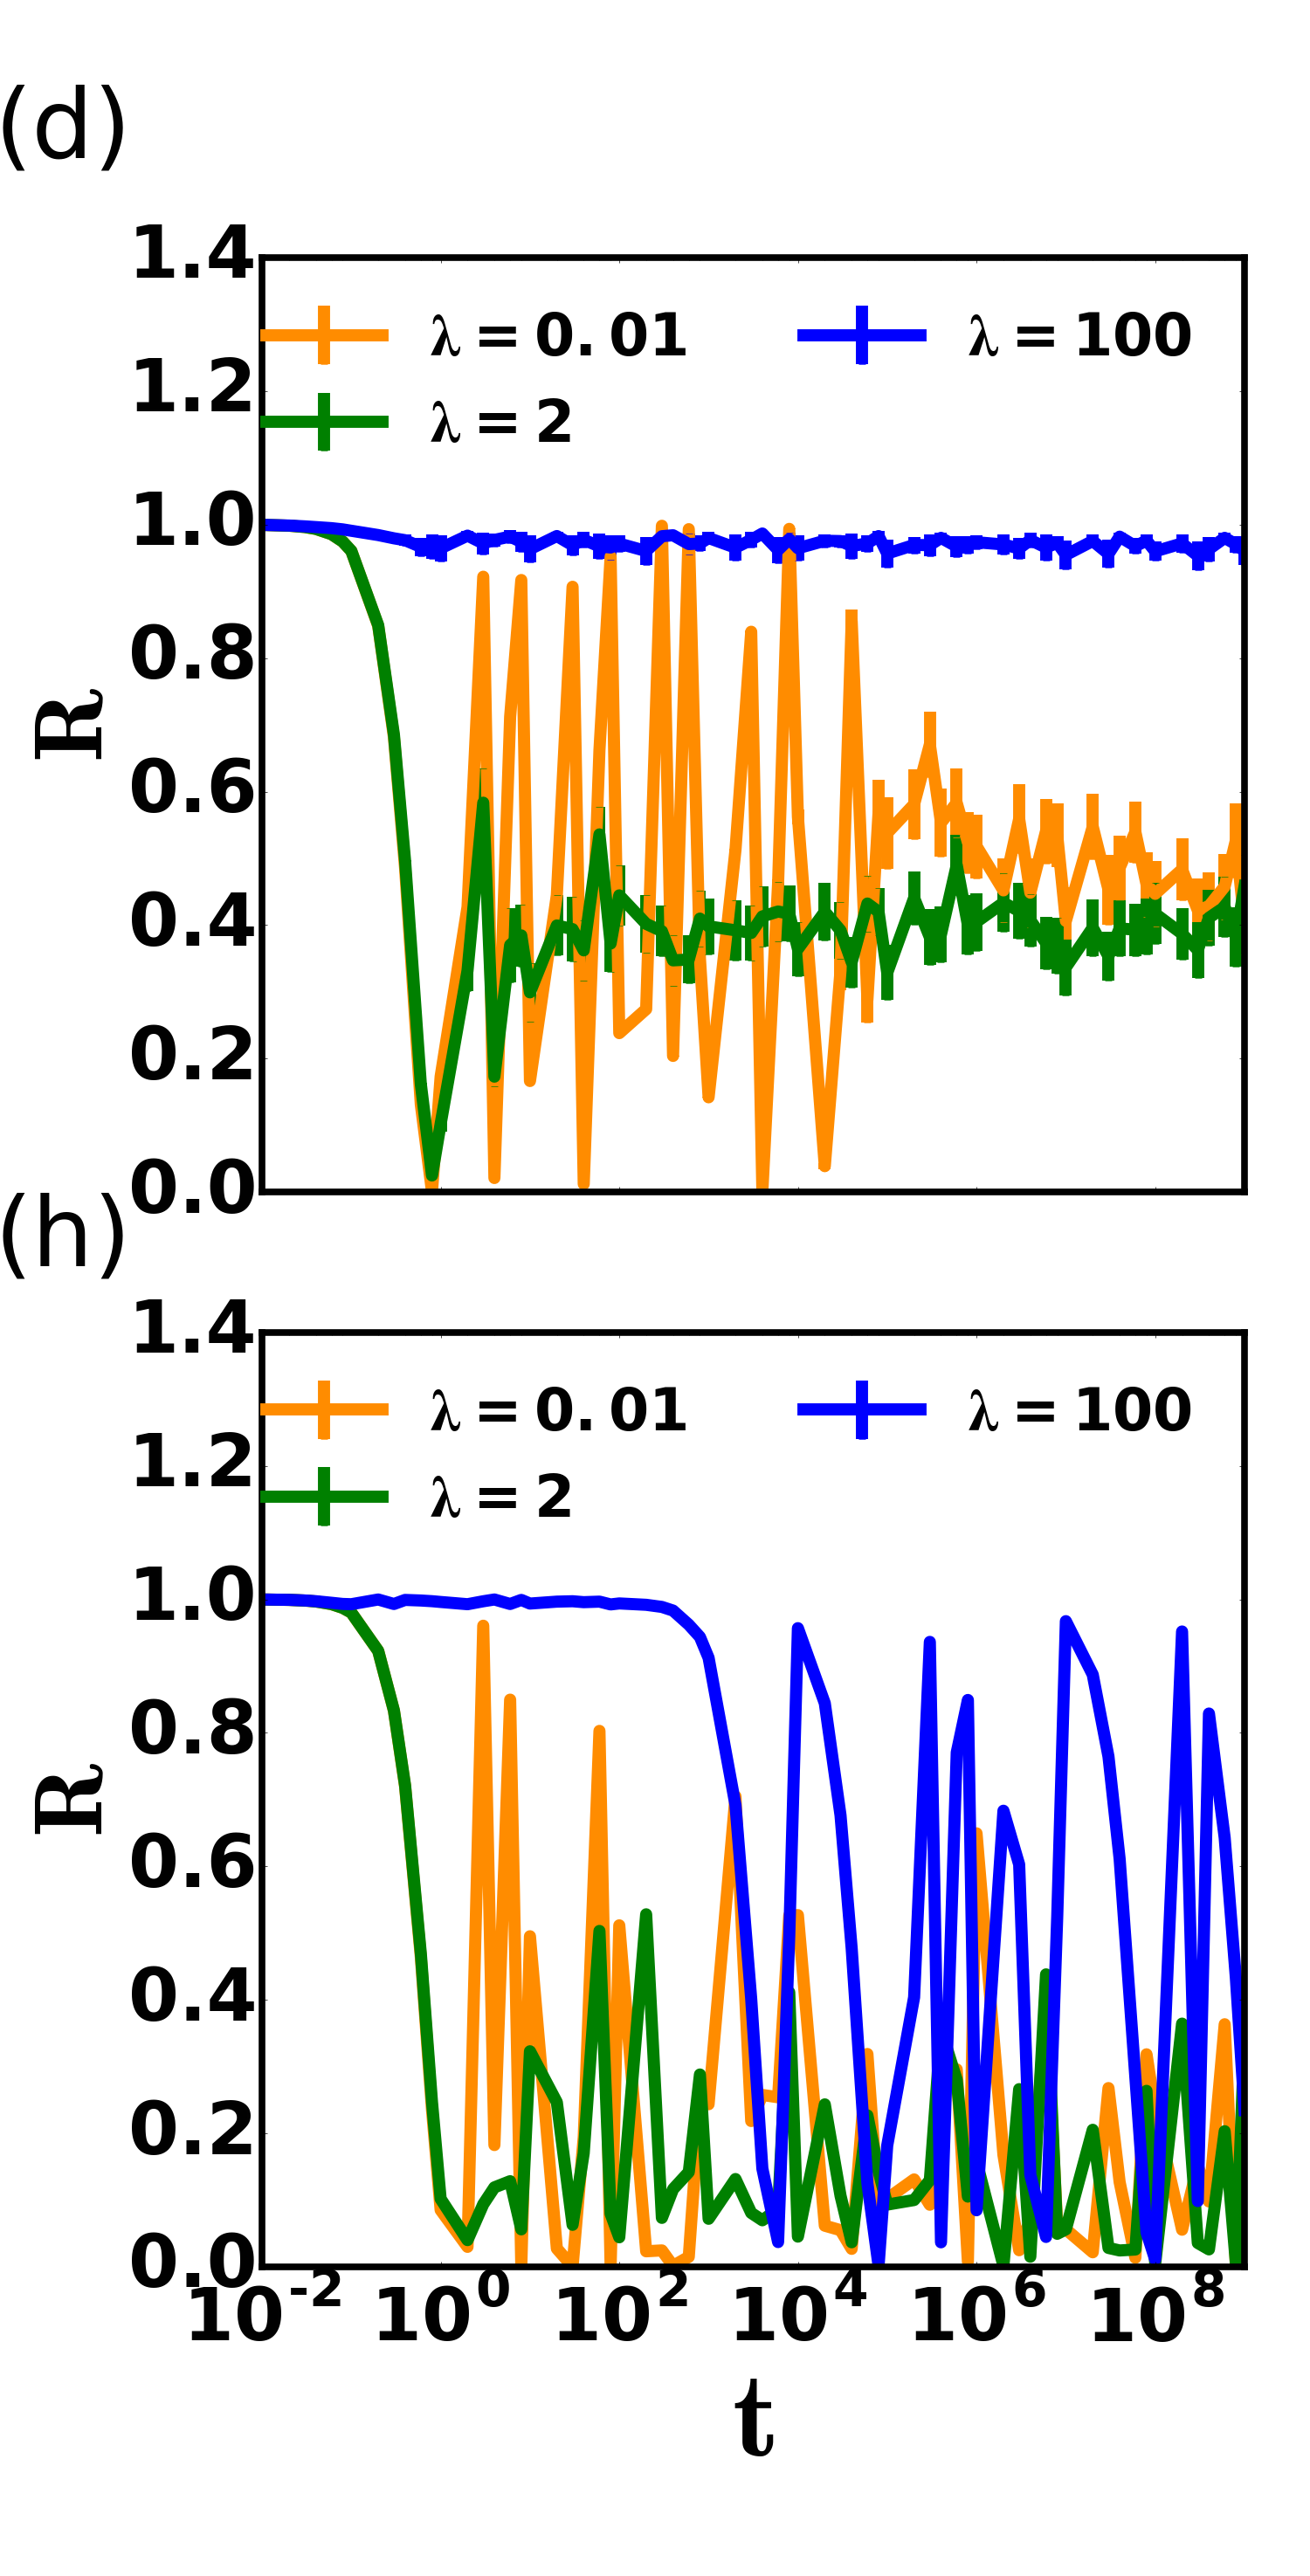
For the initial state , from the evolution of the particle density, it can be observed that the state is compactly localized over two unit cells in the low, intermediate and high disorder regimes (see Figs. 3(a)–3(c)). However, at higher disorder , the site on which the particle is initially localized shows a large occupation probability at all times, as indicated by the central white patch in Fig.3(c). Also, in the long time limit, the return probability has finite magnitude for and a magnitude close to unity for , as shown in Fig. 3(d). We then study the dynamics for the initial state . From the evolution of the particle density, we observe that at all strengths of disorder, the state is compactly localized over three unit cells (see Figs. 3(e)–3(g)). The return probability in the long time limit has a finite value at all disorder strengths, as shown in Fig. 3(h).
On the introduction of a symmetric disorder, the spectrum becomes dispersive, although the eigenstates are compactly localized. We obtain non-degenerate energy levels, whose magnitude depends on the disorder strength. As the return probability involves the contribution of various energy levels through the time evolution operator , its periodicity is affected by the various energy levels and the initial state.
There is a second way in which the symmetric disorder can be introduced wherein only the sites are perturbed:
| (6) |
In this case, we know [36] that while the degeneracy is broken for the upper and lower bands, the flat band at remains robust even at higher disorder strengths. We have checked that the single-particle dynamics within this scenario yields qualitatively similar results as discussed above.
III.3 Antisymmetric disorder case
We next consider the application of the potential in an antisymmetric manner, defined by
| (7) |
In the single-particle limit, we observed [36] that the tiniest of perturbation lifted the degeneracy, and the eigenstates were no longer compactly localized. Further, we also reported the existence of a central band with extended nonergodic (multifractal) eigenstates separated from the Anderson localized states by a fractal mobility edge [46].
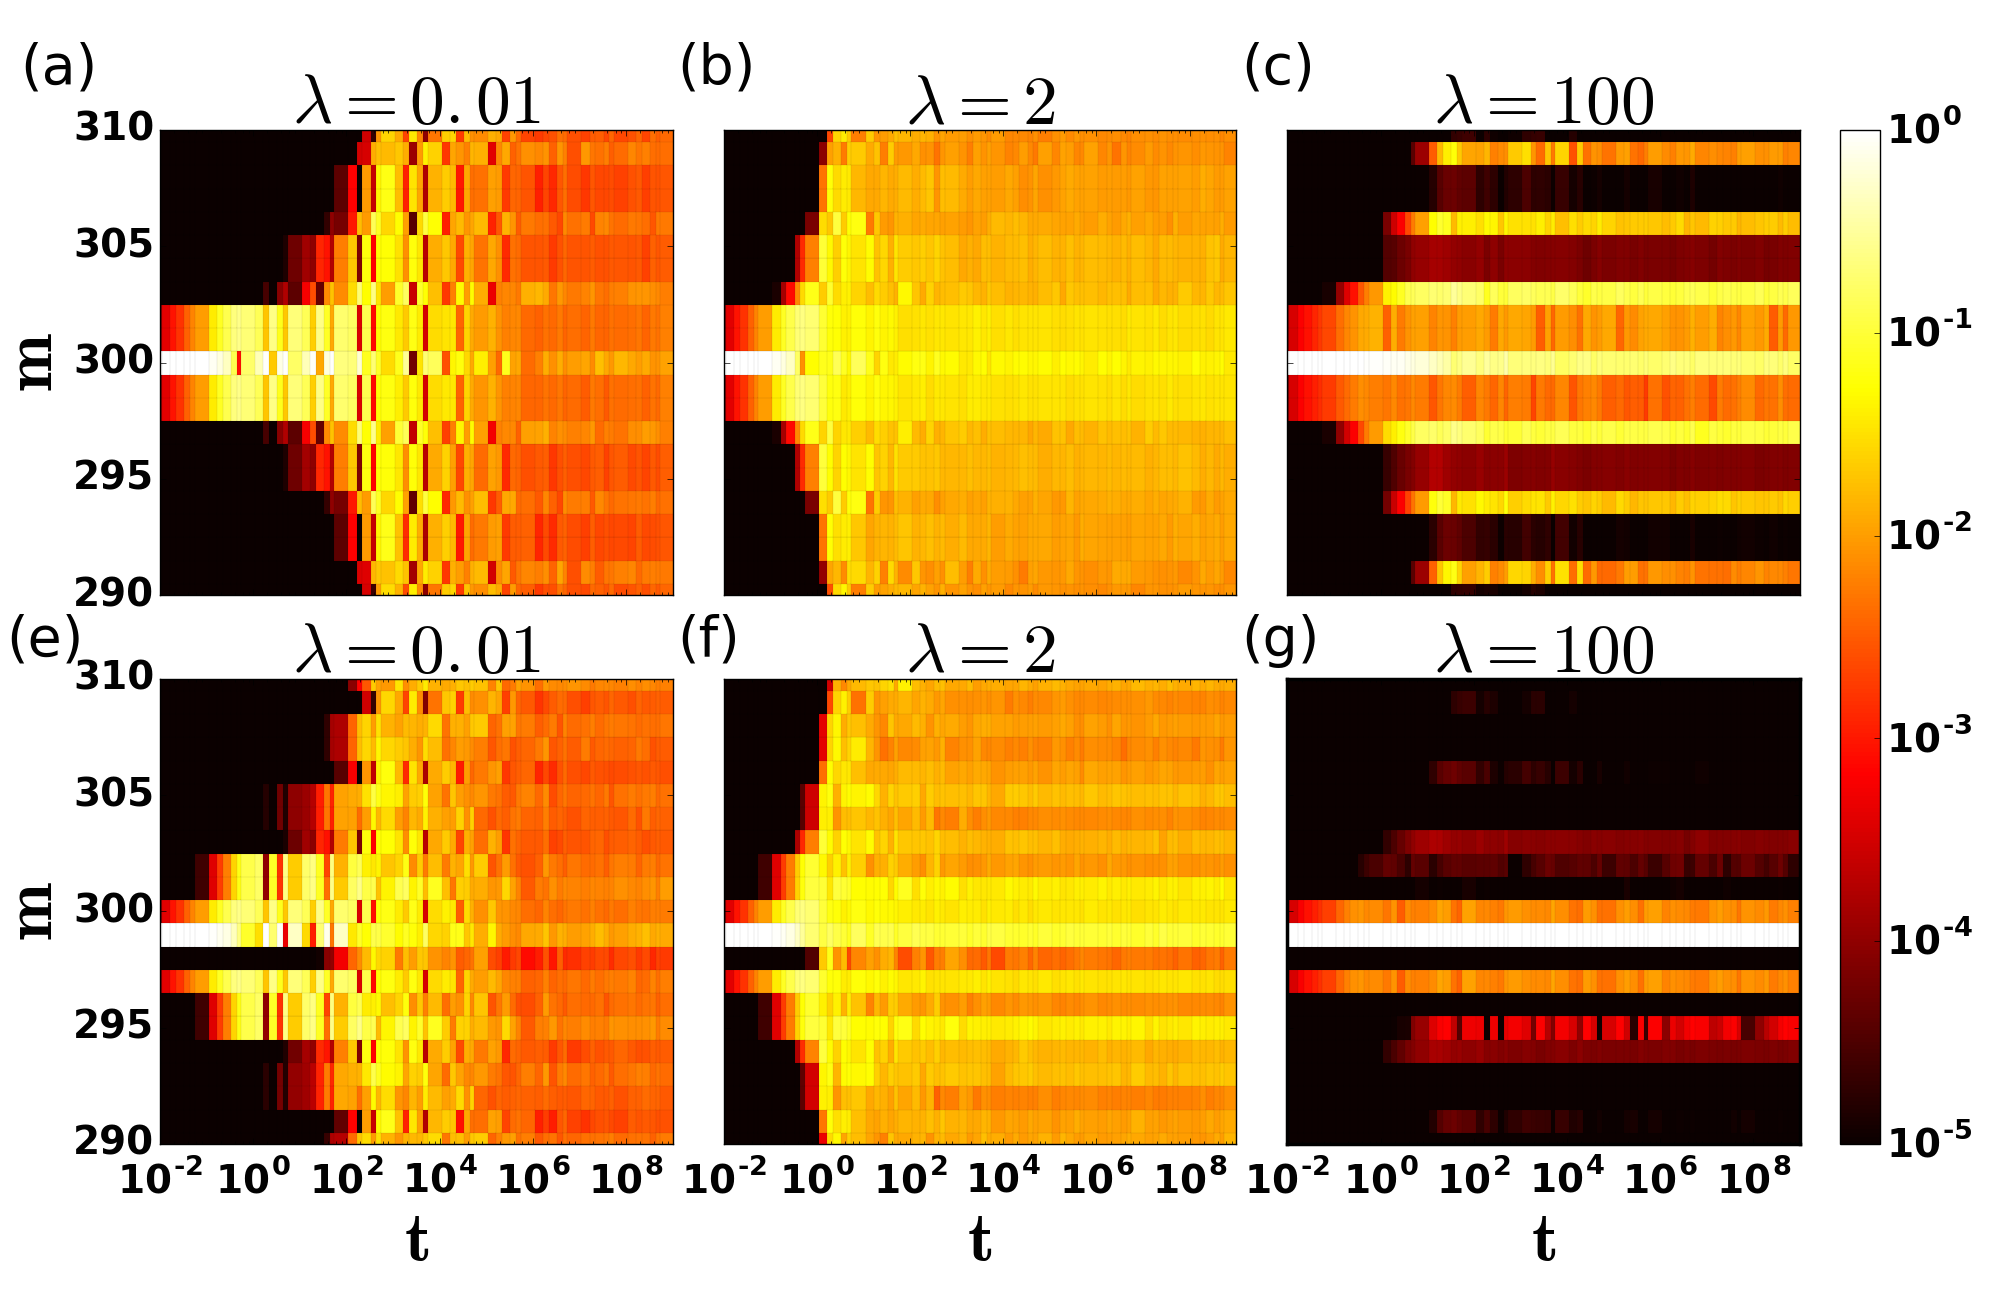
From the evolution of the particle density, we observe that for the initial state the wavefunction spreads over the entire lattice with time at all strengths of the disorder (see Figs. 4(a)–4(c)). The same can be observed in the long time limit (see Fig. 4(d)), with occupation probability , spreading non-uniformly over the entire space at all strengths of disorder, which is a signature of the multifractal states, as observed in the phase diagram in the static case [36]. The results are qualitatively the same for the dynamics associated with the other initial state as shown in Figs. 4(e)–4(h). In both cases, in the higher disorder regime , we observe that the site on which the particle is initially localized shows a large occupation probability in the long time limit (see Figs. 4(d),(h)). For low and intermediate disorder, we have also checked (results not shown here) that the return probability in the long time limit is of the order of due to the contribution of a large fraction of multifractal eigenstates. At higher disorder strengths, it is for and for owing to the presence of a large fraction of localized eigenstates.
IV INTERACTING DISORDER-FREE SYSTEM
In this section, we study the effects of the interaction on the ABF diamond lattice in the zero disorder limit. We investigate the properties of the eigenstates with the help of the many-particle inverse participation ratio (MIPR) and the one-particle density matrix (OPDM). We also explore the dynamics of the particle density, entanglement entropy and return probability. For a system size with being the particle number, the dimension of the Hilbert space is and the filling fraction is represented by . Using exact diagonalization, we obtain the many-body energy spectra and the normalized eigenstates , where .
Expanding a normalized eigenstate in the particle number constrained space as , we compute the many-particle inverse participation ratio (MIPR):
| (8) |
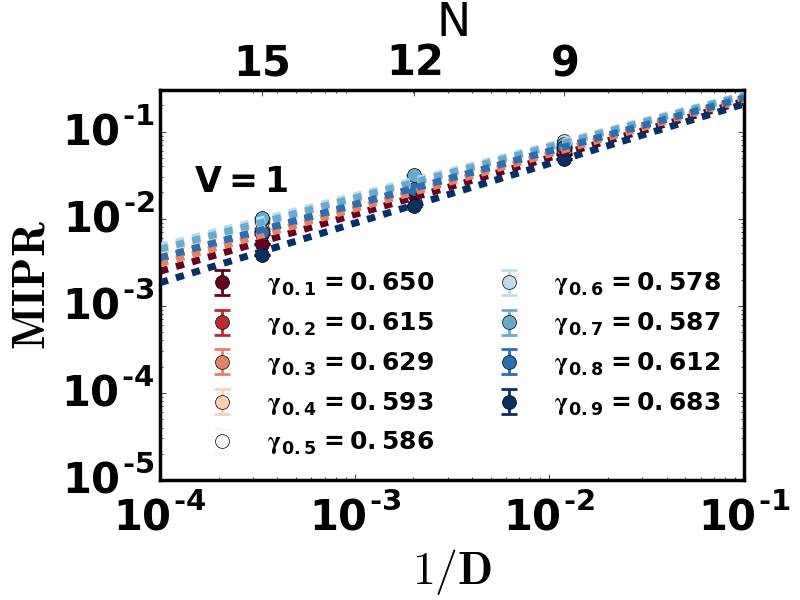
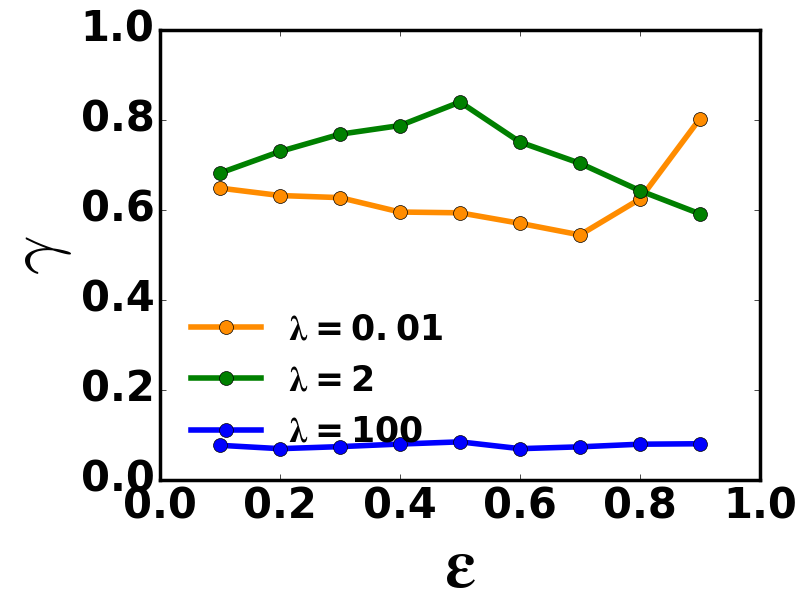
For a perfect delocalized eigenstate MIPR , while for an extremely localized eigenstate, MIPR . Here we study the scaling of MIPR with , using the relation MIPR . is close to in the MBL phase, while in a perfectly delocalized many-body phase and in the nonergodic many-body phase [47].
(a)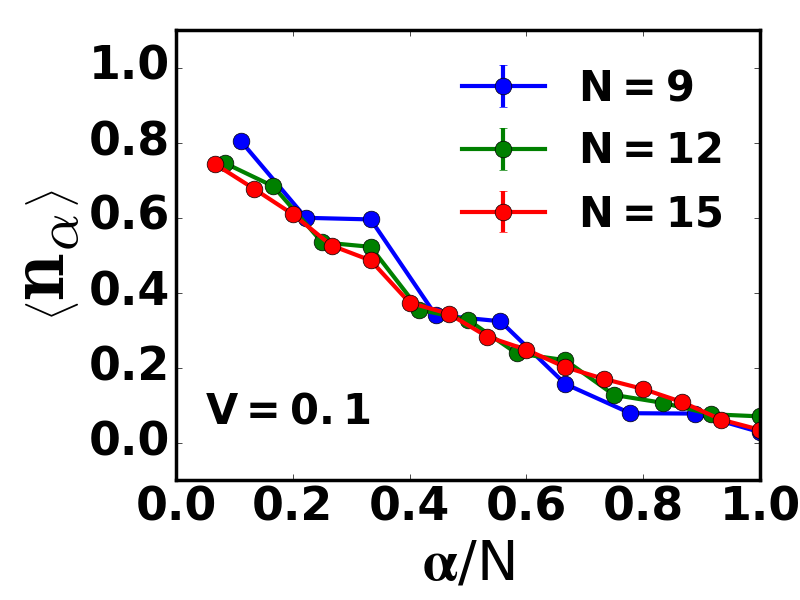 \stackunder(b)
(c)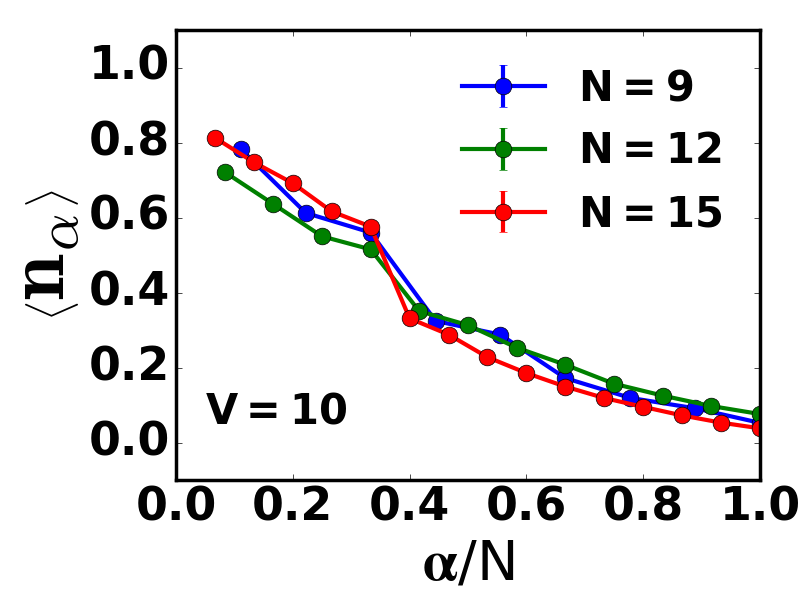 \stackunder(d)
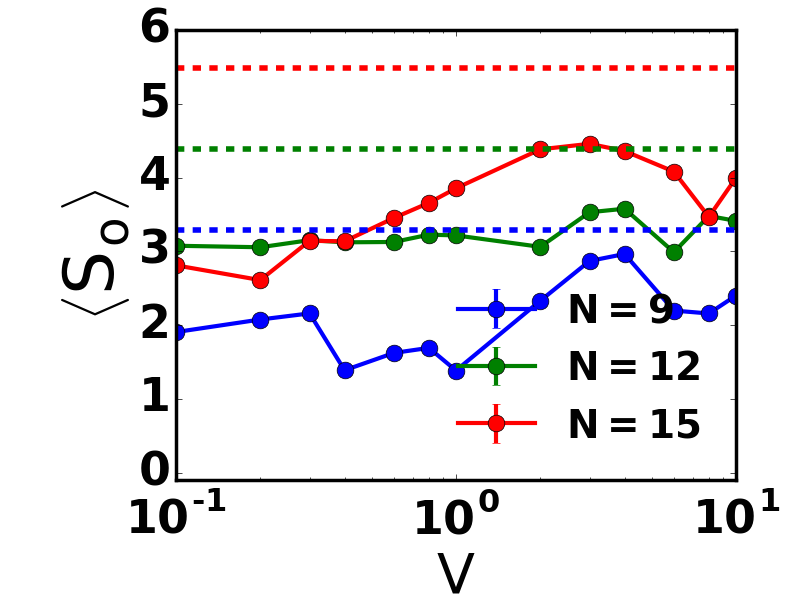
In Fig. 5, we fix the filling fraction and extract by increasing the system size . Using the relation , where and are the ground state and maximum energy levels, respectively, the energy levels are rescaled to lie within the range . We then study MIPR averaged over the states in the energy windows, which are specified as , where at . From the energy-resolved study, we observe that over the entire energy spectrum, indicating the existence of a nonergodic phase.
The localization characteristics of a many-body system can also be explored with the help of the one-particle density matrix (OPDM) [48, 49, 50]. The OPDM for any many-body eigenstate is defined as:
| (9) |
where we have renamed the fermion operators at the various sites of the different unit cells as where creates(annihilates) a fermion on-site which runs from . A compact way to define these new operators is to simply write:
| (10) |
where runs over the unit cells. The diagonalization of the OPDM results in a basis of single-particle eigenstates called the natural orbitals , with and their occupations (eigenvalues) denoted by :
| (11) |
The trace of the OPDM is equal to the total number of particles in the system , and the natural orbitals are ordered with decreasing occupation: .
These natural orbitals are localized in the MBL phase and delocalized in the ergodic phase. This behaviour of the natural orbitals is a many body effect since, without interactions, the natural orbitals of the single-particle energy eigenstates are all localized. In a non-interacting system, each many-body eigenstate is a Slater determinant of single-particle states, with the occupation spectrum for all and zero otherwise at any strength of disorder. In the MBL phase, all the natural orbitals corresponding to remain almost fully occupied (), while the others remain almost unoccupied (), resulting in a discontinuity that is close to unity. In the thermal phase, the occupations of all the orbitals approach the mean filling fraction . In the ergodic phase, the occupation spectrum is consistent with the eigenstate thermalization hypothesis, while in the MBL phase, the occupations preserve a discontinuity at an emergent Fermi edge.
(a)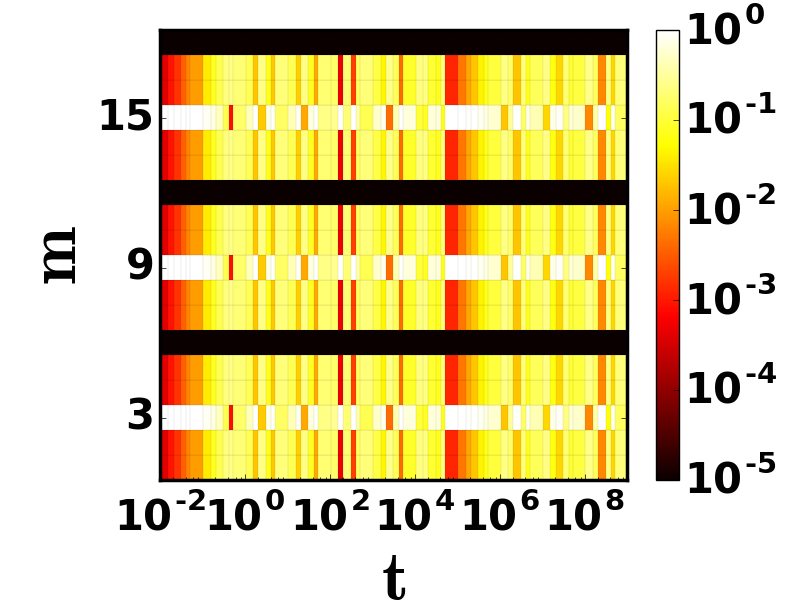 \stackunder(d)
(b)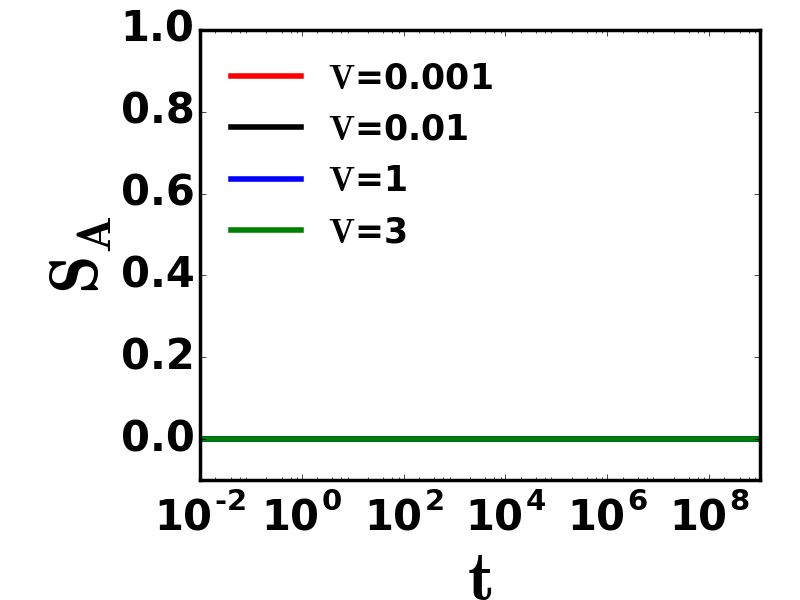 \stackunder(e)
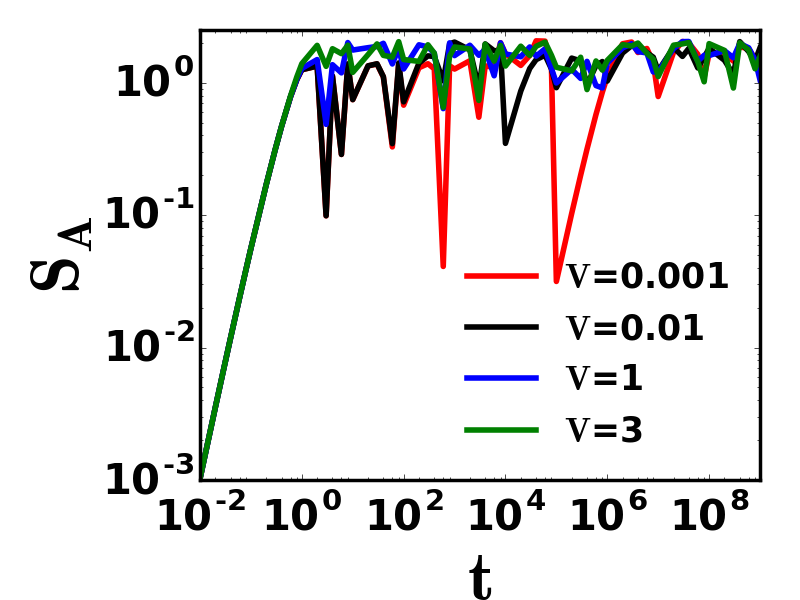
(c)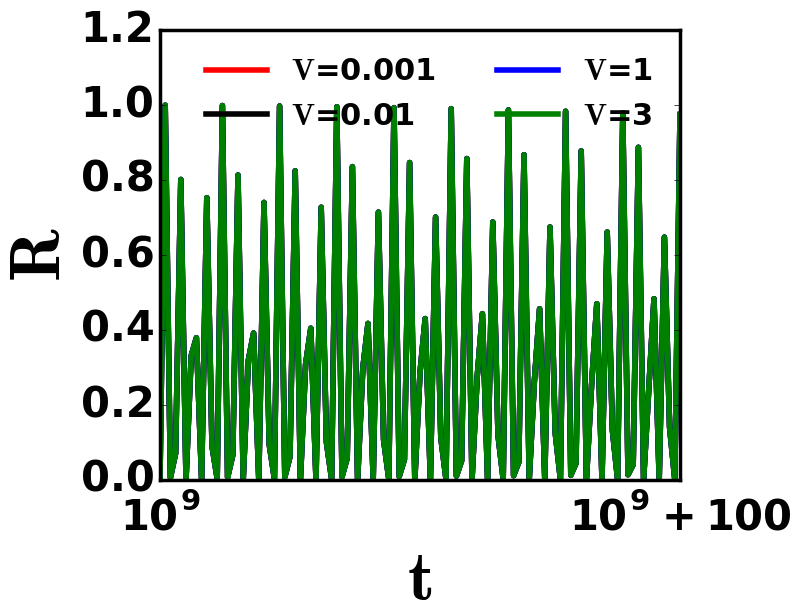 \stackunder(f)
From the occupation spectrum, the one-particle occupation entropy can be calculated as follows:
| (12) |
The one-particle occupation entropy is large and proportional to the system size in the delocalized phase, corresponding to the volume law of thermal states. In contrast, in the localized phase, it is close to . In the ergodic phase , hence for a filling fraction considered here, the maximal value of will be . Thus in the thermal phase, it corresponds to the volume law displayed by many-body eigenstates, while it approaches in the localized phase.
In Figs. 6(a)–6(c), we have plotted the occupation spectrum at different interaction strengths and and over a specific energy window . We observe that the occupations are not close to or , indicating the absence of MBL. Further deep in the thermal phase, are expected to become system size independent at the filling fraction ( here), while splaying out on either side in a characteristic system-size-dependent manner; here, we only see a monotonic decrease with almost no system size dependence throughout. We conclude that the presence of interaction in the ABF diamond lattice results in a nonergodic phase - this is in agreement with the results of MIPR. We also study the OPDM entropy (see Fig. 6(d)) for the states corresponding to the energies . We observe that does not reach its maximal value (dashed lines in Fig. 6(d)), nor does it decrease to at any interaction strength , and indicates nonergodic behaviour.
In Section III from our discussion of the single-particle dynamics, we have seen how the number of unit cells occupied by the time-evolving state depends on the initial state. Here we study many-body non-equilibrium dynamics with the help of particle density, entanglement entropy and return probability. The study of entanglement entropy [51, 52] serves as a quantifier of localization in many-body systems. For the many-body state , one can calculate the density matrix . The system is then divided into two parts, one with number of sites and the other with sites. The reduced density matrix (RDM) is calculated by tracing over the subsystem as , and the entanglement entropy is given by .
In order to understand the interplay of initial configuration and interaction , we consider two types of initial states for the system size and a filling fraction . In the first case, we consider an initial state of the density wave type with particles on sites of alternate unit cells [31]:
| (13) |
In the second type of initial state, the sites of alternate unit cells are occupied:
| (14) |
Figs. 7(a)–7(c) show the dynamics starting from the initial state given by Eq. 13. When the particles are arranged in a manner such that where are the unit cell indices of any pair of particles, we observe distinct CLSs for each particle as shown by the evolution of the particle density in Fig. 7(a). The particles show caging behaviour and remain unaffected by the interactions here. The same can be observed from the evolution of the entanglement entropy , where in Fig. 7(b). We observe that at all interaction strengths, there is zero entanglement between the two subsystems, indicating that the compact localized states are unaffected by interaction strength . Also, we observe that the return probability shows perfect oscillations (see Fig. 7(c), where time axis is shown on a linear scale to highlight the oscillations) in the long time limit independent of the strength of interaction.
We then consider the initial configuration given by Eq. 14, corresponding to a filling fraction. However, the CLS corresponding to the single particles spans over unit cells, as shown in Fig. 2(c). Consequently, from the evolution of the particle density, we observe an overlap between the CLS belonging to different particles in Fig. 7(d). This suggests that interaction among the initially caged particles comes into play. The same can also be observed from the evolution of , where we plot the entanglement by considering the subsystem size . After an initial transient till , independent of the interaction strength , the entanglement saturates to a significant value indicating a nonergodic phase. From Fig. 7(f), we observe that the return probability displays continual oscillations about a non-zero mean value, although it does not reach . A closer look at this figure in a linear scale shows that the oscillations are interaction dependent, mainly controlled by the interaction-dependent gaps between the degenerate bands of the many-body energy spectrum. These energy gaps are constant throughout the dynamics, and hence, the associated terms present in the return probability do not vanish due to phase randomization, giving rise to energy gap-dependent fluctuations in return probability throughout the dynamics. This scenario is typical of a clean degenerate system perturbed with many-body interactions [31]. This behaviour is also consistent with the nonergodic phase argued from the previous quantities.
(a)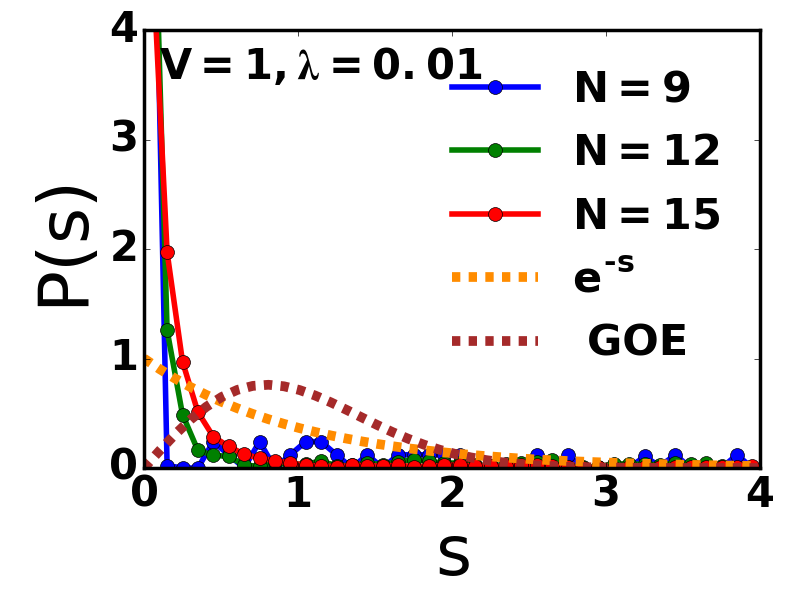 \stackunder(b)
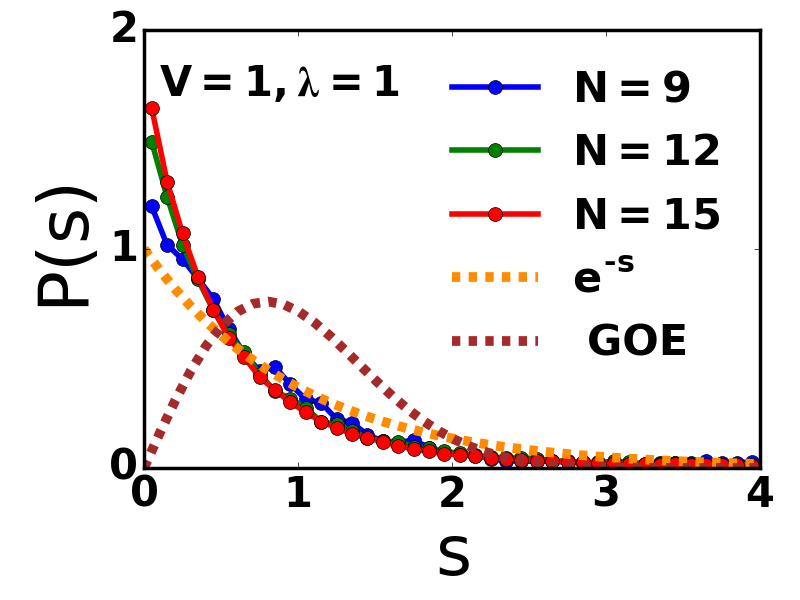
V INTERACTIONS AND SYMMETRIC DISORDER
In this section, we study the interplay of symmetric disorder and interactions. Specifically, we study the effects of the application of disorder in a symmetric manner where the disorder is introduced on the and sites:
| (15) |
in the presence of interactions. We first look at the eigenvalue and eigenvector properties of this Hamiltonian, and then see how these properties are reflected in a non-equilibrium dynamical setting.
(a)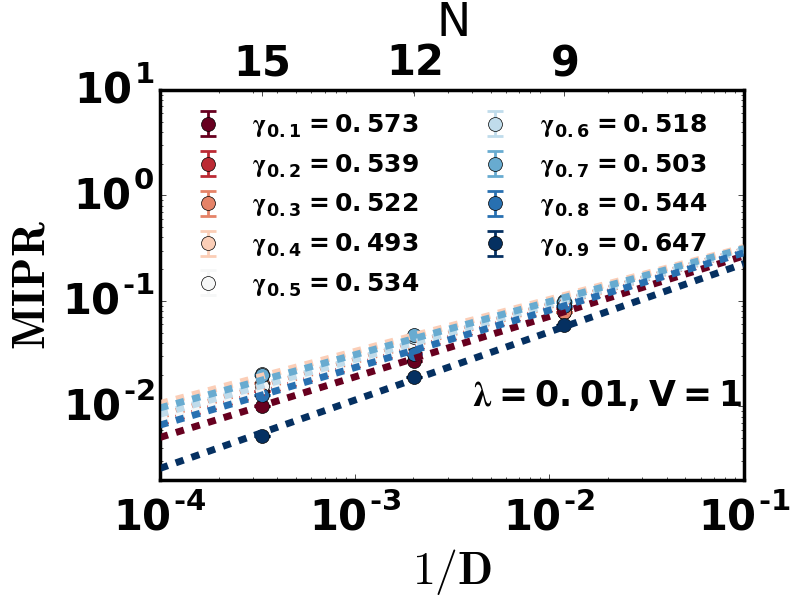 \stackunder(b)
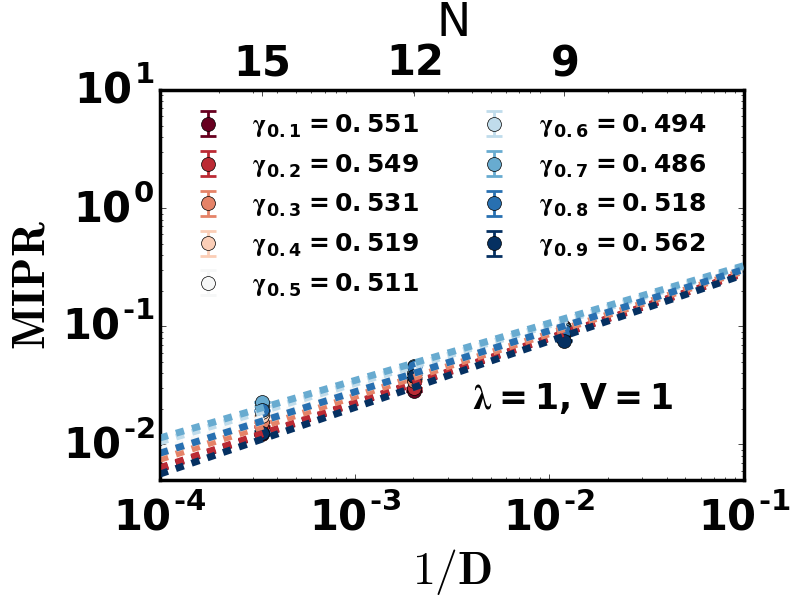 \stackunder(c)
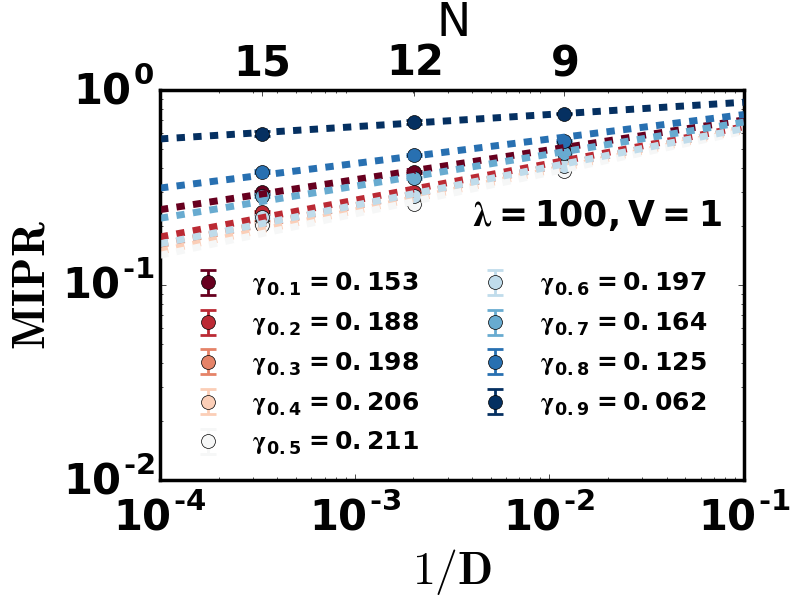
V.1 Statics
We start by investigating the level spacing distributions . To do this, the energy levels are arranged in ascending order, and the consecutive spacings are obtained as . A large collection of such spacings is obtained with the aid of several disorder realizations. Next, the are unfolded [53] by dividing the original level spacings by the mean level-spacing of the spectrum. We then study the distribution of these scaled spacings. It is well known [54] that when the states involved are localized, the probability distribution of the level spacings is Poissonian: . On the other hand, for delocalized states, the probability distribution of the level spacings is Wigner-Dyson: (GOE [54]).
(a)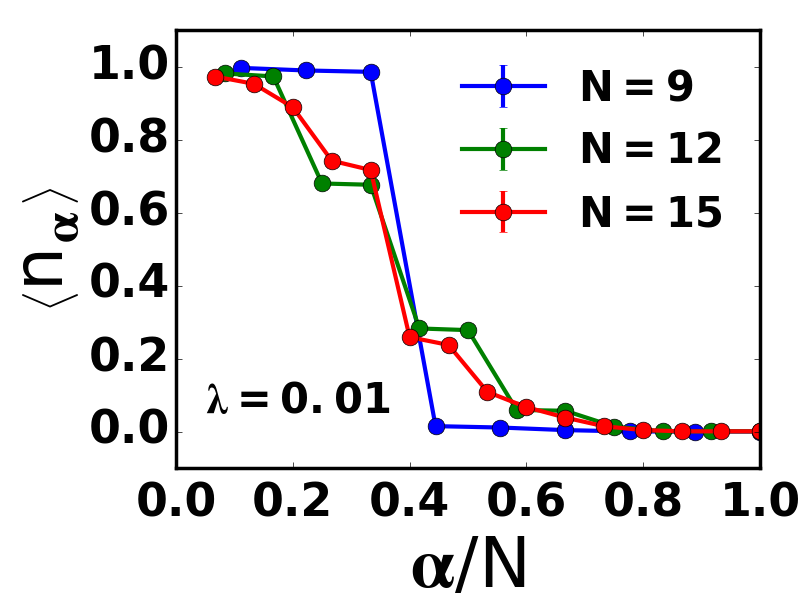 \stackunder(b)
(c)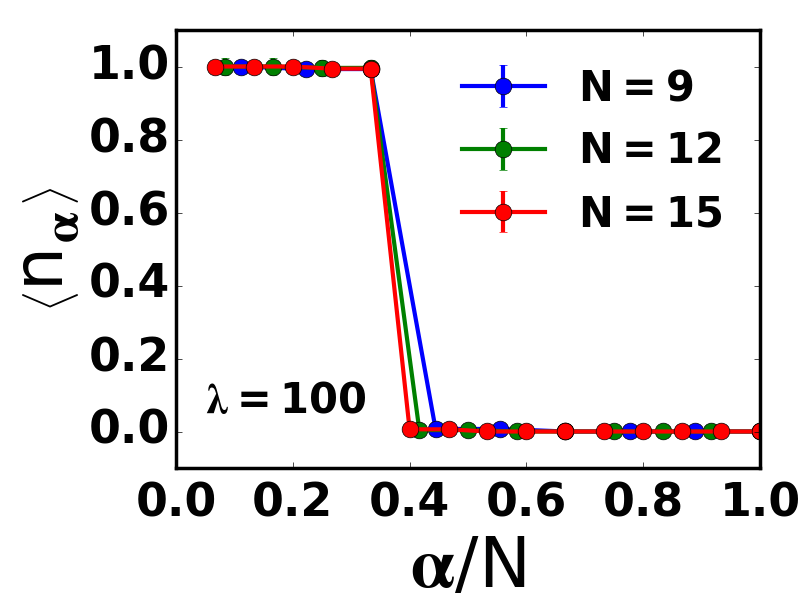 \stackunder(d)
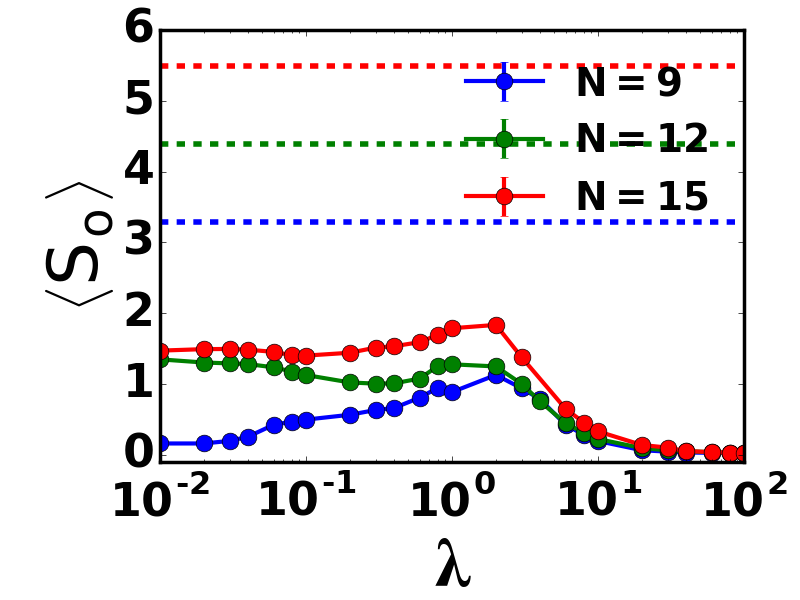
In the disorder-free case, the single-particle ABF diamond lattice possesses massive degeneracy with only three energy levels. When interactions are turned on for the disorder-free model, we observe quasi-degeneracy as well as a large number of gaps in the spectrum. On the application of disorder, while degenerate bands are observed in the absence of interactions in the low disorder limit, many smaller bands are observed when the interactions are also turned on. In the case of high disorder, both in the presence and absence of interactions, the spectrum displays quasi-degeneracy and many smaller gaps, a behaviour typically observed in quasiperiodic systems [56]. This makes the level spacing distribution not a reliable tool for studying localization characteristics [55] in the low and high disorder regime. In the intermediate disorder regime, these effects are minimized due to the interplay of flat bands and disorder. Fig. 8 shows the probability distribution of the level spacing at interaction strength for a fixed filling fraction and different disorder strengths . We observe that the spacing distribution is neither GOE nor does it show a perfect fit to the Poisson distribution both at (see Fig. 8(a)) and at (see Fig. 8(b)). The states are neither ergodic nor localized in the low and intermediate disorder regimes.
(a)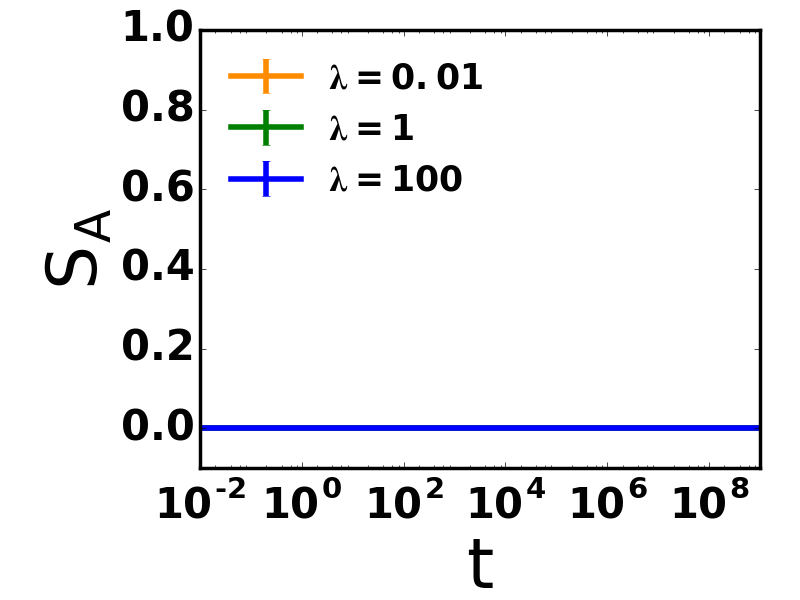 \stackunder(b)
(c)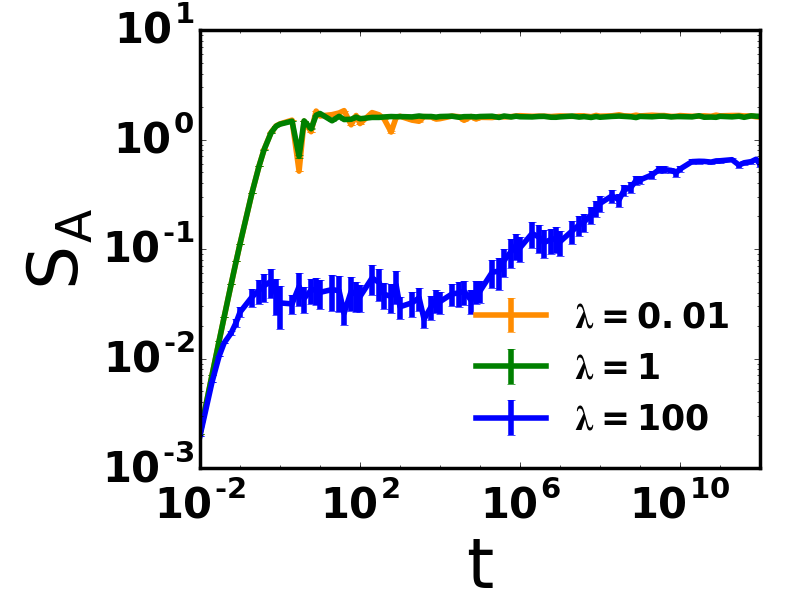 \stackunder(d)
(a) \stackunder(b)
(c)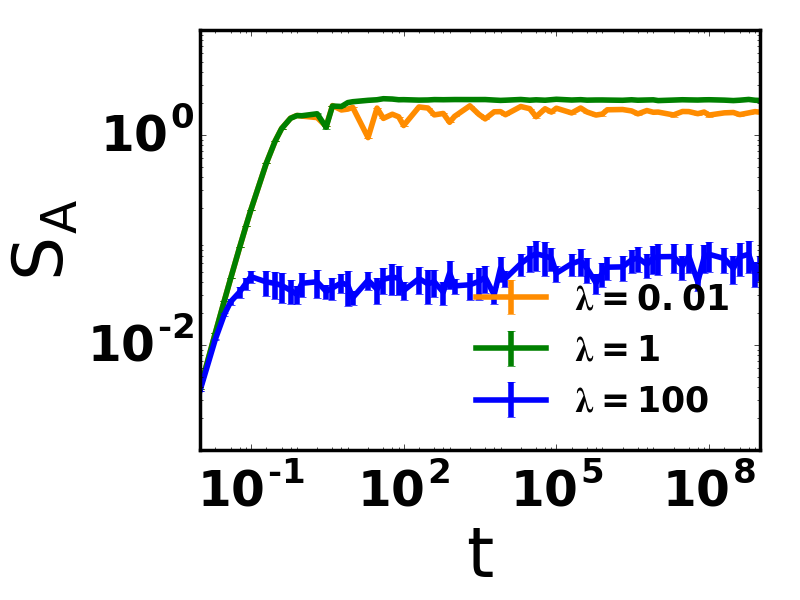 \stackunder(d)
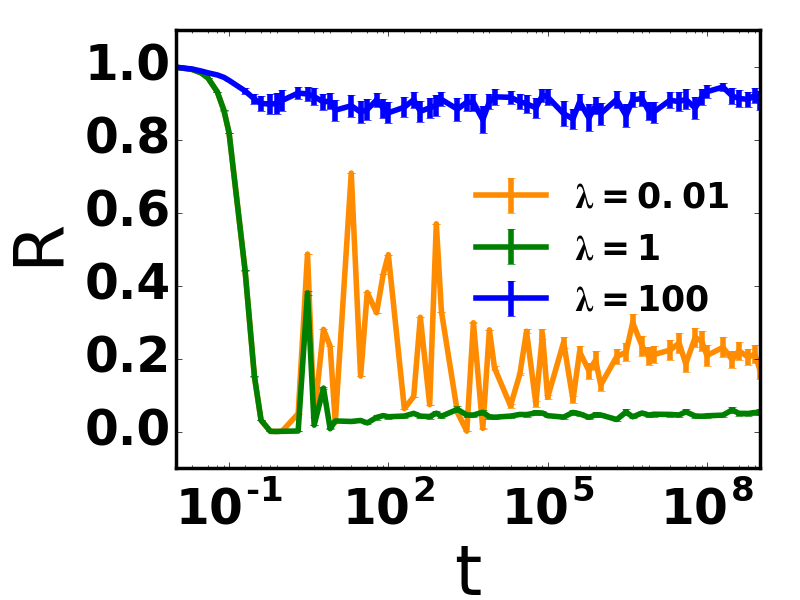
(e)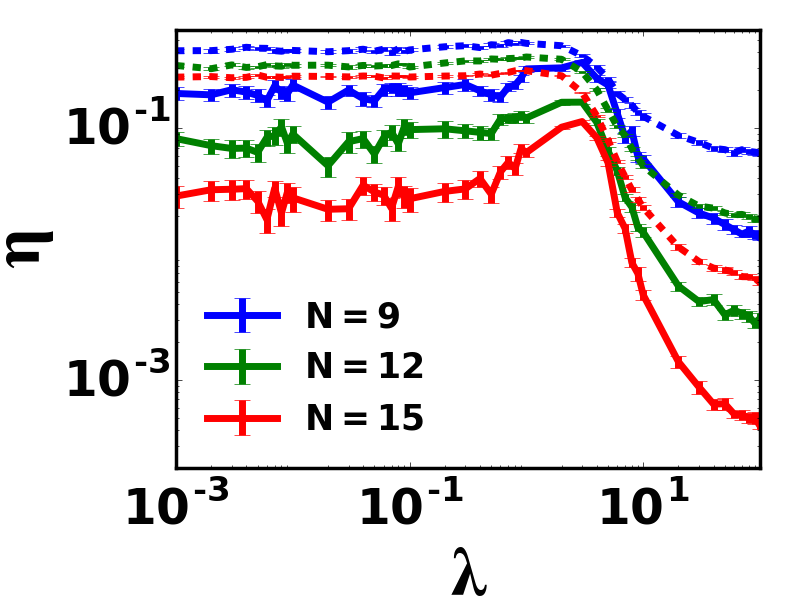 \stackunder(f)
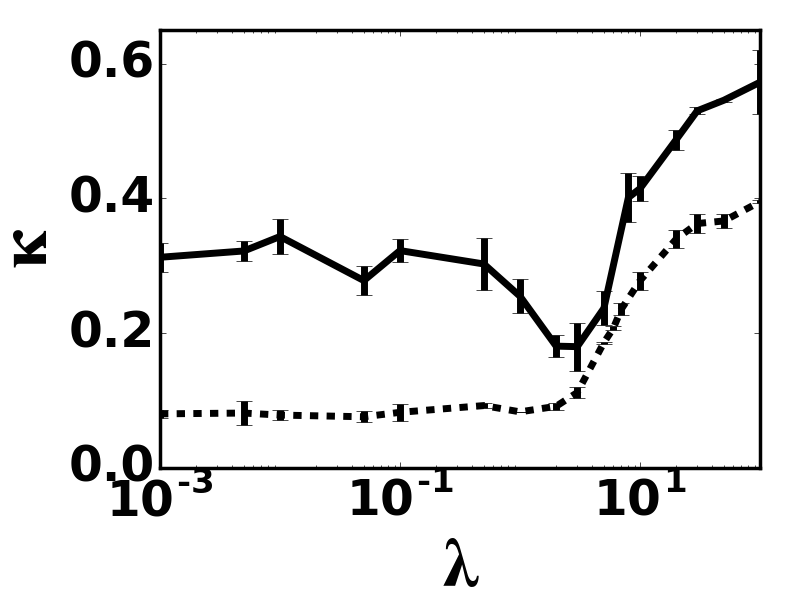
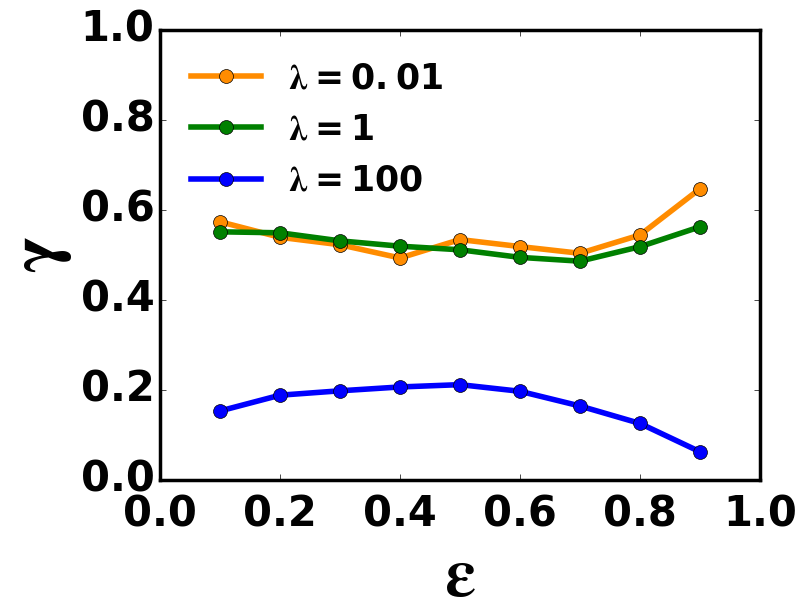
As discussed above, quasi-degeneracy and gaps in the low and high disorder limits yield inconclusive results when we study eigenvalue properties. We will now discuss MIPR at a fixed interaction strength and various disorder strengths as shown in Fig. 9. For a fixed filling fraction , we extract the exponent by averaging the MIPR over the states belonging to the energy window , where . In the low disorder regime (see Fig. 9(a)), over the entire energy spectrum indicating a nonergodic phase. We observe similar nonergodic behaviour in the intermediate regime as shown in Fig. 9(b). However, in the high disorder regime with (see Fig. 9(c)), the exponent has a significantly lower value which is a signature of MBL-like behaviour. In Fig. 10, we have plotted the exponent at different disorder strengths and observe that it shows consistent behaviour over the entire spectrum.
We also study the OPDM here, with the help of the occupation spectrum at different disorder strengths and (see Figs. 11(a)–11(c)) and over a specific energy window . At low and intermediate disorder strengths, the occupation spectrum falls monotonically with practically no dependence on system size and with no signature of the thermal value ; it also does not quite reach close to or either indicating nonergodic behaviour. However, in the high disorder regime, , it reaches close to and , indicating localized behaviour of the single-particle states and hence an MBL-like phase. The OPDM entropy is also consistent with the above inferences. While it is quite far from its thermal value (represented by dashed lines in Fig. 11(d)) in the low and intermediate disorder regimes, it shows system size independence and goes close to in the MBL-like phase.
V.2 Nonequilibrium dynamics
Next, we study the many-body non-equilibrium dynamics with the help of particle density, entanglement entropy and return probability. For the initial state given by Eq. 13, we observe the evolution of the particle density that the CLSs corresponding to distinct particles remain isolated and unaffected by the interaction strength as shown in Figs. 12(a)–12(c) for disorder strengths and which results in caging. For the initial state given by Eq. 14, the amplitude corresponding to different CLSs overlap, and the interaction comes into play. From the time evolution of the particle density (see Figs. 12(d)– 12(f)), we observe that the compact localized nature is no longer sustained. While nonergodic behaviour is observed at low and intermediate disorder, at higher disorder strength (), it is comparatively less nonergodic in the long time limit.
We also study the entanglement entropy and return probability dynamics for both the initial configurations as shown in Fig. 13. In the case of the initial state corresponding to Eq. 13, for a subsystem of size , we observe that at all disorder strengths, (see Fig. 13(a)) which supports the observation of caging from the particle density. From the return probability dynamics (see Fig. 13(b)), with increasing disorder strengths, and for , we observe that while in the low and intermediate disorder regimes, has a finite value, in the higher disorder regime, it approaches unity. For the second initial state (Eq. 14), in the low and intermediate disorder regimes after the transient, we observe a sub-diffusive regime, followed by reaching saturation at a value of the order of the thermal value as shown in Fig. 13(c). In the high disorder regime, we observe a logarithmically slow growth which eventually saturates to a sub-thermal value. The same can be observed from the evolution of return probability (see Fig.13(d)). The dynamics of return probability supports the results observed from the particle density (see Figs. 12(d)– 12(f)) and entanglement entropy with close to in the low and intermediate disorder regimes and with a finite magnitude in the high disorder regime.
In Fig. 14, we study the dynamics when the initial state is of the density wave type with particles on sites of every unit cell, i.e. with filling fraction :
| (16) |
(a)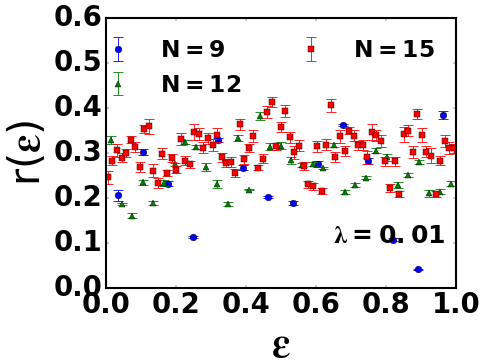 \stackunder(b)
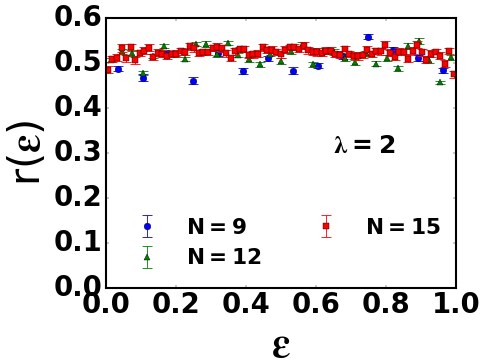
(a)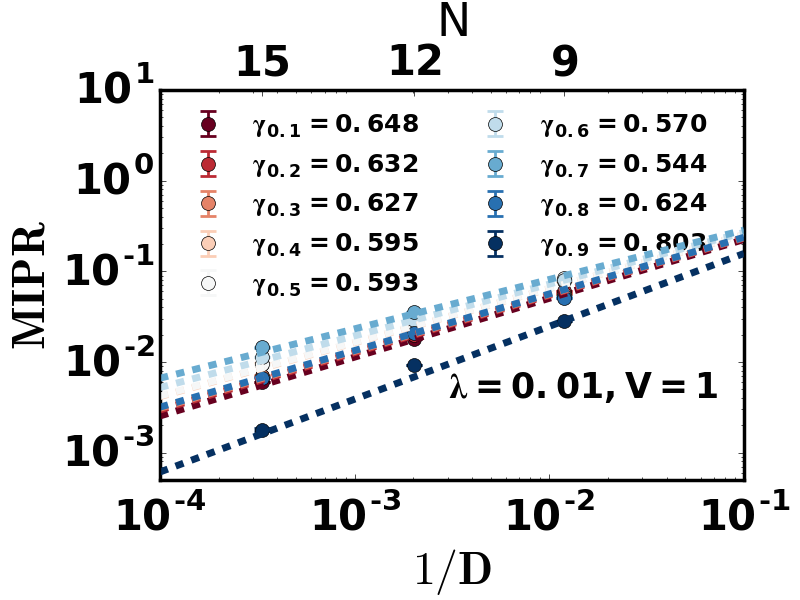 \stackunder(b)
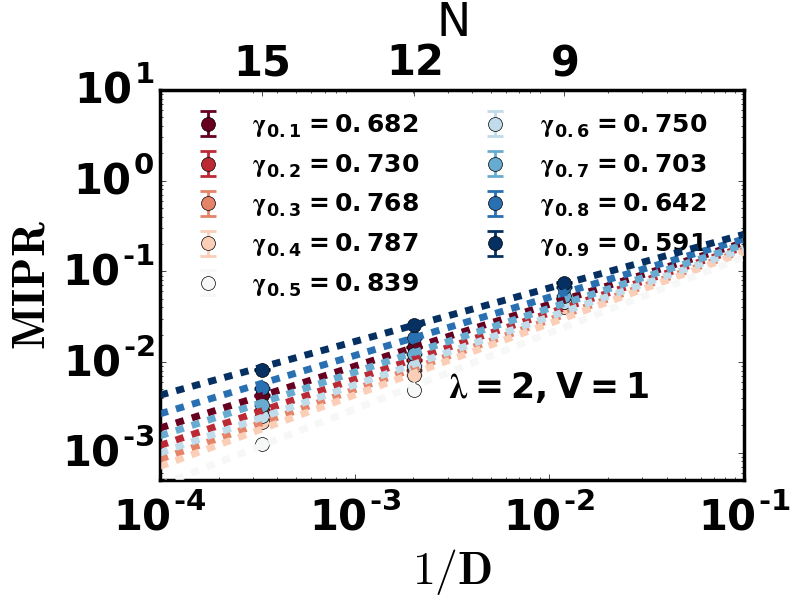 \stackunder(c)
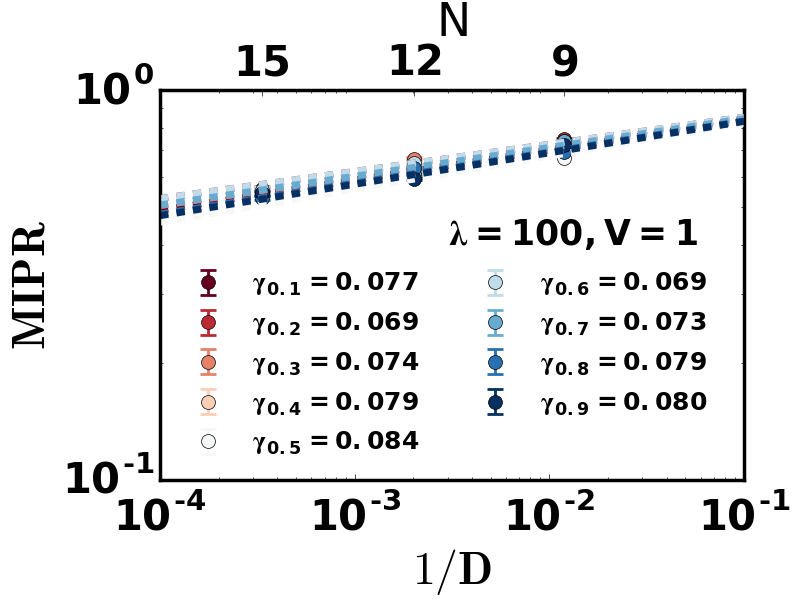
The evolution of the particle density for the interaction strength and disorder strengths and , is shown in Fig. 14(a)–(b). While at low (not shown here) and intermediate disorder, we observe that the particle density spreads uniformly over all the sites, at high disorder strength , the particle density is significantly localized over the initially occupied sites, indicating MBL-like behaviour. We also study the dynamics of entanglement entropy as shown in Fig. 14(c) at . After the initial transient, shows a subdiffusive growth in the low and intermediate disorder regimes and saturates to a large value indicating delocalization in the many-body system. The high disorder regime shows a logarithmic growth with time , saturating to a much lower magnitude compared to the thermal value indicating MBL-like behaviour. The return probability dynamics is shown in Fig. 14(d). For low disorder, it saturates to a finite value, indicating nonergodic behaviour, while in the intermediate disorder regime, the magnitude is much smaller (but ), indicating that the phase has a higher nonergodic tendency. At higher disorder strengths, it is close to unity, which is a signature of MBL-like behaviour.
We further study the normalized participation ratio (NPR) [21], in the long time limit () to understand the many-body phases. We consider two types of initial states with filling fraction , one given by Eq. (16) and another density wave type state with particles on sites of every unit cell:
| (17) |
For any time evolved many-body state, , the NPR is given as:
In the long time limit , is independent of system size in the ergodic phase; in contrast, it decays exponentially with the system size in the localized phase [21]. In Fig. 14(e), we study the dependence of NPR on the disorder strength , fixed interaction strength and increasing system sizes. Here the solid lines correspond to the initial state given by Eq. (16) while the dashed lines correspond to the initial state given by Eq. (17). We observe that in both cases, is system size dependent at all strengths of disorder , indicating the absence of the thermal phase. Further, the exponent can be extracted at various disorder strengths using the relation . In Fig. 14(f), we plot with increasing disorder strength and observe that for both initial states, in the low and intermediate disorder regime , indicating nonergodic behaviour. However, at higher disorder strength, it reaches near , which is a sign of many-body localizatione [21].
For the second type of symmetric configuration, when the disorder is only considered on the site:
| (18) |
we observe that the results are qualitatively similar to the one discussed above.
VI INTERACTIONS AND ANTISYMMETRIC DISORDER
In this section, we study the interplay of antisymmetric disorder and interactions. Specifically, we consider the antisymmetric application of the disorder on the and sites:
| (19) |
in the presence of interactions. We first study the eigenvalue and eigenvector properties, and then investigate them in a non-equilibrium dynamical setting as well.
VI.1 Statics
We begin by analyzing the eigenvalue properties with the aid of the level-spacing ratio [54], defined as:
| (20) |
Here the energies ’s are first organized in ascending order, which are used to obtain the energy level-spacings . The braces in Eq. 20 represent the average over disorder realizations. In the delocalized and localized phases, is expected to be approximately and , respectively [54]. In Fig. 15, we study the energy-resolved level spacing ratio by dividing the many-body energy spectrum into several equal segments and calculating the local average of the level-spacing ratio for each segment of the spectrum. While in the low disorder regime (see Fig. 15(a)) indicating a mixed non-ergodic phase, for (see Fig. 15(b)) suggests a thermal-like phase. As discussed in Section V.1, in the high disorder regime, the spectrum displays quasi-degeneracy and many gaps; we do not show the results here as they are inconclusive.
(a)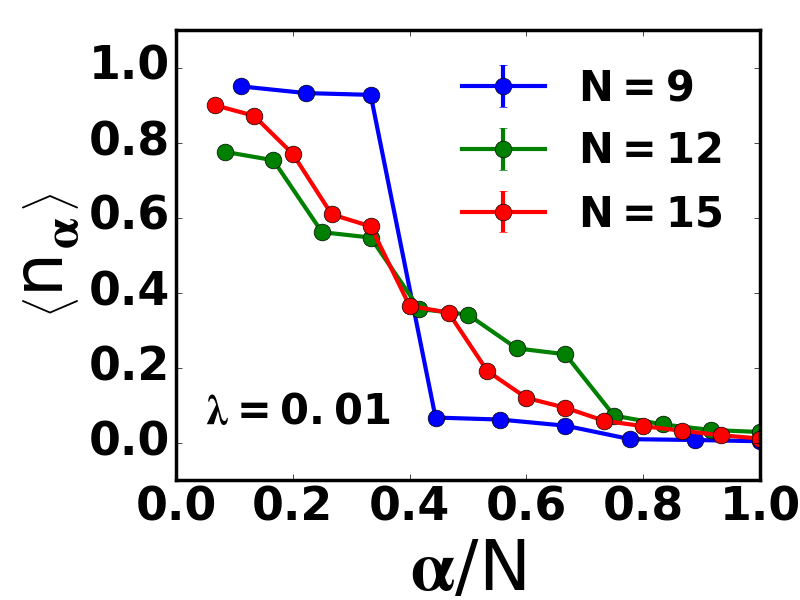 \stackunder(b)
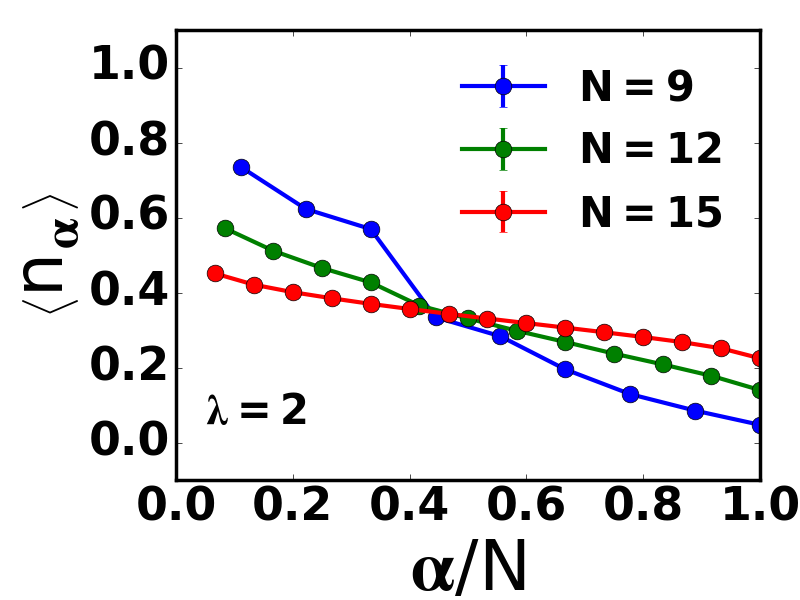
(c)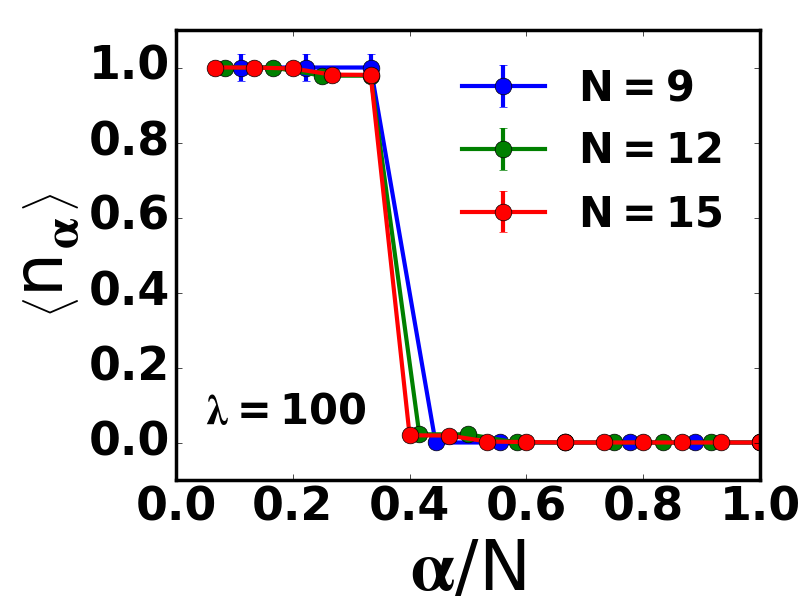 \stackunder(d)
We next study the eigenvector properties with the help of MIPR and the OPDM. We study MIPR at a fixed interaction strength and various disorder strengths as shown in Fig. 16. For a fixed filling fraction , we extract the exponent by averaging the MIPR over the states belonging to the energy window , where . In the low disorder regime, (see Fig. 16(a)), we observe a nonergodic mixed phase owing to the spread of the exponent over a wide range . In the intermediate disorder case, has a significantly higher magnitude, which signifies thermal-like behaviour (see Fig. 16(b)). At high disorder strength , the exponent has a small magnitude over the entire spectrum indicating an MBL-like phase, as shown in Fig. 16(c). In Fig. 17, we have plotted the exponent at different disorder strengths and observe that in the low disorder regime, corresponding to the energy window about , which signifies the presence of thermal-like states that contribute to the mixed nonergodic behaviour. We observe that the intermediate and high disorder regimes show thermal-like and MBL-like behaviour, respectively, over the entire spectrum.
We next study the OPDM with the help of the occupation spectrum at different disorder strengths and (see Figs. 18(a)–18(c)) and over the energy window . In the intermediate regime (Fig. 18(b)), we observe that with increasing system size, spreads about the filling fraction with a characteristic inverse system-size variation on either side of the critical value of the , indicating a thermal phase. In contrast, in the high disorder regime (Fig. 18(c)), reaches close to and , indicating localized behaviour of the single-particle states. Hence, the phase is MBL-like. In the low disorder regime ((Fig. 18(a))), the occupation spectrum is neither spread about the thermal value nor does it reach close to and (like in MBL), thus indicating mixed nonergodic behaviour. The OPDM entropy (see in Fig. 18(d)) signifies a nonergodic phase in the low disorder regime as it neither reaches the thermal value (dashed lines) nor the MBL value (). In the intermediate disorder case, reaches its thermal value denoted by dashed lines, especially for , while it approaches in the high disorder case, indicating MBL-like behaviour.
(a)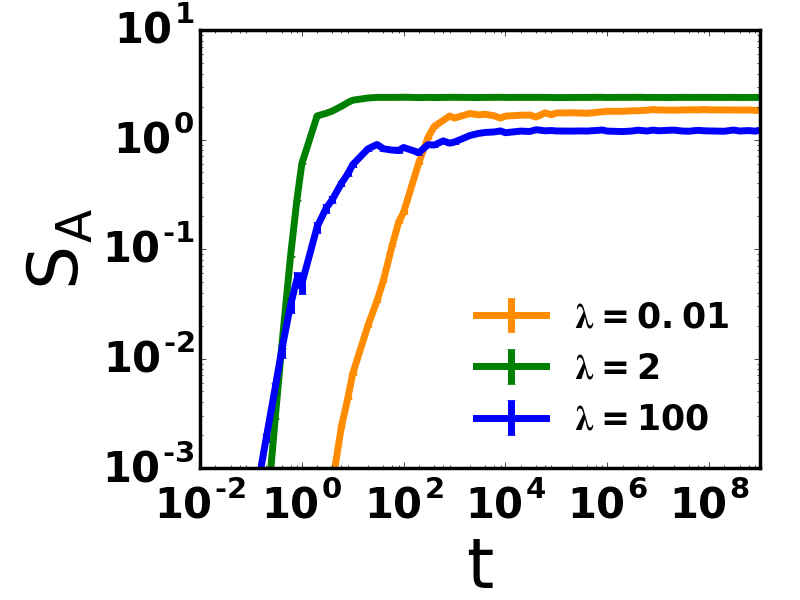 \stackunder(b)
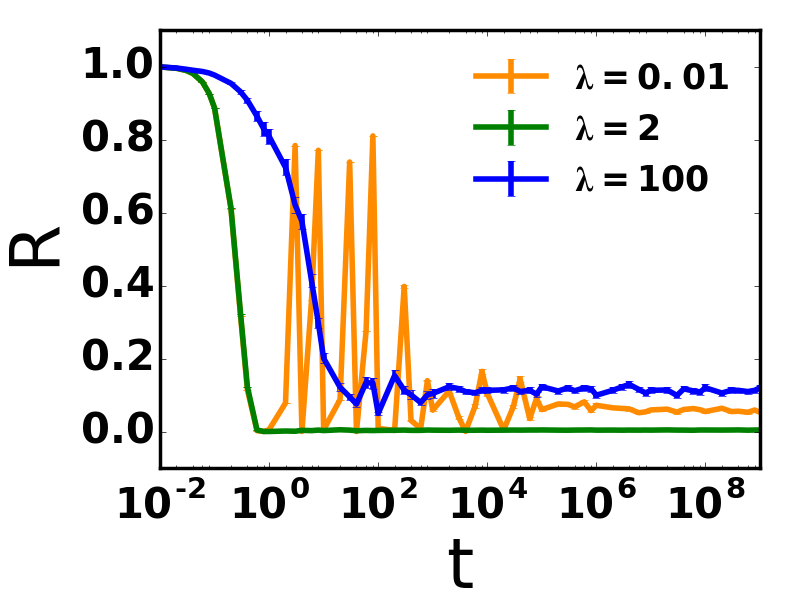
(c)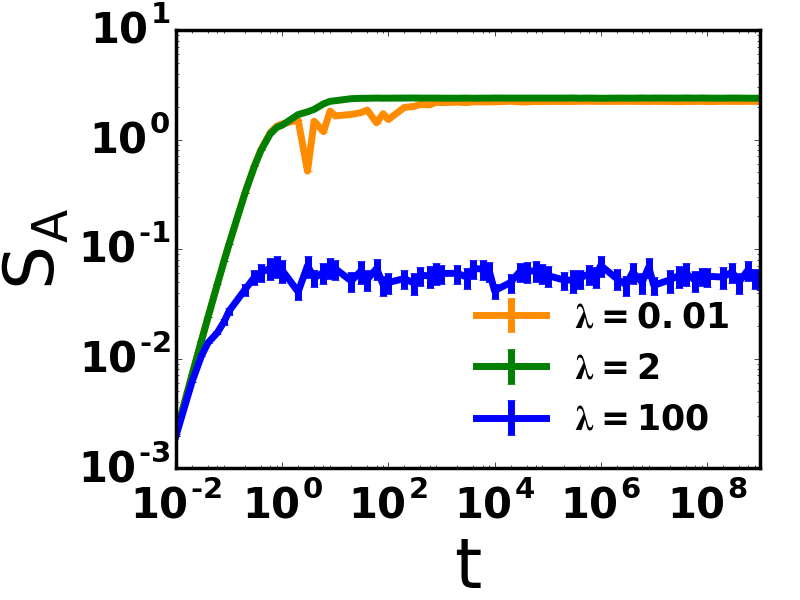 \stackunder(d)
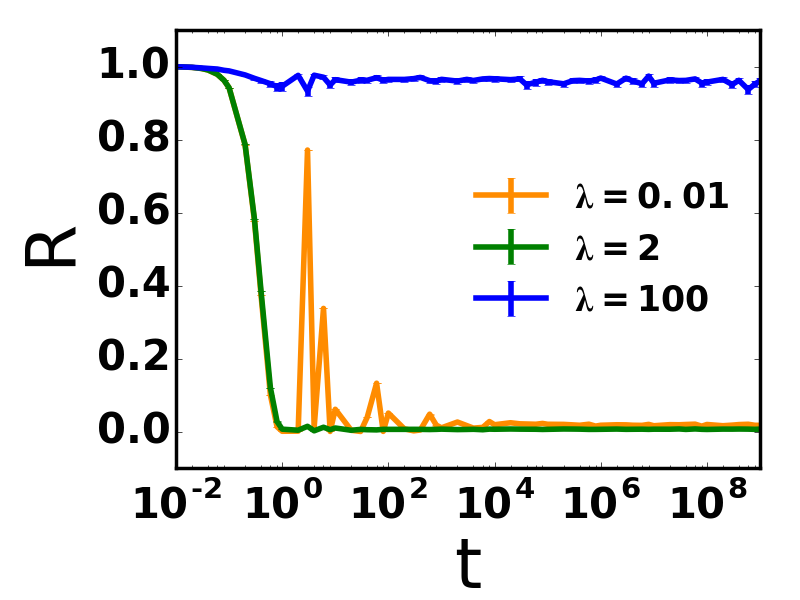
(a)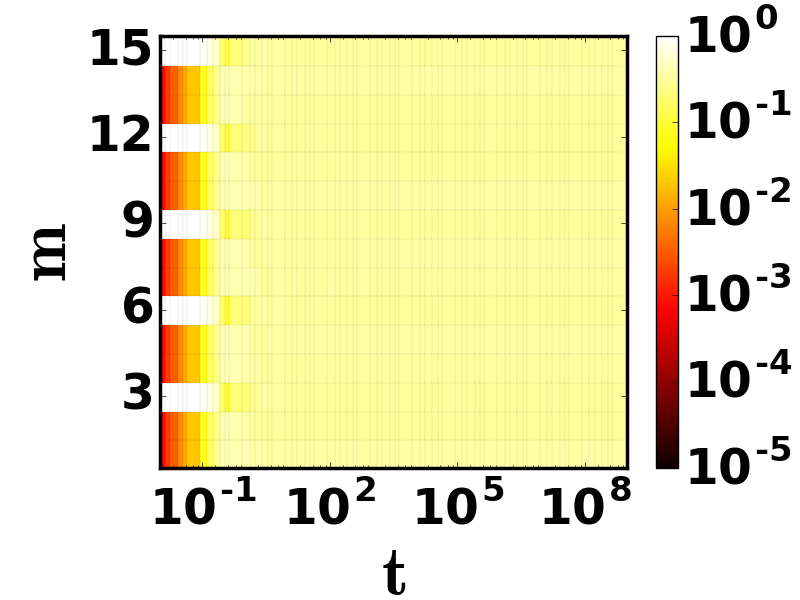 \stackunder(b)
(c)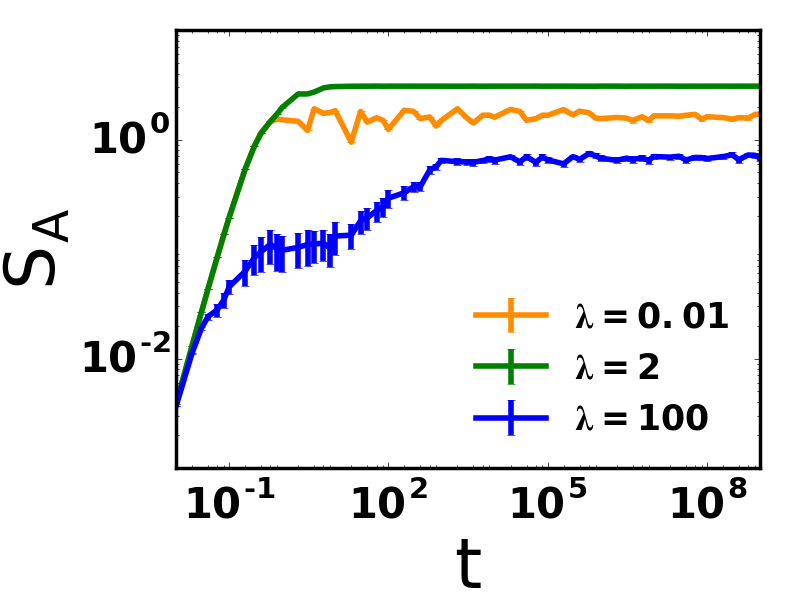 \stackunder(d)
(e) \stackunder(f)
VI.2 Nonequilibrium dynamics
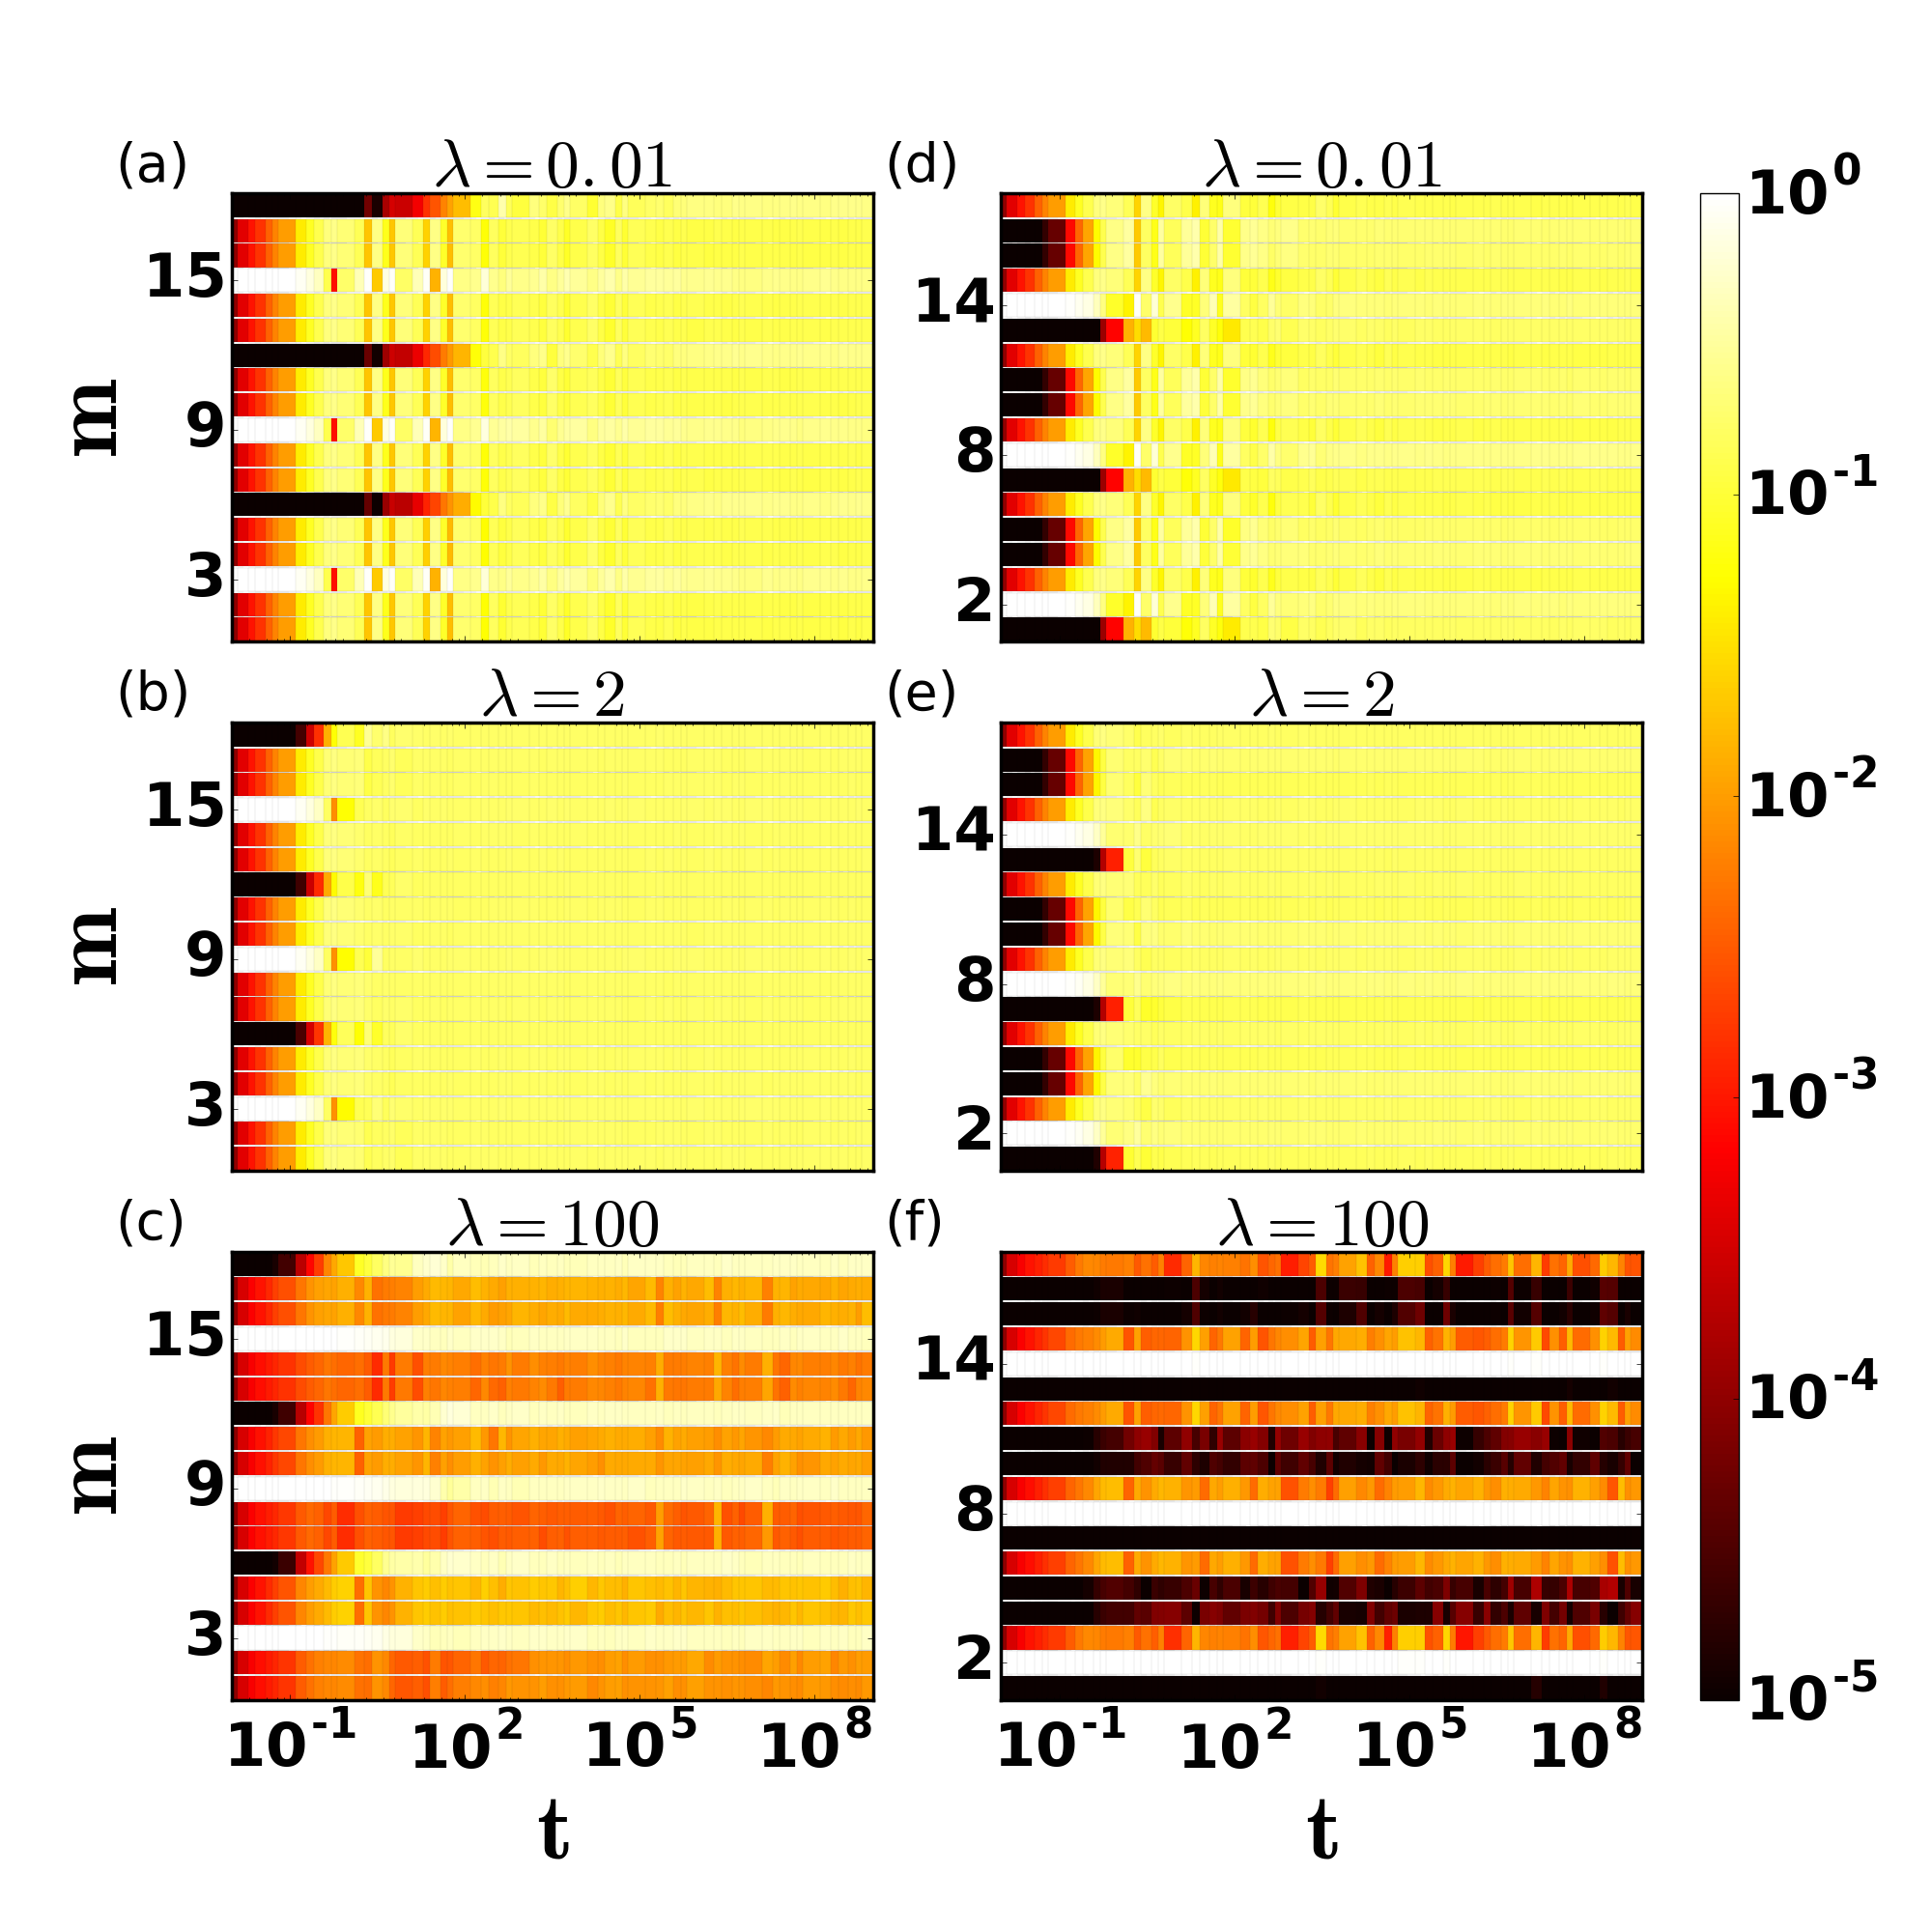
We next study many-body non-equilibrium dynamics with several measures such as particle density, entanglement entropy and return probability. We first consider the initial state given by Eq. 13, a product state for a system size and filling fraction , with particles occupying the sites of alternate unit cells. From the evolution of the particle density shown in Fig. 19(a)–19(c), we observe that for all disorder strengths, the CLS-like behaviour persists at early times (). However, for time , while the particle density spreads uniformly over the entire lattice in the low and intermediate disorder regimes, it shows a comparatively less ergodic behaviour in the high disorder case. We also study the dynamics for the second initial state given by Eq. 14. For low and intermediate disorder strengths (see Fig. 19(d)–19(e)), we observe that the particle density is uniformly spread over all the sites indicating ergodic behaviour. In contrast, at higher disorder strength (see Fig. 19(f)), the particle density is significantly localized over the initially occupied sites.
The entanglement entropy and return probability dynamics for both the initial configurations are shown in Fig. 20. In the case of the initial state corresponding to Eq. 13, has near-zero magnitude at early times, as shown in Fig. 20(a). However, the low and intermediate disorder regimes saturate to a large magnitude after the initial transient. At higher disorder strengths , we observe that the behaviour is relatively more localized with the entanglement entropy (see Fig. 20(a)) saturating to a lower magnitude. From the return probability dynamics as shown in Fig. 20(b), while for low and high disorder saturates to a finite value indicating nonergodic behaviour, in the intermediate disorder regime, which signifies a thermal-like phase. For the second initial state given by Eq. 14, after the initial transient, in the low disorder regime, we observe oscillatory behaviour followed by a subdiffusive growth after which saturates near the thermal value(see Fig. 20(c)). The behaviour of in the intermediate disorder regime is similar to the low disorder case, except that the oscillatory part is absent. After the transient, there is a sub-diffusive increment in , which saturates to a large value indicating delocalization in the many-body system. In contrast, in the high disorder region, it saturates to a low value signifying MBL. We also study the evolution of the return probability, as shown in Fig. 20(d). In the long time limit, it saturates to in the low and intermediate disorder regimes indicating thermal-like behaviour. At the same time, it is close to in the high disorder regime, which is a signature of many-body localization.
We next study the non-equilibrium dynamics of the system for the two initial states by considering filling fraction . The evolution of the particle density is shown in Fig. 21(a)– 21(b), at the interaction strength and for disorder strengths and . We observe mixed nonergodic behaviour at low disorder strength (not shown here). In contrast, we see ergodic behaviour at intermediate disorder strengths, with the particle density spread uniformly over all the sites. At high disorder strength , the particle density is significantly localized over the initially occupied sites. We also study the dynamics of entanglement entropy as shown in Fig. 21(c) at . After the initial transient, shows a subdiffusive growth in both the low and intermediate disorder regimes; however, it saturates to a large value for , indicating an ergodic phase, while for , it saturates to a comparatively lower value indicating weak delocalization in the system. In the high disorder case, after the initial transient, saturates to a sub-thermal value indicating localization. From the dynamics of the return probability (see Fig. 21(d)), we observe that it saturates to a finite value in the low and high disorder phases. In contrast, it saturates close to in the intermediate phase indicating thermal behaviour.
We next study the NPR [21] in the long time limit for the initial states given by Eq. 16 (solid lines) and Eq. 17 (dashed lines) as shown in Fig. 21(e). In the case of the initial state given by Eq. 16, while is system size dependent in the low and high disorder regimes, it shows system size independence in the intermediate disorder case. We then extract the exponent and plot it as a function of disorder strength in Fig. 21(f). In the low disorder case, lies between and , indicating nonergodic behaviour while in the intermediate regime , indicating a thermal phase. In contrast, in the high disorder regime, we observe , which is a signature of many-body localization. For the other initial state given by Eq. 17, in the low disorder regime, tends to be system size-independent (see Fig. 21(e)), with close to (Fig. 21(f)), which indicates that it is close to the ergodic phase. In the intermediate regime, the phase is thermal as is system size independent and . In the higher disorder regime, is system size dependent with close to , indicating an MBL-like phase.
VII Conclusion
In this work, we have systematically investigated the single-particle dynamics and the interplay of many-body interactions and quasiperiodic AA disorder in the one-dimensional ABF diamond lattice. We find that the compact localized states observed for the clean system and when the disorder is applied symmetrically in the single particle case [36] sustain quantum caging even in a non-equilibrium dynamical set-up. In contrast, in the long time limit, the wave function spreads over the entire lattice in the presence of antisymmetric disorder. This can be attributed to the loss of compact localization and the presence of multifractal eigenstates in the static case [36].
In the presence of interactions and zero disorder in the system, nonergodic phases are observed at all interaction strengths. In general, non-equilibrium dynamics support the findings from the static case. However, the many-body system manifests quantum caging for specially engineered initial states. When our interacting many-body system is subjected to symmetric disorder, nonergodic phases are observed at low and intermediate disorder strengths. In contrast, an MBL-like phase is observed at higher disorder strengths. Studying non-equilibrium dynamics, we find nonergodic regimes in the case of low and intermediate disorder strengths, while localization characteristics dominate in the high disorder case. Quantum caging behaviour is supported for specific initial configurations, independent of the strength of interaction or disorder.
The antisymmetric application of disorder in the presence of interactions in the system result in three distinct phases: a nonergodic mixed phase at low disorder strengths, a thermal phase at intermediate disorder strengths and an MBL-like phase at higher strengths of disorder. Even in the mixed nonergodic phase, some states show thermal-like behaviour. A study of the non-equilibrium dynamics shows that for different initial states, in the low disorder regime, a mixed phase exists with a varying magnitude of non-ergodicity; for the intermediate disorder, the phase is always thermal. In the high disorder case, the phase shows varying magnitudes of non-ergodicity, inclined towards many-body localization.
We also want to remark on the case when the on-site disorder is chosen from a uniform uncorrelated random distribution in the presence of interactions. Interestingly, for both the symmetric and antisymmetric cases, the resulting phase is similar in the low, intermediate and high disorder strengths to those obtained when applying the quasiperiodic disorder. We conclude that the observed many-body phases are due to the symmetry of the applied disorder as reported previously in the single particle case [36]. Also, in the antisymmetric case, the presence of mixed non-ergodic, thermal and MBL-like phases at the low, intermediate and high disorder strengths, respectively, is qualitatively similar to phases that emerge as a result of the application of the uniform disorder on all sites as reported in [31].
Thus, our work shows that the interplay of quasiperiodic disorder, interactions and flat-band structure in the diamond lattice results in an exciting phase diagram. Exploring distinctive phases in other interacting and disordered flat band systems would be an interesting direction for further research. With the recent surge in the experimental study of engineered flat-band systems, such phases could be realized in optical lattices for cold atoms.
Acknowledgements.
We are grateful to Ajith Ramachandran for the careful reading of the manuscript and discussions. We are grateful to the High-Performance Computing (HPC) facility at IISER Bhopal, where large-scale computations of this project were run. A.A. is grateful to the Council of Scientific and Industrial Research (CSIR), India, for her PhD fellowship. N.R. acknowledges support from the Indian Institute of Science under the IoE-IISc fellowship program. A.S. acknowledges financial support from SERB via the grant (File Number: CRG/2019/003447) and DST via the DST-INSPIRE Faculty Award [DST/INSPIRE/04/2014/002461].APPENDIX: ENTANGLEMENT ENTROPY
In this section, we analyze the effect of interactions on the ABF diamond lattice by calculating the half-chain entanglement entropy of all the many-body eigenstates. We first discuss the case when interactions are turned on in the disorder-free model, and then consider cases where disorder is applied in a symmetric and antisymmetric manner in the presence of interactions.
Fig. 22 shows the half-chain entanglement entropy of all the many-body eigenstates at various interaction strengths for a system size and filling fraction . For all interaction strengths, and , while a significant fraction of the eigenstates shows a large magnitude of the entanglement entropy, it does not vary smoothly with the fractional eigenstate index . This indicates the presence of a nonergodic phase, which agrees with the MIPR and OPDM results shown in Section IV.
(a)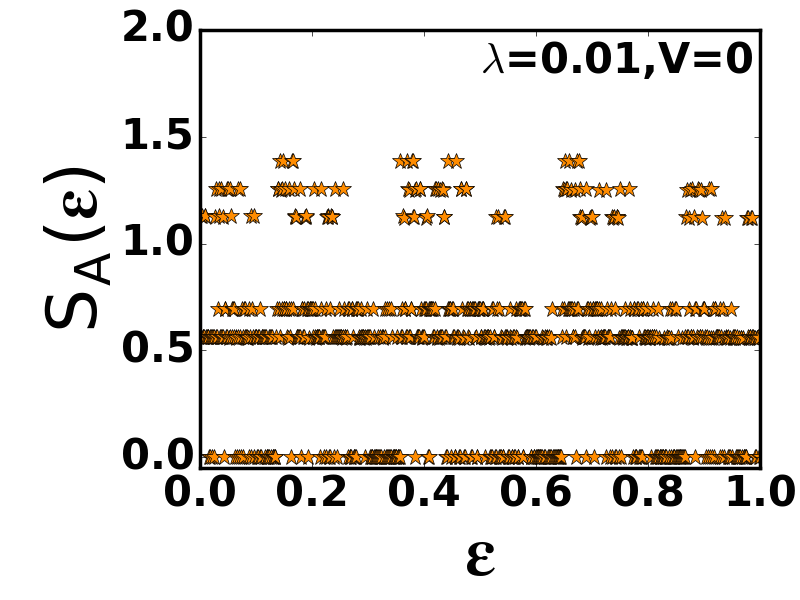 \stackunder(b)
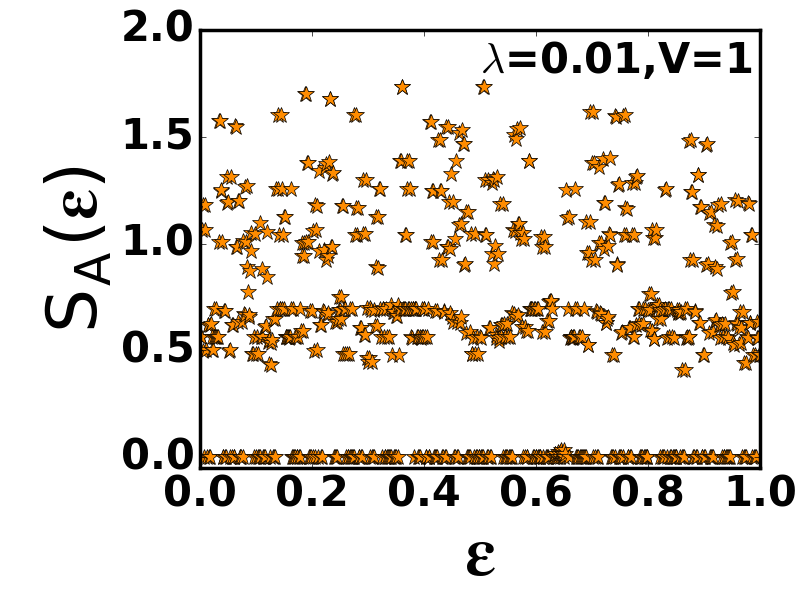
(c)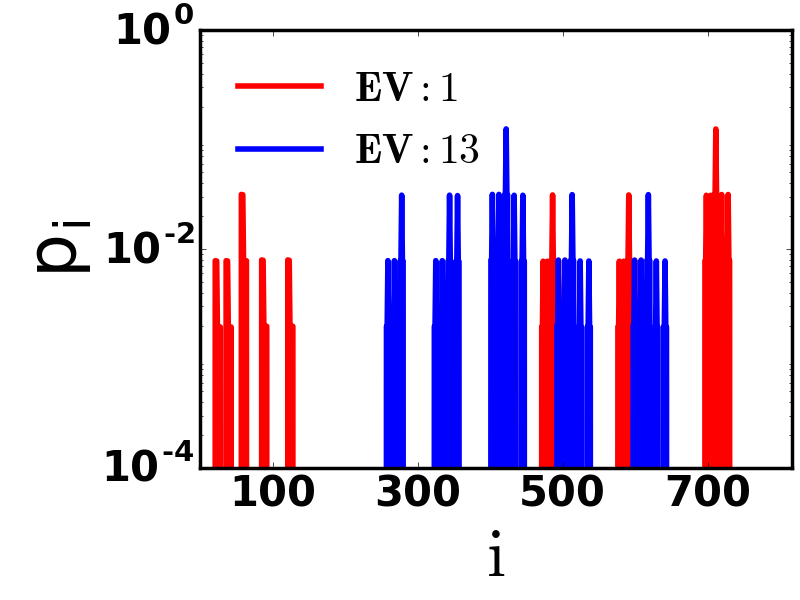 \stackunder(d)
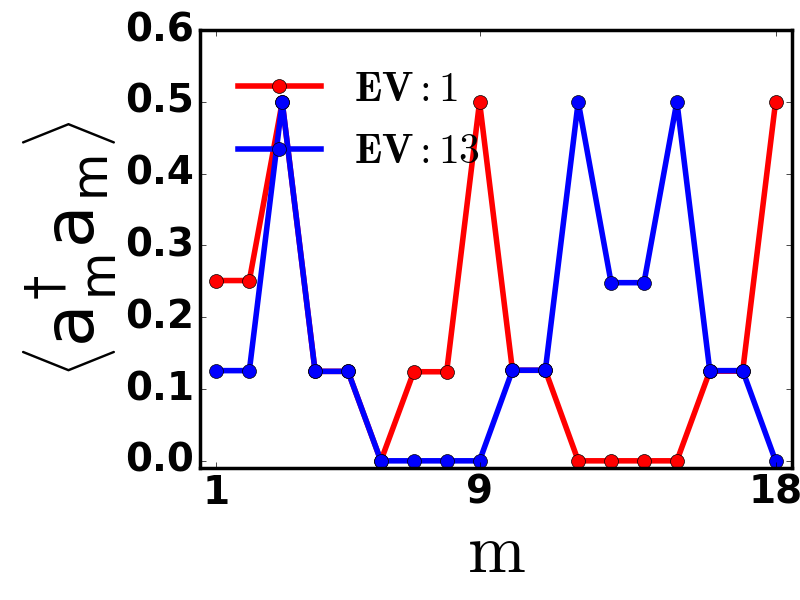
(a)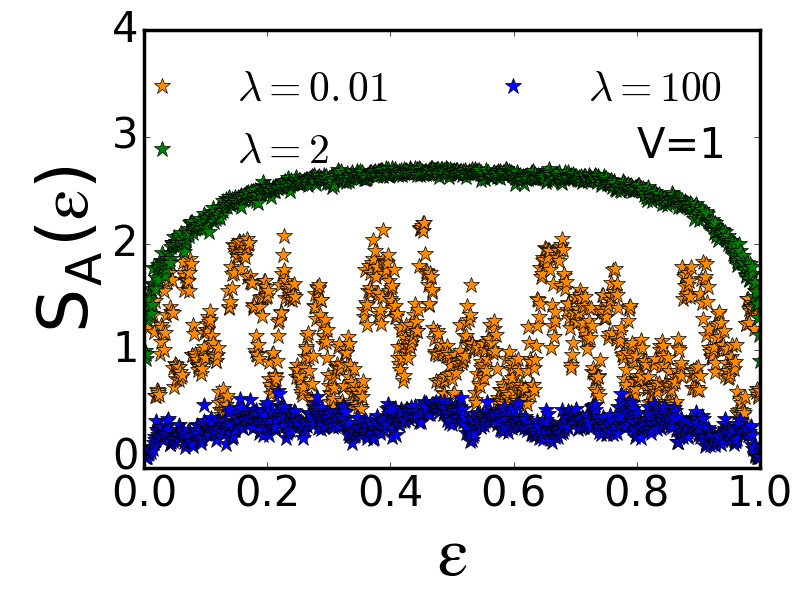 \stackunder(b)
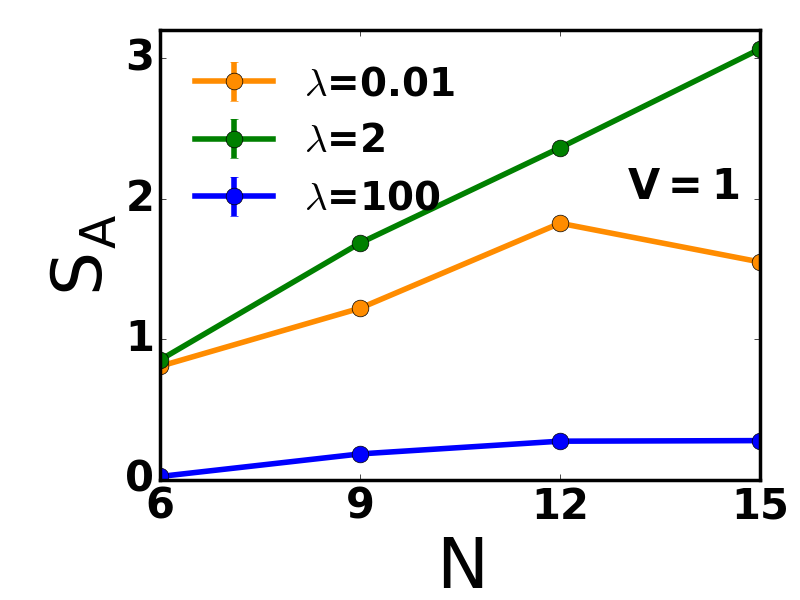
(c)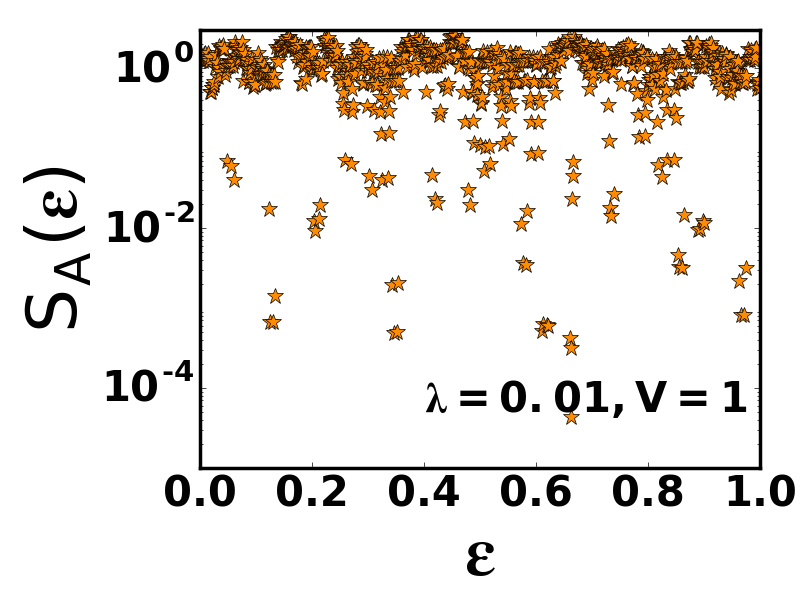 \stackunder(d)
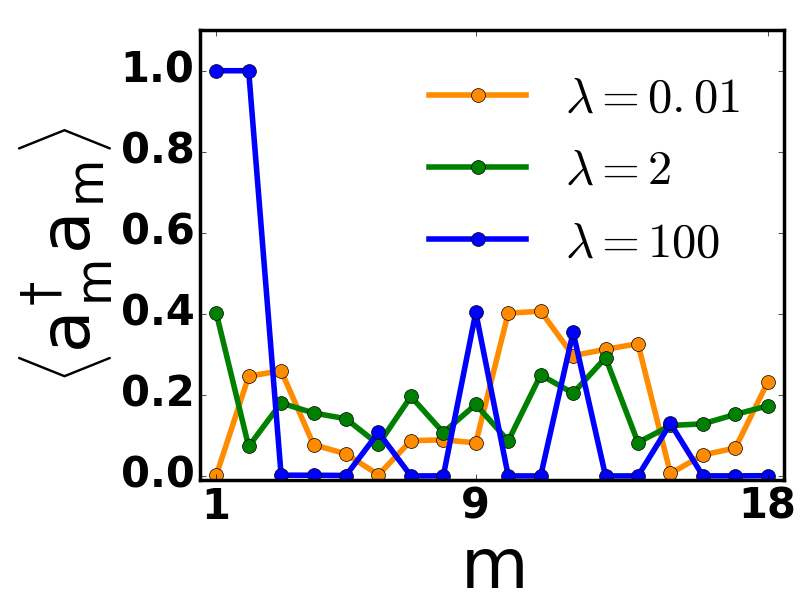
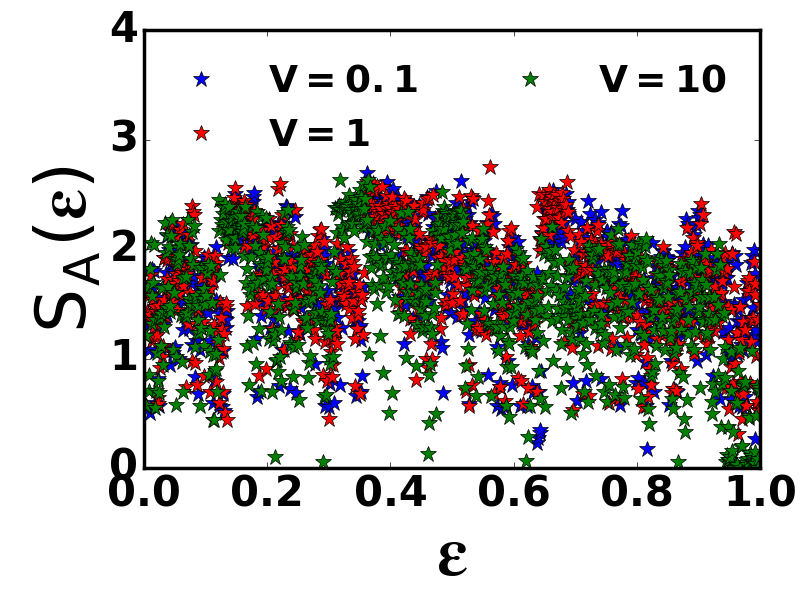
Next, we study the application of symmetric disorder; we have reported the presence of compactly localized states [36] in the single-particle case. Interestingly, in the case of non-interacting fermions, from the half-chain entanglement entropy, we observe that the eigenstates can be broadly divided into two categories (see Fig. 23(a)), one with and the other with . We choose a state corresponding to with index and another corresponding to , with index . In Fig. 23(c), we have plotted both eigenstates in the particle number-constrained space with the index running over and observe non-zero amplitude only on a finite number of sites . For the given state, we calculate the particle density (see Eq. 9) on all the sites as shown in Fig. 23(d). In the case of the state corresponding to , the particle density is zero both at the subsystem boundary ( or ) as well as the system boundaries ( or ) as periodic boundary conditions have been considered thereby disassociating the two subsystems. However, the same is not true for the states where the entanglement is non-zero. This effect persists for all strengths of the disorder as well as on the introduction of interactions (see Fig. 23(b)). We conclude that this is a many-body effect in a disordered system hosting compactly localized states. Also, a blind disorder averaging the entanglement entropy would wash out this behaviour, as shown in Fig. 24.
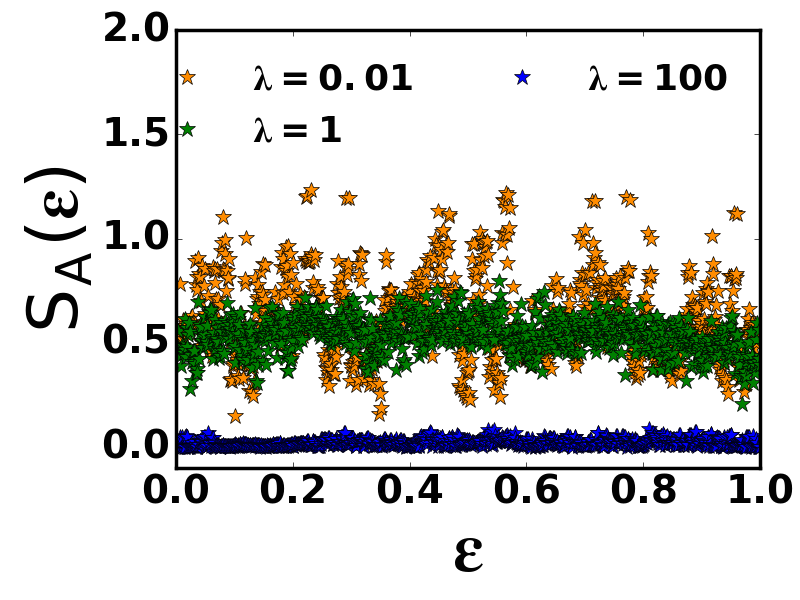
Fig. 25(a) shows the half-chain entanglement entropy for all the many-body eigenstates in the case of antisymmetric application of disorder and interaction strength . In the low disorder case, shows both rises and dips, indicating the presence of a nonergodic mixed phase. In the intermediate disorder regime, has a smooth dependence on the eigenstates with a large magnitude indicating thermal behaviour. In contrast, for the higher disorder , we observe with a meagre value indicating MBL-like behaviour. These results agree with those discussed in Section VI from the study of MIPR and OPDM. In Fig. 25(b), we plot the entanglement entropy for a fixed filling fraction and subsystem size with increasing system size in the energy window [57]. We find that the intermediate disorder case () follows a volume law scaling while an area law-like behaviour is seen in the high disorder regime (). In the low disorder regime, initially increases and eventually saturates as a function of system size, thus indicating nonergodic behaviour. We also study a single disorder realization of the half-chain entanglement entropy with and (see Fig. 25(c)). Unlike the symmetric disorder case, we observe that for any eigenstate. We also study the particle density (see Fig. 25(d)) for the infinite temperature state and observe that in the low disorder case (), it is unevenly spread over the lattice sites indicating nonergodic behaviour. In contrast, at , it spreads out uniformly, showing thermal behaviour, and at higher disorder strengths , it is localized over a few sites.
References
- Maimaiti et al. [2017] W. Maimaiti, A. Andreanov, H. C. Park, O. Gendelman, and S. Flach, Compact localized states and flat-band generators in one dimension, Phys. Rev. B 95, 115135 (2017).
- Sathe et al. [2021] P. Sathe, F. Harper, and R. Roy, Compactly supported Wannier functions and strictly local projectors, Journal of Physics A: Mathematical and Theoretical 54, 335302 (2021).
- Parameswaran et al. [2013] S. A. Parameswaran, R. Roy, and S. L. Sondhi, Fractional quantum Hall physics in topological flat bands, Comptes Rendus Physique 14, 816 (2013), topological insulators / Isolants topologiques.
- Bergholtz and Liu [2013] E. J. Bergholtz and Z. Liu, Topological flat band models and fractional Chern insulators, International Journal of Modern Physics B 27, 1330017 (2013).
- Derzhko et al. [2015] O. Derzhko, J. Richter, and M. Maksymenko, Strongly correlated flat-band systems: The route from Heisenberg spins to Hubbard electrons, International Journal of Modern Physics B 29, 1530007 (2015).
- Flach et al. [2014] S. Flach, D. Leykam, J. D. Bodyfelt, P. Matthies, and A. S. Desyatnikov, Detangling flat bands into Fano lattices, EPL (Europhysics Letters) 105, 30001 (2014).
- Leykam et al. [2018] D. Leykam, A. Andreanov, and S. Flach, Artificial flat band systems: from lattice models to experiments, Advances in Physics: X 3, 1473052 (2018).
- Vidal et al. [2000] J. Vidal, B. Douçot, R. Mosseri, and P. Butaud, Interaction induced delocalization for two particles in a periodic potential, Phys. Rev. Lett. 85, 3906 (2000).
- Douçot and Vidal [2002] B. Douçot and J. Vidal, Pairing of Cooper pairs in a fully frustrated Josephson-junction chain, Phys. Rev. Lett. 88, 227005 (2002).
- Vidal et al. [1998] J. Vidal, R. Mosseri, and B. Douçot, Aharonov-Bohm cages in two-dimensional structures, Phys. Rev. Lett. 81, 5888 (1998).
- Vidal et al. [2001] J. Vidal, P. Butaud, B. Douçot, and R. Mosseri, Disorder and interactions in Aharonov-Bohm cages, Phys. Rev. B 64, 155306 (2001).
- Evers and Mirlin [2008] F. Evers and A. D. Mirlin, Anderson transitions, Rev. Mod. Phys. 80, 1355 (2008).
- Fleishman and Anderson [1980] L. Fleishman and P. W. Anderson, Interactions and the anderson transition, Phys. Rev. B 21, 2366 (1980).
- Altshuler et al. [1997] B. L. Altshuler, Y. Gefen, A. Kamenev, and L. S. Levitov, Quasiparticle lifetime in a finite system: A nonperturbative approach, Phys. Rev. Lett. 78, 2803 (1997).
- Jacquod and Shepelyansky [1997] P. Jacquod and D. L. Shepelyansky, Emergence of quantum chaos in finite interacting fermi systems, Phys. Rev. Lett. 79, 1837 (1997).
- Basko et al. [2006] D. Basko, I. Aleiner, and B. Altshuler, Metal–insulator transition in a weakly interacting many-electron system with localized single-particle states, Annals of Physics 321, 1126 (2006).
- Polkovnikov et al. [2011] A. Polkovnikov, K. Sengupta, A. Silva, and M. Vengalattore, Colloquium: Nonequilibrium dynamics of closed interacting quantum systems, Rev. Mod. Phys. 83, 863 (2011).
- Abanin et al. [2019] D. A. Abanin, E. Altman, I. Bloch, and M. Serbyn, Colloquium: Many-body localization, thermalization, and entanglement, Rev. Mod. Phys. 91, 021001 (2019).
- Pal and Huse [2010] A. Pal and D. A. Huse, Many-body localization phase transition, Phys. Rev. B 82, 174411 (2010).
- Nandkishore and Huse [2015] R. Nandkishore and D. A. Huse, Many-body localization and thermalization in quantum statistical mechanics, Annual Review of Condensed Matter Physics 6, 15 (2015), https://doi.org/10.1146/annurev-conmatphys-031214-014726 .
- Iyer et al. [2013] S. Iyer, V. Oganesyan, G. Refael, and D. A. Huse, Many-body localization in a quasiperiodic system, Phys. Rev. B 87, 134202 (2013).
- Schiulaz et al. [2015] M. Schiulaz, A. Silva, and M. Müller, Dynamics in many-body localized quantum systems without disorder, Phys. Rev. B 91, 184202 (2015).
- van Horssen et al. [2015] M. van Horssen, E. Levi, and J. P. Garrahan, Dynamics of many-body localization in a translation-invariant quantum glass model, Phys. Rev. B 92, 100305 (2015).
- Mondaini and Cai [2017] R. Mondaini and Z. Cai, Many-body self-localization in a translation-invariant hamiltonian, Phys. Rev. B 96, 035153 (2017).
- Tilleke et al. [2020] S. Tilleke, M. Daumann, and T. Dahm, Nearest neighbour particle-particle interaction in fermionic quasi one-dimensional flat band lattices, Zeitschrift für Naturforschung A 75, 393 (2020).
- Danieli et al. [2020] C. Danieli, A. Andreanov, and S. Flach, Many-body flatband localization, Phys. Rev. B 102, 041116 (2020).
- Orito et al. [2021a] T. Orito, Y. Kuno, and I. Ichinose, Nonthermalized dynamics of flat-band many-body localization, Phys. Rev. B 103, L060301 (2021a).
- Danieli et al. [2021] C. Danieli, A. Andreanov, T. Mithun, and S. Flach, Quantum caging in interacting many-body all-bands-flat lattices, Phys. Rev. B 104, 085132 (2021).
- Vakulchyk et al. [2021] I. Vakulchyk, C. Danieli, A. Andreanov, and S. Flach, Heat percolation in many-body flat-band localizing systems, Phys. Rev. B 104, 144207 (2021).
- Danieli et al. [2022] C. Danieli, A. Andreanov, and S. Flach, Many-body localization transition from flat-band fine tuning, Phys. Rev. B 105, L041113 (2022).
- Roy et al. [2020] N. Roy, A. Ramachandran, and A. Sharma, Interplay of disorder and interactions in a flat-band supporting diamond chain, Phys. Rev. Research 2, 043395 (2020).
- Orito et al. [2022] T. Orito, Y. Kuno, and I. Ichinose, Deformation of localized states and state transitions in systems of randomly hopping interacting fermions, Phys. Rev. B 105, 094201 (2022).
- Orito et al. [2021b] T. Orito, Y. Kuno, and I. Ichinose, Interplay and competition between disorder and flat band in an interacting creutz ladder, Phys. Rev. B 104, 094202 (2021b).
- Goda et al. [2006] M. Goda, S. Nishino, and H. Matsuda, Inverse anderson transition caused by flatbands, Phys. Rev. Lett. 96, 126401 (2006).
- Shukla [2018] P. Shukla, Disorder perturbed flat bands. ii. search for criticality, Phys. Rev. B 98, 184202 (2018).
- Ahmed et al. [2022] A. Ahmed, A. Ramachandran, I. M. Khaymovich, and A. Sharma, Flat band based multifractality in the all-band-flat diamond chain, Phys. Rev. B 106, 205119 (2022).
- Aubry and André [1980] S. Aubry and G. André, Analyticity breaking and Anderson localization in incommensurate lattices, Ann. Israel Phys. Soc. 3, 18 (1980).
- Modugno [2009] M. Modugno, Exponential localization in one-dimensional quasi-periodic optical lattices, New Journal of Physics 11, 033023 (2009).
- Danieli et al. [2015] C. Danieli, J. D. Bodyfelt, and S. Flach, Flat-band engineering of mobility edges, Phys. Rev. B 91, 235134 (2015).
- Kravtsov et al. [2015] V. E. Kravtsov, I. M. Khaymovich, E. Cuevas, and M. Amini, A random matrix model with localization and ergodic transitions, New Journal of Physics 17, 122002 (2015).
- Bogomolny and Sieber [2018] E. Bogomolny and M. Sieber, Eigenfunction distribution for the Rosenzweig-Porter model, Phys. Rev. E 98, 032139 (2018).
- Facoetti et al. [2016] D. Facoetti, P. Vivo, and G. Biroli, From non-ergodic eigenvectors to local resolvent statistics and back: A random matrix perspective, EPL (Europhysics Letters) 115, 47003 (2016).
- Ahmed et al. [2021] A. Ahmed, N. Roy, and A. Sharma, Dynamics of spectral correlations in the entanglement hamiltonian of the aubry-andré-harper model, Phys. Rev. B 104, 155137 (2021).
- Kuno et al. [2020] Y. Kuno, T. Orito, and I. Ichinose, Flat-band many-body localization and ergodicity breaking in the creutz ladder, New Journal of Physics 22, 013032 (2020).
- Di Liberto et al. [2019] M. Di Liberto, S. Mukherjee, and N. Goldman, Nonlinear dynamics of aharonov-bohm cages, Phys. Rev. A 100, 043829 (2019).
- Lee et al. [2022] S. Lee, A. Andreanov, and S. Flach, Critical-to-insulator transitions and fractality edges in perturbed flatbands (2022).
- Macé et al. [2019] N. Macé, F. Alet, and N. Laflorencie, Multifractal scalings across the many-body localization transition, Phys. Rev. Lett. 123, 180601 (2019).
- Penrose and Onsager [1956] O. Penrose and L. Onsager, Bose-einstein condensation and liquid helium, Phys. Rev. 104, 576 (1956).
- Lezama et al. [2017] T. L. M. Lezama, S. Bera, H. Schomerus, F. Heidrich-Meisner, and J. H. Bardarson, One-particle density matrix occupation spectrum of many-body localized states after a global quench, Phys. Rev. B 96, 060202 (2017).
- Bera et al. [2017] S. Bera, T. Martynec, H. Schomerus, F. Heidrich-Meisner, and J. H. Bardarson, One-particle density matrix characterization of many-body localization, Annalen der Physik 529, 1600356 (2017), https://onlinelibrary.wiley.com/doi/pdf/10.1002/andp.201600356 .
- Eisert et al. [2010] J. Eisert, M. Cramer, and M. B. Plenio, Colloquium: Area laws for the entanglement entropy, Rev. Mod. Phys. 82, 277 (2010).
- Laflorencie [2016] N. Laflorencie, Quantum entanglement in condensed matter systems, Physics Reports 646, 1 (2016), quantum entanglement in condensed matter systems.
- Santos and Rigol [2010] L. F. Santos and M. Rigol, Onset of quantum chaos in one-dimensional bosonic and fermionic systems and its relation to thermalization, Phys. Rev. E 81, 036206 (2010).
- Atas et al. [2013] Y. Y. Atas, E. Bogomolny, O. Giraud, and G. Roux, Distribution of the ratio of consecutive level spacings in random matrix ensembles, Phys. Rev. Lett. 110, 084101 (2013).
- Schulz et al. [2019] M. Schulz, C. A. Hooley, R. Moessner, and F. Pollmann, Stark many-body localization, Phys. Rev. Lett. 122, 040606 (2019).
- Deng et al. [2019] X. Deng, S. Ray, S. Sinha, G. V. Shlyapnikov, and L. Santos, One-dimensional quasicrystals with power-law hopping, Phys. Rev. Lett. 123, 025301 (2019).
- Luitz et al. [2015] D. J. Luitz, N. Laflorencie, and F. Alet, Many-body localization edge in the random-field heisenberg chain, Phys. Rev. B 91, 081103 (2015).