oBERTa: Improving Sparse Transfer Learning via improved initialization, distillation, and pruning regimes
Abstract
In this paper, we introduce the range of oBERTa language models, an easy-to-use set of language models which allows Natural Language Processing (NLP) practitioners to obtain between 3.8 and 24.3 times faster models without expertise in model compression. Specifically, oBERTa extends existing work on pruning, knowledge distillation, and quantization and leverages frozen embeddings, improves distillation, and model initialization to deliver higher accuracy on a broad range of transfer tasks. In generating oBERTa, we explore how the highly optimized RoBERTa differs from the BERT for pruning during pre-training and fine-tuning. We find it less amenable to compression during fine-tuning. We explore the use of oBERTa on seven representative NLP tasks and find that the improved compression techniques allow a pruned oBERTa model to match the performance of BERTbase and exceed the performance of Prune OFA Large on the SQUAD V1.1 Question Answering dataset, despite being 8x and 2x respectively faster in inference. We release our code, training regimes, and associated model for broad usage to encourage usage and experimentation. 111https://github.com/neuralmagic/sparseml/,222https://sparsezoo.neuralmagic.com/
1 Introduction
The massive improvement in contextual word representations driven by the usage of the Transformer architecture Vaswani et al. (2017) has led to the wide-scale deployment of language models. These models are customized for various use cases and tasks like question answering, sentiment analysis, information retrieval, and document classification and deployed into general domains and specialized domains such as financial, medical, and legal. While these models are effective, they commonly contain hundreds of millions of parameters, which can lead to slow inference times without using specialized hardware accelerations like graphics processing units (GPU) or Tensor Processing Units (TPU). Without hardware acceleration, the inference on CPUs can be slow and impractical for real-world deployments.
Approaches such as knowledge distillation (KD) Hinton et al. (2015), quantization Zafrir et al. (2019), and pruning Kurtic et al. (2022) have been leveraged to improve model efficiency and, when paired with specialized inference engines333https://github.com/neuralmagic/deepsparse, it is possible to accelerate inference times on CPUs and GPUs significantly. While there has been substantial effort to create effective methods for compression Jiao et al. (2020); Sun et al. (2020) and improved model performance Liu et al. (2019), general users of language models have been slower to adopt these methods. Years after its release, the original BERTbase uncased Devlin et al. (2019) is still the most popular language model 444Based on monthly downloads on the huggingface model hub in march 2023, followed by the slightly compressed DistilBERT Sanh et al. (2019a) for latency-sensitive deployments.
To enable broad adoption, regular users must be able to leverage more efficient language models without additional compression steps or tuning.
We present a case study on how to compress a language model for efficient CPU inference leveraging KD, structured pruning, unstructured sparsity, and quantization such that the compressed models can be applied to a broad range of natural language processing (NLP) tasks without expertise in compression of language models.
As part of this study, we release a set of efficient language models optimized to deliver the greatest improvement in inference while minimizing losses in accuracy. We then show how these models can be used for sparse transfer learning Iofinova et al. (2021); Zafrir et al. (2021) such that most compression happens during the pre-training stage. The pre-trained sparse models can be transferred to various NLP tasks, preserving sparsity without extensive optimization. Using these sparse transfer models and the DeepSparse inference engine, we show these sparse models can be fine-tuned to produce task-specific sparse models with minimal accuracy loss and result in greatly improved inference speeds with minimal accuracy loss.
As shown in Figure 1, oBERTa provides state-of-the-art performance for sparse language models on the SQUAD v1.1 Question Answering dataset. oBERTa variants exceed the performance of BERTbase despite being eight times faster, exceed the performance of Prune OFAlarge and oBERTlarge while being two to five times faster.
In this paper, we focus on the following research questions:
-
•
RQ1: Is RoBERTa more sensitive to unstructured pruning than BERT?
-
•
RQ2: What is the impact of using a larger teacher for KD during the pruning of language models?
-
•
RQ3: Can frozen embeddings improve the accuracy of pruned language models?
As part of our experimentation, we release the associated models and the training regimes to aid reproducibility and encourage efficient inference models.
In summary, our contributions are as follows:
-
•
We provide a thorough case study on how to compress a less studied language model555While the RoBERTa model was downloaded over 10m times in May 2023 on the huggingface hub it has not a model of focus for compression research., RoBERTa Liu et al. (2019), and evaluate performance on a set of seven NLP tasks finding that it is possible to effectively compress a language model without using its original pre-training dataset.
-
•
We demonstrate the impact of varying the size of teachers in KD, freezing embeddings, and variations in learning rates when applied to sparse language models.
-
•
We demonstrate that our compressed models can be leveraged to deliver accuracy of over 91% on the popular SQUAD v1.1 Rajpurkar et al. (2016a) Question Answering Task with nearly three times faster inference than the previous state-of-the-art uses of unstructured sparsity.
2 Background and Related work
While many methods to improve model efficiency exist, the same goal generally underpins them: given an original model with an accuracy of and an inference cost of minimize the inference cost. While the methods used for compression can be highly optimized and specialized, they can commonly be used together to deliver massive improvements in inference speeds with minimal losses in accuracy.
Transformer Based Language Models such as BERT Devlin et al. (2019) and T5 Raffel et al. (2020) provide contextual language representations built on the Transformer architecture Vaswani et al. (2017) which can be specialized and adapted for specific tasks and domains Lee et al. (2020). Using these models, it becomes relatively easy to excel at a broad range of natural language processing tasks such as Question Answering, Text Classification, and sentiment analysis.
Unstructured Pruning is a compression approach that removes individual weights or groups of weights in a model by applying a mask or setting the weight values to 0. This compression approach has been broadly studied in computer vision Han et al. (2015), and many methods can remove 70% or more of model weights with little to no loss in accuracy. Models pruned can be 20x smaller in terms of pure model size and, when paired with a sparsity-aware inference engine such as DeepSparse Magic (2023), provide 3-5x speedups in inference throughput.
Focused on language models, recent work has shown that it is possible to prune models during fine-tuning Sanh et al. (2020) Kurtić et al. (2022) or during pre-training Zafrir et al. (2021) and transfer to novel domains Campos et al. (2022) and datasets.
Structured Pruning is a compression approach that removes fundamental structural components in a language model such as individual attention heads Voita et al. (2019) or entire model layers such as transformer encoders Sanh et al. (2019b). Structural pruning has become one of the most popular methods for inference optimization as it is easy to estimate the speedups and implement.
Freezing Embeddings, as introduced by Devlin et al. Devlin et al. (2019), involves training the embedding layer of a language model and then toggling the ability to continue to optimize, or not, the values of in the embeddings as training continues.
Knowledge Distillation Hinton et al. (2015) is a training method where a model is not explicitly a compression method but a training method where a model, called the student learns to emulate a teacher model which is commonly larger or better performing. The loss extracted from the original training data in KD is augmented or replaced by KL divergence between the student and teacher model.
KD leverages the hardness parameter to control the mixture of regular and distillation loss (with a higher distillation favoring the KL divergence loss) and a temperature parameter to control the softness of the distribution.
As applied to language models, the approach has been used to improve the performance of structurally pruned language models resulting in models like DistilBERT Sanh et al. (2019b) and TinyBERT Jiao et al. (2020).
Quantization reduces the precision for the model weights and activations to lower the computational requirements of model execution. While researchers have explored reducing representation to binary representations Pouransari and Tuzel (2020), current hardware limits inference speedups to 8 or 4-bit representations. Quantization can be applied after the model is trained in a one-shot fashion, but this can lead to large losses in accuracy because of rounding errors. To avoid this pitfall, quantization is applied as quantization-aware training (QAT), where the forward pass of the model is simulated with lower precision. In contrast, the backward pass happens in full precision. By using QAT models, learn to be robust to rounding errors and can result in quantization having little to no loss in accuracy. In language models, research has produced quantized language models such as Q8BERT Zafrir et al. (2019) and is commonly used in conjunction with structured and unstructured pruning Zafrir et al. (2021) as a way of introducing compounding compression.
Additional approaches such as early exiting Xin et al. (2020) or token pruning Kim et al. (2021) have also improved inference efficiency. Still, the inference improvements can be very dataset dependent and, as a result, out of our experimentation frame. For a broader survey on compression approaches, we recommend Treviso et al. recent work Treviso et al. (2022)
3 Improving Sparse Transfer Learning
While quantization and pruning have been well studied as applied to language models, work has studied the compression BERTbase or BERTlarge. Despite existing research, we find that a clear case study that explores how best to create a family of compressed models is lacking, and this work seeks to remedy that. As part of our research, we compare the impact of varying pruning methods, pruning stage, teachers for KD, and freezing portions of the model as applied to the RoBERTa language model.
While performing task-specific compression allows NLP practitioners to broadly adopt improvements in inference efficiency, having access to pre-optimized models is key. We produce a family of 8 general purpose language models, collectively called oBERTa, which progressively get smaller and faster with minimal losses in accuracy.
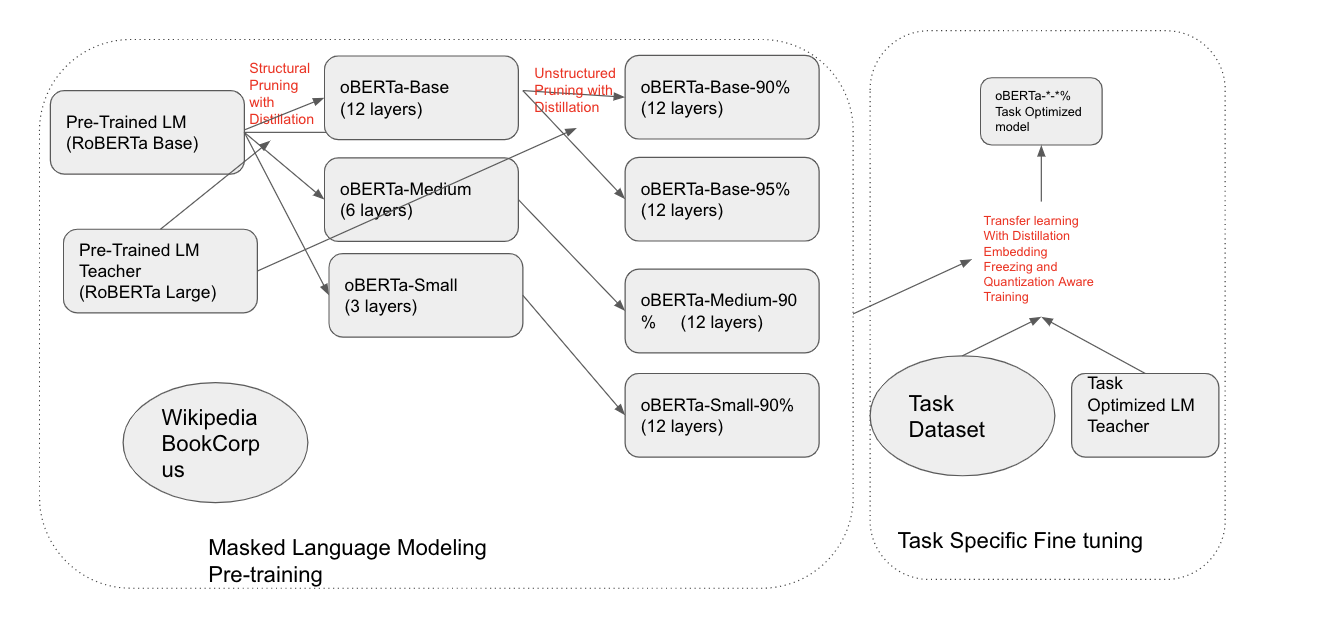
The oBERTa models leverage a combination of structured and unstructured pruning to provide a set of compressed models which can meet a wide set of latency needs. This compression approach has not been extensively documented nor discussed. Our approach to producing the oBERTA models builds on prior explorations of the combination of compression methods Kurtić et al. (2022) and addresses compression approaches in a staged manner as shown in Figure 2.
First, we create three structural variants starting with a RoBERTabase model. The base uses 12 transformer layers, the medium uses 6, and the small uses 3. Following prior work, we select interleaved layers for the 6-layer model and the first, middle, and last layers for the 3-layer model. Then, each of these 3 models is further pre-trained using masked language modeling on the Wikipedia-Bookcorpus text dataset, leveraging KD from a RoBERTalarge teacher. After that, each model is pruned using gradual magnitude pruning (GMP) to a desired sparsity level (90% and 95%) during additional pre-training based on masked language modeling, similar to Zafir et al. Zafrir et al. (2021). Further background on the RoBERTA model and why we did not prune using the WebText corpus can be found in the appendix.
After pre-training, the sparsity profile is fixed, and models are fine-tuned and quantized on their target task with a small set of variable hyperparameters. Experimentation on the impact of larger teachers, frozen embeddings, and variations in pruning algorithms are discussed in subsequent portions of this work.
3.1 Downstream Compression
We explore the impact of introducing unstructured sparsity during task-specific fine-tuning. We repeat each experiment with three different seeds and report the average F1 and Exact Match (EM) metrics in tables 2 and 3. Following a basic hyperparameter sweep, our baseline RoBERTabase model achieves a performance of 83.95 EM and 91.13 F1 in the broadly used question-answering benchmark SQUAD V1.1 Rajpurkar et al. (2016a).
We also perform unstructured pruning varying the sparsity 50-95% and the pruning method: GMP and Optimal BERT Surgeon (OBS) Kurtić et al. (2022). We prune each model for eight epochs, followed by an additional two epochs to allow the network to stabilize and re-converge. Knowledge distillation is used during training with the dense baseline model as a teacher, hardness set to and temperature set to . Further hyperparameters are in the appendix A.7.
Table 1 shows the impact of sparsity on BERTbase, as reported by previous work. Comparing these results with tables 2 and 3, we conclude that RoBERTa is more sensitive to pruning than BERT, although RoBERTabase pruned with OBS remains substantially more accurate than BERTbase for the same level of sparsity.
Table 2 shows that pruning RoBERTAbase to 90% with OBS results in a relative drop in F1 of 1.59%, which is three times the relative drop reported for BERTbase with the same pruning algorithm.
Moreover, table 3 shows that RoBERTAbase becomes very sensitive to pruning with GMP for sparsities above 85%, with the relative drop in F1 increasing almost threefold between 85% and 90% sparsity.
We conjecture that RoBERTa is more sensitive to pruning than BERT because the latter is relatively under-trained Liu et al. (2019), making the more optimized RoBERTa more sensitive to the loss in expressivity caused by pruning.
| Model | Sparsity | F1 | Impact |
| BERTbase Devlin et al. (2019) | 0 | 88.50 | N/A |
| BERTlarge Devlin et al. (2019) | 0 | 90.9 | N/A |
| RoBERTabase Liu et al. (2019) | 0 | 91.13 | N/A |
| RoBERTAlarge Liu et al. (2019) | 0 | 94.60 | N/A |
| PruneBertbase Sanh et al. (2020) | 90 | 84.90 | -4.07 % |
| PruneOFAlarge Zafrir et al. (2021) | 90 | 87.25 | -1.41 % |
| oBERTlarge Kurtić et al. (2022) | 90 | 87.98 | -0.58% |
| large Kurtic and Alistarh (2022) | 90 | 86.7 | -2.03% |
| Sparsity (%) | EM | Impact | F1 | Impact |
| 50 | 84.80 | 1.01% | 91.49 | 0.40% |
| 60 | 84.64 | 0.82% | 91.33 | 0.22% |
| 70 | 84.42 | 0.56% | 91.13 | 0.00% |
| 80 | 84.64 | 0.82% | 91.33 | 0.22% |
| 85 | 82.89 | -1.26% | 90.12 | -1.11% |
| 90 | 82.48 | -1.75% | 89.68 | -1.59% |
| 95 | 79.01 | -5.89% | 87.05 | -4.47% |
| Sparsity (%) | EM | Impact | F1 | Impact |
| 50 | 84.90 | 1.13% | 91.46 | 0.36% |
| 60 | 84.27 | 0.38% | 90.91 | -0.24% |
| 70 | 83.37 | -0.69% | 90.30 | -0.91% |
| 80 | 81.64 | -2.76% | 88.86 | -2.49% |
| 85 | 81.64 | -2.76% | 88.86 | -2.49% |
| 90 | 76.51 | -8.86% | 84.90 | -6.83% |
| 95 | 69.39 | -17.34% | 79.35 | -12.93% |
3.2 Upstream Compression
Based on our fine-tuning experiments, achieving a high degree of sparsity on the RoBERTA model leads to improvements in performance, but there are greater than expected losses in accuracy. Additionally, such compression is task-specific and non-amortizable, so we explore how best to generate general pruned RoBERTa models. While we eventually apply the winning set of training combinations to all of our variants of oBERTa, we first seek to answer the following questions: Does GMP or OBS perform better during pretraining pruning? Does Freezing the Embeddings during pretraining pruning further improve performance? Does the use of larger teachers further improve performance?
We prune various models while varying individual variables during pretraining to evaluate these questions. We experiment by pruning an oBERTabase (12 layers) model to 90% and 95% sparsity on all non-embedding layers. All pretraining pruning happens using the Wikipedia-BookCorpus dataset, where we train for five epochs using a learning rate of 5e-5 and a batch size of 256 using 4 A100 GPUS. To evaluate the impact of these models, we evaluate performance on the previously used SQUAD v1.1 question-answering dataset, where we train with a fixed training regime of 10 epochs with a learning rate of 1.5e-4 based on the work of Kurtic et al. We train without KD for each finetuning run with an unpruned RoBERTabase or an unpruned RoBERTalarge. Details for the hyperparameters used to train all teacher models can be found in the appendix A.5.
| GMP | OBS | |||||||
| Model | F1 | Impact | EM | Impact | F1 | Impact | EM | Impact |
| RoBERTAbase | 92.18 | 0.00% | 85.59 | 0.00% | 92.18 | 0.00% | 85.59 | 0.00% |
| oBERTa 90% No KD | 88.34 | -4.17% | 80.19 | -6.31% | 87.72 | -4.83% | 79.35 | -7.29% |
| oBERTa 90% RoBERTAbase KD | 88.75 | -3.72% | 81.35 | -4.95% | 88.60 | -3.88% | 81.37 | -4.93% |
| oBERTa 90% RoBERTAlarge KD | 89.65 | -2.75% | 83.12 | -2.88% | 89.63 | -2.76% | 82.94 | -3.09% |
| oBERTa 95% No KD | 86.58 | -6.07% | 78.81 | -7.92% | 84.90 | -7.90% | 76.82 | -10.25% |
| oBERTa 95% RoBERTAbase KD | 86.99 | -5.63% | 79.41 | -7.22% | 86.14 | -6.55% | 78.63 | -8.13% |
| oBERTa 95% RoBERTAlarge KD | 87.60 | -4.97% | 80.44 | -6.01% | 86.14 | -6.55% | 79.84 | -6.72% |
Comparing the use of OBS vs. GMP as shown in table 4, we can see that GMP consistently outperforms OBS. This is the opposite of what is seen when pruning downstream or, in prior work, pruning BERT. Without access to the original training corpus OBS is likely unable to leverage the loss aware saliency importance as well as it can when it has the original dataset.
| Hardness 0.5 | Hardness 1.0 | |||||||
| Model | F1 | Impact | EM | Impact | F1 | Impact | EM | Impact |
| RoBERTAbase | 92.18 | 0.00% | 85.59 | 0.00% | 92.18 | 0.00% | 85.59 | 0.00% |
| oBERTa 90% No KD | 88.21 | -4.31% | 80.19 | -6.31% | 88.34 | -4.17% | 80.19 | -6.31% |
| oBERTa 90% Base KD | 89.19 | -3.25% | 81.74 | -4.50% | 88.75 | -3.72% | 81.35 | -4.95% |
| oBERTa 90% Large KD | 90.14 | -2.21% | 83.51 | -2.43% | 89.65 | -2.75% | 83.12 | -2.88% |
| oBERTa-95 No KD | 85.82 | -6.90% | 77.77 | -9.14% | 86.58 | -6.07% | 78.81 | -7.92% |
| oBERTa-95 Base KD | 86.98 | -5.64% | 79.23 | -7.43% | 86.99 | -5.63% | 79.41 | -7.22% |
| oBERTa-95 Large KD | 87.66 | -4.91% | 80.40 | -6.07% | 87.60 | -4.97% | 80.44 | -6.01% |
Evaluating the impact of variations in the hardness of KD as shown in table 5, there is a bit more of a muted set of conclusions. The 95% sparse models perform better with a hardness of 1.0, while the 90% models do better with a hardness of 0.5. Given that our goal is to preserve most of the RoBERTa model without actually using its large dataset, we set our hardness to 1.0 as it keeps the model from explicitly learning the new dataset.
| Frozen Embeddings | Trained Embeddings | |||||||
| Model | F1 | Impact | EM | Impact | F1 | Impact | EM | Impact |
| RoBERTabase | 92.18 | 0.00% | 85.59 | 0.00% | 92.18 | 0.00% | 85.59 | 0.00% |
| oBERTabase 90% no KD | 87.71 | -4.85% | 79.62 | -6.98% | 88.21 | -4.31% | 80.19 | -6.31% |
| oBERTabase 90% RoBERTabase KD | 89.7 | -2.69% | 81.74 | -4.50% | 89.19 | -3.24% | 83.07 | -2.94% |
| oBERTabase 90% RoBERTalarge KD | 89.59 | -2.81% | 82.98 | -3.05% | 90.14 | -2.21% | 83.51 | -2.43% |
When we evaluate the impact of freezing embeddings during pre-training, as shown in table 6, we find strong evidence that using frozen embeddings consistently leads to worse performance and, as a result, does not freeze embeddings during our model pruning. Looking at the impact of varying the size of the teacher for pretraining KD as shown in table 7, we unsurprisingly find clear evidence that using a larger teacher during pretraining pruning leads to improvements in performance.
| Base Upstream Teacher | Large Upstream Teacher | |||||||
| Model | F1 | Impact | EM | Impact | F1 | Impact | EM | Impact |
| RoBERTAbase | 92.18 | 0.00% | 85.59 | 0.00% | 92.18 | 0.00% | 85.59 | 0.00% |
| oBERTa 90% no KD | 88.34 | -4.17% | 80.59 | -5.84% | 88.1 | -4.43% | 80.06 | -6.46% |
| oBERTa 90% Base KD | 88.75 | -3.72% | 81.35 | -4.95% | 89.22 | -3.21% | 82.02 | -4.17% |
| oBERTa 90% Large KD | 89.65 | -2.74% | 83.12 | -2.89% | 89.98 | -2.39% | 83.14 | -2.86% |
Using these experiments, we generate the recipe, which we then use to create the many variants of oBERTa. We evaluate their performance in Table 17 where it is important to note that these results are accuracy, loss, and perplexity relative to the RoBERTa-large teacher, not the true dataset. The compression recipe, as shown in Figure 2 is as follows:
-
1.
Starting with a pre-trained language model, removing some portion of transformer layers in an interleaved fashion.
-
2.
Using Knowledge Distillation from a large uncompressed model, pre-train the pruned model with a hardness of 1.0 and without freezing embeddings.
-
3.
Using Knowledge Distillation from a large uncompressed model, prune during further pretraining using GMP where sparsity levels are enforced at the parameter level. The resulting model is the sparse-transfer-student.
-
4.
Train an uncompressed large language model on the desired NLP task’s dataset. This is the sparse-transfer teacher.
-
5.
Using the sparse-transfer teacher fine-tune the sparse-transfer-student with knowledge distillation to convergence. Experiment with the use of frozen embeddings and various sizes of sparse-transfer teachers.
-
6.
Using the fine-tuned sparse-transfer student and teacher, train with quantization-aware training. If embeddings were frozen during initial fine-tuning they should be unfrozen here.
4 Experimental Results
Based on the aforementioned experiments, we generate 8 variants of oBERTa, each with a different size and sparsity profile; details can be found in table 18. Within this table, we report the impact on the model size as measured by the raw and compressed size of the ONNX 666https://onnx.ai/ model file. Embeddings are unpruned and each layer is pruned to the target sparsity profile independent of the rest of the model. As a result, the overall sparsity profile may vary as modules in the network may not be able to reach exactly 90% or 95% sparsity.
Using these inference-optimized models, we evaluate their sparse transfer performance by finetuning these models on their target task using a fixed training regime and minor hyperparameter exploration. For each task, we train them for 10 epochs or 20 (10 of which are Quantization Aware Training), with the longer schedule being reserved for models which are being quantized.
We evaluate performance on a benchmark of diverse NLP tasks ranging from question answering, sentiment analysis, document classification, token classification, and text classification. For question answering, we leverage the SQuAD v1.1 Rajpurkar et al. (2016a) and SQuAD V2.0 Rajpurkar et al. (2018) datasets. We leverage the SST-2 Socher et al. (2013) dataset for sentiment analysis. For text classification, we use the Quora Duplicate Query Detection (QQP) SambitSekhar (2017) and the MNLI Williams et al. (2018) datasets. We leverage the IMDB Maas et al. (2011) dataset for document classification and CONLL2003 Tjong Kim Sang and
De Meulder (2003) for token classification.
Looking at performance on question answering as shown in table 8 and 9.
| Sparse Transfer | Sparse Transfer With Quantization | |||||
| model | F1 | Recovery | EM | F1 | Recovery | EM |
| oBERTabase | 92.15 | 100.00% | 85.78 | 93.18 | 101.11% | 87.29 |
| oBERTabase 90% | 90.95 | 98.69% | 84.42 | 89.46 | 97.08% | 82.61 |
| oBERTabase 95% | 89.84 | 97.49% | 83.08 | 89.23 | 96.83% | 81.12 |
| oBERTaMEDIUM | 90.37 | 98.06% | 83.84 | 83.77 | 90.91% | 90.37 |
| oBERTaMEDIUM 90% | 89.26 | 96.86% | 82.18 | 88.65 | 96.20% | 81.88 |
| oBERTaSMALL | 84.87 | 92.09% | 76.55 | 84.82 | 92.05% | 76.77 |
| oBERTaSMALL 90% | 84.66 | 91.87% | 76.18 | 82.18 | 92.18% | 74.21 |
| Sparse Transfer | Sparse Transfer With Quantization | |||||
| model | F1 | Recovery | EM | F1 | Recovery | EM |
| oBERTabase | 82.77 | 100.00% | 79.56 | 85.298 | 103.06% | 82.347 |
| oBERTabase 90% | 81.33 | 98.26% | 78.27 | 81.43 | 98.38% | 78.92 |
| oBERTabase 95% | 77.98 | 94.22% | 74.67 | 78.09 | 94.35% | 74.82 |
| oBERTaMEDIUM | 77.51 | 93.65% | 74.25 | 78.137 | 94.41% | 75.179 |
| oBERTaMEDIUM 90% | 76.64 | 92.60% | 73.34 | 76.24 | 92.11% | 73.51 |
| oBERTaSMALL | 71.54 | 86.44% | 67.93 | 71.591 | 86.50% | 68.087 |
| oBERTaSMALL 90% | 70.79 | 85.53% | 67.31 | 69.35 | 87.79% | 65.21 |
| Sparse Transfer | Sparse Transfer With Quantization | |||||
| model | Accuracy | Recovery | Accuracy(MM) | Accuracy | Recovery | Accuracy(MM) |
| oBERTabase | 87.88% | 100.00% | 87.57% | 88.06% | 100.20% | 88.01% |
| oBERTabase 90% | 85.17% | 96.91% | 84.73% | 85.09% | 96.83% | 84.76% |
| oBERTabase 95% | 84.32% | 95.95% | 84.08% | 83.73% | 95.28% | 83.83% |
| oBERTaMEDIUM | 85.29% | 97.05% | 85.17% | 83.62% | 95.15% | 83.74% |
| oBERTaMEDIUM 90% | 81.61% | 92.87% | 81.32% | 82.37% | 93.73% | 81.79% |
| oBERTaSMALL | 80.80% | 91.95% | 81.55% | 81.10% | 92.29% | 81.51% |
| oBERTaSMALL 90% | 79.23% | 90.15% | 79.24% | 79.14% | 90.06% | 79.42% |
| Sparse Transfer | Sparse Transfer With Quantization | |||||||
| model | Accuracy | Recovery | F1 | Combined | Accuracy | Recovery | F1 | Combined |
| oBERTabase | 91.52% | 100.00% | 90.09% | 88.66% | 89.86% | 98.18% | 88.12% | 86.73% |
| oBERTabase 90% | 91.01% | 99.44% | 89.47% | 87.92% | 91.21% | 99.66% | 89.68% | 88.16% |
| oBERTabase 95% | 90.85% | 99.26% | 89.21% | 87.58% | 90.72% | 99.12% | 89.08% | 0.87% |
| oBERTaMEDIUM | 91.35% | 99.81% | 89.90% | 88.44% | 91.33% | 99.79% | 89.80% | 88.28% |
| oBERTaMEDIUM 90% | 90.48% | 98.86% | 88.85% | 87.21% | 90.60% | 99.00% | 89.01% | 87.42% |
| oBERTaSMALL | 90.72% | 99.13% | 89.21% | 87.71% | 89.74 | 98.06% | 87.99 | 86.25 |
| oBERTaSMALL 90% | 89.74% | 98.06% | 87.99% | 86.25% | 89.73 | 98.04% | 87.98 | 86.08 |
| Sparse Transfer | Sparse Transfer With Quantization | |||
| model | Accuracy | Recovery | Accuracy | Recovery |
| oBERTabase | 95.24% | 100.00% | 95.44% | 100.21% |
| oBERTabase 90% | 93.64% | 98.32% | 93.28 | 97.94% |
| oBERTabase 95% | 93.48% | 98.15% | 92.80 | 97.23% |
| oBERTaMEDIUM | 93.36% | 98.03% | 94.08 | 98.78% |
| oBERTaMEDIUM 90% | 92.24% | 96.85% | 92.08 | 96.69% |
| oBERTaSMALL | 93.04% | 97.69% | 92.52 | 97.15% |
| oBERTaSMALL 90% | 91.60% | 96.18% | 91.28 | 95.84% |
| Sparse Transfer | Sparse Transfer With Quantization | |||
| model | Accuracy | Recovery | Accuracy | Recovery |
| oBERTabase | 94.60 | 100.00% | 92.66 | 97.95% |
| oBERTabase 90% | 92.78 | 98.08% | 92.546 | 97.83% |
| oBERTabase 95% | 91.51 | 96.74% | 91.399 | 96.62% |
| oBERTaMEDIUM | 92.89 | 98.19% | 91.06 | 96.26% |
| oBERTaMEDIUM 90% | 88.76 | 93.83% | 89.91 | 95.04% |
| oBERTaSMALL | 90.48 | 95.64% | 91.28 | 96.49% |
| oBERTaSMALL 90% | 89.34 | 94.44% | 88.65 | 93.71% |
Finally, looking at performance on token classification as shown in table 14
| Sparse Transfer | Sparse Transfer With Quantization | |||||
| model | Accuracy | Recovery | F1 | Accuracy | Recovery | F1 |
| oBERTabase | 99.26% | 100.00% | 95.51% | 99.30% | 100.05% | 95.98% |
| oBERTabase 90% | 99.11% | 99.85% | 94.98% | 99.05% | 99.79% | 94.51% |
| oBERTabase 95% | 98.89% | 99.63% | 93.32% | 98.75% | 99.48% | 92.61% |
| oBERTaMEDIUM | 99.04% | 99.77% | 94.39% | 99.18% | 99.92% | 95.15% |
| oBERTaMEDIUM 90% | 98.79% | 99.53% | 93.31% | 98.73% | 99.46% | 92.70% |
| oBERTaSMALL | 99.01% | 99.75% | 94.00% | 98.98% | 99.72% | 94.13% |
| oBERTaSMALL 90% | 98.47% | 99.20% | 91.13% | 98.25% | 98.98% | 89.79% |
4.1 Inference Benchmark
To evaluate the performance of our inference-optimized models, we benchmark performance using the popular DeepSparse library version 1.3.2 777pip install deepsparse==1.3.2 and an Intel Xeon Gold 6238R Processor. Performance is measured using models that have been sparse-transferred to the SQuAD v1.1 dataset and exported to a standard ONNX model format. Benchmarks are run on 4 and 24 cores and a sequence length of 384 with batch sizes of 1, 16, and 64. For each model, the benchmark is run for 60 seconds with a warm-up period of 10 seconds, and we report the throughput (items per second) and the mean, median, and standard deviation per item latency.
| 24 Cores | 4 Cores | |||||
| Model | BS 1 | BS 16 | BS 64 | BS 1 | BS 16 | BS 64 |
| BERTbase | 1.00 | 1.00 | 1.00 | 1.00 | 1.00 | 1.00 |
| oBERTabase | 1.00 | 1.00 | 1.00 | 1.00 | 1.00 | 1.00 |
| oBERTabase Quantized | 3.10 | 4.29 | 4.46 | 4.09 | 4.31 | 4.32 |
| oBERTabase 90% | 3.29 | 3.80 | 3.80 | 3.60 | 3.34 | 3.40 |
| oBERTabase 90% Quantized | 4.12 | 7.05 | 7.37 | 7.67 | 7.59 | 7.40 |
| oBERTabase 95% | 8.72 | 4.56 | 4.65 | 4.12 | 3.85 | 4.37 |
| oBERTabase 95% Quantized | 4.73 | 8.22 | 8.56 | 9.41 | 9.06 | 8.68 |
| oBERTaMEDIUM | 1.96 | 1.99 | 1.99 | 1.96 | 1.99 | 2.02 |
| oBERTaMEDIUM Quantized | 6.20 | 8.04 | 8.44 | 8.43 | 8.33 | 8.45 |
| oBERTaMEDIUM 90% | 6.35 | 7.41 | 6.84 | 7.83 | 6.56 | 6.72 |
| oBERTaMEDIUM 90% Quantized | 8.94 | 12.86 | 13.65 | 14.99 | 14.81 | 14.95 |
| oBERTaSMALL | 3.89 | 3.96 | 3.99 | 3.95 | 3.97 | 4.03 |
| oBERTaSMALL Quantized | 12.47 | 14.12 | 14.08 | 15.50 | 15.48 | 15.70 |
| oBERTaSMALL 90% | 12.22 | 14.40 | 14.67 | 14.05 | 14.19 | 14.13 |
| oBERTaSMALL 90% Quantized | 16.21 | 21.35 | 23.96 | 29.77 | 27.14 | 27.58 |
We present a set of summary statistics of relative speedup across batch sizes and inference server configurations as shown in table 15. Full inference performance results can be found in the appendix. In analyzing performance, we can see that the introduction of quantization to a dense model delivers roughly a 4x speedup while quantization on sparse models is closer to 2x. With the introduction of sparsity, 90% leads to slightly under 4x speedup, while 95% leads to slightly over 4x. The impact of structural pruning is roughly equivalent to the size of the as a 6-layer model is two times faster than a 12-layer, and a 3-layer model is four times faster. Combing compression forms is only partially additive, as a small (3-layer) 90% quantized model performance is 24x vs the expected 32x (4x from structural pruning, 2x quantization, 4x unstructured pruning.
Looking at the variation in a speedup by batch size and the number of cores, we can see that allocating more cores leads to a smaller gap in inference speedup, especially with small batches. From this, we extract that compression is significant when performing streaming inference (batch size 1) on smaller CPUs.
Next, we go ahead and benchmark the oBERTa model performance against existing sparse-transfer models such as oBERT and PruneOFA using the models that have been published 888Since the PruneBERT model is not available in the zoo, we extrapolate numbers using the performance of our oBERTabase pruned 90% as both models feature 12 transformer encoders and 90% sparsity. in Neural Magic’s Sparse-Zoo 999https://sparsezoo.neuralmagic.com/. We run these models using four cores and a batch size of 1 and compare their speedup (or slowdown) relative to their performance on the SQUAD v1.1 question-answering benchmark. Results can be found in table 16 and full results in 45. Looking at the improvements in accuracy and inference throughput, we find the oBERTa models are 1.3 to 4 times better than models with approximately the same accuracy.
| Vs. BERTbase | Vs. BERTlarge | ||||
| Model | F1 | Recovery | Speedup | Recovery | Speedup |
| oBERTabase 90% | 91.00 | 102.77% | 3.57 | 100.44% | 20.21 |
| oBERTlarge 95% Quantized | 90.21 | 101.87% | 3.41 | 99.57% | 19.31 |
| prunedOFAlarge 90% Quantized | 89.96 | 101.59% | 2.38 | 99.29% | 13.47 |
| oBERTabase 90% Quantized | 89.46 | 101.03% | 7.62 | 98.74% | 43.07 |
| oBERTaMEDIUM 90% | 89.26 | 98.99% | 7.78 | 96.75% | 43.99 |
| obertbase 90% Quantized | 88.00 | 99.38% | 6.96 | 97.13% | 39.37 |
| oBERTaSMALL 90% | 84.66 | 90.97% | 13.95 | 88.91% | 78.91 |
| pruneBERT 90% | 84.90 | 95.88% | 3.57 | 93.71% | 73.82 |
Looking at the competitive results, we find that the oBERTa-* models can deliver significant gains in performance (F1) relative to speedups. The oBERTabasePruned 90% Quantized model achieves an undertaking that nearly matches pruneOFA-large 90% Quantized while delivering nearly 13x faster inference. Similarly, the oBERTASMALL 90% model provides similar accuracy to PruneBERT despite being over four times faster.
5 Discussion
Sparse Models require higher learning rates as shown in the tables in A.8 sparse language models can be used as general-purpose contextual language models but require the use of a much higher learning rate. When using structurally pruned models like the 6-layer oBERTaMEDIUM and the 3-layer oBERTaSMALL, the optimal learning rate does not vary much within the same task despite the model size. With the introduction of sparsity, the learning rate needs to scale, usually by a factor of five or ten. We find this counterintuitive as the sparse models have fewer parameters to tune, so we would expect them to prefer a much lower learning rate. We attribute this to the loss of expressivity in the network driven by its sparsity. Since the network has fewer degrees of freedom to optimize the points which can be optimized move much more than those that cannot.
Larger models compress better as shown by the gap between the sparse and dense models and the gap between models and their quantized counterparts. While 12-layer models can receive 90 or 95 % sparsity and quantization with little to no loss in accuracy, the three and 6-layer models see a much bigger dip. This aligns with Li et al. 2020 Li et al. (2020) in which they demonstrate that larger models are more robust to pruning and quantization. Empirically, this makes sense as the smaller models have fewer degrees of freedom, and other portions of the network cannot counteract the reduction in expressivity caused by pruning and quantization.
Bigger Teachers are not always better as shown in the table in A.9 the introduction of larger teachers does not always lead to improvements in accuracy. The impact is highly task and model dependent as some datasets like MNLI or QQP see little impact in using larger teachers, yet datasets like SQUAD or SQUAD v2.0 see large impacts, which are even more pronounced when the student model is smaller.
Frozen embeddings can help, but not always. As shown by A.10 the impact of freezing the embeddings is highly task-specific and inconsistent across tasks or models. In question answering, freezing leads to 1-2 point movement for unpruned models and 5-7 points for pruned models. In other tasks like QQP and MNLI, the impact of frozen embeddings tends to be minor or none.
6 Limitations
While our approach is effective at compressing models, it is not the most efficient. In order to discover the most optimal compression approaches and evaluate their performance performed hundreds of experiments. As a result, scaling our approach to every novel language understanding language model is not tractable. Another limitation of our work is we did not track the complete compute utilization of our entire experimentation process but we can provide some estimates. Experiments in pruning during fine-tuning leveraged a single V100 16 GB GPU and took approximately 14 hours per experiment. The pre-training of structurally pruned models with knowledge distillation required 4 A100 40GB GPUs for approximately 72 hours. Pruning during pre-training with Knowledge distillation required approximately 100 hours on the same setup. Task-specific fine-tuning happened on a single V100 16GB GPU and depending on the size of the task was anywhere from a few minutes to 20 hours. Based on all of our experiments we estimate 400 V100 hours of pruning during fine-tuning, roughly 16,000 A100 hours1010104000 hours and 4 A100 GPUS per hour for pretraining, and assuming an average of 10 V100 hours per sparse transfer run, a total of 4000 V100 hours for sparse-transfer and sparse-transfer with quantization.
7 Conclusion and Future Work
References
- Campos et al. (2022) Daniel Fernando Campos, Alexandre Marques, Tuan Anh D. Nguyen, Mark Kurtz, and ChengXiang Zhai. 2022. Sparse*bert: Sparse models are robust. ArXiv, abs/2205.12452.
- Conneau et al. (2019) Alexis Conneau, Kartikay Khandelwal, Naman Goyal, Vishrav Chaudhary, Guillaume Wenzek, Francisco Guzmán, Edouard Grave, Myle Ott, Luke Zettlemoyer, and Veselin Stoyanov. 2019. Unsupervised cross-lingual representation learning at scale.
- Devlin et al. (2019) J. Devlin, Ming-Wei Chang, Kenton Lee, and Kristina Toutanova. 2019. Bert: Pre-training of deep bidirectional transformers for language understanding. In NAACL.
- Foundation (2021) Wikimedia Foundation. 2021. Wikimedia downloads.
- Han et al. (2015) Song Han, Huizi Mao, and William J. Dally. 2015. A deep neural network compression pipeline: Pruning, quantization, huffman encoding. ArXiv.
- Hinton et al. (2015) Geoffrey E. Hinton, Oriol Vinyals, and J. Dean. 2015. Distilling the knowledge in a neural network. ArXiv, abs/1503.02531.
- Iofinova et al. (2021) Eugenia Iofinova, Alexandra Peste, Mark Kurtz, and Dan Alistarh. 2021. How well do sparse imagenet models transfer? 2022 IEEE/CVF Conference on Computer Vision and Pattern Recognition (CVPR), pages 12256–12266.
- Jiao et al. (2020) Xiaoqi Jiao, Yichun Yin, Lifeng Shang, Xin Jiang, Xiao Chen, Linlin Li, Fang Wang, and Qun Liu. 2020. Tinybert: Distilling bert for natural language understanding. ArXiv, abs/1909.10351.
- Kim et al. (2021) Sehoon Kim, Sheng Shen, David Thorsley, Amir Gholami, Joseph Hassoun, and Kurt Keutzer. 2021. Learned token pruning for transformers. Proceedings of the 28th ACM SIGKDD Conference on Knowledge Discovery and Data Mining.
- Kurtic and Alistarh (2022) Eldar Kurtic and Dan Alistarh. 2022. Gmp*: Well-tuned global magnitude pruning can outperform most bert-pruning methods. ArXiv, abs/2210.06384.
- Kurtic et al. (2022) Eldar Kurtic, Daniel Fernando Campos, Tuan Nguyen, Elias Frantar, Mark Kurtz, Ben Fineran, Michael Goin, and Dan Alistarh. 2022. The optimal bert surgeon: Scalable and accurate second-order pruning for large language models. ArXiv, abs/2203.07259.
- Kurtić et al. (2022) Eldar Kurtić, Daniel Fernando Campos, Tuan Nguyen, Elias Frantar, Mark Kurtz, Ben Fineran, Michael Goin, and Dan Alistarh. 2022. The optimal bert surgeon: Scalable and accurate second-order pruning for large language models. ArXiv, abs/2203.07259.
- Lan et al. (2019) Zhen-Zhong Lan, Mingda Chen, Sebastian Goodman, Kevin Gimpel, Piyush Sharma, and Radu Soricut. 2019. Albert: A lite bert for self-supervised learning of language representations. ArXiv, abs/1909.11942.
- Lee et al. (2020) Jinhyuk Lee, Wonjin Yoon, Sungdong Kim, Donghyeon Kim, Sunkyu Kim, Chan Ho So, and Jaewoo Kang. 2020. Biobert: a pre-trained biomedical language representation model for biomedical text mining. Bioinformatics, 36:1234 – 1240.
- Li et al. (2020) Zhuohan Li, Eric Wallace, Sheng Shen, Kevin Lin, K. Keutzer, D. Klein, and Joseph Gonzalez. 2020. Train large, then compress: Rethinking model size for efficient training and inference of transformers. ArXiv, abs/2002.11794.
- Liu et al. (2019) Yinhan Liu, Myle Ott, Naman Goyal, Jingfei Du, Mandar Joshi, Danqi Chen, Omer Levy, Mike Lewis, Luke Zettlemoyer, and Veselin Stoyanov. 2019. Roberta: A robustly optimized bert pretraining approach. ArXiv, abs/1907.11692.
- Maas et al. (2011) Andrew L. Maas, Raymond E. Daly, Peter T. Pham, Dan Huang, Andrew Y. Ng, and Christopher Potts. 2011. Learning word vectors for sentiment analysis. In Proceedings of the 49th Annual Meeting of the Association for Computational Linguistics: Human Language Technologies, pages 142–150, Portland, Oregon, USA. Association for Computational Linguistics.
- Magic (2023) Neural Magic. 2023. [link].
- Pouransari and Tuzel (2020) Hadi Pouransari and Oncel Tuzel. 2020. Least squares binary quantization of neural networks. 2020 IEEE/CVF Conference on Computer Vision and Pattern Recognition Workshops (CVPRW), pages 2986–2996.
- Raffel et al. (2020) Colin Raffel, Noam M. Shazeer, Adam Roberts, Katherine Lee, Sharan Narang, Michael Matena, Yanqi Zhou, Wei Li, and Peter J. Liu. 2020. Exploring the limits of transfer learning with a unified text-to-text transformer. ArXiv, abs/1910.10683.
- Rajpurkar et al. (2018) Pranav Rajpurkar, Robin Jia, and Percy Liang. 2018. Know what you don’t know: Unanswerable questions for squad. In Annual Meeting of the Association for Computational Linguistics.
- Rajpurkar et al. (2016a) Pranav Rajpurkar, Jian Zhang, Konstantin Lopyrev, and Percy Liang. 2016a. Squad: 100, 000+ questions for machine comprehension of text. In EMNLP.
- Rajpurkar et al. (2016b) Pranav Rajpurkar, Jian Zhang, Konstantin Lopyrev, and Percy Liang. 2016b. Squad: 100,000+ questions for machine comprehension of text. In EMNLP.
- SambitSekhar (2017) SambitSekhar. 2017. First quora dataset release: Question pairs.
- Sanh et al. (2019a) Victor Sanh, Lysandre Debut, Julien Chaumond, and Thomas Wolf. 2019a. Distilbert, a distilled version of bert: smaller, faster, cheaper and lighter. ArXiv, abs/1910.01108.
- Sanh et al. (2019b) Victor Sanh, Lysandre Debut, Julien Chaumond, and Thomas Wolf. 2019b. Distilbert, a distilled version of bert: smaller, faster, cheaper and lighter. arXiv preprint arXiv:1910.01108.
- Sanh et al. (2020) Victor Sanh, Thomas Wolf, and Alexander M. Rush. 2020. Movement pruning: Adaptive sparsity by fine-tuning. ArXiv, abs/2005.07683.
- Shankar (2017) S. Shankar. 2017. Identifying quora question pairs having the same intent. In QQP.
- Socher et al. (2013) Richard Socher, Alex Perelygin, Jean Wu, Jason Chuang, Christopher D. Manning, Andrew Ng, and Christopher Potts. 2013. Recursive deep models for semantic compositionality over a sentiment treebank. In Proceedings of the 2013 Conference on Empirical Methods in Natural Language Processing, pages 1631–1642, Seattle, Washington, USA. Association for Computational Linguistics.
- Sun et al. (2020) Zhiqing Sun, Hongkun Yu, Xiaodan Song, Renjie Liu, Yiming Yang, and Denny Zhou. 2020. Mobilebert: a compact task-agnostic bert for resource-limited devices. In ACL.
- Tjong Kim Sang and De Meulder (2003) Erik F. Tjong Kim Sang and Fien De Meulder. 2003. Introduction to the CoNLL-2003 shared task: Language-independent named entity recognition. In Proceedings of the Seventh Conference on Natural Language Learning at HLT-NAACL 2003, pages 142–147.
- Treviso et al. (2022) Marcos Vinícius Treviso, Tianchu Ji, Ji-Ung Lee, Betty van Aken, Qingqing Cao, Manuel R. Ciosici, Michael Hassid, Kenneth Heafield, Sara Hooker, Pedro Henrique Martins, André F. T. Martins, Peter Milder, Colin Raffel, Edwin Simpson, Noam Slonim, Niranjan Balasubramanian, Leon Derczynski, and Roy Schwartz. 2022. Efficient methods for natural language processing: A survey. ArXiv, abs/2209.00099.
- Vaswani et al. (2017) Ashish Vaswani, Noam M. Shazeer, Niki Parmar, Jakob Uszkoreit, Llion Jones, Aidan N. Gomez, Lukasz Kaiser, and Illia Polosukhin. 2017. Attention is all you need. ArXiv, abs/1706.03762.
- Voita et al. (2019) Elena Voita, David Talbot, F. Moiseev, Rico Sennrich, and Ivan Titov. 2019. Analyzing multi-head self-attention: Specialized heads do the heavy lifting, the rest can be pruned. In ACL.
- Williams et al. (2018) Adina Williams, Nikita Nangia, and Samuel Bowman. 2018. A broad-coverage challenge corpus for sentence understanding through inference. In Proceedings of the 2018 Conference of the North American Chapter of the Association for Computational Linguistics: Human Language Technologies, Volume 1 (Long Papers), pages 1112–1122. Association for Computational Linguistics.
- Xin et al. (2020) Ji Xin, Raphael Tang, Jaejun Lee, Yaoliang Yu, and Jimmy J. Lin. 2020. Deebert: Dynamic early exiting for accelerating bert inference. In ACL.
- Zafrir et al. (2019) Ofir Zafrir, Guy Boudoukh, Peter Izsak, and Moshe Wasserblat. 2019. Q8bert: Quantized 8bit bert. 2019 Fifth Workshop on Energy Efficient Machine Learning and Cognitive Computing - NeurIPS Edition (EMC2-NIPS), pages 36–39.
- Zafrir et al. (2021) Ofir Zafrir, Ariel Larey, Guy Boudoukh, Haihao Shen, and Moshe Wasserblat. 2021. Prune once for all: Sparse pre-trained language models. ArXiv, abs/2111.05754.
- Zhu et al. (2015) Yukun Zhu, Ryan Kiros, Richard S. Zemel, Ruslan Salakhutdinov, Raquel Urtasun, Antonio Torralba, and Sanja Fidler. 2015. Aligning books and movies: Towards story-like visual explanations by watching movies and reading books. 2015 IEEE International Conference on Computer Vision (ICCV), pages 19–27.
Appendix A Appendix
A.1 Model Generation Approach
oBERTa models are generated in a multi-stage approach with details found in figure 2
A.2 Roberta and Training Methodology
RoBERTa Liu et al. (2019) is a language model that can best be considered more robust and optimized for the popular BERT model. While the models share architectures, their training differs as RoBERTA uses a 160 GB corpus for 10 epochs compared to the 4GB one used by BERT. As a result, the training time of RoBERTA is about 100 times higher than its predecessor.
Given this high cost of training and the regular need for longer training when pruning a model Kurtić et al. (2022), we focus on compressing RoBERTa without following its expensive pre-training regime. Our research leverages the popular open-source compression library SparseML111111https://github.com/neuralmagic/sparseml to implement unstructured pruning, structured pruning, and quantization via quantization-aware training. In all our experiments, we prune each network component independently using either GMP or OBS (Kurtic et al.). One exception is the embeddings layer, which we do not prune.
| Model | ACC | Loss | Perplexity |
| oBERTabase | 0.580 | 3.775 | 43.593 |
| oBERTabase 90% | 0.506 | 4.448 | 85.420 |
| oBERTabase 95% | 0.439 | 4.734 | 113.702 |
| oBERTamedium | 0.533 | 4.296 | 73.391 |
| oBERTamedium 90% | 0.631 | 1.896 | 6.662 |
| oBERTasmall | 0.465 | 4.561 | 95.670 |
| oBERTasmall 90% | 0.404 | 4.669 | 106.614 |
A.3 Model Details
Model details can be found in table 18
| Model | Parameters | Prunable | Sparse | Sparsity | size (MB) | Compression | GZIP size (MB) | Compression |
| oBERTabase | 124,647,170 | 85,526,016 | 1,539 | 0.0% | 474 | 1.00 | 435 | 1.00 |
| oBERTabase Quantized | 124,647,170 | 85,526,016 | 1,539 | 0.0% | 119 | 3.98 | 85 | 5.12 |
| oBERTabase 90% | 124,647,170 | 85,526,016 | 76,442,738 | 89.4% | 474 | 1.00 | 183 | 2.38 |
| oBERTabase 90% Quantized | 124,647,170 | 85,526,016 | 76,442,738 | 89.4% | 119 | 3.98 | 42 | 10.36 |
| oBERTabase 95% | 124,647,170 | 85,526,016 | 80,689,466 | 94.3% | 474 | 1.00 | 163 | 2.67 |
| oBERTabase 95% Quantized | 124,647,170 | 85,526,016 | 80,689,466 | 94.3% | 119 | 3.98 | 37 | 11.76 |
| oBERTaMEDIUM | 82,119,938 | 43,058,688 | 1,538 | 0.0% | 312 | 1.52 | 289 | 1.51 |
| oBERTaMEDIUM Quantized | 82,119,938 | 43,058,688 | 1,538 | 0.0% | 78 | 6.08 | 53 | 8.21 |
| oBERTaMEDIUM 90% | 82,119,938 | 43,058,688 | 38,222,138 | 88.8% | 312 | 1.52 | 161 | 2.70 |
| oBERTaMEDIUM 90% Quantized | 82,119,938 | 43,058,688 | 38,222,138 | 88.8% | 78 | 6.08 | 33 | 13.18 |
| oBERTaSMALL | 60,856,322 | 21,825,024 | 1,538 | 0.0% | 233 | 2.03 | 214 | 2.03 |
| oBERTaSMALL Quantized | 60,856,322 | 21,825,024 | 1,538 | 0.0% | 60 | 7.90 | 39 | 11.15 |
| oBERTaSMALL 90% | 60,856,322 | 21,825,024 | 19,111,068 | 87.6% | 233 | 2.03 | 149 | 2.92 |
| oBERTaSMALL 90% Quantized | 60,856,322 | 21,825,024 | 19,111,838 | 87.6% | 60 | 7.90 | 30 | 14.50 |
A.4 Dataset Details
Dataset statistics are detailed in Table 19.
| Dataset | Train | Eval |
| SQuAD v1.1 (examples) | 87599 | 10570 |
| SQuAD v2.0 (examples) | 130319 | 11873 |
| MNLI (examples) | 392702 | 19628 |
| QQP (examples) | 363,846 | 40,430 |
| IMDB (examples) | 25000 | 25000 |
| CONLL2003 (examples) | 14041 | 3250 |
| SST2 (examples) | 67349 | 872 |
| Wikipedia (words) | 6078422 | - |
| TBC (words) | 74004228 | - |
A.5 Teacher models
Performance of the RoBERTabaseand RoBERTalarge models on our sparse transfer datasets. We explore the optimal hyperparameters relative to performance in published results as shown in table 20 and 21
| Model | Training Epochs | Batch Size | Learning Rate | Weight Decay | Warmup | Target Metric | Target Score | Actual | Recall |
| SQUAD V1.1 | 3 | 16 | 1.00E-05 | 0 | 0 | F1 | 90.40 | 92.15 | 101.94% |
| SQUAD V2.0 | 3 | 16 | 3.00E-05 | 0 | 0 | F1 | 82.91 | 83.53 | 100.74% |
| QQP | 5 | 16 | 2.00E-05 | 0 | 0 | ACC | 91.90 | 91.52 | 99.59% |
| MNLI | 3 | 16 | 1.00E-05 | 0 | 0 | ACC | 87.60 | 87.88 | 100.31% |
| SST-2 | 3 | 16 | 2.00E-05 | 0 | 0 | ACC | 94.80 | 94.61 | 99.80% |
| CONLL2003 | 3 | 16 | 3.00E-05 | 0 | 0 | ACC | 99.10 | 99.29 | 100.19% |
| IMDB | 3 | 16 | 1.00E-05 | 0 | 0 | ACC | 94.67 | 95.24 | 100.60% |
| Model | Training Epochs | Batch Size | Learning Rate | Weight Decay | Warmup | Target Metric | Target Score | Actual | Recall |
| SQUAD V1.1 | 3 | 16 | 1.00E-05 | 0 | 0 | F1 | 94.50 | 94.62 | 100.12% |
| SQUAD V2.0 | 3 | 16 | 1.00E-05 | 0 | 0 | F1 | 89.40 | 89.14 | 99.71% |
| QQP | 3 | 16 | 1.00E-05 | 0 | 0 | ACC | 92.20 | 91.76 | 99.52% |
| MNLI | 3 | 16 | 1.00E-05 | 0 | 0 | ACC | 90.20 | 90.61 | 100.45% |
| SST-2 | 3 | 16 | 1.00E-05 | 0 | 0 | ACC | 96.40 | 96.22 | 99.81% |
| CONLL2003 | 3 | 16 | 3.00E-05 | 0 | 0 | ACC | 99.10 | 99.39 | 100.29% |
| IMDB | 3 | 16 | 1.00E-05 | 0 | 0 | ACC | 94.67 | 96.12 | 101.53% |
A.6 Upstream Pruning
Following the findings that more extensive teachers distill better Liu et al. (2019) and our experiments, we use both RoBERTabaseand RoBERTalarge as teachers eventually find the large model works better. Using this teacher, we use the parameters shown in table 22 to prune the models for oBERTa. This same set of parameters is applied to the structurally pruned models, but there is no induced sparsity.
| 5 Epochs | |
| Datasets | BookCorpus & English Wikipedia |
| Batch size | 256 |
| Initial learning rate | 5e-4 |
| Learning rate schedule | linear decay with rewinds |
| Learning rate rewinds | periodic every 0.5 epochs |
| Max sequence length | 512 |
| Weight decay | 0.01 |
| Knowledge Distillation (hardness, temperature) | (1.0, 5.5) |
| Student model | dense oBERTa-* model |
| Teacher model | RoBERTalarge |
| Pruning frequency | 100x per epoch |
| Initial Sparsity | 0.7 for 12 layer model, 0.5 for the 6-layer, and 0.3 for the 3-layer |
A.7 Sparse Transfer Hyper-parameters
Our work aims not to produce the highest possible performance of a sparse language model. Instead, we aim to make light language models that perform well on various tasks with minimal hyperparameter optimization. As a result, in all of our experiments, we leverage the parameters shown in 23 and 24 and perform a grid search over them.
| 10 Epochs | |
| Initial learning rate | 2.1e-4,1.9e-4,1.7e-4,1.5e-4,1.3e-4,1.1e-4,9e-5,7e-5,5e-5,3e-5,2e-5,1e-5 |
| Learning rate schedule | linear decay to 0 |
| Batch size | 12 |
| Weight Decay | 0.0, 0.01, 0.05, 0.1 |
| Knowledge Distillation hardness | 1.0, 0.0 |
| Frozen Embeddings | 1.0, 0.0 |
| Knowledge Distillation temperature | 7.0 |
| Knowledge Distillation Teacher | RoBERTabase, RoBERTalarge |
| 20 Epochs | |
| Initial learning rate | 2.1e-4,1.9e-4,1.7e-4,1.5e-4,1.3e-4,1.1e-4,9e-5,7e-5,5e-5,3e-5,2e-5,1e-5 |
| Learning rate schedule | linear decay to 0. Rewind to 5e-5 for QAT at epoch 10 |
| Freeze Batch Norm Epoch | 18 |
| Batch size | 12 |
| Weight Decay | 0.0, 0.01, 0.05, 0.1 |
| Knowledge Distillation hardness | 1.0, 0.0 |
| Frozen Embeddings | 1.0, 0.0 |
| Frozen Embeddings Schedule | Frozen until epoch 10, unfrozen for QAT |
| Knowledge Distillation temperature | 7.0 |
| Knowledge Distillation Teacher | RoBERTabase, RoBERTalarge |
A.8 Learning Rate
In our exploration of sparse transfer learning, we perform a wide study on the impact of the optimal learning rate for each task and each model in the oBERTa family. The results as shown in table 25
| Optimal Learning Rate | |||||||
| model | SQUAD | SQUAD V2 | MNLI | QQP | IMDB | SST2 | CONLL2003 |
| RoBERTabase | 1.00E-05 | 3.00E-05 | 1.00E-05 | 2.00E-05 | 1.00E-05 | 2.00E-05 | 3.00E-05 |
| RoBERTalarge | 1.00E-05 | 1.00E-05 | 1.00E-05 | 1.00E-05 | 1.00E-05 | 1.00E-05 | 3.00E-05 |
| oBERTabase | 1.00E-05 | 1.00E-05 | 1.00E-05 | 2.00E-05 | 1.00E-05 | 2.00E-05 | 3.00E-05 |
| oBERTabase 90% | 1.50E-04 | 1.50E-04 | 7.00E-05 | 1.70E-04 | 1.30E-04 | 9.00E-05 | 1.50E-04 |
| oBERTabase 95% | 1.50E-04 | 1.30E-04 | 9.00E-05 | 2.10E-04 | 1.30E-04 | 9.00E-05 | 5.00E-05 |
| oBERTaMEDIUM | 5.00E-05 | 5.00E-05 | 2.00E-05 | 3.00E-05 | 3.00E-05 | 2.00E-05 | 3.00E-05 |
| oBERTaMEDIUM 90% | 1.50E-04 | 1.30E-04 | 1.50E-04 | 1.50E-04 | 5.00E-05 | 1.50E-04 | 1.50E-04 |
| oBERTaSMALL | 1.50E-04 | 1.50E-04 | 3.00E-05 | 5.00E-05 | 3.00E-05 | 5.00E-05 | 3.00E-05 |
| oBERTaSMALL 90% | 1.50E-04 | 1.50E-04 | 2.10E-04 | 2.10E-04 | 1.50E-04 | 2.10E-04 | 1.90E-04 |
A.9 Knowledge Distillation
In our exploration of sparse transfer learning, we perform a wide study on the impact of knowledge distillation. Across tasks, we look at the impact using no teacher, RoBERTabaseand RoBERTalarge as shown in tables 26,27,28,29,30,31
| model | No KD | KD-Base | KD-Large |
| oBERTabase(Target) | 91.52% | N/A | N/A |
| oBERTabase 90% | 91.97 | 92.78 | 92.55 |
| oBERTabase 95% | 91.40 | 91.17 | 91.514 |
| oBERTaMEDIUM | 90.94 | 91.86 | 91.78 |
| oBERTaMEDIUM 90% | 87.16 | 87.16 | 89.56 |
| oBERTaSMALL | 89.56 | 88.65 | 90.83 |
| oBERTaSMALL 90% | 85.58 | 89.22 | 89.45 |
| model | No KD | KD-Base | KD-Large |
| oBERTabase(Target) | 91.52 | N/A | N/A |
| oBERTabase 90% | 63.18 | 91.01 | 90.93 |
| oBERTabase 95% | 90.46 | 90.45 | 90.72 |
| oBERTaMEDIUM | 90.75 | 90.96 | 90.96 |
| oBERTaMEDIUM 90% | 89.93 | 90.41 | 89.82 |
| oBERTaSMALL | 86.63 | 87.34 | 87.65 |
| oBERTaSMALL 90% | 88.72 | 89.40 | 87.50 |
| model | No KD | KD-Base | KD-Large |
| oBERTabase(Target) | 91.52 | N/A | N/A |
| oBERTabase 90% | 91.97 | 92.78 | 92.55 |
| oBERTabase 95% | 91.4 | 91.17 | 91.514 |
| oBERTaMEDIUM | 90.94 | 91.86 | 91.78 |
| oBERTaMEDIUM 90% | 87.16 | 87.16 | 89.56 |
| oBERTaSMALL | 89.56 | 88.65 | 90.83 |
| oBERTaSMALL 90% | 85.58 | 89.22 | 89.45 |
| model | No KD | KD-Base | KD-Large |
| oBERTabase(Target) | 91.52% | N/A | N/A |
| oBERTabase 90% | 99.17 | 99.08 | 99.11 |
| oBERTabase 95% | 98.89 | 98.47 | 97.51 |
| oBERTaMEDIUM | 99.21 | 99.16 | 99.19 |
| oBERTaMEDIUM 90% | 99.01 | 98.8 | 98.79 |
| oBERTaSMALL | 99.05 | 98.95 | 98.94 |
| oBERTaSMALL 90% | 98.88 | 98.55 | 98.55 |
| model | No KD | KD-Base | KD-Large |
| oBERTabase(Target) | 91.52% | N/A | N/A |
| oBERTabase 90% | 89.01 | 90.86 | 90.92 |
| oBERTabase 95% | 87.06 | 89.84 | 89.21 |
| oBERTaMEDIUM | 84.36 | 88.20 | 85.74 |
| oBERTaMEDIUM 90% | 84.71 | 89.26 | 88.61 |
| oBERTaSMALL | 82.00 | 80.77 | 77.08 |
| oBERTaSMALL 90% | 73.31 | 84.66 | 83.13 |
| model | No KD | KD-Base | KD-Large |
| oBERTabase(Target) | 91.52% | N/A | N/A |
| oBERTabase 90% | 75.57852204 | 80.25256971 | 81.32561567 |
| oBERTabase 95% | 72.61 | 77.67 | 77.98 |
| oBERTaMEDIUM | 69.42634 | 70.97328 | 71.55996 |
| oBERTaMEDIUM 90% | 68.25281 | 76.02975 | 76.64135 |
| oBERTaSMALL | 66.8281 | 62.9573 | 63.1224 |
| oBERTaSMALL 90% | 55.3959 | 70.0796 | 70.7913 |
A.10 Freezing Embeddings
In our exploration of sparse transfer learning, we perform a wide study on the impact of freezing the embeddings during finetuning. Across tasks, we look at the impact of frozen and unfrozen embeddings as shown in tables 32,33,34,35,36, and 37. Besides question answering, we do not find a strong trend with the impact of frozen embeddings. In some tasks, sparse and dense models perform better with frozen embeddings while not for others. Focusing on question answering, by using frozen embeddings dense models see large losses in F1 score and the opposite can be seen for pruned models.
| model | Frozen | Unfrozen |
| oBERTabase (Target) | N/A | 87.88% |
| oBERTabase 90% | 84.50 | 83.81 |
| oBERTabase 95% | 83.91 | 83.41 |
| oBERTaMEDIUM | 84.37 | 83.32 |
| oBERTaMEDIUM 90% | 81.61 | 77.00 |
| oBERTaSMALL | 80.24 | 80.36 |
| oBERTaSMALL 90% | 78.46 | 74.25 |
| model | Frozen | Unfrozen |
| oBERTabase (Target) | N/A | 91.52% |
| oBERTabase 90% | 90.93% | 90.99% |
| oBERTabase 95% | 90.72% | 90.85% |
| oBERTaMEDIUM | 90.96% | 91.35% |
| oBERTaMEDIUM 90% | 89.82% | 90.48% |
| oBERTaSMALL | 90.59% | 90.72% |
| oBERTaSMALL 90% | 89.40% | 89.74% |
| model | Frozen | Unfrozen |
| oBERTabase (Target) | N/A | 91.52% |
| oBERTabase 90% | 92.55 | 91.74 |
| oBERTabase 95% | 91.514 | 91.4 |
| oBERTaMEDIUM | 91.78 | 92.89 |
| oBERTaMEDIUM 90% | 89.56 | 88.76 |
| oBERTaSMALL | 90.83 | 90.48 |
| oBERTaSMALL 90% | 89.45 | 89.34 |
| model | Frozen | Unfrozen |
| oBERTabase (Target) | N/A | 91.52% |
| oBERTabase 90% | 97.51 | 98.55 |
| oBERTabase 95% | 99.11 | 99.13 |
| oBERTaMEDIUM | 99.19 | 99.18 |
| oBERTaMEDIUM 90% | 98.79 | 98.9 |
| oBERTaSMALL | 98.94 | 98.94 |
| oBERTaSMALL 90% | 98.55 | 98.69 |
| model | Frozen | Unfrozen |
| oBERTabase (Target) | N/A | 91.52% |
| oBERTabase 90% | 90.92 | 83.99 |
| oBERTabase 95% | 89.21 | 87.08 |
| oBERTaMEDIUM | 85.74 | 89.95 |
| oBERTaMEDIUM 90% | 88.61 | 86.63 |
| oBERTaSMALL | 77.08 | 84.64 |
| oBERTaSMALL 90% | 83.13 | 77.43 |
| model | Frozen | Unfrozen |
| oBERTabase (Target) | N/A | 91.52% |
| oBERTabase 90% | 71.56 | 78.05 |
| oBERTabase 95% | 81.33 | 78.45 |
| oBERTaMEDIUM | 77.98 | 76.86 |
| oBERTaMEDIUM 90% | 76.64 | 72.77 |
| oBERTaSMALL | 71.32 | 63.12 |
| oBERTaSMALL 90% | 70.79 | 59.38 |
A.11 Inference Benchmarks
We provide full results for our experiments in benchmarking the impact of compression on inference efficiency as shown in tables 45,43,42,38,40,39,44,44
| model | Throughput (items/sec) | Speedup | Latency Mean (ms/batch) | Latency Median (ms/batch | Latency Std (ms/batch) |
| oBERTabase | 16.69 | 1.00 | 59.90 | 59.82 | 1.02 |
| oBERTabase Quantized | 51.68 | 3.10 | 19.34 | 19.28 | 0.58 |
| oBERTabase 90% | 54.87 | 3.29 | 18.21 | 18.15 | 0.31 |
| oBERTabase 90% Quantized | 68.70 | 4.12 | 14.55 | 14.50 | 0.20 |
| oBERTabase 95% | 145.57 | 8.72 | 6.86 | 6.86 | 0.11 |
| oBERTabase 95% Quantized | 78.90 | 4.73 | 12.66 | 12.68 | 0.31 |
| oBERTaMEDIUM | 32.78 | 1.96 | 30.49 | 30.44 | 1.19 |
| oBERTaMEDIUM Quantized | 103.47 | 6.20 | 9.65 | 9.60 | 0.57 |
| oBERTaMEDIUM 90% | 106.01 | 6.35 | 9.42 | 9.34 | 0.28 |
| oBERTaMEDIUM 90% Quantized | 149.25 | 8.94 | 6.69 | 6.65 | 0.42 |
| oBERTaSMALL | 64.93 | 3.89 | 15.39 | 15.31 | 0.66 |
| oBERTaSMALL Quantized | 208.09 | 12.47 | 4.80 | 4.78 | 0.28 |
| oBERTaSMALL 90% | 203.95 | 12.22 | 4.89 | 4.86 | 0.33 |
| oBERTaSMALL 90% Quantized | 270.63 | 16.21 | 3.69 | 3.68 | 0.25 |
| model | Throughput (items/sec) | Speedup | Latency Mean (ms/batch) | Latency Median (ms/batch | Latency Std (ms/batch) |
| oBERTabase | 19.55 | 1.00 | 818.23 | 811.93 | 15.52 |
| oBERTabase Quantized | 83.92 | 4.29 | 190.65 | 189.55 | 4.21 |
| oBERTabase 90% | 74.29 | 3.80 | 215.35 | 214.31 | 2.47 |
| oBERTabase 90% Quantized | 137.83 | 7.05 | 116.07 | 115.43 | 2.56 |
| oBERTabase 95% | 89.07 | 4.56 | 179.62 | 178.92 | 3.19 |
| oBERTabase 95% Quantized | 160.68 | 8.22 | 99.56 | 98.91 | 2.63 |
| oBERTaMEDIUM | 38.95 | 1.99 | 410.73 | 408.13 | 6.11 |
| oBERTaMEDIUM Quantized | 157.12 | 8.04 | 101.82 | 101.27 | 2.21 |
| oBERTaMEDIUM 90% | 144.95 | 7.41 | 110.37 | 109.62 | 1.56 |
| oBERTaMEDIUM 90% Quantized | 251.32 | 12.86 | 63.65 | 63.40 | 1.76 |
| oBERTaSMALL | 77.49 | 3.96 | 206.46 | 205.75 | 2.07 |
| oBERTaSMALL Quantized | 276.10 | 14.12 | 57.94 | 57.43 | 1.63 |
| oBERTaSMALL 90% | 281.57 | 14.40 | 56.81 | 56.73 | 0.64 |
| oBERTaSMALL 90% Quantized | 417.35 | 21.35 | 38.32 | 38.01 | 1.55 |
| model | Throughput (items/sec) | Speedup | Latency Mean (ms/batch) | Latency Median (ms/batch | Latency Std (ms/batch) |
| oBERTabase | 19.02 | 1.00 | 3365.11 | 3352.63 | 29.49 |
| oBERTabase Quantized | 84.80 | 4.46 | 754.73 | 749.38 | 18.69 |
| oBERTabase 90% | 72.22 | 3.80 | 886.13 | 881.75 | 10.65 |
| oBERTabase 90% Quantized | 140.14 | 7.37 | 456.67 | 453.59 | 11.03 |
| oBERTabase 95% | 88.35 | 4.64 | 724.41 | 720.43 | 10.85 |
| oBERTabase 95% Quantized | 162.76 | 8.56 | 393.21 | 390.45 | 12.15 |
| oBERTaMEDIUM | 37.94 | 1.99 | 1686.85 | 1685.03 | 8.09 |
| oBERTaMEDIUM Quantized | 160.48 | 8.44 | 398.80 | 396.47 | 9.27 |
| oBERTaMEDIUM 90% | 130.02 | 6.84 | 492.22 | 486.90 | 9.64 |
| oBERTaMEDIUM 90% Quantized | 259.51 | 13.64 | 246.61 | 244.54 | 7.13 |
| oBERTaSMALL | 75.81 | 3.99 | 844.15 | 841.30 | 8.72 |
| oBERTaSMALL Quantized | 267.70 | 14.07 | 239.06 | 237.86 | 7.02 |
| oBERTaSMALL 90% | 278.93 | 14.67 | 229.43 | 228.41 | 3.43 |
| oBERTaSMALL 90% Quantized | 455.71 | 23.96 | 140.43 | 139.81 | 5.40 |
| model | Throughput (items/sec) | Speedup | Latency Mean (ms/batch) | Latency Median (ms/batch | Latency Std (ms/batch) |
| oBERTabase | 4.89 | 1.00 | 204.65 | 204.93 | 1.82 |
| oBERTabase Quantized | 20.01 | 4.09 | 49.95 | 49.88 | 0.66 |
| oBERTabase 90% | 17.60 | 3.60 | 56.82 | 56.70 | 0.72 |
| oBERTabase 90% Quantized | 37.50 | 7.67 | 26.66 | 26.61 | 0.38 |
| oBERTabase 95% | 20.15 | 4.12 | 49.62 | 49.60 | 0.54 |
| oBERTabase 95% Quantized | 46.02 | 9.41 | 21.72 | 21.70 | 0.31 |
| oBERTaMEDIUM | 9.59 | 1.96 | 104.28 | 104.33 | 0.90 |
| oBERTaMEDIUM Quantized | 41.23 | 8.43 | 24.25 | 24.18 | 0.33 |
| oBERTaMEDIUM 90% | 38.30 | 7.83 | 26.10 | 26.05 | 0.41 |
| oBERTaMEDIUM 90% Quantized | 73.28 | 14.99 | 13.64 | 13.60 | 0.19 |
| oBERTaSMALL | 19.31 | 3.95 | 51.78 | 51.74 | 0.35 |
| oBERTaSMALL Quantized | 75.81 | 15.50 | 13.18 | 13.18 | 0.19 |
| oBERTaSMALL 90% | 68.70 | 14.05 | 14.55 | 14.50 | 0.20 |
| oBERTaSMALL 90% Quantized | 145.57 | 29.77 | 6.86 | 6.86 | 0.11 |
| model | Throughput (items/sec) | Speedup | Latency Mean (ms/batch) | Latency Median (ms/batch | Latency Std (ms/batch) |
| oBERTabase | 5.14 | 1.00 | 3113.07 | 3113.92 | 19.89 |
| oBERTabase Quantized | 22.14 | 4.31 | 722.72 | 719.24 | 11.40 |
| oBERTabase 90% | 17.15 | 3.34 | 932.97 | 931.21 | 5.76 |
| oBERTabase 90% Quantized | 39.03 | 7.59 | 409.90 | 408.71 | 4.64 |
| oBERTabase 95% | 19.80 | 3.85 | 808.16 | 806.80 | 4.15 |
| oBERTabase 95% Quantized | 46.54 | 9.06 | 343.75 | 342.75 | 4.12 |
| oBERTaMEDIUM | 10.24 | 1.99 | 1563.00 | 1557.90 | 16.53 |
| oBERTaMEDIUM Quantized | 42.82 | 8.33 | 373.61 | 372.88 | 4.05 |
| oBERTaMEDIUM 90% | 33.69 | 6.56 | 474.88 | 474.25 | 3.64 |
| oBERTaMEDIUM 90% Quantized | 76.10 | 14.81 | 210.24 | 209.41 | 2.45 |
| oBERTaSMALL | 20.41 | 3.97 | 783.81 | 782.99 | 6.59 |
| oBERTaSMALL Quantized | 79.57 | 15.48 | 201.07 | 200.60 | 2.12 |
| oBERTaSMALL 90% | 72.92 | 14.19 | 219.40 | 218.84 | 2.53 |
| oBERTaSMALL 90% Quantized | 139.50 | 27.14 | 114.68 | 114.45 | 1.53 |
| model | Throughput (items/sec) | Speedup | Latency Mean (ms/batch) | Latency Median (ms/batch | Latency Std (ms/batch) |
| oBERTabase | 5.06 | 1.00 | 12655.34 | 12680.81 | 57.78 |
| oBERTabase Quantized | 21.88 | 4.32 | 2924.89 | 2921.95 | 31.78 |
| oBERTabase 90% | 17.18 | 3.40 | 3724.72 | 3724.23 | 15.27 |
| oBERTabase 90% Quantized | 37.44 | 7.40 | 1709.44 | 1699.64 | 26.97 |
| oBERTabase 95% | 22.13 | 4.37 | 2892.15 | 2893.08 | 22.94 |
| oBERTabase 95% Quantized | 43.94 | 8.68 | 1456.53 | 1451.76 | 20.45 |
| oBERTaMEDIUM | 10.21 | 2.02 | 1567.70 | 1562.90 | 14.53 |
| oBERTaMEDIUM Quantized | 42.74 | 8.45 | 374.35 | 373.15 | 4.00 |
| oBERTaMEDIUM 90% | 33.99 | 6.72 | 470.67 | 469.99 | 3.58 |
| oBERTaMEDIUM 90% Quantized | 75.64 | 14.95 | 211.53 | 210.80 | 2.61 |
| oBERTaSMALL | 20.42 | 4.03 | 783.67 | 783.29 | 5.16 |
| oBERTaSMALL Quantized | 79.44 | 15.70 | 201.40 | 201.43 | 2.90 |
| oBERTaSMALL 90% | 71.50 | 14.13 | 223.77 | 223.41 | 1.78 |
| oBERTaSMALL 90% Quantized | 139.55 | 27.58 | 114.65 | 114.48 | 1.53 |
| Model | Throughput (items/sec) | Speedup vs BERT-Base | Speedup vs BERT-Large | Latency Mean (ms/batch) | Latency Median (ms/batch | Latency Std (ms/batch) |
| bertbase | 4.923 | 1.00 | 5.65 | 203.1165 | 202.7077 | 1.3646 |
| bert-large | 0.8706 | 0.18 | 1.00 | 1148.6105 | 1145.145 | 9.5526 |
| oBERTabase | 4.89 | 0.99 | 5.61 | 204.65 | 204.93 | 1.82 |
| oBERTabase Quantized | 20.01 | 4.07 | 22.99 | 49.95 | 49.88 | 0.66 |
| oBERTabase 90% | 17.60 | 3.57 | 20.21 | 56.82 | 56.70 | 0.72 |
| oBERTabase 90% Quantized | 37.50 | 7.62 | 43.07 | 26.66 | 26.61 | 0.38 |
| oBERTabase 95% | 20.15 | 4.09 | 23.14 | 49.62 | 49.60 | 0.54 |
| oBERTabase 95% Quantized | 46.02 | 9.35 | 52.86 | 21.72 | 21.70 | 0.31 |
| oBERTaMEDIUM | 9.59 | 1.95 | 11.01 | 104.28 | 104.33 | 0.90 |
| oBERTaMEDIUM Quantized | 41.23 | 8.37 | 47.36 | 24.25 | 24.18 | 0.33 |
| oBERTaMEDIUM 90% | 38.30 | 7.78 | 43.99 | 26.10 | 26.05 | 0.41 |
| oBERTaMEDIUM 90% Quantized | 73.28 | 14.89 | 84.18 | 13.64 | 13.60 | 0.19 |
| oBERTaSMALL | 19.31 | 3.92 | 22.18 | 51.78 | 51.74 | 0.35 |
| oBERTaSMALL Quantized | 75.81 | 15.40 | 87.07 | 13.18 | 13.18 | 0.19 |
| oBERTaSMALL 90% | 68.70 | 13.95 | 78.91 | 14.55 | 14.50 | 0.20 |
| oBERTaSMALL 90% Quantized | 145.57 | 29.57 | 167.21 | 6.86 | 6.86 | 0.11 |
| pruneOFA-large 80% Quantized | 12.7315 | 2.59 | 14.62 | 78.5322 | 78.3961 | 0.4826 |
| prunedOFA-large 90% Quantized | 11.7265 | 2.38 | 13.47 | 85.2647 | 85.1616 | 0.4292 |
| obert-large | 0.876 | 0.18 | 1.01 | 1141.5707 | 1138.5756 | 9.0121 |
| obert-large 95% | 7.508 | 1.53 | 8.62 | 133.1785 | 132.9672 | 1.0091 |
| obert-large 95% Quantized | 16.8077 | 3.41 | 19.31 | 59.4828 | 59.322 | 0.6445 |
| pruneBERT | 17.60 | 3.57 | 20.21 | 56.82 | 56.70 | 0.72 |
| obert-large 97% | 8.0414 | 1.63 | 9.24 | 124.3431 | 124.1421 | 1.0249 |
| obert-large 97% Quantized | 15.8631 | 3.22 | 18.22 | 63.0278 | 62.9979 | 0.6018 |
| obertbase 90% | 18.2881 | 3.71 | 21.01 | 54.6688 | 54.5896 | 0.5476 |
| obertbase 90% Quantized | 34.2797 | 6.96 | 39.37 | 29.1616 | 29.0977 | 0.3156 |
| obertbase 95% | 25.1818 | 5.12 | 28.92 | 39.6997 | 39.5986 | 0.5805 |
| obertbase 95% Quantized | 40.6387 | 8.25 | 46.68 | 24.5986 | 24.5222 | 0.3231 |
| Vs. BERT-Base | Vs. BERT-Large | ||||
| Model | F1 | Recovery | Speed up | Recovery | Speed up |
| BERTbase | 88.55 | 100.00% | 1.00 | 97.74% | 5.65 |
| BERT-large | 90.60 | 102.32% | 0.18 | 100.00% | 1.00 |
| oBERTabase | 92.20 | 104.12% | 0.99 | 101.77% | 5.61 |
| oBERTabase Quantized | 93.18 | 105.23% | 4.07 | 102.85% | 22.99 |
| oBERTabase 90% | 91.00 | 102.77% | 3.57 | 100.44% | 20.21 |
| oBERTabase 90% Quantized | 89.46 | 101.03% | 7.62 | 98.74% | 43.07 |
| oBERTabase 95% | 89.84 | 101.46% | 4.09 | 99.16% | 23.14 |
| oBERTabase 95% Quantized | 88.40 | 99.83% | 9.35 | 97.57% | 52.86 |
| oBERTaMEDIUM | 90.36 | 102.04% | 1.95 | 99.74% | 11.01 |
| oBERTaMEDIUM Quantized | 90.37 | 102.06% | 8.37 | 99.75% | 47.36 |
| oBERTaMEDIUM 90% | 89.26 | 100.80% | 7.78 | 98.52% | 43.99 |
| oBERTaMEDIUM 90% Quantized | 86.93 | 98.17% | 14.89 | 95.95% | 84.18 |
| oBERTaSMALL | 84.87 | 95.84% | 3.92 | 93.68% | 22.18 |
| oBERTaSMALL Quantized | 84.82 | 95.79% | 15.40 | 93.62% | 87.07 |
| oBERTaSMALL 90% | 84.66 | 95.61% | 13.95 | 93.45% | 78.91 |
| oBERTaSMALL 90% Quantized | 78.71 | 88.89% | 29.57 | 86.88% | 167.21 |
| pruneOFA-large 80% Quantized | 90.30 | 101.98% | 2.59 | 99.67% | 14.62 |
| pruneOFA-large 90% Quantized | 89.96 | 101.59% | 2.38 | 99.29% | 13.47 |
| oBERT-large 95% | 90.19 | 101.85% | 1.53 | 99.55% | 1.01 |
| oBERT-large 95% Quantized | 90.21 | 101.87% | 3.41 | 99.57% | 8.62 |
| pruneBERT | 84.90 | 95.88% | 3.41 | 93.71% | 19.31 |
| oBERT-large 97% | 90.18 | 101.84% | 13.05 | 99.54% | 73.82 |
| oBERT-large 97% Quantized | 90.13 | 101.78% | 1.63 | 99.48% | 9.24 |
| oBERTbase 90% | 88.47 | 99.91% | 3.22 | 97.65% | 18.22 |
| oBERTbase 90% Quantized | 88.00 | 99.38% | 3.71 | 97.13% | 21.01 |
| oBERTbase 95% | 88.19 | 99.59% | 6.96 | 97.34% | 39.37 |
| oBERTbase 95% Quantized | 88.11 | 99.50% | 5.12 | 97.25% | 28.92 |
A.12 Limitations
While much of our work has focused on showcasing the broad usability of compressed language models, they are not without fault. While our experiments focus on the compression of RoBERTa, the size of its training dataset makes complete exploration of the ability of pruning during pretraining somewhat limited. The work in the paper shows the ability to compress RoBERTa on a smaller pretraining dataset but does not contrast it with the impact of compression on the full dataset.
A second limitation of our work is the high computational demand required for creating public domain sparse language models. Despite amortizing the cost of compression to a few pretraining training regimes, the reduction of other language models like ALBERT Lan et al. (2019) or XLM-R Conneau et al. (2019) require completely new training, pruning, and transfer experiments.
A.13 Responsible NLP Research - Reproducibility Checklist
A.13.1 Scientific Artifacts
Datasets. We experiment with well-established benchmarks with usage in many broad domains. We do not perform any modification or augmentation in any dataset. Since datasets are not modified, we did not look for any personal or sensitive content.
In our pre-training experiments, we leverage the Toronto Book Corpus (TBC) Zhu et al. (2015)121212https://huggingface.co/datasets/bookcorpus and the Wikipedia Foundation (2021)131313https://huggingface.co/datasets/wikipedia.
For fine-tuning we make use of SQuAD v1.1 Rajpurkar et al. (2016b) 141414https://huggingface.co/datasets/squad, SQuAD v2.0 Rajpurkar et al. (2018) 151515https://huggingface.co/datasets/squadv2,
Quora Duplicate Question Dataset (QQP) Shankar (2017)161616https://huggingface.co/datasets/glue, and Multi-Genre Natural Language Inference (MNLI) Williams et al. (2018) 171717 https://huggingface.co/datasets/glue, Large Movie Review Dataset (IMDB) Maas et al. (2011)181818 https://huggingface.co/datasets/imdb, Stanford Sentiment Treebank (SST-2) Socher et al. (2013)191919 https://huggingface.co/datasets/glue, and the shared task of CoNLL-2003 concerns language-independent named entity recognition (CONLL-2003) Tjong Kim Sang and
De Meulder (2003)202020 https://huggingface.co/datasets/conll2003datasets.
Models. The model used as a starting point for all of our experiments is RoBERta, publicly available via HuggingFace Hub 212121https://huggingface.co/bert-base-uncased. All other models presented in this paper will be released in openly-available repositories along with their compression recipes, training metrics, and hyper-parameters.
A.13.2 Computational Experiments
Upstream. During upstream pruning due to the large size of language models and their associated teachers we leverage 4x A100 40GB NVIDIA GPUs. We train for 5 epochs and an entire training and pruning run takes approximately 72 hours. Since the cost of such a large compute instance is high, these experiments were only run with a single seed and without major hyper-parameter exploration.
Sparse-Transfer Our experimentation on finetuning our compressed models uses the workhorse 16GB V100. Our sparse-transfer datasets vary greatly in size and as a result, so do experiments. Finetuning for CONL2003 takes less than 10 minutes while larger datasets like QQP take about 24 hours. Due to the number of datasets which we evaluate and the number of models in the oBERTa family, we only perform experimentation with a single fixed seed.
DeepSparse inference. We pair our compressed models with DeepSparse Magic (2023) a publicly-available sparsity-aware CPU inference engine. All models are exported using the standard ONNX222222https://onnx.ai/ format. For our competitive benchmarking against existing compressed language models, we leverage the model representations shared in the SparseZoo 232323https://sparsezoo.neuralmagic.com/. This approach means that some older models such as oBERT may have had less optimized ONNA exports. We believe this difference in exportation causes the nearly 4x improvement in the performance of oBERTa base vs bert-base.
A.13.3 Computational Packages
All of our experimentation is done using public libraries and datasets to ensure extensibility and reproducibility. Our experimentation is done using NeuralMagic’s SparseML 242424https://github.com/neuralmagic/sparseml which has specialized integration with HuggingFace’s Transformers 252525https://github.com/huggingface/transformers and Datasets 262626https://github.com/huggingface/datasets libraries.