A Bright First Day for Tidal Disruption Events
Abstract
Stream-stream collision may be an important pre-peak energy dissipation mechanism in tidal disruption events (TDEs). We perform local three-dimensional radiation hydrodynamic simulations in a wedge geometry including the gravity to study stream self-crossing, with emphasis on resolving the collision and following the subsequent outflow. We find that the collision can contribute to pre-peak optical emissions by converting of stream kinetic energy to radiation, yielding prompt emission of . The radiative efficiency is sensitive to stream mass fallback rates, and strongly depends on the downstream gas optical depth. Even for a sub-Eddington () mass fallback rate, the strong radiation pressure produced in the collision can form a local super-Eddington region near the collision site, where a fast, aspherical outflow is launched. Higher mass fallback rate usually leads to more optically-thick outflow and lower net radiative efficiency. For , the estimated photosphere size of the outflow can expand by one to two orders of magnitudes reaching . The average gas temperature at this photospheric surface is a few K, roughly consistent with inferred pre-peak photosphere properties for some optical TDEs. We find that the dynamics is sensitive to collision angle and collision radius, but the radiative efficiency or outflow properties show more complex dependency than is often assumed in ballistic models.
1 Introduction
The tidal disruption of a star by a black hole can power a bright transient flare in multiple wavebands (Rees, 1988; Phinney, 1989; Evans & Kochanek, 1989; Ulmer, 1999). These tidal disruption events (TDEs) happen when the pericenter of star’s orbit is within the tidal radius , where and are the mass and radius of the star, and is the mass of the black hole. After disruption, roughly half of the material escapes the black hole’s gravity, while other gravitationally bound gas returns to the pericenter in a highly eccentric orbit.
The fallback and circularization of the debris can produce prominent emission, resulting in luminous transient events peaked in optical-ultraviolet (UV) or X-ray. The decay timescale of TDE candidates often approximately follows the scaling, which is a theoretical prediction for the mass fallback rate of the debris (Rees, 1988; Phinney, 1989). TDEs are important probes for studying the black hole properties such as mass (Ramirez-Ruiz & Rosswog, 2009; Stone & Metzger, 2016; Wevers et al., 2017; Mockler et al., 2019) and spin (Kesden, 2012; Gafton & Rosswog, 2019). The chemical composition and light curve also constrain the structure and evolution stage of the disrupted star (Lodato et al., 2009; MacLeod et al., 2012; Kochanek, 2016; Ryu et al., 2020; Law-Smith et al., 2020).
TDEs were first detected as strong X-ray flares from quiescent galaxies (Grupe et al., 1999; Greiner et al., 2000) by ROSAT. More X-ray events have subsequently been captured by or identified in XXM-Newton, Chandra and Swift (Lin et al., 2011; Saxton et al., 2012; Komossa, 2015; Gehrels & Cannizzo, 2015; Lin et al., 2018; Wevers et al., 2019). Complimenting X-ray observations, the optical/UV is another important channel to detect TDEs. In the recent decade, optical transient surveys have played an increasing role in identifying TDEs, including for example the Sloan Digital Sky Survey (SDSS), Pan-STARRS and ASAS-SN surveys(Van Velzen et al., 2011; Hung et al., 2017; Kochanek et al., 2017; Gezari, 2021; Van Velzen et al., 2021; Goldtooth et al., 2023). This sample is expected to greatly increase with the upcoming Large Synoptic Survey Telescope (LSST) of the Vera Rubin Observatory (Bricman & Gomboc, 2020; Gezari, 2021; Hambleton et al., 2022) and Ultraviolet Transient Astronomy Satellite (ULTRASAT) (Ben-Ami et al., 2022).
Interestingly, the optical/UV and the X-ray identified candidates may represent different populations of emission sources. First, optical/UV bright TDEs rarely show X-ray emission. Second, the continuum temperature derived in optical/UV TDEs is usually an order of magnitude lower than the X-ray TDEs. The inferred blackbody temperature of X-ray TDEs is roughly consistent with emission from a hot accretion disk formed from the captured debris. This suggests that the optical candidates, with much lower temperature, may originate from other emission mechanisms.
One theoretical resolution of this dichotomy involves reprocessing of X-ray emission by a quasi-spherical, optically thick layer around the accretion disk (Loeb & Ulmer, 1997; Strubbe & Quataert, 2009; Metzger & Stone, 2016; Roth et al., 2016), or a quasi-spherical, radiation supported disk such as the “Zero-Bernoulli accretion flows”, or “ZEBRAs” model (Coughlin & Begelman, 2014; Eyles-Ferris et al., 2022)). In parallel, the reprocessing of disk emission could be due to an optically thick wind from the disk (Lodato & Rossi, 2011; Miller, 2015; Metzger & Stone, 2016; Kara et al., 2018). Dai et al. (2018) proposed a unified model for a typical TDE system, including the highly asymmetric geometry of radiation supported thick disk, optically thick wind and hot corona or jet. This model suggests that the emission from such systems will naturally cover both the optical-UV and soft X-ray bandwidth, with viewing angle effects dominating the appearance in different wavebands (also see Thomsen et al. (2022)).
The models explaining optical emission from TDEs generally involve gas circularization and radiation generation by viscous processes, which will likely to happen near or after the peak optical light curve. But observations indicate that the inferred photosphere of some TDEs experience quick expansion during the pre-peak time, where the size can increase for one to two orders of magnitudes within days to weeks (Mockler et al., 2019; Van Velzen et al., 2021). It is likely that additional emission or reprocessing mechanism is needed to explain the pre-peak light curve for optical TDEs.
A potentially important pre-peak emission mechanism is the stream-stream collision, which happens when the apsidal precession shifts the stream orbit and leads to stream self-intersection (Shiokawa et al., 2015; Piran et al., 2015; Dai et al., 2015; Dittmann, 2022). When the fallback stream and the returning stream collide, some of the streams kinetic energy will be dissipated. The intersection region can become radiation pressure dominated, if the post-shock gas is sufficiently optically thick (Kim et al., 1999; Jiang et al., 2016). Consequently, the stream-stream collision can affect the pre-peak emission through different channels. First, it might directly contribute to optical emission by converting kinetic energy to radiation. Alternatively, it might create a radiation-pressure driven outflow, which reprocesses the emission from the hot, shocked gas into optical emission (Jiang et al., 2016; Bonnerot & Stone, 2021).
Recent global simulations that track the post-shock gas circularization seem to indicate that the stream-stream collision can efficiently redistribute debris angular momentum (Bonnerot & Stone, 2021; Curd, 2021; Steinberg & Stone, 2022; Andalman et al., 2022). In fact, recent work has suggested the fallback debris may be slow to circularize and form an accretion disk, implying that the majority of emission could be powered by various shocks including those from stream self interaction. The exact outcome of collision such as relative importance of luminosity and kinetic energy is sensitive to TDE system physical parameters as well as numerical treatment. Jiang et al. (2016) and Lu & Bonnerot (2020) performed local simulations of stream-stream collision. They show that the post-shock gas is likely to form optically-thick outflow, and the stream-stream collision itself is also an important pre-peak emission source. In this paper, we adopt similar approach and study the stream-stream collision in a localized calculation domain. The domain is optimized for resolving the streams and radiation mediated collision, while radially extended to track the post-shock gas evolution. We focus on the radiation’s role in redistributing gas momentum and energy, determining the pre-peak emission, and affecting the downstream gas evolution.
We introduce our numerical set-up in Section 2. In Section 3, we describe a case study of Eddington mass fallback rate. We also compare the effect of different mass fallback rates of the streams, the collision angle between the streams, and the collision radius relative to the black hole. Table 1 lists the key orbital parameters. In Section 4, we discuss the implied prompt emission luminosity, the estimated photosphere evolution and compare our results with previous studies. We elaborate the details of gravity implementation in Appendix A, and show convergence study in Appendix B.
2 Simulation Set-up
2.1 Equations and Units
We solve the following equations in Athena++ with the explicit radiation transfer module (Jiang, 2021).
Equation 1 - Equation 3 are hydrodynamic equations for gas, where , , are fluid density, velocity and total energy density. We assume gas is ideal, so gas internal energy and pressure are related by . P is the pressure tensor. In the right-hand side of Equation 2 and Equation 3, radiation couples with gas through the components of the radiation four force and , which are the momentum and energy imparting from radiation to gas. We adopt the generalized Newtonian gravitational description from Tejeda & Rosswog (2013). The gravitational force and gravitational potential are and , we list the detailed implementation in Appendix A.
| (1) | |||
| (2) | |||
| (3) | |||
| (4) | |||
| (5) | |||
| (6) | |||
| (7) |
Equation 4 - Equation 7 represent the frequency integrated radiation transfer equation and the source terms couple to the gas momentum and energy. In the Athena++ implementation, the specific intensities are first transformed to the fluid comoving frame, where the opacities and emissivities are the simplest. The radiation source terms is evaluated and updated implicitly along with the comoving frame gas internal energy equation. The intensities are then transformed back to the lab frame, and the resulting energy and momentum source terms and are evaluated by integrating the intensities over angle as described in Jiang (2021). Here, is the light speed. and are the comoving frame intensity and mean intensity. n is the unit vector corresponding to rays in discretized angular grids, with the same angular discretization in Davis et al. (2012). In the simulations, we used angles per octant, resulting angles in octants. is the scaled Lorentz factor, with is the Lorentz factor. Equation 6 and 7 represent radiation’s effect on gas energy and momentum. In the source term, is the radiation constant, and are scattering opacity and Rosseland mean absorption opacity, is the difference between the Planck mean and Rosseland mean opacity.
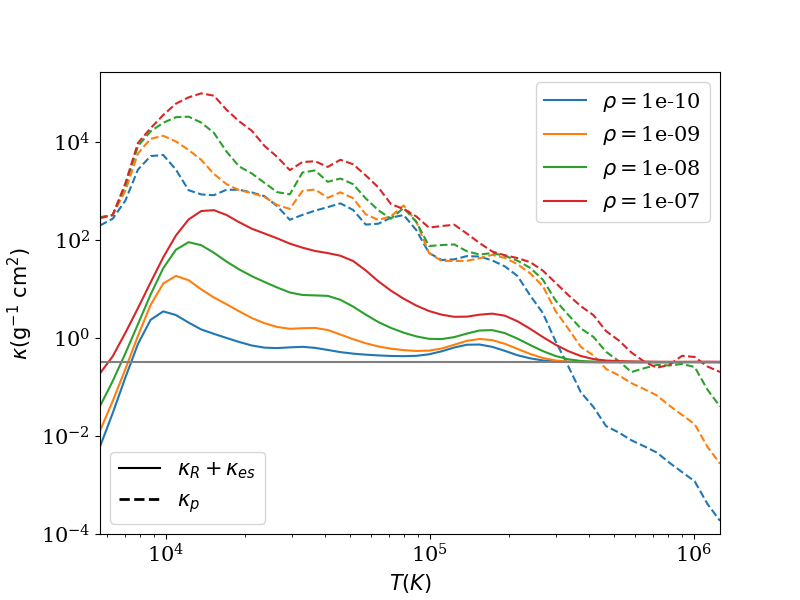
We use OPAL opacity (Iglesias & Rogers, 1996) for the and based on the local gas density and temperature, and assume . Figure 1 shows example opacity as functions of temperature for a range of gas densities. In the code, we solve the unit-less equations with the scaling of density , velocity and length cm. In the rest of paper, we report unit-less quantities unless explicitly specified.
2.2 Calculation Domain and Resolution
We preform the local simulations in spherical-polar coordinates, but with the origin displaced relative to the black hole. We adopt a simulation domain that centers the collision point in the direction, and varies with different stream orbits. As an example, Figure 2 shows the domain we adopt for A122 runs (A122Edd1, A122Edd01, A122Edd001 and A122Edd10). As we will elaborate in Section 3.1, resolving the streams and the collision region is the primary motivation for us to adopt such a local simulation domain. In the rest of the section, we note the variables in the coordinate with the black hole at the origin with subscript 1. We first integrate and from Tejeda & Rosswog (2013) in the -plane to obtain the ballistic trajectory with stream-stream collision radius and collision angle with respect to the black hole. We set the black hole and star mass to and respectively, and the stellar radius is . We assume the orbit eccentricity estimated as Dai et al. (2015)
| (8) |
where is the orbit penetration factor. is the tidal radius, and is the pericenter radius. So by choosing , we obtain the initial condition for a Newtonian elliptical orbit as an approximation to the orbit of most bound material. The initial position and velocity are and in direction, here is the approximated semi-major axis, is the approximated initial direction velocity. The solid orange line in Figure 2 shows part of the orbit with , , . With this orbit, the streams collide at relative to the black hole with the colliding angle .
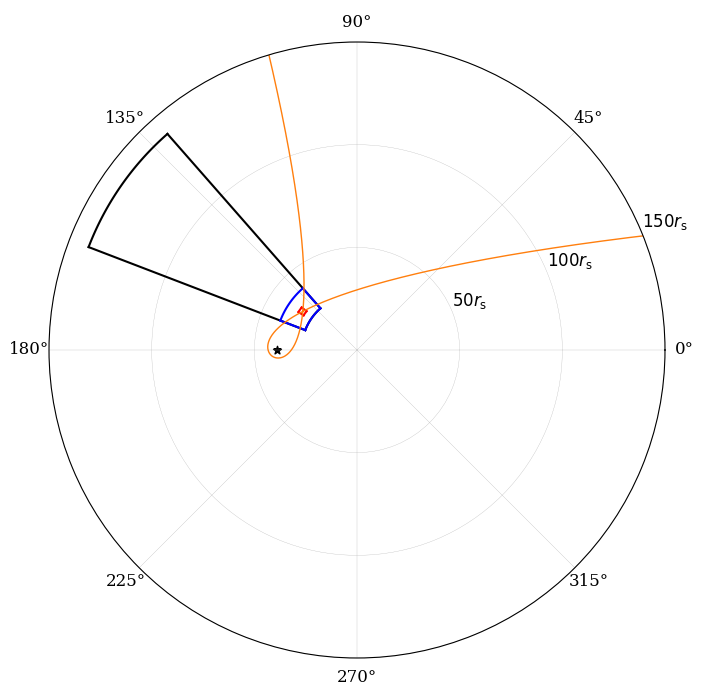
The domain is extended in direction, to align with the net momentum direction of the collision. Instead of placing the black hole at the origin, we translate the black hole by , so it is at (). For A122 runs, . For A90Edd1 and A122R95Edd1, we chose and . In the direction, we use logarithmic grid spacing. For A122 runs, the domain is in direction, which is shown in Figure 2 by the black frame as the projection on -plane. For A90Edd1, the domain is . For A122R95Edd1, the domain is .
We use static mesh refinement (SMR) in Athena++ to resolve the streams and the shock. The root level is resolved by cells in direction directions. The blue and red regions in Figure 2 show the refined regions in A122Edd1, A122Edd01, A122Edd001 and A122Edd10. The blue region is at five levels of refinement and spans , it covers most of the stream trajectory before the stream-stream collision, giving the resolution in and directions. The red region is at six levels of refinement and is . For A90Edd1, the level five refinement region is , and level six refinement region is . For A122R95Edd1, the level five refinement region is , and level six refinement region is .
At the collision radius , assuming the stream scale height is determined by the vertical balance between tidal force and gas pressure gradient (Guillochon et al., 2014; Jiang et al., 2016), we estimate that . With a black hole and orbit, . With five levels of SMR, we can resolve the by roughly four cells, assuming stream temperature K before collision. Similar to Jiang et al. (2016), we assume higher to calculate the scale height, but set the gas temperature in the stream to be K. Before collision, the kinetic energy density in the streams is about six orders of magnitude higher than internal energy density or radiation energy density. After the collision, the post-shock gas temperature is mostly in equilibrium with effective radiation temperature. As we will discuss in Section 3, the post-shock gas radiation energy density is primarily determined by the energy conversion from kinetic energy. Therefore, the internal energy in the stream prior to collision has limited effect on post-shock gas temperature.
2.3 Initial and Boundary Condition
Before injecting stream, we set the initial background density and pressure to be low values of and . We set density and pressure floor for the hydrodynamic Riemann solver to be and .
We model the stream-stream collision as a fallback stream and a returning stream injected from both boundaries in the plane, similar to Jiang et al. (2016). For each stream, we inject them at the radius of and by marking the four nearest ghost cells in and direction as stream injection cells, and set uniform gas density , velocity and pressure in these cells. We do not explicitly set the radiation intensity in ghost cells, once the gas streams enter calculation domain, they rapidly adjust to thermal equilibrium in just a few zones. The other cells at the direction boundaries are set to be single direction outflow for hydrodynamical variables, which copies all the values from the first active cells but set any velocity that enters the calculation domain to zero. The and direction hydro boundaries are also single direction outflow. The radiation boundaries in the , and direction are “vacuum” radiation boundaries, which copies all the intensities with n pointing outward, but sets all intensities with n pointing inward to be zero.
For the stream injection cells at the direction boundaries, we set local velocity to be . The density in the stream injection ghost cells is set by , where is the Eddington accretion rate, is the Eddington ratio, and is the total injection area normal to direction. In simulations, varies as we change and , so we use the numerically computed cell areas for better precision.
Note that in our set-up, we assume the fallback stream and the returning stream have the same entropy and ignore the potential stream width change due to the dissipation near the pericenter. We discuss the potential effects in Section 4.3, but leave the study of how nozzle shock dissipation, radiative cooling and numerical diffusion affect stream width after pericenter to future work.
To obtain and , we first integrate Equation A2 to get the ballistic trajectory and velocity of an assumed point mass, then translate them by . For A122Edd1, A122Edd01, A122Edd001 and A122Edd10, , at the inner and outer direction boundary. For A122Edd1, at the inner and outer direction boundary to match . The of A122Edd01, A122Edd001 and A122Edd10 are of A122Edd1.
For A90Edd1, we keep the fallback stream the same as A122Edd1, but manually change the returning stream velocity so that it collides with the fallback stream at and . We inject the streams at , with the density and velocity at the inner and outer direction boundary. Similarly, for A122R95Edd1, the fallback stream is a part of the same orbit as in A122Edd1, but we manually change the returning stream, so they collide with similar angle but at a further radius . We inject the streams at , with the density and velocity at the inner and outer direction boundary respectively.
3 Results
We present six simulations, including four A122 runs with the same orbit but different fallback rates, along with two runs to study the effect of the collision angle (A90Edd1) and radius (A122R95Edd1). We list the stream orbital parameters in the black hole-centered coordinate Table 1.
| Name | |||
|---|---|---|---|
| A122Edd1 | 1.0 | 22.5 | |
| A122Edd01 | 22.5 | ||
| A122Edd001 | 22.5 | ||
| A122Edd10 | 22.5 | ||
| A90Edd1 | 1.0 | 24.1 | |
| A122R95Edd1 | 1.0 | 95.1 |
3.1 Importance of resolving the stream and radiation mediated shock
In this section, we show that the outcome of stream-stream collision in RHD simulations is highly sensitive to spatial resolution. We compare a low resolution simulation A122Edd1_LR and the fiducial resolution A122Edd1, where we reduce the level-five and level-six refinement to level-two refinement. With the adjustment, we have the resolution of in and direction when injecting the streams, meaning is about times of the fiducial A122Edd1 resolution at the same location. So we no longer resolve the estimated stream scale height . As a result, the stream cross-section is artificially increased, so the stream density is reduced at fixed . We set at the inner and outer direction boundary to match fallback rate. Other simulation set-ups are the same as A122Edd1.
The choice of level-two refinement in A122Edd1_LR is motivated by the global test calculation in Appendix A, which tracks the stream orbit around the black hole. In the test simulation, we observe noticeably different gas dynamics after the stream-stream collision compared to A122Edd1, despite the same stream orbit and comparable mass injection rates.
In A122Edd1_LR, the stream density is artificially reduced due to insufficient resolution, which could affect the stream vertical optical depth, where . We measure the initial vertical optical depth by integrating from to at in direction. We find that in A122Edd1_LR, and in A122Edd1. So before the collision, both streams are optically thick, but with order-of-magnitude different vertical optical depth.
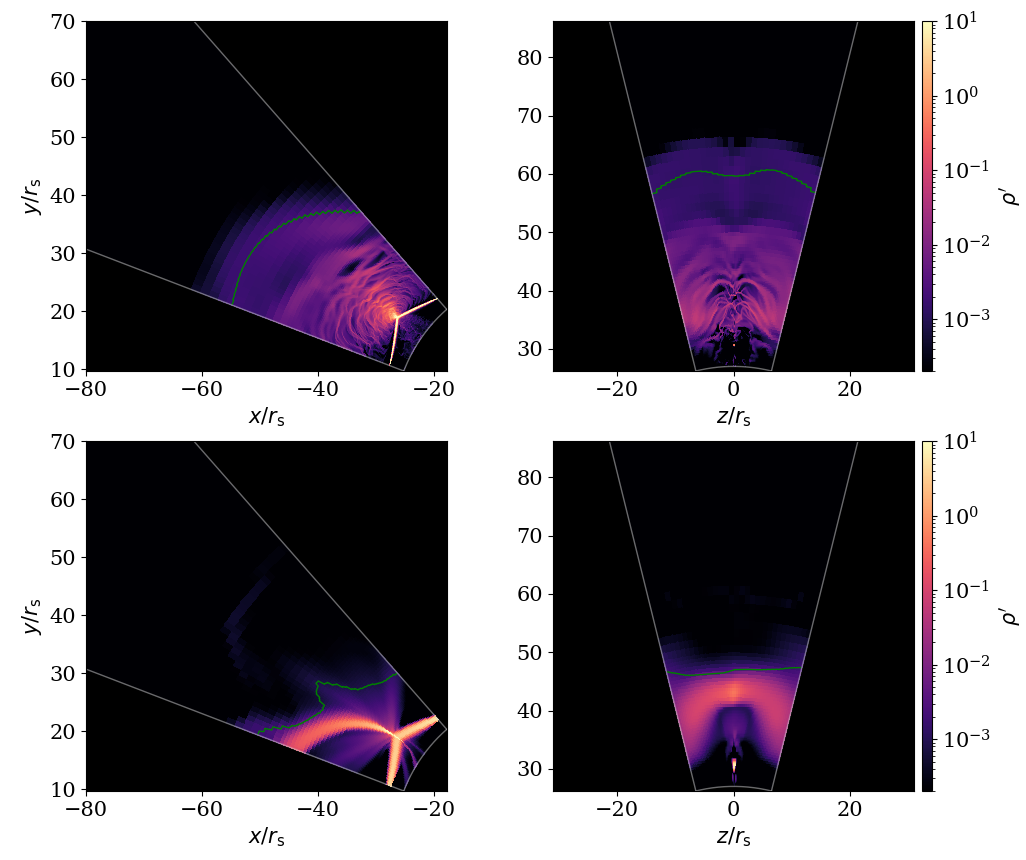
Figure 3 shows the distinct downstream gas distribution in A122Edd1_LR and A122Edd1. After the two streams collide, the gas in A122Edd1 forms an expanding outflow that propagates radially outward in the orbital plane. Off the orbital plane, gas moves away symmetrically with respect to -plane. The expanded downstream gas distribution suggests that the radiation pressure produced in the collision redistributes the gas. In contrast, post-shock gas in A122Edd1_LR is mainly concentrated in a merged stream that bends towards the black hole.
The different outflow morphology suggests different radiative acceleration near the shock in the two simulations. We find that the radiation energy density at stream-stream collision shock front in A122Edd1_LR is about two orders of magnitude lower than A122Edd1 (see Appendix B). This implies that less stream kinetic energy is converted to radiation energy locally by the collision, or more efficient cooling due to enhanced radiative diffusion resulting from the lower optical depth. These effects may be associated with the lower stream kinetic energy density and the less-resolved collision shock in A122Edd1_LR. Consequently, we find that the radiation pressure near the collision is lower in A122Edd1_LR , which is less likely to drive massive outflow.
The downstream gas optical depth is also different. We estimate the photosphere surface radius in the direction as the radius at which :
| (9) |
where is the outer boundary radius the direction. The green line in Figure 3 of each panel shows of these snapshots. At , average of A122Edd1 is generally larger than A122Edd1_LR. Hence, radiation diffusion takes longer and there is less cooling in the expanding outflow, the gas temperature at is higher in A122Edd1_LR.
The primary energy conversion in the simulation is between gas kinetic energy, gas gravitational potential and radiation energy. Tejeda & Rosswog (2013) defines the total conserved energy
| (10) |
In the rest of paper, we define “orbital energy” as , “kinetic energy” as non-relativistic kinetic energy, and “gravitational potential” as the difference between and kinetic energy.
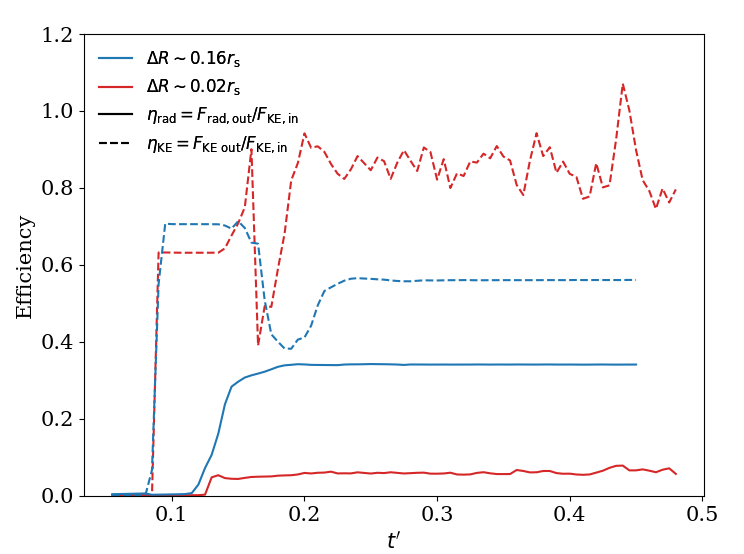
In the optically-thick outflow of A122Edd1, the radiation force continuously accelerates gas until photons diffuse out from photosphere, so some radiation energy produced in the collision will be converted back to gas kinetic energy. To quantify the energy conversion, we define the net radiative efficiency and kinetic energy efficiency as:
| (11) |
where , , are total injected kinetic energy flux, total outgoing kinetic energy flux and total outgoing radiation flux. The fluxes are integrated on all the surfaces of an enclosed volume.
Figure 4 shows the efficiencies as a function of time for A122Edd (red lines) and A122Edd_LR (blue lines). At , the streams collides, the radiation energy efficiency start to rise, followed by the kinetic energy efficiency drop. Later, as radiation forces accelerate gas and downstream gas gains kinetic energy, the kinetic energy efficiency rises again, eventually relaxing to the quasi-steady-state value. Compared to A122Edd1, more injected kinetic energy is converted to radiation in A122Edd1_LR. This is because the radiation produced in the collision diffuses through the more optically thin downstream gas without as much interaction with gas, yielding higher net radiative efficiency. Notice that the efficiencies are calculated from energy fluxes injecting and leaving the boundary surfaces of an enclosed volume within the calculation domain. Here we integrate over the surfaces of the simulation domain up to , equivalent to all the surfaces of the volume . We also calculated the efficiencies at the enclosed volume with outer radii of and did not find a significant difference.
When the resolution is insufficient, the reduced radiation production from the stream-stream collision may suppress the prompt luminosity, but the low optical depth in the post-shock gas may allow photons to diffuse out more easily, enhancing the prompt luminosity. Considering these competing factors, it is possible that in other sets of parameters, insufficient resolution might lead to underestimating luminosity if the effect of downstream gas optical depth is secondary.
3.2 Eddington mass flux: A122Edd1
Figure 5 and Figure 6 show the density snapshots from A122Edd1. After two streams collide, the downstream gas is accelerated by the radiation pressure, forming an optically-thick outflow that extends a few tens of . The post-shock gas forms multiple shells near the collision site. The shell morphology is similar to Jiang et al. (2016), which is related to the shock-front obliqueness changing due to slightly unbalanced pressure.
We find that the downstream gas is aspherical relative to the collision point and the black hole. Most gas stays within a cone of finite solid angle. For example, at , gas mainly stays in , where , are the altitude and azimuthal angle relative to the collision point. In the rest of paper, we use subscript to note the variables relative to the collision point. Our calculation domain only covers part of the sky seen from the black hole, and the gas roughly fills the angular space of seen from the black hole. This picture is qualitatively similar to the estimated outflow morphology in Lu & Bonnerot (2020).
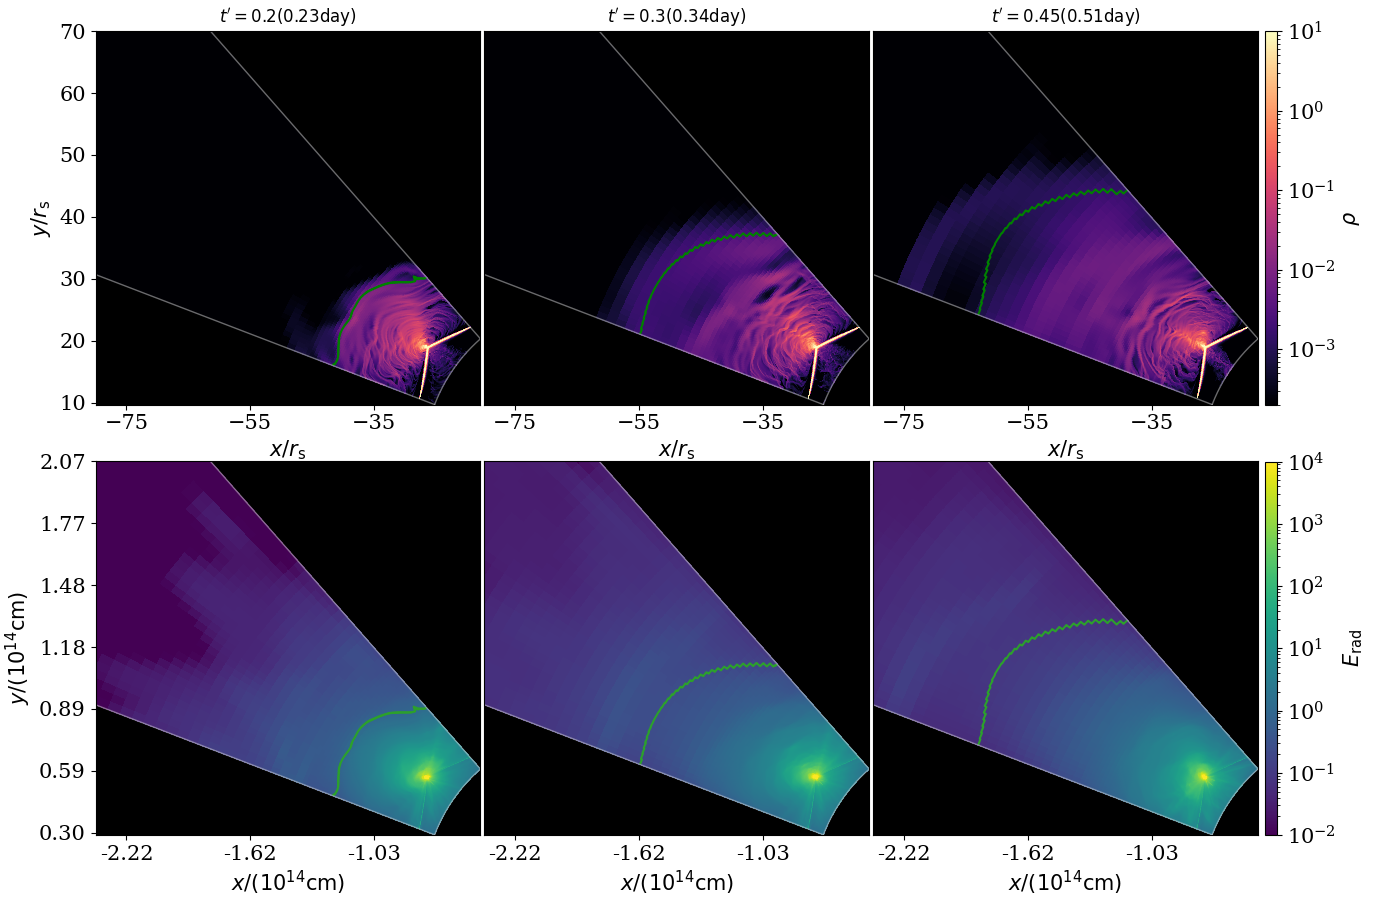
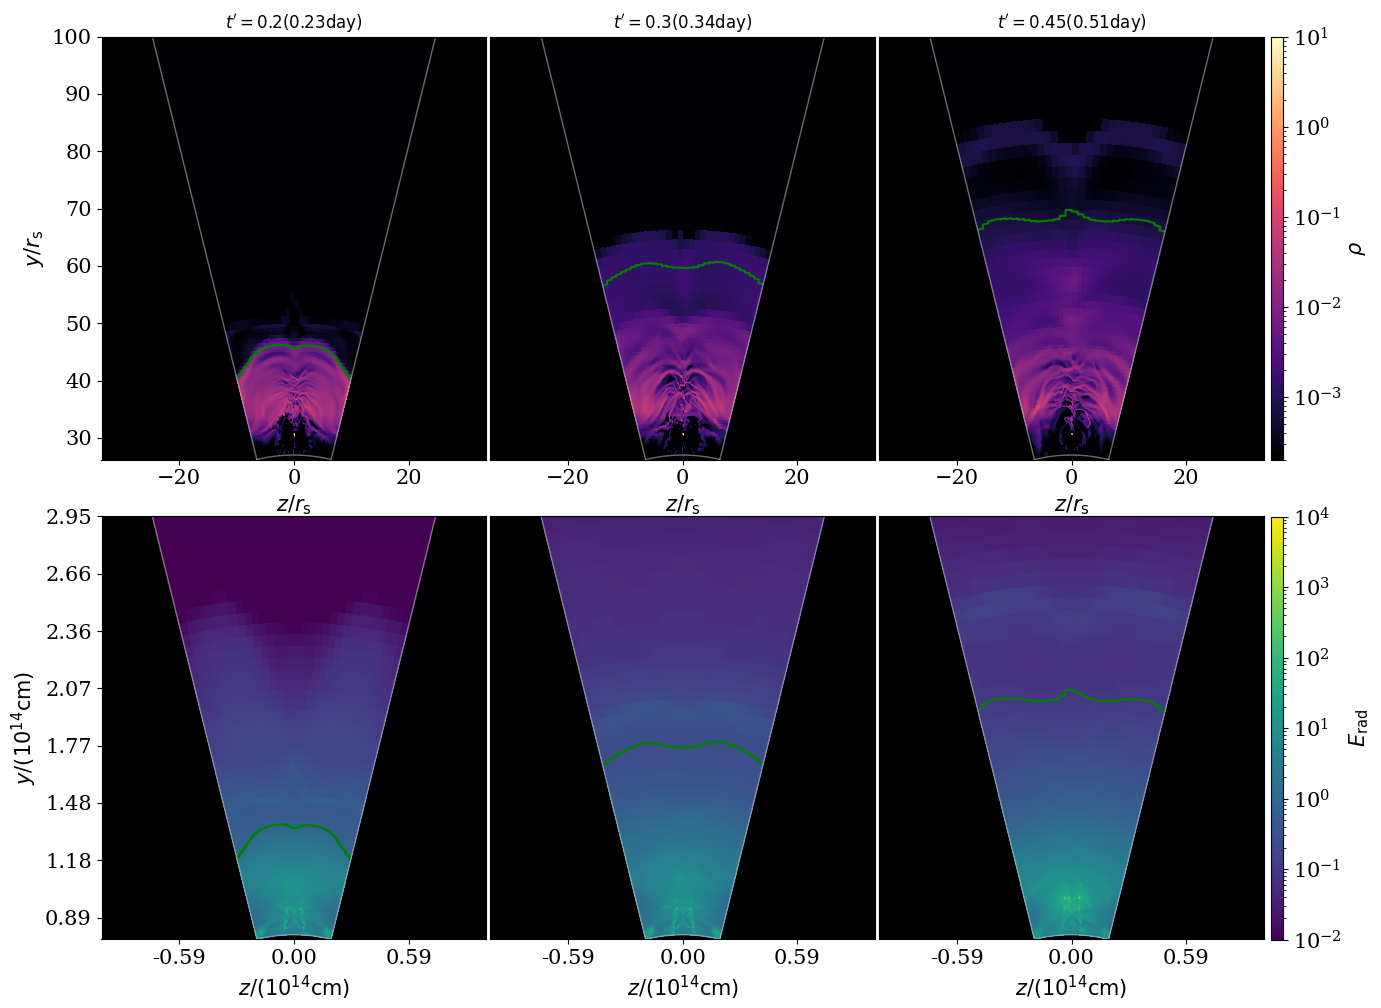
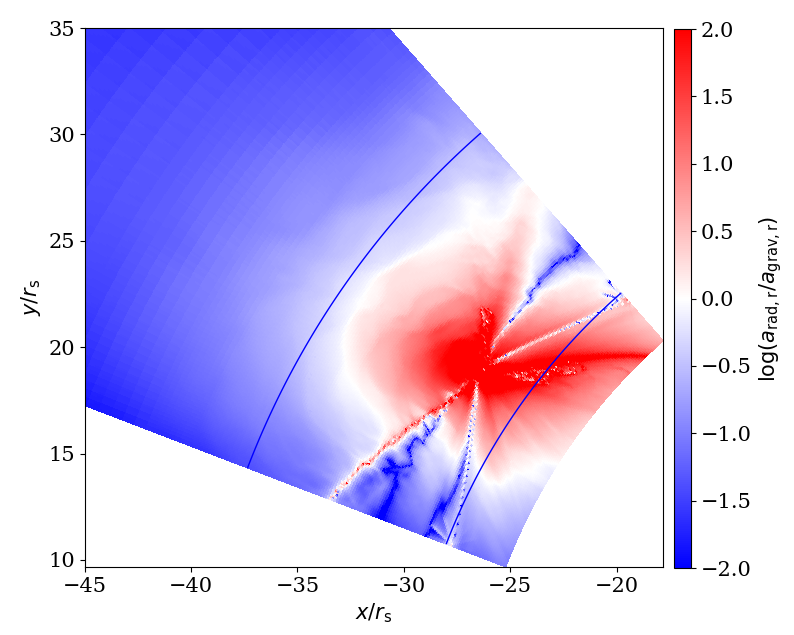
The bottom panels in Figure 5 and Figure 6 show that the collision as a bright point on radiation energy density map. The radiation energy density is enhanced by about four orders of magnitudes (also see Figure 22) at the collision, where gas experiences eruptive acceleration. Figure 7 shows the ratio between radiation acceleration and gravity in the direction. Even if the mass fallback rate is just Eddington, the strong radiation pressure produced in the collision creates a super-Eddington that region extends a few in the downstream gas.
As gas is accelerated by radiation pressure and propagates outward, it forms an optically-thick outflow. The green solid line in each density snapshot shows the photosphere radius (Equation 9). The average in the quasi steady state, and is relatively uniform in and direction. Along and direction line of sight, however, the simulation does not capture the equivalent photosphere surface. The gas is partially optically thick at the and boundary surfaces. We note that is defined relative to the origin, instead of the black hole. We also calculated the in lab frame, where is the radiation flux magnitude, and is the radiation energy density as another metric to measure the opaqueness. We compare the surface where with and find rough agreement. Therefore, the gas outflow in A122Edd1 is optically thick and could potentially correspond to a reprocessing layer for optical TDEs at early time.
As the radiation force does work on the downstream gas, part of the gas gains energy and becomes unbound. Similar to Jiang et al. (2014), we define unbound gas as with , where is analogue to Bernoulli number:
| (12) |
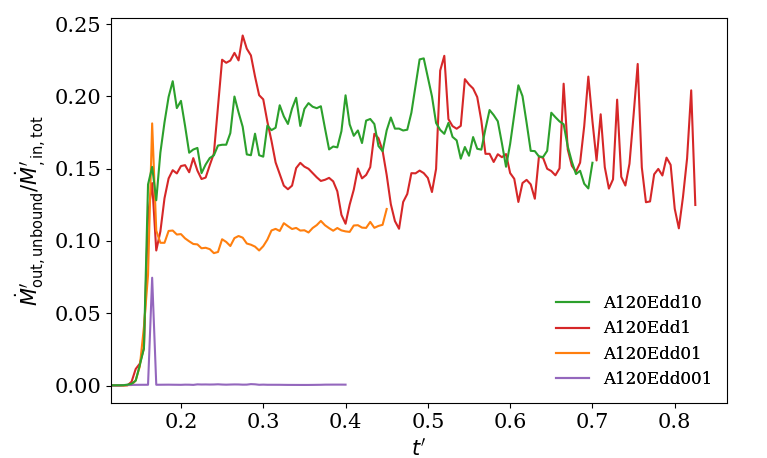
where is the total orbital energy defined in Equation 10. The second term is fluid enthalpy, and the third term assumes radiation acts as a fluid with adiabatic index of . Hence, when radiation diffusion is present, this enthalpy is not a conserved quantity. The red solid line in Figure 10 shows the total unbound mass flux, normalized to the total injected mass flux carried by the original stellar streams. As the collision happens near , the unbound mass flux quickly increases to , and eventually reaches quasi-steady state, suggesting that of injected mass flux becomes unbound when they leave the simulation domain. We found the unbound gas spatial distribution is anisotropic. Near the collision, the unbound gas has a mass-weighted average radial velocity of at quasi-steady state relative to the collision, and decreasing to away from the collision point outward. Therefore, the collision in A122Edd1 is able to create fast and relatively dens unbound gas. But we also note that this “unbound” criteria is sensitive to the stream initial condition. Unbound gas could also have orbits oriented towards the black hole. Since the initial stream is itself weakly bound, the delineation between bound and unbound gas after the collision will depend on the details of the global evolution.
3.3 Effect of Eddington ratio
To study the effect of mass fallback rate, we compare the simulations A122Edd001, A122Edd01 and A122Edd10 with the fiducial simulation A122Edd1. The range of Eddington ratio provides us with a sample of different TDE systems, as well as potential different time stamps before the peak, where the mass feeding rate may rise from sub-Eddington to super-Eddington.
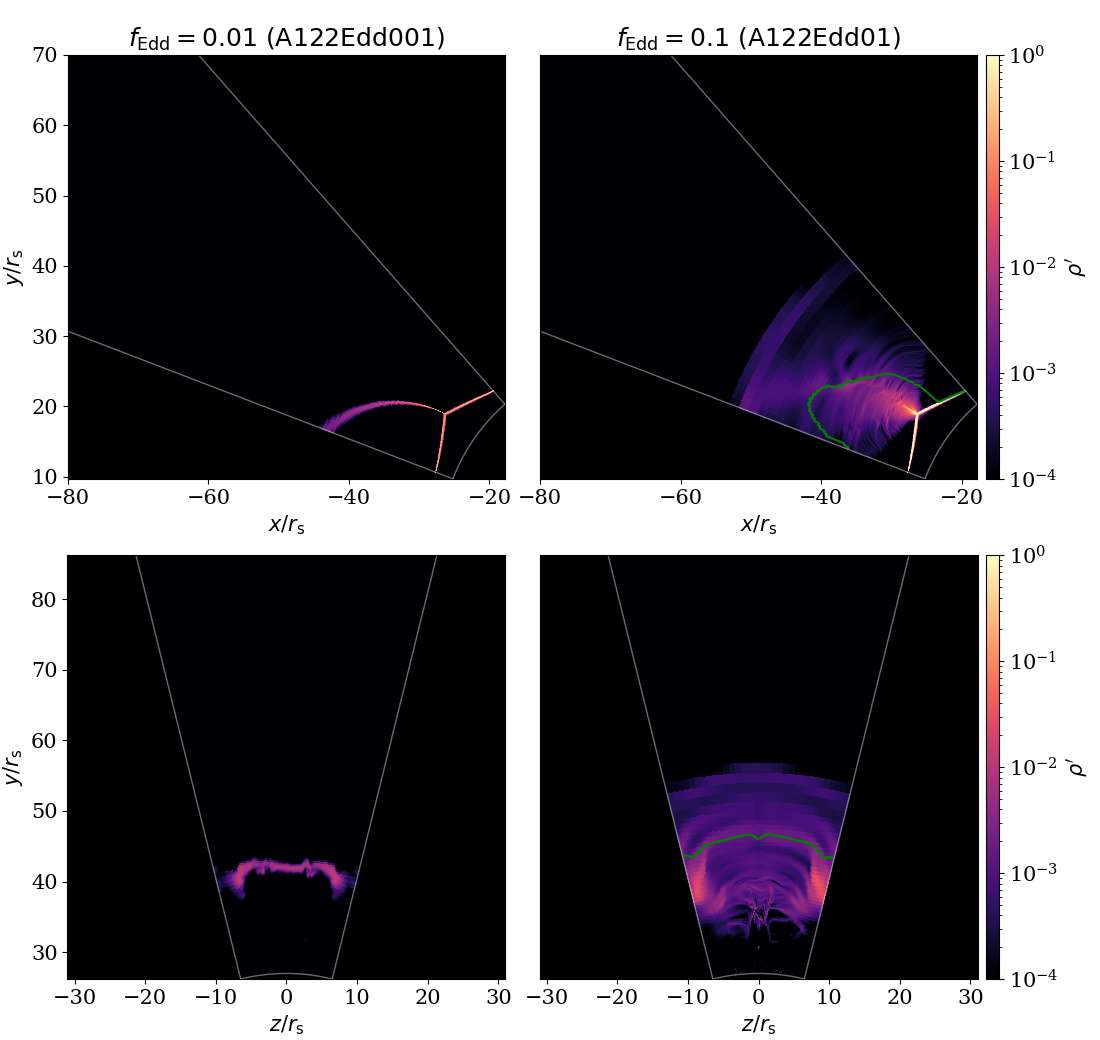
We find that the outcome of collision is sensitive to the fallback rate, especially for sub-Eddington rates. The super-Eddington simulation A122Edd10 shows qualitatively similar outflow as A122Edd1. In contrast, when we lower the mass fallback ratio to and Eddington, the downstream gas distribution is changed significantly. Figure 8 shows gas density distribution from the two lower Eddington ratio simulations. In A122Edd001, the downstream gas is mainly confined in a thin stream and does not form an expanded outflow. In A122Edd01, the stream-stream collision redistributes gas to form an outflow, but this outflow has lower density when compare to the A122Edd1, and is also slightly bent towards the black hole.
In the simulations with different mass fallback rates, we assume the stream specific kinetic energy is the same. So lower mass fallback rate yields less available kinetic energy before collision. We find that compared to A122Edd1, the maximum radiation energy density at the shockfront is in A122Edd001, in A122Edd01, and in A122Edd10, measured at . Due to lower radiation pressure in sub-Eddington runs, they are less likely to drive massive outflows.
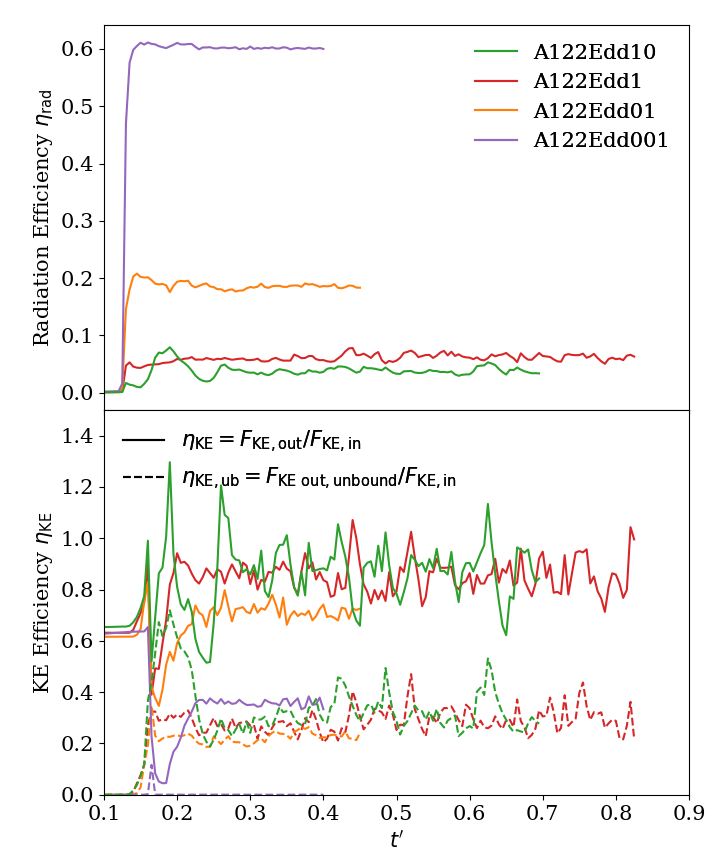
Figure 9 shows the radiative efficiency and kinetic energy efficiency . It shows the trend that higher Eddington ratio leads to lower radiative efficiency. We attribute the anti-correlation to energy exchange between radiation and kinetic energy in downstream gas. To first order, the radiative efficiency is affected by both the shock dissipation during the collision and the energy lost accelerating the post-shock gas.
When the downstream outflow is optically thick, before photons diffuse out, the radiation force accelerates gas and converts radiation energy to kinetic energy, yielding lower net radiative efficiency. We assess this by estimating the ratio of radiation diffusion time to the advection time in the downstream gas. We select outflowing gas as described in Section 4.3. Then we calculate the average optical depth and radial velocity measured relative to the collision point to estimate and respectively. We list the estimated in Table 2 together with the radiative efficiency. The sub-Eddington run A122Edd001 shows significantly shorter diffusion time than advection time, and increases as mass fallback rate becomes larger. The ratio of A122Edd1 and A122Edd10 are well above unity, suggesting photon diffusion is slow in these two runs. Interestingly, A122Edd1 and A122Edd10 show similar radiative efficiency despite the order of magnitude different fallback rate, which may suggest that there is a minimum radiative efficiency for a fixed stream orbit.
| 1.0 | 10.0 | |||
|---|---|---|---|---|
The kinetic energy efficiency is shown in Figure 9, including total kinetic energy (the solid lines) and the unbound kinetic energy (the dashed lines). Consistent with the lower radiative efficiency, the higher mass fallback rate usually leads to higher kinetic energy efficiency. The unbound fraction seems to follow similar trend. The transient peak near correspond to the time that the returning stream first encounters the fallback stream and breaks the fallback stream. Part of the broken stream left the domain as marginally-unbound gas, we note that this initial transient may be sensitive to details of domain set-up, and thus mainly focus on the quasi-steady-state energy conversion.
In Figure 10, we show the ratio between unbound mass flux and the total injected mass flux. A122Edd001 does not produce significant unbound mass, while A122Edd01 shows that injected mass flux becomes unbound, A122Edd1 and A122Edd10 shows unbound fluxes. We also find that the average velocity of unbound gas are factor of a few similar in A122Edd01, A122Edd1 and A122Edd10. The results are generally consistent with the unbound fraction found in Jiang et al. (2016) with comparable Eddington ratio.
3.4 Effect of collision angle
In A90Edd1, we adjust the orbital parameter of the returning stream to have collision angle , while keeping the collision radius similar to A122Edd1 (, Table 1). Figure 11 shows the gas density snapshots from A90Edd1 after it has reached a quasi-steady-state. The majority of downstream gas forms a stream-structure that expands in direction perpendicular to the orbital plane. We find that the stream-structure is bounded and falls towards the black hole.
The collision creates unbound gas away from the orbital plane. They are spatially divided into two groups. The first group of unbound gas stays in the inner side of the merged stream, with velocity oriented towards the black hole and leaving the calculation domain from the outer boundary. These unbound gas is relatively diffuse, with enhanced velocity due to the decreasing gravitational potential when approaching black hole. The second group of unbound gas is ejected from the outer side of the merged stream moving outward radially, with higher density than the first group. We find that the total unbound mass flux is of total injected mass flux, with in the direction contributed by the second of unbound gas, and in the direction contributed by the first group of diffusing gas.
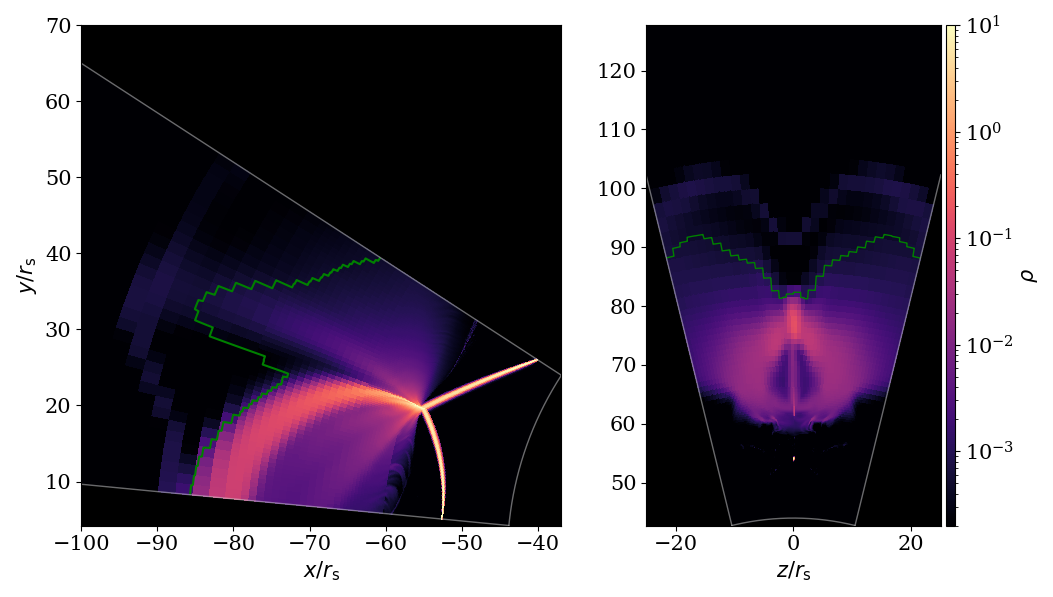
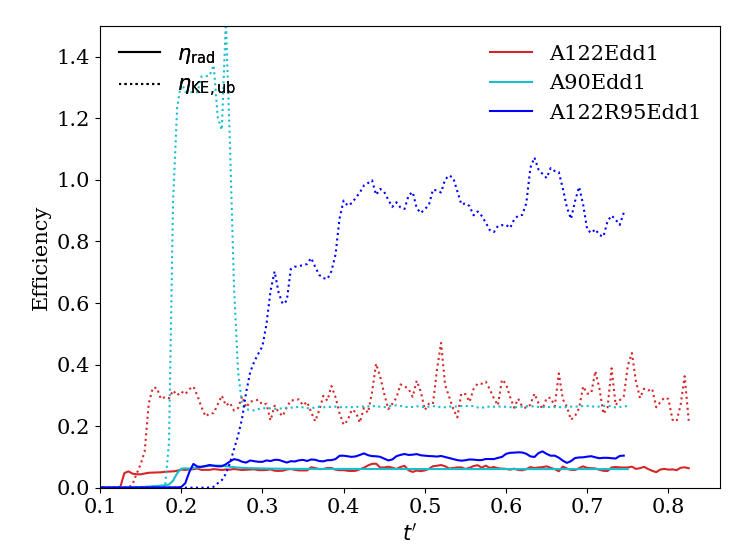
Figure 12 compares the unbound kinetic energy efficiency and the radiative efficiency in A90Edd1 with A122Edd1. Despite the similar total unbound kinetic energy efficiency, the contribution from , and boundaries are significantly different, suggesting different downstream gas morphology. We find that the of the unbound kinetic energy flux is from the direction, carried by the second group of massive, fast unbound gas. The rest unbound kinetic energy flux is from the first group of diffuse unbound gas with lower velocity. The boundary contributions are negligible. The uneven distribution is in contrast with the relatively equal amount of unbound kinetic energy flux in the , and boundaries in A122Edd1.
The radiative efficiency is also similar to A122Edd1. However, this does not imply a similar radiation energy production by the collision. We find that the maximum radiation energy at the collision shock front in A90Edd1 is about 5 times lower than A122Edd1. However, the downstream gas is more optically thin in A90Edd1. The green solid lines in Figure 11 show the photon at quasi-steady state. Compared to the extended optically thick region in A122Edd1, photons can diffuse out of downstream gas in A90Edd1 more easily.
Interestingly, the comparison between A90Edd1 and A122Edd1 shows that results deviate from a ballistic collision model. If the collision is inelastic and the collision angle is , assuming a symmetric collision velocity vector on both side of the shock, the dissipated energy will roughly be (Dai et al., 2015), where only the velocity in the net-momentum direction is preserved. However, A90Edd1 and A122Edd1 show a similar radiative efficiency that does not scale as , suggesting that the net luminosity does not solely depend on the collision angle, but also the optical depth of downstream gas.
3.5 Effect of collision radius
In A122R95Edd1, we adjust the returning stream to make the collision radius to be , while keep the collision angle close to A122Edd1 (Table 1). The modified returning stream is on a slightly unbound orbit, with relative to the black hole before collision. The fallback stream is on the same orbit as A122Edd1, which is slightly bounded with before collision. These velocities are only about half of the velocity in A122Edd1 before collision. The set-up is designed to compare with A122Edd1 to study the effect of collision radius, the realistic stream orbit collides near this radius will likely to show smaller collision angle for a spin-less black hole (Dai et al., 2015; Bonnerot et al., 2021).
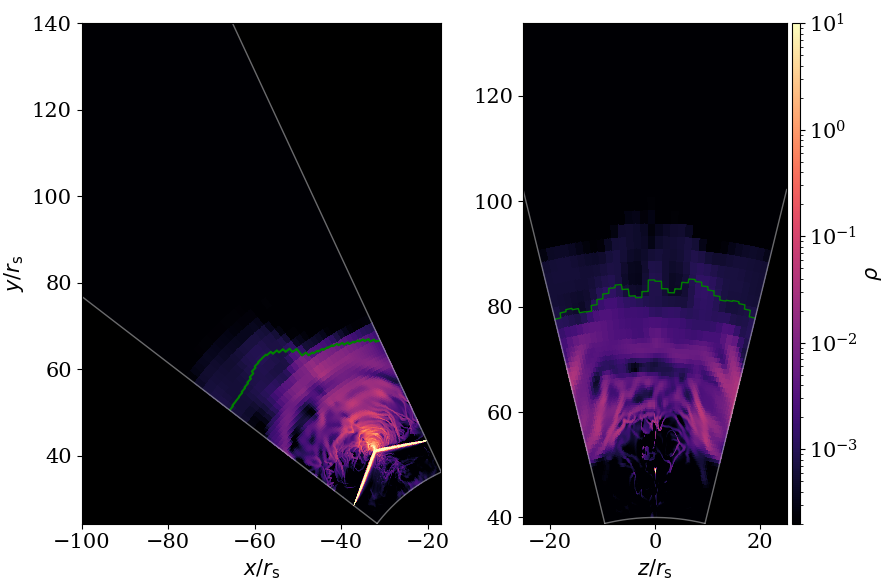
Figure 13 shows the gas density snapshot at , which is at a comparable time after collision as A122Edd1 in Figure 5. The outflow morphology is similar to A122Edd1, but the gas flow is slower and propagates to smaller radius relative to the collision point. The gas is also less bent towards the black hole due to the weaker gravity.
When moving the collision radius outward, the available kinetic energy before collision will be reduced, in our case, the speed of both streams are roughly reduced by half. So the radiation energy density at the shock will potentially be lower, suppressing the immediate acceleration of gas near the collision. However, the effect of gravity is also weaker compare to A122Edd1, so the deceleration of downstream gas is reduced. These competing effects shape the collision and post-shock gas evolution.
Figure 12 shows that the radiative efficiency of A122R95Edd1 is only slightly higher than A122Edd1. We find that the gas compression rate at the shock (i.e. the ratio between stream density before and at the shock) is similar in the two simulations. The local radiation energy density in A122R95Edd1 is about five times lower, roughly consistent with the two times lower gas velocity at both sides of the shock.
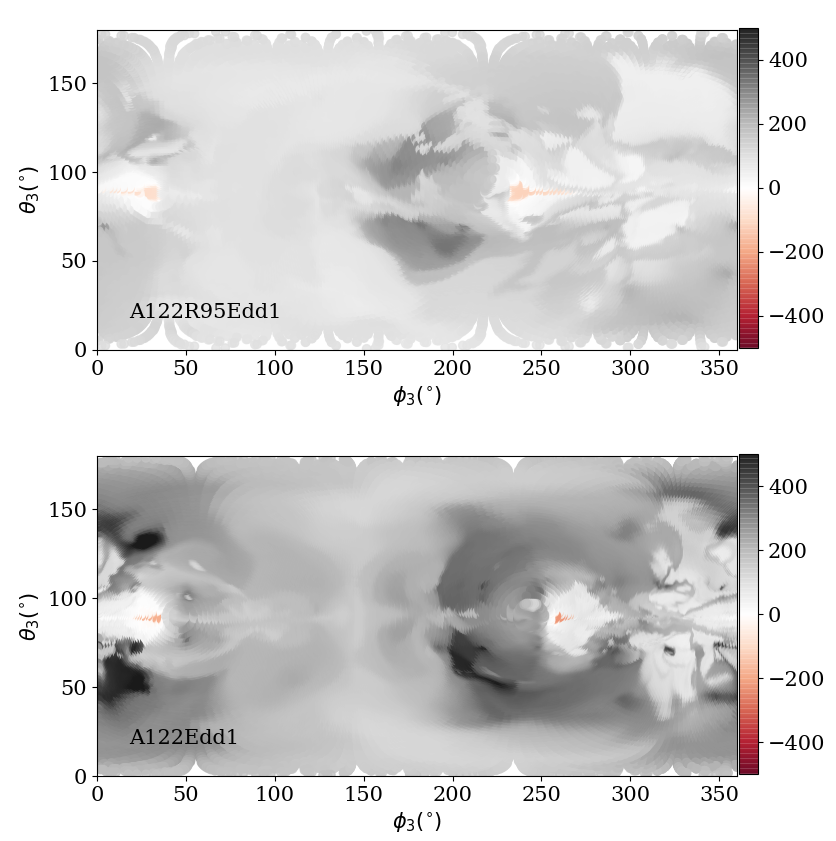
However, the unbound kinetic energy and mass flux are significantly higher than A122Edd1. We find that the unbound and injected mass flux ratio is close to 1.0 at the quasi-steady state, suggesting more massive but slower unbound outflow. Figure 14 shows the angular distribution of radial velocity relative to the collision point . The outward velocities in A122R95Edd1 is generally smaller than A122Edd1. We note that our definition of unbound gas is sensitive to the initial stream orbital energy. Some unbound gas could move towards the black hole and potentially interact with other gas near pericenter before escaping from the system. So the high fraction of unbound downstream gas in A122R95Edd1 should not be directly interpreted as large expanding photosphere. We will discuss the implied photosphere evolution in Section 4.
4 Discussion: Stream-stream collision’s role in pre-peak time
4.1 Prompt emission and contribution to luminosity
The rise-to-peak light curve for optical TDEs seems to be more related to radiative diffusion timescale than the fallback timescale (Metzger & Stone, 2016; Van Velzen et al., 2021). Our simulation results roughly agree with this picture that the radiative efficiency varies with mass fallback rate. A higher fallback rate tends to produce a more optically thick outflow, which can reduce the net luminosity by reducing the diffusion rate out of the photosphere. Hence, the luminosity is not strictly proportional to the mass fallback rates.
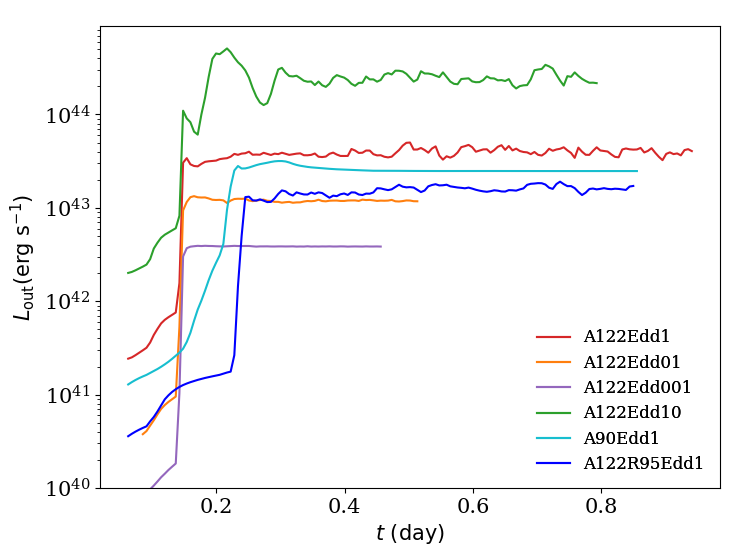
Figure 15 shows the luminosities measured from the simulations. We measure the total luminosity by integrating the radiation flux on the boundary of the simulation domain , with the exception that we truncate the measurement to surfaces interior to , rather than integrating out to the outer radial boundary. We find that the measured luminosity is not sensitive to the choice of this enclosed radius as long as . The measured luminosity includes both the diffusive and advective radiation fluxes on the and boundaries. We expect that the radiation advected through these boundaries will eventually be radiated from the photosphere, which we do not capture within the simulation domain in these directions. Hence, the timescale for this radiation to escape will be longer than estimated here, potentially leading to a lower peak luminosity but longer duration. Due to our relatively short simulation duration and the assumption of fixed mass fallback rates, our simulations can be thought of as modelling specific stages of the rising light curve. Capturing the full pre-peak luminosity rise requires consideration of time-dependent mass fallback rate in a global calculation domain that fully captures the photosphere.
Figure 15 shows that prior to the collision, the debris streams are the primary sources of luminosity. As stream-stream collision happens, all the simulations produce a prompt luminosity of , making it an important pre-peak emission source. For the A122 runs, around , the stream-stream collision enhances the luminosity by about two to three orders of magnitude. The two simulations with different orbital parameters A90Edd1 and A122R95Edd1 produce similar order-of-magnitude emission as A122Edd1.
Although we find significant prompt emission, we infer that a one-time collision might not be sufficient to produce peak optical luminosity. This is the case even though we have adopted a favorable set-up for generating luminosity by the collision. We assume no vertical offset between the two streams, which may reduce prompt luminosity (Jiang et al., 2016), and we also scale the mass fallback rate to the Eddington rate for a black hole. As we discuss below, we also assume the returning stream is the same width as the fallback stream, and has not spread during pericenter passage. Nevertheless, it still requires a substantially super-Eddington fallback rate to produce luminosity , corresponding to some observed TDE peak optical luminosity (Mockler et al., 2019; Van Velzen et al., 2021; Gezari, 2021). For a less massive or spinning black hole, the results suggest that a highly super-Eddington fallback rate might be required to explain the peak optical luminosity by a single collision event.
Instead, it is possible that multiple collisions or collision-like events from early-circularizing gas might be able to provide accumulative emission that is consistent with the rise-to-peak optical light curve. Another possibility is that the TDE may be interacting with a preexisting lower luminosity accretion flow (Chan et al., 2021). The range of mass fallback rates we show in Section 3.3 may also represent different stages of an increasing mass fallback rate. Adding up the quasi-steady state luminosity for different may yield increasing luminosity in the pre-peak time. In addition, when the fallback rate grows from sub-Eddington to super-Eddington, the downstream gas may change from optically-thin to optically-thick, potentially leading to spectral or luminosity variation. For a spinning black hole, the collision can be significantly delayed (Guillochon & Ramirez-Ruiz, 2015; Hayasaki et al., 2016), so the mass fallback rate may already settle to a relatively constant value when the first encounter happens. We leave the further discussion of time-dependent mass fallback rate to future studies.
4.2 Photosphere evolution and reprocessing layer
For all the simulations we present (except for A122Edd001), the stream-stream collision can create an optically-thick outflow. The location of the corresponding photosphere and its evolution will depend on the line of sight. We use the photosphere radius (Equation 9) to estimate the scattering photosphere along the radial lines-of-sight towards collision region.
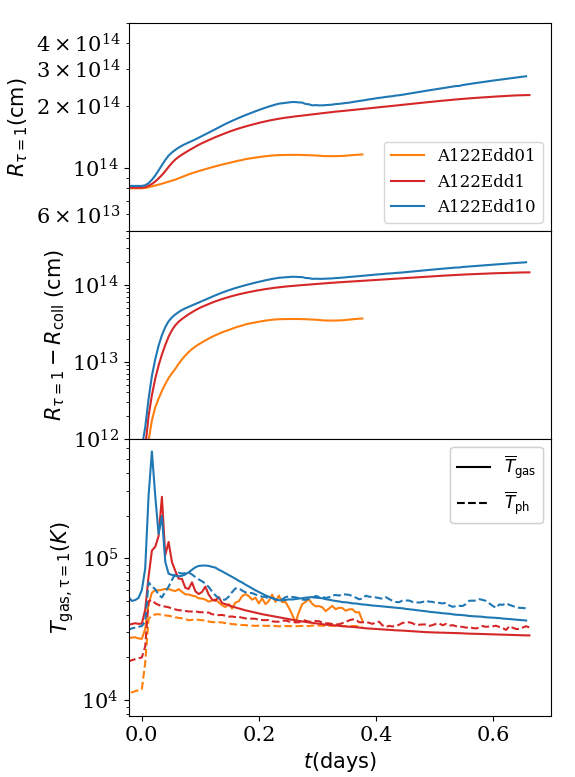
Figure 16 shows the average for A122Edd01, A122Edd1, and A122Edd10. The collision is able to enhance the average by one to two orders of magnitude, reaching the quasi-steady state size of . The super-Eddington run A122Edd10 shows a transition near days, where we observe that the distribution of changes from single-peak to bi-modal, and then becomes single-peak again. This corresponds to a transient dynamical stage that a leading shell of gas becomes optically-thin as it expands, and the distribution starts to be dominated by other later-accelerated gas. The sub-Eddington run A122Edd01 has a smaller and also a slower growth rate, consistent with lower radiation pressure acceleration. In the middle row of Figure 16, we also plot the difference between and the collision radius to better show the photospheric expansion.
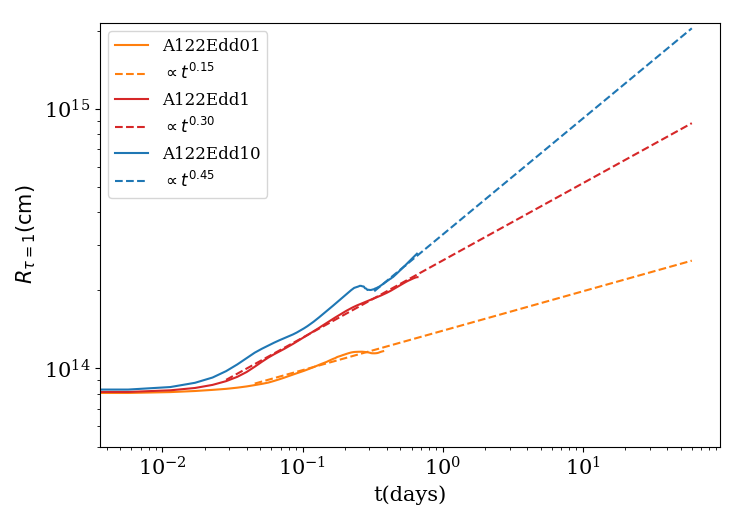
The growth roughly follows power-law for the A122 simulations. In Figure 17, we show the extrapolation of the evolution up to days. However, we also note that the extrapolation should not be interpreted as predicted photosphere evolution. We will show later that, the weaker acceleration runs such as A122Edd01, A90Edd1 and A122R95Edd1 indicate that the power-law usually can describe the expansion stage, but the growth will flatten as the outflow decelerates. Properly constraining the long term gas dynamics and the inferred photosphere evolution requires global simulations.
The solid lines in the lower panel of Figure 16 show the average gas temperature measured at surface. Shortly after the collision, the hot post-shock gas shows an average temperature K. As the outflow expands and cools, the average gas temperature asymptotes to a few K, consistent with commonly inferred blackbody temperature in optical/UV TDEs (Gezari, 2021).
We also define a photosphere temperature based on and the total luminosity we measured in simulations (Figure 15) by:
| (13) |
We plot in Figure 16 as the dashed lines. They agree with average gas temperature well at late time when the photosphere becomes more isotropic, but deviate from at early time because of the anisotropy of photosphere.
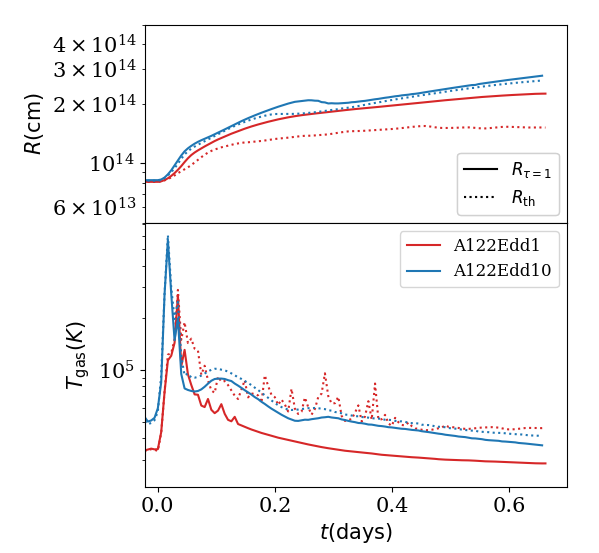
We also estimated a thermalization radius , which roughly characterizes the surface exterior to which a typical photon can be emitted and leave the domain without be absorbed (Rybicki & Lightman, 1986). Here we adopt a definition similar to , but replace by (assuming ) in Equation 9. We found that the average is generally smaller than . For example, Figure 18 compares average and in A122Edd1 and A122Edd10, where both quantities are relatively uniform. In both cases, is slightly larger than . The downstream gas in A122Edd10 is more optically thick than A122Edd1, and the two radii track each other more closely and the average gas temperature shows less difference. In A122Edd001 and A122Edd01, the location of is highly anisotropic about the collision point due to the downstream gas flow being more optically thin. Nevertheless, the results are qualitatively consistent with the higher fallback rate runs in that its location is interior to the photosphere and the temperature are larger than those at the photosphere.
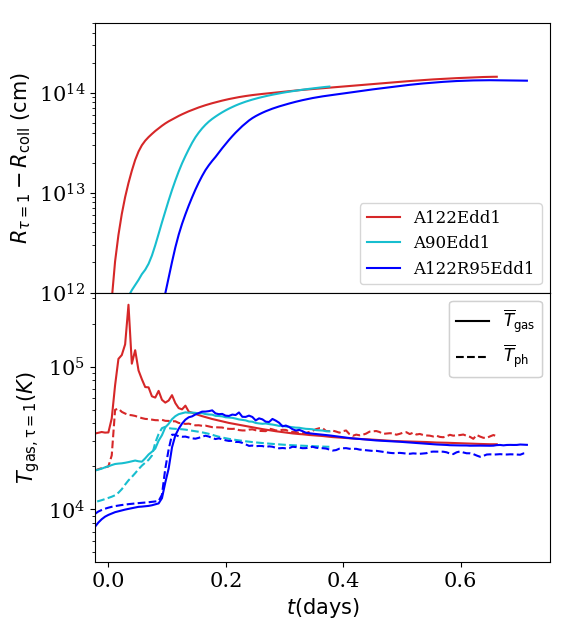
Figure 19 shows for the two runs with modified orbits. The general evolution is similar to the A122Edd1. In A122R95Edd1, evolution of flattens more towards the end of simulation when compare to A122Edd1. But the the estimated photospheric temperature is usually lower than in quasi-steady state. We find that the average gas temperature at is relatively uniform, the discrepancy is more relevant to the inhomogeneous shape of photosphere. For A122Edd1 and A122Edd10, the angular distribution of and is relatively uniform. In contrast, the angular distribution of show larger dispersion in A122Edd001, A122Edd01 and A90Edd1, suggesting that the photosphere is more ellipsoidal than spherical. For example, A122Edd1 has average photosphere radius with dispersion at , but A90Edd1 has with dispersion at . Using the spherical assumption can overestimate the surface area and underestimate , but it normally does not lead to an order-of-magnitude difference.
4.3 Comparison to Previous Studies
Angular Momentum of Downstream Gas: In our simulations, the strong radiation pressure produced in the stream-stream collision sufficiently redistributes downstream gas angular momentum. Lu & Bonnerot (2020) show that the collision is able to cause a significant spread in downstream gas angular momentum with respect to the original stellar orbital plane, enabling the formation of an extended accretion disk. Our findings also agree with this picture. Following Tejeda & Rosswog (2013), we define total angular momentum as , and orbital-plane angular momentum as , where the velocities and radius corresponds to the black hole.
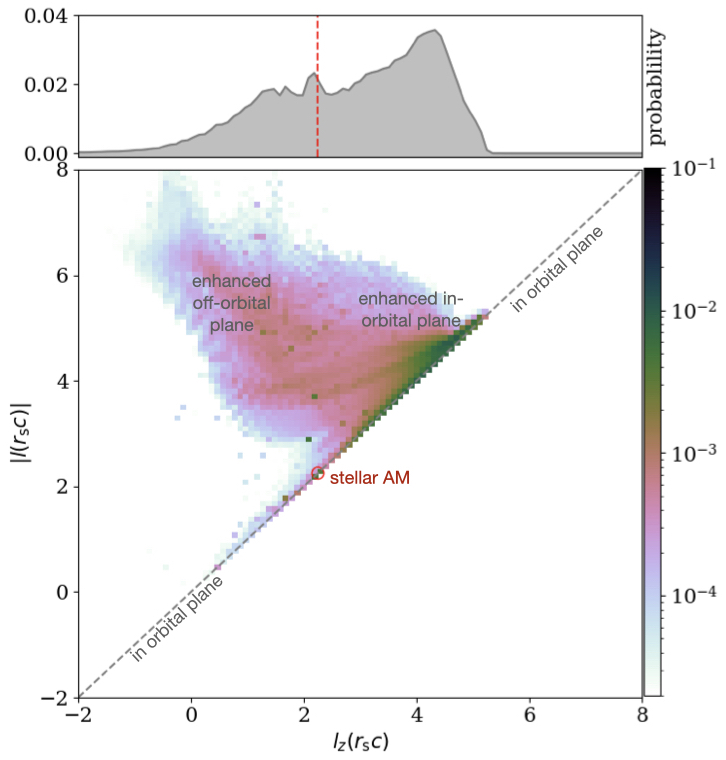
Figure 20 shows the distribution of outflow angular momentum, where we select gas moving away from the collision point. The first row shows that orbital-plane angular momentum is significantly spread by the collision. Compared to Lu & Bonnerot (2020), we find the distribution is more asymmetric relative to the initial stellar angular momentum and the retrograde fraction (negative ) is lower, potentially due to stronger radiative acceleration in the radial direction.
The second row of Figure 20 shows the distribution of and . The gray dashed line labels the orbital plane, where . In the orbital plane, a noticeable fraction of gas gains angular momentum. Off the orbital plane, some gas shows low but enhanced , we also find this gas is usually unbound, corresponding to the unbound outflow propagating away from the orbital plane. A122Edd10 shows a similar distribution, with a slightly stronger off-orbital plane outflow. Other simulations also show a significant spread in the specific angular momentum distribution, but the relative distribution of and is sensitive to the outflow morphology. For example, A90Edd1 and A122R95Edd1 both show weaker off-orbital plane outflow, so a tighter distribution in .
Previous studies had proposed a quasi-spherical envelope or wind from the early-circularizing gas to explain the reprocessed optical emission (Ulmer, 1999; Roth et al., 2016; Metzger, 2022). The off-orbital plane outflow with enhanced angular momentum we observed in A122Edd1 and A122Edd10 may contribute to the formation of such pressure-supported envelope at early times, but the long-term evolution of these outflow gas should be tracked in an extended calculation domain to confirm.
Outflow morphology: Some previous models for optical emission include a quasi-spherical wind near the disk. An important difference of the outflow observed in our simulations is its inhomogeneous, asymmetric morphology. Compared to Jiang et al. (2016), the inclusion of gravity changes the outflow morphology at larger radius, especially when the collision angle is small, such as in A90Edd1. Lu & Bonnerot (2020) tracks the streamlines of collision induced outflow elements, and estimates that the outflow gas distributes roughly within a cone-geometry. We also find that the outflow produced in A122Edd1, A122Edd10 and A122R95Edd1 is roughly within a cone centered on the collision point, but generally less oriented towards the black hole, potentially due to the redistribution by radiation pressure.
A commonly used assumption of the outflow/wind is quasi-spherical morphology with relatively constant radial velocity and density profile (Strubbe & Quataert, 2009; Jiang et al., 2016; Bonnerot et al., 2021). For example, assume a spherical outflow the with density . Within the photon-trapping radius, the outflow expands nearly adiabatically, the radiation energy density (Strubbe & Quataert, 2009), so the luminosity at a radius roughly follows .
In A122Edd1, A122Edd10 and A122R95Edd1, we find that only within a cone of with distance of relative to the collision point, the average radial velocity is roughly constant () and the density distribution roughly follows . For example, at , A122Edd1 show an average density profile , where is the distance to collision point. We also find that within the cone, the radiation energy density profile , which is a slightly steeper drop than , potentially due to the diffusive radiation flux. Outside the cone, the velocity distribution is anisotropic, especially near the streams. For example, the lower panel of Figure 14 shows the radial velocity distribution of A122Edd1 on a sphere that is from the collision point. The velocity distribution within , is relatively uniform, but it is anisotropic in other regions. In other simulations, the outflow morphology is even more anisotropic.
Such asymmetric outflow morphology may affect the radiative efficiency too. Compared to a purely adiabatic spherical outflow, radiation may preferentially diffuse out from the optically thin regions near the collision point during expansion. For simplicity, we can assume all the stream kinetic energy is deposited as luminosity immediately at collision within a spherical region of , where is the width of the stream. Assuming no diffusion and adopting the dependence derived above, radiative efficiency can be roughly estimated as the ratio between and the luminosity escaping at , so .
The radiative efficiency we found is usually higher than this estimation, consistent with enhanced radiative losses due to photon diffusion. Similar to the total luminosity (Figure 15), we can estimate the “advective” part by replacing by , where is gas velocity. So the difference between total luminosity and the advection part provides an estimate of the diffusive part. We find the advective fraction increases as increases, consistent with previous speculation. But we also find even for higher mass flux runs, there is a non-negligible diffusive fraction. For example, for A122Edd1, the advection fraction is from the optically thick region near to the collision point, and drops to as gas moves outward. The total radiation flux from the direction boundaries has two to three times lower advection fraction than the other boundaries. These findings suggest the expansion of the outflow is not strictly adiabatic due to the photon diffusion within the anisotropic outflow.
Returning Stream Width: We assume the returning stream has the same width as the fallback stream in the simulations. Previous studies of TDEs with low mass ratios (Ramirez-Ruiz & Rosswog, 2009; Rosswog et al., 2009; Shiokawa et al., 2015) or deep penetration encounters (Sadowski et al., 2016) suggest thickened streams due to the strong nozzle shock near pericenter. Recent studies of TDEs by more massive black hole can also show significantly expansion in the returning stream, potentially changing the collision initial condition and outcome (Liptai et al., 2019; Curd, 2021; Andalman et al., 2022; Steinberg & Stone, 2022).
Bonnerot & Stone (2021) compares the potential outcomes of stream-stream collision with different returning stream widths. They suggest that a thickened returning stream with reduced density could sweep through the thin stream without significant deflection, suppressing the radiation pressure produced during stream-crossing, making it less likely to drive strong outflow. Steinberg & Stone (2022) adopt a equation of state including hydrogen recombination and suggests the recombination heating near pericenter can significantly expand the stream and potentially enhance the nozzle shock dissipation. Coughlin (2023) also suggest that the steam density can be lowered by the recombination processes near pericenter. Bonnerot & Lu (2022) performed high resolution study of the vertical compression of the stream and energy dissipation due to the nozzle shock. They, however, suggest that the stream is likely to stay relatively thin after the pericenter, and that the dissipation is sensitive to compression. The stream could be compressed to of the stellar radius in vertical direction and in the orbital plane. Such large compression rate requires sufficient resolution to minimize numerical dissipation and capture the stream expansion accurately after pericenter. We also note that our assumption of the same stream width at in-plane and vertical direction is idealized. Recent works (Bonnerot et al., 2022; Coughlin, 2023) suggest that the stream geometry is set by the interplay between tidal force, pressure support and self-gravity. The relative importance of these forces is likely sensitive to gas density. As the gas orbits around the black hole, the stream cross-section can deviate significantly from circular.
In the global test calculations with static mesh refinement (similar set-up to Figure 21, not presented in this paper), we find qualitative consistent results. Without radiation, the hydro dynamical simulations do not show convergence to the returning stream width at our highest test resolution (). We find generally less spreading of the stream after pericenter as we increase the resolution. Interestingly, when we include radiation, the RHD test simulations (similar to Figure 21, with same or lower resolution (), not presented in this paper), we find the stream stays almost the same width after the pericenter regardless of resolution, but this may be due to insufficient resolution in the test calculations, leading to an overestimation of radiative cooling. When the thinnest part of the stream at the pericenter is only resolved by a few cells, the radiative cooling can be overestimated, reducing internal energy dissipated in the nozzle shock. Resolving the stream near the pericenter is essential to understanding the role of stream-stream collision as pre-peak emission mechanisms of TDEs. We plan to explore the collision between streams with different widths in the future work.
5 Conclusions
We study the stream-stream collision in TDEs through a series of three-dimensional RHD simulations. We adopt a stream orbit based on a black hole and a solar type star, with the penetration factor of . We compare the effect of different mass fall back rate (), the collision angle (), and collision radius (). We study the radiation pressure driven outflow and potential optical emission from the stream-stream collision. We summarize our findings as follows:
(1) Dependency on Resolution: We find that RHD simulations of stream-stream collisions are very sensitive to resolution. Insufficient resolution may artificially thicken the stream, reducing the stream vertical optical depth and the kinetic energy density before collision. These effects suppress radiation energy generation at the collision, leading to a qualitatively inaccurate picture of downstream gas distribution (Figure 3). The under-resolved simulations might also underestimate the outflow optical-depth, allowing radiation to escape before it can interact sufficiently with gas. In our calculations, we use spatial resolution of (or ). We find that minimum angular bins for radiation is required in order to reach convergence in the properties of the post collision flow.
(2) radiative efficiency and Luminosity: With the assumption of thin streams without vertical off-set, the stream-stream collision can convert of kinetic energy to radiation, producing a luminosity of . The radiative efficiency is affected by both the energy conversion at the collision and the interaction between radiation and downstream gas.
When the stream collision angle and radius is fixed, the radiative efficiency is sensitive to the mass fallback rates (Figure 9) and could range from . The higher fallback rates usually show lower radiative efficiency. The radiation pressures produced in the collision are usually higher, but drive optically-thick outflows. In these outflows, radiation accelerates gas, converting radiation energy back to gas kinetic energy. In contrast, lower mass fallback rates usually yield more optically-thin downstream gas, where radiation diffuses out more easily, leading to higher luminosity and net radiative efficiency.
When the mass fallback rate and collision radius are fixed, the smaller collision angle usually produces less radiation from the collision, resulting in lower radiation pressure. This can lead to more optically-thin downstream gas, where radiation diffusion is enhanced. Due to the competing effects from the kinetic energy dissipation at the collision and downstream gas optical depth, A122Edd1 and A90Edd1 yield similar radiative efficiency despite the different collision angle. The radiative efficiency seems less sensitive to the collision radius. A122Edd1 and A122R95Edd1 shows similar shock structure at the collision and downstream gas distribution, resulting similar radiative efficiency.
(3) Radiation Driven Outflow: In the simulations, when the mass fallback rate is Eddington, the radiation pressure can accelerates gas to form expanding optically-thick outflow, making mass of gas unbound. The unbound gas is preferentially propagating off the orbital plane, with an order-of-magnitude radial velocity relative to the collision point.
The collision largely redistributes downstream gas specific angular momentum, resulting highly aspherical outflow. In A122Edd1, A122Edd10, A122R95Edd1, the outflow has an approximately conical geometry. Within the cone, the density profile roughly follows , and gas moves radially away from the collision point with velocity. In A90Edd1 and A122Edd001 show more anisotropic morphology of the outflow, where a majority of gas is within a stream-structure bent towards the black hole. The outflow morphology seems to show a potential trend from stream-structure to conical-geometry as radiation pressure increases. In all simulations, the anisotropy of downstream gas leads to non-negligible radiative diffusion, and the outflow expansion is not strictly adiabatic.
(4) Photosphere Evolution: We estimate photosphere along the line-of-sight towards the collision region. We find that the stream-stream collision is able to expand by one or two orders of magnitude, resulting photosphere. The average gas temperature at is usually a few K. The estimated photosphere temperature is generally consistent with (Figure 16, Figure 19). These findings suggest that the stream-stream collision provides a promising mechanism to drive pre-peak photospheric evolution, and produces photosphere size consistent with optical observations.
The anisotropic outflows formed in our simulations may lead to inclination-dependent photospheric properties. For example, downstream gas could be noticeably more optically-thin outside the cone-like outflow in some runs. In other simulations, the outflow is also usually preferentially launched in some directions instead of expanding spherically relative to the collision point.
Caveats Our local calculation domain is optimized for resolving the collision shock and tracking gas motion in the net momentum direction, but the long-term outflow evolution and photosphere in and directions can be beyond the calculation domain. Studying the system in a global domain will be the focus of our future work. When modeling the streams, we ignored the effect of self-gravity (Guillochon et al., 2014; Coughlin et al., 2016), the debris energy distribution (Spaulding & Chang, 2021), or magnetic fields (Guillochon & McCourt, 2017; Bonnerot et al., 2017) on the stream structure. When modeling the black hole, we adopt an approximate gravity description best suited to a spin-less black hole. The spin can significantly change the stream orbit, resulting vertical offset between the streams and potential modifications to returning stream width (Guillochon & Ramirez-Ruiz, 2015; Hayasaki et al., 2016; Batra et al., 2023). Jiang et al. (2016) showed that the luminosity produced by the stream-stream collisions will be suppressed by the vertical offset if both stream are thin. Jankovič et al. (2023) explored the spin-induced collision angle modification and vertical offset, and found aspherical downstream gas can also be launched due to offsetting collision, potentially leading to similar enhanced radiation diffusion in postshock gas. We also fix the mass injection rate in the simulation, but we show that the outflow optical depth and potential photosphere property can change with mass fallback rate. Including the time-dependence of the mass fallback rate and potential pre-peak emission variability is also an interesting focus for future work.
Appendix A Gravitational Acceleration
We note the variables in the coordinates relative to the black hole with subscript 1 (the black hole centered frame). According to Tejeda & Rosswog (2013), the and gravitational accelerations in the directions are:
| (A1) | |||
| (A2) |
where is gravitational constant and is the mass of black hole. are the coordinate with respect to the black hole, are the corresponding first derivatives, are the corresponding second derivatives .
To calculate the gravitational accelerations relative to the origin, first we obtain the coordinates and velocities , then transform them into Cartesian coordinates by
| (A3) | |||
| (A4) | |||
| (A5) | |||
| (A6) |
Next, we transform the positions and velocities to the black hole centered frame by:
| (A7) | |||
| (A8) |
From the Cartesian coordinate positions and velocities, the spherical polar coordinate positions and velocities are:
| (A9) | |||
| (A10) |
Inserting Equation A9 and Equation A10 into Equation A1 and Equation A2, we can get the accelerations and coordinate derivatives in the black hole centered frame. The acceleration in the black hole centered frame and the accelerations in our domain (relative to the origin) are the same in Cartesian coordinates, so
| (A11) | |||
| (A12) | |||
| (A13) |
Accordingly, the accelerations in directions can be obtained from the Cartesian accelerations
| (A14) | |||
| (A15) | |||
| (A16) |
In Equation 2, 3, the gravitational acceleration refers to .
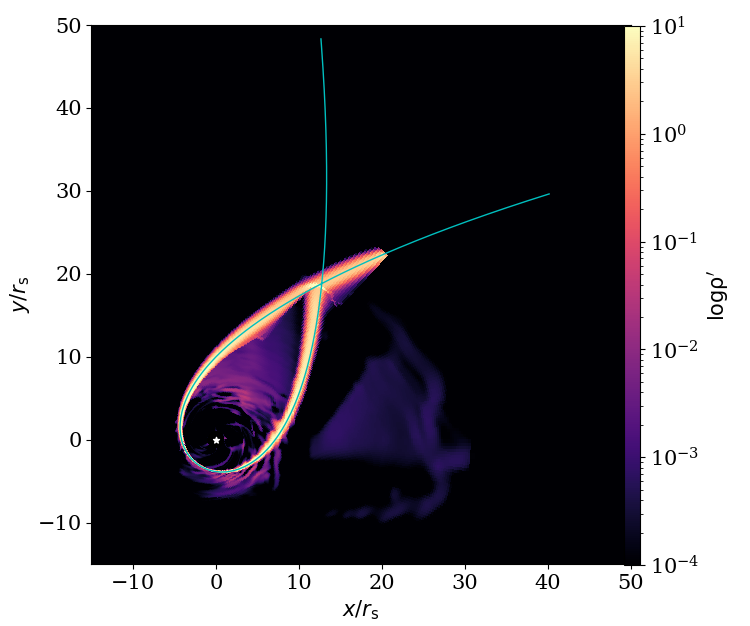
In order to verify the gravity implementation, we compared the stream trajectory before stream-stream collision with the ballistic trajectory integrated according to Equation A2 in Figure 21. Before the collision, gravity dominates the stream momentum and energy source. In the local simulations reported in this paper, the stream accurately follows the ballistic trajectory before collision, showing that the gas indeed is steered by gravity.
In addition to the reported simulations, we also show the gas trajectory before the stream-stream collision in a test global calculation. The test simulation is performed with the same equations and scaling as listed in Section 2. However, instead of injecting streams at direction boundaries, we inject gas at with velocity . The stream density is also calibrated to , with initial temperature K. The test calculation has spherical polar coordinate domain of . The root level is also resolved with cells. Three levels of static mesh refinement is applied to the region of in direction. With this set-up, we cannot resolve the stream scale height at the injection site, according to estimation in Section 2. At the stream injection site, the stream cross-section is about times larger than in the local simulations.
Figure 21 shows the -plane gas density snapshot at , the cyan solid line shows the same orbit we adopt in the reported local simulations. The gas stream follows the ballistic trajectory well before collision, and is able to reproduce the collision angle and radius when intersecting with itself. The slight deviation from the ballistic trajectory after the pericenter is due to the slight angular momentum dissipation due to radiation force in the pericenter. We will elaborate the set-up detail and pursue further studies with similar global set-up in a subsequent paper.
Appendix B Resolution Study
In order to understand better how resolution affects the radiation mediated shock at stream-stream collision site, Figure 22 shows the gas and radiation profile along the two streams. In the left panel, we show the gas density snapshot for our fiducial resolution of A122Edd1, the black solid lines are part of the ballistic trajectory shown in Figure 2. It also shows that before the collision, the radiation energy and thermal energy are small compared to stream kinetic energy.
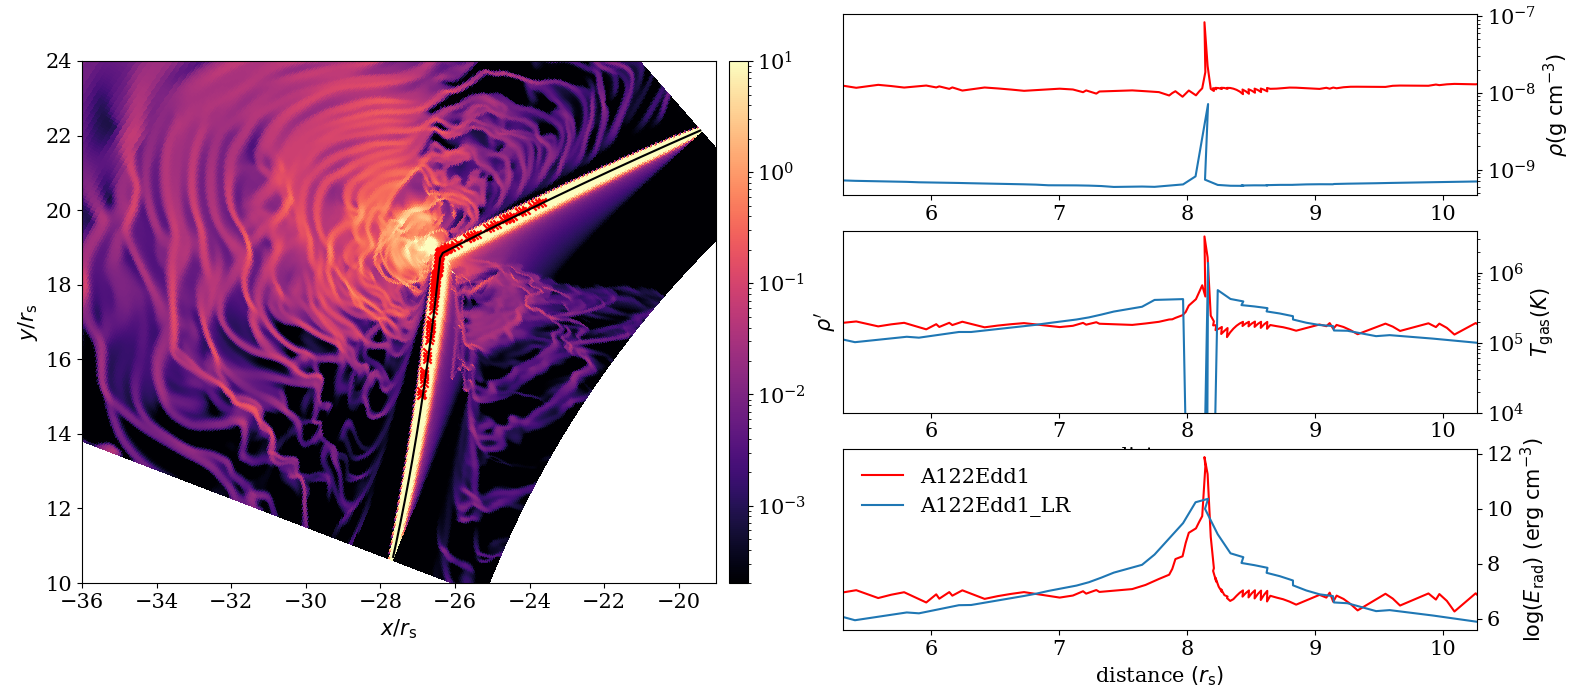
Along the stream, we sample some data points (as shown in the red crosses) to study gas properties. From top to botoom, right panels in Figure 22 show the gas density, gas temperature, and radiation energy density as a function of distance to the stream injection site at the left direction boundary. The blue lines are for A122Edd_LR and red lines are for A122Edd. The gas density is lower in the low resolution simulation due to the larger stream cross-section. The peak radiation energy density in A122Edd_LR at the shock, however, is about two orders of magnitude lower than in A122Edd, suggesting that less kinetic energy is converted to radiation energy at the shock. The lower efficiency is likely due to both the under-resolved shock and the lower local optical depth in A122Edd_LR.
We perform the simulations with the resolution specified in Section 2, where the streams before collision are resolved with five levels of SMR and the shock region is resolved with six levels of SMR, and the radiation field is resolved with 48 angles. In the following resolution study, we present two more simulations: A122Edd_R45 and A122Edd_R45_N80. Both simulations are with lower spatial resolution where the streams before collision are resolved with four levels of SMR and the shock region is resolved with five levels of SMR. However, we set angles per octant in A122Edd_R45_N80, so there are angles in total.
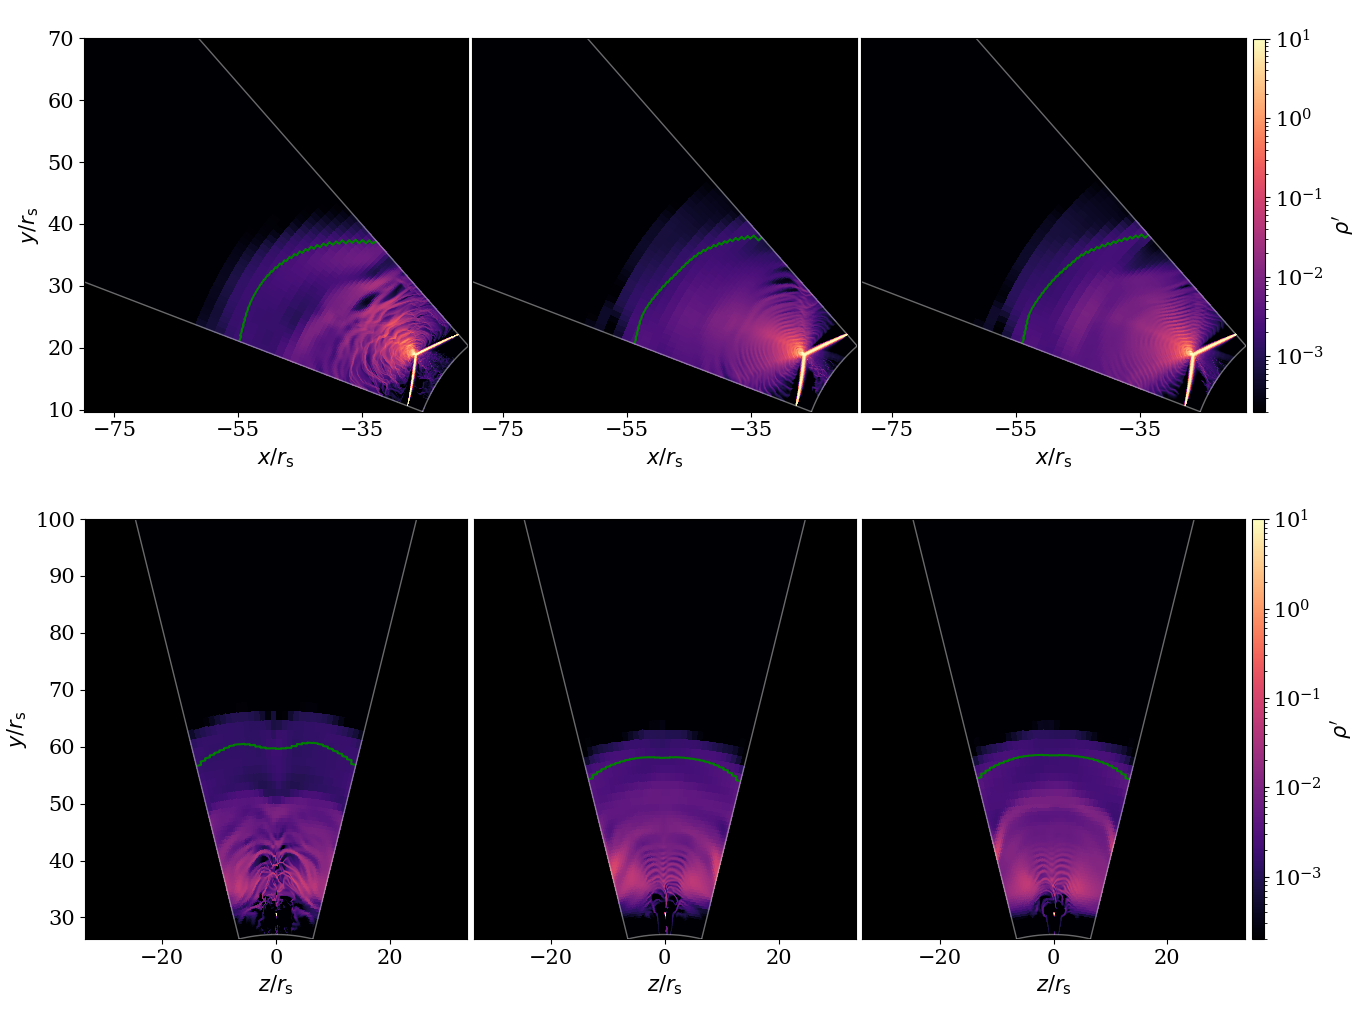
Figure 23 compares density snapshots of these three simulations on different planes. The overall gas density distribution are similar. The lower spatial resolution (compare the second column to the first column) simulations produce less structure after the collision, but did not significantly change the photospheric radius. Increasing the number of discretization angles (compare the second column and the third column) in the radiation field has a only weak effect on the morphology of downstream gas.
References
- Andalman et al. (2022) Andalman, Z., Liska, M., Tchekhovskoy, A., Coughlin, E., & Stone, N. 2022, AAS/High Energy Astrophysics Division, 54, 206
- Batra et al. (2023) Batra, G., Lu, W., Bonnerot, C., & Phinney, E. S. 2023, Monthly Notices of the Royal Astronomical Society, 520, 5192
- Ben-Ami et al. (2022) Ben-Ami, S., Shvartzvald, Y., Waxman, E., et al. 2022, in Space Telescopes and Instrumentation 2022: Ultraviolet to Gamma Ray, Vol. 12181, SPIE, 13–23
- Bonnerot & Lu (2022) Bonnerot, C., & Lu, W. 2022, Monthly Notices of the Royal Astronomical Society, 511, 2147
- Bonnerot et al. (2021) Bonnerot, C., Lu, W., & Hopkins, P. F. 2021, Monthly Notices of the Royal Astronomical Society, 504, 4885
- Bonnerot et al. (2022) Bonnerot, C., Pessah, M. E., & Lu, W. 2022, The Astrophysical Journal Letters, 931, L6
- Bonnerot et al. (2017) Bonnerot, C., Price, D. J., Lodato, G., & Rossi, E. M. 2017, Monthly Notices of the Royal Astronomical Society, 469, 4879
- Bonnerot & Stone (2021) Bonnerot, C., & Stone, N. 2021, Space Science Reviews, 217, 1
- Bricman & Gomboc (2020) Bricman, K., & Gomboc, A. 2020, The Astrophysical Journal, 890, 73
- Chan et al. (2021) Chan, C.-H., Piran, T., & Krolik, J. H. 2021, ApJ, 914, 107, doi: 10.3847/1538-4357/abf0a7
- Coughlin (2023) Coughlin, E. R. 2023, Monthly Notices of the Royal Astronomical Society, stad1347
- Coughlin & Begelman (2014) Coughlin, E. R., & Begelman, M. C. 2014, The Astrophysical Journal, 781, 82
- Coughlin et al. (2016) Coughlin, E. R., Nixon, C., Begelman, M. C., & Armitage, P. J. 2016, Monthly Notices of the Royal Astronomical Society, 459, 3089
- Curd (2021) Curd, B. 2021, Monthly Notices of the Royal Astronomical Society, 507, 3207
- Dai et al. (2015) Dai, L., McKinney, J. C., & Miller, M. C. 2015, The Astrophysical Journal Letters, 812, L39
- Dai et al. (2018) Dai, L., McKinney, J. C., Roth, N., Ramirez-Ruiz, E., & Miller, M. C. 2018, The Astrophysical Journal Letters, 859, L20
- Davis et al. (2012) Davis, S. W., Stone, J. M., & Jiang, Y.-F. 2012, The Astrophysical Journal Supplement Series, 199, 9
- Dittmann (2022) Dittmann, A. J. 2022, Monthly Notices of the Royal Astronomical Society, 511, 3408
- Evans & Kochanek (1989) Evans, C. R., & Kochanek, C. S. 1989, The Astrophysical Journal, 346, L13
- Eyles-Ferris et al. (2022) Eyles-Ferris, R., Starling, R., O’Brien, P., Nixon, C., & Coughlin, E. R. 2022, Monthly Notices of the Royal Astronomical Society, 517, 6013
- Gafton & Rosswog (2019) Gafton, E., & Rosswog, S. 2019, Monthly Notices of the Royal Astronomical Society, 487, 4790
- Gehrels & Cannizzo (2015) Gehrels, N., & Cannizzo, J. 2015
- Gezari (2021) Gezari, S. 2021, Annual Review of Astronomy and Astrophysics, 59, 21
- Goldtooth et al. (2023) Goldtooth, A., Zabludoff, A. I., Wen, S., et al. 2023, Publications of the Astronomical Society of the Pacific, 135, 034101
- Greiner et al. (2000) Greiner, J., Schwarz, R., Zharikov, S., & Orio, M. 2000, arXiv preprint astro-ph/0009430
- Grupe et al. (1999) Grupe, D., Thomas, H.-C., & Leighly, K. 1999, arXiv preprint astro-ph/9909101
- Guillochon et al. (2014) Guillochon, J., Manukian, H., & Ramirez-Ruiz, E. 2014, The Astrophysical Journal, 783, 23
- Guillochon & McCourt (2017) Guillochon, J., & McCourt, M. 2017, The Astrophysical Journal Letters, 834, L19
- Guillochon & Ramirez-Ruiz (2015) Guillochon, J., & Ramirez-Ruiz, E. 2015, The Astrophysical Journal, 809, 166
- Hambleton et al. (2022) Hambleton, K. M., Bianco, F. B., Street, R., et al. 2022, arXiv preprint arXiv:2208.04499
- Hayasaki et al. (2016) Hayasaki, K., Stone, N., & Loeb, A. 2016, Monthly Notices of the Royal Astronomical Society, 461, 3760
- Hung et al. (2017) Hung, T., Gezari, S., Blagorodnova, N., et al. 2017, The Astrophysical Journal, 842, 29
- Iglesias & Rogers (1996) Iglesias, C. A., & Rogers, F. J. 1996, The astrophysical journal, 464, 943
- Jankovič et al. (2023) Jankovič, T., Bonnerot, C., & Gomboc, A. 2023, Spin-induced offset stream self-crossing shocks in tidal disruption events. https://arxiv.org/abs/2303.16230
- Jiang (2021) Jiang, Y.-F. 2021, The Astrophysical Journal Supplement Series, 253, 49
- Jiang et al. (2016) Jiang, Y.-F., Guillochon, J., & Loeb, A. 2016, The Astrophysical Journal, 830, 125
- Jiang et al. (2014) Jiang, Y.-F., Stone, J. M., & Davis, S. W. 2014, The Astrophysical Journal, 796, 106
- Kara et al. (2018) Kara, E., Dai, L., Reynolds, C., & Kallman, T. 2018, Monthly Notices of the Royal Astronomical Society, 474, 3593
- Kesden (2012) Kesden, M. 2012, Physical Review D, 86, 064026
- Kim et al. (1999) Kim, S. S., Park, M.-G., & Lee, H. M. 1999, The Astrophysical Journal, 519, 647
- Kochanek (2016) Kochanek, C. 2016, Monthly Notices of the Royal Astronomical Society, 458, 127
- Kochanek et al. (2017) Kochanek, C., Shappee, B., Stanek, K., et al. 2017, Publications of the Astronomical Society of the Pacific, 129, 104502
- Komossa (2015) Komossa, S. 2015, Journal of High Energy Astrophysics, 7, 148
- Law-Smith et al. (2020) Law-Smith, J. A., Coulter, D. A., Guillochon, J., Mockler, B., & Ramirez-Ruiz, E. 2020, The Astrophysical Journal, 905, 141
- Lin et al. (2011) Lin, D., Carrasco, E. R., Grupe, D., et al. 2011, The Astrophysical Journal, 738, 52
- Lin et al. (2018) Lin, D., Strader, J., Carrasco, E. R., et al. 2018, Monthly Notices of the Royal Astronomical Society, 474, 3000
- Liptai et al. (2019) Liptai, D., Price, D. J., Mandel, I., & Lodato, G. 2019, arXiv preprint arXiv:1910.10154
- Lodato et al. (2009) Lodato, G., King, A., & Pringle, J. 2009, Monthly Notices of the Royal Astronomical Society, 392, 332
- Lodato & Rossi (2011) Lodato, G., & Rossi, E. M. 2011, Monthly Notices of the Royal Astronomical Society, 410, 359
- Loeb & Ulmer (1997) Loeb, A., & Ulmer, A. 1997, The Astrophysical Journal, 489, 573
- Lu & Bonnerot (2020) Lu, W., & Bonnerot, C. 2020, Monthly Notices of the Royal Astronomical Society, 492, 686
- MacLeod et al. (2012) MacLeod, M., Guillochon, J., & Ramirez-Ruiz, E. 2012, The Astrophysical Journal, 757, 134
- Metzger (2022) Metzger, B. D. 2022, The Astrophysical Journal Letters, 937, L12
- Metzger & Stone (2016) Metzger, B. D., & Stone, N. C. 2016, Monthly Notices of the Royal Astronomical Society, 461, 948
- Miller (2015) Miller, M. C. 2015, The Astrophysical Journal, 805, 83
- Mockler et al. (2019) Mockler, B., Guillochon, J., & Ramirez-Ruiz, E. 2019, The Astrophysical Journal, 872, 151
- Phinney (1989) Phinney, E. 1989, in Symposium-International Astronomical Union, Vol. 136, Cambridge University Press, 543–553
- Piran et al. (2015) Piran, T., Svirski, G., Krolik, J., Cheng, R. M., & Shiokawa, H. 2015, The Astrophysical Journal, 806, 164
- Ramirez-Ruiz & Rosswog (2009) Ramirez-Ruiz, E., & Rosswog, S. 2009, The Astrophysical Journal, 697, L77
- Rees (1988) Rees, M. J. 1988, Nature, 333, 523
- Rosswog et al. (2009) Rosswog, S., Ramirez-Ruiz, E., & Hix, W. R. 2009, The Astrophysical Journal, 695, 404
- Roth et al. (2016) Roth, N., Kasen, D., Guillochon, J., & Ramirez-Ruiz, E. 2016, The Astrophysical Journal, 827, 3
- Rybicki & Lightman (1986) Rybicki, G. B., & Lightman, A. P. 1986, Radiative Processes in Astrophysics
- Ryu et al. (2020) Ryu, T., Krolik, J., & Piran, T. 2020, The Astrophysical Journal, 904, 73
- Sadowski et al. (2016) Sadowski, A., Tejeda, E., Gafton, E., Rosswog, S., & Abarca, D. 2016, Monthly Notices of the Royal Astronomical Society, 458, 4250
- Saxton et al. (2012) Saxton, R., Read, A., Esquej, P., et al. 2012, Astronomy & Astrophysics, 541, A106
- Shiokawa et al. (2015) Shiokawa, H., Krolik, J. H., Cheng, R. M., Piran, T., & Noble, S. C. 2015, The Astrophysical Journal, 804, 85
- Spaulding & Chang (2021) Spaulding, A., & Chang, P. 2021, Monthly Notices of the Royal Astronomical Society, 501, 1748
- Steinberg & Stone (2022) Steinberg, E., & Stone, N. C. 2022, arXiv preprint arXiv:2206.10641
- Stone & Metzger (2016) Stone, N. C., & Metzger, B. D. 2016, Monthly Notices of the Royal Astronomical Society, 455, 859
- Strubbe & Quataert (2009) Strubbe, L. E., & Quataert, E. 2009, Monthly Notices of the Royal Astronomical Society, 400, 2070
- Tejeda & Rosswog (2013) Tejeda, E., & Rosswog, S. 2013, Monthly Notices of the Royal Astronomical Society, 433, 1930
- Thomsen et al. (2022) Thomsen, L. L., Kwan, T. M., Dai, L., et al. 2022, The Astrophysical Journal Letters, 937, L28
- Ulmer (1999) Ulmer, A. 1999, The Astrophysical Journal, 514, 180
- Van Velzen et al. (2011) Van Velzen, S., Farrar, G. R., Gezari, S., et al. 2011, The Astrophysical Journal, 741, 73
- Van Velzen et al. (2021) Van Velzen, S., Gezari, S., Hammerstein, E., et al. 2021, The Astrophysical Journal, 908, 4
- Wevers et al. (2017) Wevers, T., van Velzen, S., Jonker, P. G., et al. 2017, Monthly Notices of the Royal Astronomical Society, 471, 1694
- Wevers et al. (2019) Wevers, T., Pasham, D., van Velzen, S., et al. 2019, Monthly Notices of the Royal Astronomical Society, 488, 4816